Abstract
Studies on harnessing solidified carbon dioxide (SCO2) for municipal sewage sludge (MSS) pre-treatment have been conducted exclusively in batch reactors. This makes it difficult to accurately assess how long-term SCO2 treatment affects anaerobic digestion (AD) conditions and performance. The aim of our study was to evaluate the effect of long-term MSS pre-treatment with SCO2 on AD conditions, anaerobic bacterial community, and biogas composition and yields. The presented experiments are the first studies on the effect of pre-treatment with SCO2 on the efficiency of AD of MSS in continuous reactors. So far, the impact of the organic load rate (OLR) on the efficiency of MSS methane fermentation has not been assessed, which is also a novelty of the conducted research. The AD process was conducted in continuous-stirred, continuous-flow anaerobic with an active volume of 20 dm3. The digestion process was run at 38 ± 1 °C. The experiment was divided into two stages. Raw (non-pretreated) MSS was used in stage 1, whereas the MSS used in stage 2 was pre-treated with SCO2. The SCO2/MSS ratio was 1:3. Each stage was sub-divided into four variants, with different levels of the OLR ranging from 2.0 to 5.0 gCOD/dm3·day. Pre-treatment with SCO2 was found to improve AD performance at an OLR of 3.0–4.0 gVS/dm3·day. The 3.0 gVS/dm3·day variant offered the best biogas production performance—both daily (29 ± 1.3 dm3/day) and per VS added (0.49 ± 0.02 dm3/gVS)—as well as the highest CH4 content in the biogas (70.1 ± 1.0%). In this variant, the highest energy output effect of 187.07 ± 1.5 Wh/day was obtained. The SCO2 pre-treatment was not found to change the pH, FOS/TAC, or the anaerobic bacterial community composition. Instead, these variables were mainly affected by the OLR. Our study shows that MSS pre-treatment with SCO2 at a SCO2/MSS ratio of 0.3 (by volume) significantly improves AD performance in terms of methane production and feedstock mineralization. The pre-treatment was found to have no negative effect on the long-term continuous operation of the reactor.
1. Introduction
Anaerobic digestion (AD) is a method commonly used for treating municipal sewage sludge (MSS), offering technological, environmental, and commercial benefits [1,2]. AD enables the controlled mineralization of labile organic matter, reduces putrescibility, mitigates odor nuisance, minimizes the sanitary risk of MSS, reduces MSS mass, and improves dewaterability [3]. There are two end products of AD. The first is stabilized sludge, which can be used in agriculture, environmental improvement, or land reclamation (due to its fertilizing potential). The other is biomethane, which is fed into gas pipelines, used as fuel for vehicles, or combusted for heat and electricity in cogeneration systems [4].
AD is a well-established technology, highly optimized on the basis of extensive data from experimental research and commercial deployment [5,6,7]. According to many researchers and operators, the prerequisite to improving the AD process and its performance lies in implementing effective and commercially/environmentally informed methods of MSS pre-treatment [8,9,10]. Many such methods have been identified and tested, including hydrothermal depolymerization, ultrasonic disintegration, hydrodynamic cavitation, as well as treatments using acids, bases, strong oxidizing agents, enzymes, and other biologically active substances [11,12,13]. Though pre-treatments have seen substantial improvements over time, and many have been deployed in large scale, new, competitive solutions are still being sought that would combine commercial viability with environmental benefits.
Studies, reviews, and experimental work conducted so far point to solid carbon dioxide (SCO2) as a promising option for MSS pre-treatment [14,15]. The ability to harvest SCO2 via the biogas conditioning/upgrading process greatly bolsters the attractiveness and potential of the technology, bringing it fully in line with material recycling, greenhouse gas reduction, climate change mitigation, and the principles of a circular economy [16,17,18]. SCO2 can damage cell walls by way of ice crystal formation in the microbe-growing medium and in the cytoplasm [19]. This leads to the destruction of the sludge biomass and dissolution of organic matter, increasing its availability to anaerobic bacteria and improving AD performance [20]. Using SCO2 for sludge disintegration has been shown to markedly increase soluble nutrient levels (orthophosphates (P-PO4), ammonia nitrogen (N-NH4)) and organic content (total organic carbon (TOC), chemical oxygen demand (COD), volatile fatty acid (VFA)) [21], improve biogas output by up to 40% and more [14], increase methane production [14,15], and provide commercial benefits if certain conditions are met [14,20].
Research so far on harnessing SCO2 for MSS pre-treatment has focused exclusively on fine-tuning and optimizing SCO2 doses for the best biogas/methane yields [14,21,22]. All such experiments have been performed exclusively in batch reactors. The data and results from respirometric studies are limited and mainly focused on the biogas output of the tested process variants. This alone cannot give a full and accurate picture of how long-term SCO2 treatment affects anaerobic digestion conditions, trends in reactor physicochemical parameters, the evolution of anaerobic bacteria composition, and performance over time [20]. Studies in continuous-flow reactors can reproduce the conditions and process parameters in commercial-scale plants and improve the state of the technology—a vital step towards increasing the applicability of the process [23].
The aim of the present study was to evaluate the effect of long-term MSS pre-treatment with SCO2 on anaerobic digestion conditions and trends in reactor physicochemical parameters, anaerobic bacterial community composition over time, biodegradability, production performance, biogas composition, and digestate profile. The experiments focused on comparative AD analysis of the SCO2 pre-treated MSS with methane fermentation of the raw MSS. The second analyzed variable affecting AD efficiency in continuous fermentation reactors was the applied organic load rate (OLR) and the hydraulic retention time (HRT) as a related parameter.
2. Materials and Methods
2.1. Experimental Design
The experiment was divided into two stages, with different approaches to MSS pre-treatment prior to AD. Raw (non-pretreated) MSS was used in stage 1 (S1), whereas the MSS used in stage 2 (S2) was pre-treated with SCO2 prior to the AD process. The SCO2/MSS ratio was 1:3. SCO2 doses were selected based on literature data [21] and our previous optimization studies in batch reactors [14]. Each stage was sub-divided into four variants with different levels of interrelated AD parameters for OLR and HRT. Variant 1 (V1): OLR = 2.0 gCOD/dm3·d, HRT = 21 days. Variant 2 (V2): OLR = 3.0 gCOD/dm3·d, HRT = 14 days. Variant 3 (V3) = 4.0 gCOD/dm3·d, HRT = 11 days. Variant 4 (V4) = 5.0 gCOD/dm3·d, HRT = 9 days.
2.2. Materials
The thickened MSS was sourced from a sludge processing line of the mechanical-biological municipal sewage treatment plant in Bialystok, Poland (53.16903 N, 23.08705 E). The plant uses a traditional activated sludge process with enhanced nutrient removal, working at a capacity of 100,000 m3 of wastewater/day. The anaerobic reactors were inoculated with anaerobic sludge (AS) from an enclosed 7300 m3 digester of the Bialystok treatment plant (T = 35 °C, OLR = 2.0 gVS/dm3·day, HRT = 21 days). The profiles of the raw MSS (S1), the SCO2-treated MSS (S2), and the AS inoculum are presented in Table 1.

Table 1.
Characteristics of the sludge types used in the experiment.
The SCO2 used in the experiments was in the form of granules 3.0 ± 1.0 mm in diameter (Sopel Ltd., Bialystok, Poland). SCO2 was produced from liquid CO2 using a Dryice—ICE Peletizer IP-100H (ICS, Považská Bystrica, Slovakia). This type of SCO2 sublimates at temperatures exceeding −56.4 °C and pressures below 5.13 atm. Under atmospheric air pressure, sublimation occurs at −78.5 °C (enthalpy = 573 kJ/kg), making SCO2 3.3 times more efficient than water ice of the same volume. The SCO2 is a natural, food-contact product, odorless, tasteless, non-poisonous, and non-combustible.
2.3. Research Station
MSS pre-treatment with SCO2 was performed in glass, open, continuous-stirred reactors (JLT 6, VELP Scientifica, Milano, Italy). The reactors were first filled with raw MSS having a temperature of 20 °C MSS, which was then amended with SCO2. The mixture was stirred at 50 rpm for 20 min. The samples were left until the SCO2 was fully sublimated out, then, after reaching 20 °C, they were subjected to AD.
The AD process was conducted in continuous-stirred, continuous-flow anaerobic reactors (Gunt CE 702, Hamburg, Germany) (Figure 1) [24]. Total/active volume was 30 dm3/20 dm3, respectively. The digestion process was run at 38 ± 1 °C. The reactor was fitted with detectors, a temperature stabilization system, a stirring system with a four-blade mechanical agitator rotating at 100 rpm, a feedstock in/digestate out pump, and a biogas outflow meter. Feedstock input and digestate discharge occurred daily. The OLR and HRT values used depended on the variant of the experiment. Each variant was continued for three times the hydraulic retention time. Analyses were conducted every 4 days.
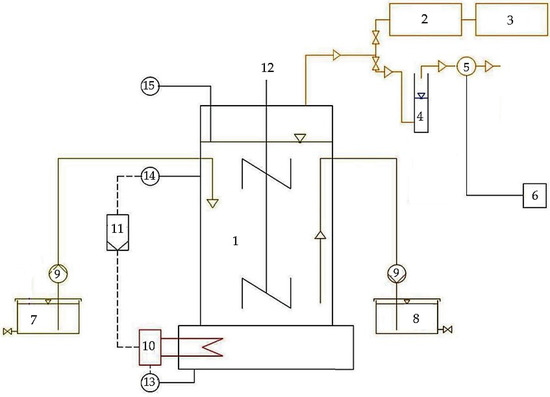
Figure 1.
Schematic of the digester model: 1—digester, 2—biogas tank, 3—biogas analyzer, 4—liquid fuse, 5—biogas flow meter, 6—computer, 7—feedstock tank, 8—digested sludge tank, 9—pump, 10—heater, 11—temperature controller, 12—stirrer, 13—thermal protection, 14—temperature measurement, 15—pH measurement.
2.4. Analytical Methods
TS in the MSS was determined by drying at 105 °C. VS was quantified by combustion at 550 °C according to PN-EN 15935:23022-01 [25]. TC and TOC were determined by high temperature decomposition with infrared detection in a multi NC 3100 analyzer (Analytik Jena, Jena, Germany). Soluble COD, TN, N-NH4, and P-PO4 were determined by the spectrophotometric method after prior mineralization, using a Hach DR6000 spectrometer (Hach, Loveland, OH, USA) with the wavelength for COD set at 620 nm, for nitrogen set at 655 nm, and for phosphorus set at 700 nm. Supernatant was extracted via centrifugation of the MSS at 5000 rpm for 10 min (MPW-251, Med. Instruments, Warsaw, Poland). The potentiometric method was used to determine pH. Biogas was analyzed for composition in a DP-28BIO gas analyzer (Nanosens, Wysogotowo, Poland).
Anaerobic microbes were identified using FISH with DAPI counterstain and Image Processing and Analysis in Java (ImageJ, LOCI, University of Wisconsin, Madison, WI, USA) [26]. Examinations were performed under an epifluorescent microscope (Nikon, Tokyo, Japan). Hybridization was performed using molecular probes for EUB338 Bacteria, ARC915 Archaea, MSMX860 Methanosarcinaceae, and MX825 Methanosaeta. Samples for taxonomic analysis were collected at the end of each experimental variant.
2.5. Formulas and Calculations
The digestion coefficient (portion digested), i.e., the ratio of the organic VS load removed in the reactor to the VS load fed into the reactor, was determined using the following equation:
where —digestion coefficient, %; —concentration of organic matter in the influent, g/dm3; —concentration of organic matter in the digestate, g/dm3; —influent density, g/cm3; —digestate density, g/cm3; —daily volume of feedstock (in), cm3/day; —daily volume of digestate (out), cm3/day;
Biogas/CH4 production per VS load was calculated as:
Biogas/CH4 production per VS load in the influent was calculated using the following equation:
where —biogas production per VSrem, cm3/gVSrem; —biogas production per VS in the influent, cm3/gVSin; —volume of biogas/CH4 produced per influent load, cm3/day; —single load of influent (by volume), cm3; —specific post-AD digestate out (by volume), cm3.
The energy output generated from methane production was calculated using the following equation:
where Eout—energy output, Wh/day; MMSS—mass of MSS, gVS/day; YMethane—methane yield, dm3/gVS; CVMethane—calorific value of methane, Wh/dm3.
2.6. Statistical Methods
The research was carried out in three replications. Statistical analysis was carried out using the Statistica 13.3 PL package (Statsoft, Inc., Tulsa, OK, USA). The Shapiro–Wilk test was used to verify the hypothesis regarding the distribution of the researched variables. ANOVA was used to establish the significance of differences between variances. Levene’s test was used to check the homogeneity of variances in groups, whereas Tukey’s HSD was used to determine the significance of differences between the variables. Results were considered significant at α = 0.05.
3. Results and Discussion
3.1. Dissolved Phase
The SCO2 pre-treatment increased the levels of soluble COD, TOC, P-PO43−, and N-NH4+ in the MSS. COD in the non-conditioned and conditioned MSS supernatants was 115 ± 10 mg/dm3 and 383 ± 14 mg/dm3, respectively. Soluble TOC also responded to the pre-treatment, rising from 34.30 ± 3.21 to 127.96 ± 2.25 mg/dm3. The MSS supernatant contained 60.33 ± 2.43 mgP-PO43−/dm3 and 83.25 ± 10.51 mgN-NH4+/dm3 when no pre-treatment was used. The application of SCO2 boosted these metrics to 83.25 ± 10.51 mg P-PO43−/dm3 and 263 ± 14 mgN-NH4+/dm3. This increase was probably caused by disruption of MSS structures and the subsequent degradation of individual microbe cells [27]. Research has shown that the SCO2-induced damage of MSS cell structures results in increased concentrations of soluble COD, ammonia nitrogen, orthophosphates, proteins, and molecular material in the supernatant [14]. The increased ammonia nitrogen and orthophosphate levels may also be attributable to the decomposition of nitrogen and phosphorous organics by the hydrolytic action of enzymes (contained in the microbial protoplasts and released upon the destruction of microbial cells structures by SCO2) [28].
Zawieja (2018) [15] found similarly significant increases in COD and TOC concentrations in the supernatant after SCO2 pre-treatment. The non-pretreated MSS contained 110 mgO2/dm3 COD and 26 mg/dm3 TOC, compared to 296 mgO2/dm3 COD and 78 mg/dm3 TOC determined after pre-treatment at an SCO2/MSS ratio of 0.35/1.0 [15]. In another study, the same author (2019) [22] also observed increased N-NH4+ concentration in the supernatant—from 43 mg/dm3 in raw MSS to 102 mg/dm3 at a SCO2/MSS ratio of 0.75/1.0 [22]. Machnicka et al. (2019) [29] corroborated these findings, obtaining 63 mgO2/dm3 COD in non-treated MSS, which rose to 205 mgO2/dm3 after pre-treatment with SCO2 at a SCO2/MSS ratio of 0.25/1 and to 889 mgO2/dm3 at a SCO2/MSS ratio of 1:1 [29].
3.2. Biogas and Methane
Stage 2 (S2) performed significantly better in terms of biogas production, with the exact yields varying from variant to variant—from 20.7 ± 0.6 dm3/day (V1) to 29.1 ± 1.3 dm3/day (V2). In S1, the daily biogas yields peaked at 25.3 ± 1.3 dm3/day (V2) (Figure 2a), with the other variants producing 18.8 ± 0.9 m3/day (S1V1) and approx. 23.0 dm3/day (S1V3 and S1V4) (Figure 2a). Yields across all OLR values tested (V1–V4) in S2 averaged 25.1 ± 1.0 dm3/day, which was significantly higher than the average determined for S1 (22.6 ± 0.9 dm3/day) (2b). A similar pattern emerged for CH4. The methane fraction content peaked at 70.1 ± 1.0% in S2V2, exceeding the other experimental variants by a significant margin (Figure 3a). In S2, the CH4 content of the biogas ranged from 59.1 ± 2.2% (V4) to 65.9 ± 0.6% (V1) (Figure 3a), whereas the range for S1 was 57.4 ± 0.9% (V4) to 65.3 ± 0.6% (V1). The SCO2 pre-treatment significantly improved the biogas composition. Average CH4 content across the OLRs tested in S2 was 64.9 ± 1.4%, whereas in S1 it was at 61.8 ± 0.8% (Figure 2a). Daily CH4 production peaked at 20.4 ± 1.1 dm3 in S2V2, whereas the lowest yield wase noted at 12.4 ± 0.6 dm3/day for S1V1 (Figure 3b).
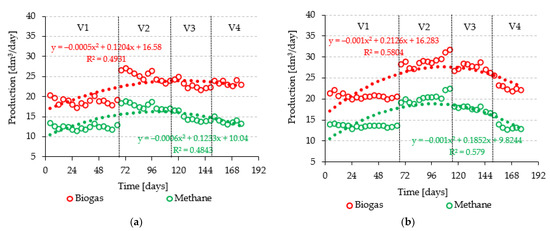
Figure 2.
Daily biogas and CH4 production over time in S1 (a) and S2 (b).
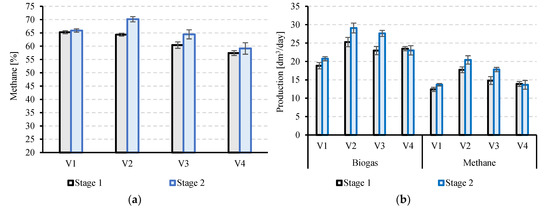
Figure 3.
CH4 content of biogas (a) and average daily biogas and CH4 production in particular experimental variants (b).
Daily biogas and CH4 yields per VSin and VSout significantly decreased as the OLR increased. In S1, biogas yields varied from between 0.47 ± 0.02 dm3/gVS and 0.74 ± 0.04 dm3/gVSremoved (V1) to 0.20 ± 0.01 dm3/gVS and 0.45 ± 0.01 cm3/gVSremoved (V4) (Figure 4a). The range for S2 was from 0.52 ± 0.01 dm3/gVS and 0.19 ± 0.01 cm3/gVSremoved (V1) to 0.77 ± 0.02 dm3/gVS and 0.39 ± 0.01dm3/gVSremoved (V4) (Figure 4b). In terms of the CH4 fraction produced, the most pronounced differences were noted in V2, with 0.52 ± 0.03 cm3/gVSremoved in S2V2 and 0.42 ± 0.02 cm3/gVSremoved in S1V2 (Figure 4a,b). The average CH4 contents show that the pre-treatment successfully boosted performance in the whole stage. The average for S1 was 0.22 ± 0.01 dm3/gVS and 0.37 ± 0.02 cm3/gVSremoved, whereas S2 produced 0.25 ± 0.01 dm3/gVS and 0.40 ± 0.02 cm3/gVSremoved (Figure 4c).
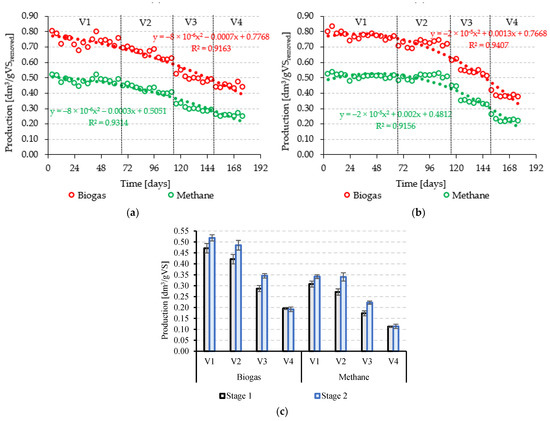
Figure 4.
Biogas and CH4 production in relation to VS removed in S1 (a) and S2 (b), with mean values in relation to VS added (c).
Other researchers have also reported that SCO2 pre-treatment significantly affects biogas production and CH4 content. The difference was the most pronounced within the OLR range of 3.0–4.0 gVS/dm3·day and extended both to the output of gas metabolites and the CH4 fraction. The study has also shown OLR to have a significant effect on these values. The highest daily yields from AD were recorded at 3.0 gVS/dm3·day (V2). S1 produced 17.7 ± 0.8 dm3 CH4/day, compared to 20.4 ± 1.1 dm3CH 4/day determined in S2.
In their review paper, Kazimierowicz and Dębowski [20] presented a summary of the studies carried out so far to assess the efficiency of biogas production from sewage sludge pre-treated with SCO2. Based on their analysis, they identified areas requiring further research. The main one is the lack of research on anaerobic digestion in continuous reactors [20]. In literature, studies have only focused on the effect of SCO2 pre-treatment of MSS on AD performed in batch reactors. As an example, Nowicka et al. (2014) [21] managed to boost biogas production by 49% using this technology [21]. Zawieja (2019) [22] employed the pre-treatment at a SCO2 to MSS ratio of 0.55/1 (by volume), producing 0.62 dm3/gVS biogas containing approx. 78% CH4 [22]. The non-pretreated MSS only yielded 0.43 dm3/gVS biogas. Evidently, biogas yield improvements were higher in batch experiments than in the present study. Many researchers have noted the relationship between the OLR and the yields of AD-produced biogas [5,30,31]. Elango et al. (2007) [30] examined the effect of different ORLs (0.5, 1.0, 2.3, 2.9, 3.5, and 4.3 gVS/dm3·day) on the AD of municipal waste mixed with municipal sewage. They achieved the maximum biogas production of 0.36 dm3/gVS·day at ORL = 2.9 gVS/dm3·day—being close to the optimal ORL level found in the present study. The methane content of the biogas ranged from 68 to 72% [30]. Researchers have pointed out that reactor overload can lead to diminished pH and the inhibition of methane-producing microbes, which are the main producers of biogas from acetic acid [32]. Hence, the OLR levels in excess of what can be absorbed by methanogens can lead to the cessation of methane production during AD, as well as to hydrogen and VFA accumulation [27]. Exemplary effects of the intensification of biogas/methane production from sewage sludge as a result of various pre-treatment methods are presented in Table 2.

Table 2.
Example effects of various methods of pre-treatment of sewage sludge before AD.
3.3. Organic Matter and Digestion Coefficient
Stage V1 and V2 produced the lowest levels of VS in the digestate. The levels for S1 were 64.6 ± 0.9% TS and 64.5 ± 0.8% TS, respectively. The S2 digestate contained 63.6 ± 0.6% TS (V1) and 63.9 ± 0.7% TS (V2) (Figure 5a). Increasing OLR to 5.0 gVS/dm3·day led to significantly higher rates of VS in the digestate, i.e., 70.2 ± 1.2% TS in S1 and 67.6 ± 1.4% TS in S2 (Figure 5a). There was a positive linear relationship between the OLR and VS removed. The biodegradation rate in S1V1 was 25.4 ± 0.2 gVS/day, which corresponded to 63.3% of the initial load (Figure 5b). Similarly, the mineralization rate in S2V1 was 67.1%, which translated to 26.8 ± 0.4 gVS removed per day (Figure 5b). At an OLR of 5.0 gVS/dm3·d (V4), the removal rates were 54.6 ± 1.2 gVS/day (43.4%) in S1 and 58.7 ± 1.3 gVS/day (47.9%) (Figure 5b). The VS mineralization rate was somewhat affected by the pre-treatment with SCO2, but OLR was the main determinant.
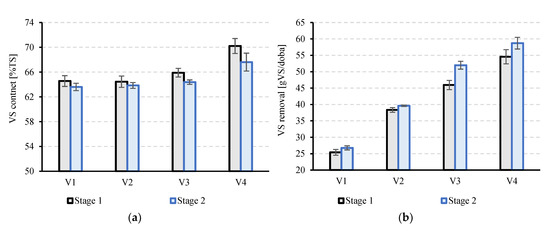
Figure 5.
VS percentage in dry mass (a) and VS removal (b) across experimental variants.
The digestion coefficient/portion digested (ηF) decreased as the OLR increased in successive experimental variants (Table 3). In S1, ηF peaked in V1 and V2 at 64.21 ± 1.2% and 64.57 ± 0.8%, respectively (Table 3). Subsequent variants of this stage showed a notable decline in ηF, with rates of 58.25 ± 1.0% in V3 and only 44.88 ± 0.8% in V4 (Table 3). On the other hand, S2 was characterized by higher ηF across all variants, ranging from 65.85 ± 1.3% in V3 to 67.75 ± 1.1% in V1 (Table 3). V4, however, marked a significant decrease in ηF, which fell to 50.87 ± 0.9% (Table 3).

Table 3.
Digestion coefficient across experimental variants.
The digestion coefficient—i.e., the organic removal rate and the final levels of organics in the digestate—is mainly shaped by the process parameters [46]. The stability of the digestate is primarily determined by OLR, HRT, and the process temperature [47]. Hydrolysis support and the pre-treatment methods also play a role [48]. A high digestion coefficient is desirable in order to reduce the environmental impact of the digestate (including putrescibility and odor emission) [49].
3.4. pH and FOS/TAC
The pH and FOS/TAC were found to correlate with the OLR. The pH showed a consistent negative correlation with organic matter levels and a positive one with HRT. Both stages showed a near-neutral pH (7.23 ± 0.04–6.96 ± 0.03) as long as OLR was maintained within 2.0–4.0 gVS/dm3·d (Figure 6a). An increase in OLR to 5.0 gVS/dm3·d triggered significant decreases in pH—6.75 ± 0.05 in S1 and 6.84 ± 0.03 in S2 (Figure 6a). Similarly, the highest tested OLR (V4) led to elevated FOS/TAC at 0.44 ± 0.02 (S1) and 0.48 ± 0.02 (S2) (Figure 6b). Such values are indicative of digester overload. The FOS/TAC ratio in variants V1–V3 ranged from 0.37 ± 0.02 to 0.43 ± 0.02 in S1 and from 0.33 ± 0.03 to 0.42 ± 0.01 in S2 (Figure 6b). In both stages, very strong positive correlations were found between the pH and biogas and methane production yields. The coefficients of determination reached R2 = 0.9765 and R2 = 0.9722 in S1 (Figure 7a,b) and R2 = 0.9601 and R2 = 0.9188 in S2 (Figure 7a,b). Similarly, very strong but negative correlations were found between FOS/TAC and biogas (R2 = 0.9287) and methane (R2 = 0.9365) yields in S1 (Figure 7c,d) and R2 = 0.9675 for biogas (Figure 7c) and R2 = 0.9316 for methane in S2 (Figure 7d).
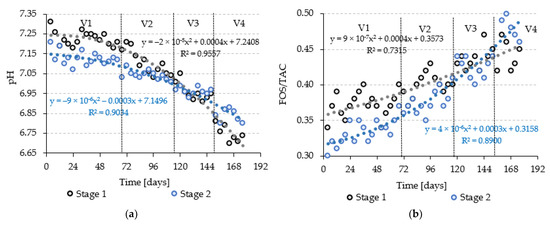
Figure 6.
Trends in pH value (a) and FOS/TAC ratio (b) throughout the experiment.
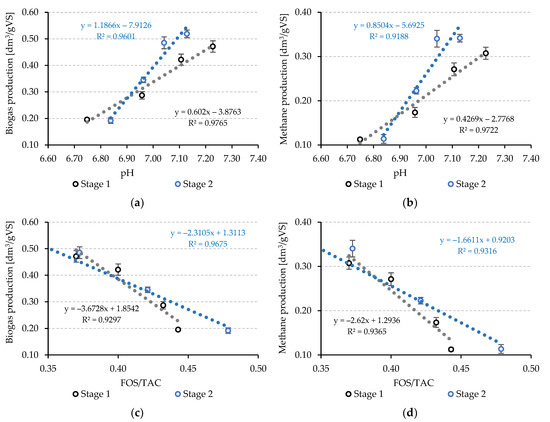
Figure 7.
Correlations between pH and the yields of biogas (a) and methane (b); as well as between FOS/TAC and the yields of biogas (c) and methane (d).
The pH value is a key determinant of stability in an anaerobic reactor [50]. An almost neutral pH in an anaerobic medium means a balance between the hydrolysis, acidic, and methanogenic phases of anaerobic conversion [51]. The pH decreases are primarily driven by the build-up of VFAs, which are produced during the acidogenesis stage [52], which may occur with too high OLRs [53]. A decreased pH results in the inhibition of the activity of methanogenic bacteria, effectively reducing pollutant removal rates and biogas production [54]. Sanchez et al. [55] have also demonstrated that increased OLR—though a possible driver of methane yields—may lead to a decreased pH and system failure due to the accumulation of VFAs and free ammonia [55]. By the same token, the FOS/TAC ratio is used as a metric of AD stability. The indicator shows the ratio of volatile organic acids to the alkaline buffer capacity [56]. In a stable AD process, the FOS/TAC falls within 0.3–0.4 [57]. On the other hand, an FOS/TAC above 0.5 indicates a reduced production of biogas associated with the lack of optimal running parameters for anaerobic microbes [56].
3.5. Bacterial Community
The composition of the anaerobic bacterial community over time was not significantly affected by the SCO2 pre-treatment. However, the abundance of methane-producing Archaea was indeed affected by the highest OLRs used in V3 and V4. With OLR at 2 to 3 gVS/dm3·day, the share of Archaea exceeded 24% in both stages (Figure 8). When the OLR range was 4 to 5 gVS/dm3·day, the proportion fell to 19–23% in S1 and 19–21% in S2 (Figure 8). Similar trends were found for Methanosarcinaceae (MSMX860). On the other hand, no relationship was found between the variant used and the abundance of Bacteria (EUB338) and Methanosaeta (MX825). The share of Bacteria in the community ranged from 68 ± 7% to 71 ± 8%, whereas that of Methanosaeta (MX825) accounted for 6 ± 2% to 8 ± 2% (Figure 8).
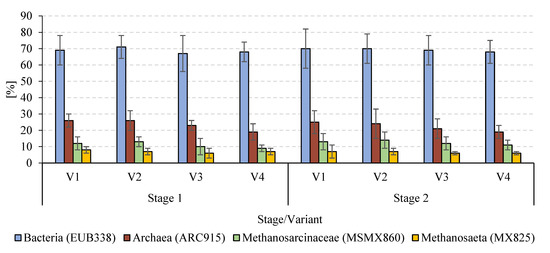
Figure 8.
Anaerobic bacterial community composition in particular experimental variants.
Similarly, feedstock pre-treatment prior to AD was found to have no effect on the anaerobic bacterial community in an experiment by Gagliano et al. (2015) [58]. As in the present study, the relative abundance of Archaea decreased as the OLR increased, regardless of whether raw or sonicated MSS was used. The application of Archaea-specific FISH probes showed the presence of long filamentous rods of the Methanosaeta spp. The latter was found in all digestion phases, highlighting the occurrence of acetotrophic methanogenesis, as expected in a mesophilic anaerobic system [58]. The present study results corroborate earlier findings reported by Boonapatcharoen et al. [59], who noted that an OLR increase from 1.0 to 6.0 kgCOD/m3·d during AD led to decreased abundance of Archaea [59]. Yet, another study [60] similarly reported that the anaerobic bacteria community was directly affected by rising OLRs, reduced HRT, and the resultant changes in reactor conditions.
3.6. Estimated Energy Production
The assessment of energetic effectiveness is extremely important to the evaluation of process viability, especially on the large scale [61]. Analyzing the amount of methane production and its energy value of 9.17 Wh/dm3, the highest gross energy gain was shown in S2V2 with an OLR of 3.0 gVS/dm3·day and amounted to 187.07 ± 1.5 Wh/day (Table 4). In S1V2, only 148.55 ± 1.3 Wh/day was obtained. The use of pre-treatment with SCO2 to intensify the methane fermentation process is justified when a closed CO2 cycle is used in these solutions in the cycle: biogas production—biogas enrichment—SCO2 production—sludge disintegration—fermentation—biogas production. This is an important argument that improves the economic, technological, and environmental efficiency of MSS anaerobic digestion [20].

Table 4.
Estimated energy production depending on the experimental variant.
4. Conclusions
The presented experiments are the first studies on the effect of pre-treatment with SCO2 on the efficiency of anaerobic digestion of MSS in continuous reactors. The available literature data present only the results of tests carried out in batch reactors. So far, the impact of the applied OLR on the efficiency of MSS methane fermentation has not been assessed, which is also a novelty of the conducted research.
MSS pre-treatment with SCO2 was found to be successful in the partial disintegration of microbial cells, as evidenced by the subsequent dissolution of organic matter and nutrients. The disintegrated MSS had higher levels of soluble COD, TOC, and mineralized nitrogen/phosphorus.
The present study shows that MSS pre-treatment with SCO2 at an SCO2/MSS ratio of 0.3 (by volume) significantly improves AD performance in terms of methane production and feedstock mineralization. The pre-treatment was found to have no negative effect on the long-term continuous operation of the reactor. The organic load rate played a much larger role in determining the ultimate performance of AD compared to the other variables tested.
The pre-treatment was found to enhance AD performance within the OLR range of 3.0–4.0 gVS/dm3·day. These values produced significantly higher biogas yields and CH4 fraction contents, both in terms of daily production and per VS added. The most significant impact of SCO2 on VS removal from MSS was found for OLR = 4.0 gVS/dm3·day. The SCO2 pre-treatment was not found to affect pH, FOS/TAC, or the anaerobic bacterial community composition. Instead, these parameters were mainly affected by the OLR.
The highest gross energy gain of 187.07 ± 1.5 Wh/day was obtained at an OLR of 3.0 gVS/dm3·day. The production of SCO2 in technologies dedicated to biogas upgrading and its use for MSS pre-treatment fits directly into the assumptions of the circular economy and corresponds to material recycling. It also supports the idea of reducing carbon dioxide emissions through its capture and use in a closed cycle.
Author Contributions
Conceptualization, J.K.; methodology, J.K. and M.D.; validation, J.K.; formal analysis, J.K.; investigation, J.K.; resources, J.K., M.D. and M.Z.; software, J.K.; data curation, J.K., M.D. and M.Z.; supervision, J.K.; writing—original draft preparation, J.K. and M.D.; writing—review and editing, J.K., M.D. and M.Z.; visualization, J.K. and M.D.; funding acquisition, J.K. All authors have read and agreed to the published version of the manuscript.
Funding
The manuscript was supported by the work WZ/WB-IIŚ/3/2022, funded by the Minister of Education and Science, and was financially supported by the Minister of Education and Science for the program entitled “Regional Initiative of Excellence” for the years 2019–2023, project no. 010/RID/2018/19, amount of funding: 12,000,000 PLN.
Institutional Review Board Statement
Not applicable.
Informed Consent Statement
Not applicable.
Data Availability Statement
Not applicable.
Conflicts of Interest
The authors declare no conflict of interest.
Abbreviations
| AS | anaerobic sludge |
| CH4 | methane |
| COD | chemical oxygen demand |
| CVmethane | methane calorific value |
| Eout | energy output |
| MMSS | mass of MSS |
| MS | mineral solids |
| MSS | municipal sewage sludge |
| MW | microwave |
| N-NH4 | ammonia nitrogen |
| OLR | organic load rate |
| P-PO4 | orthophosphates |
| S1 | stage 1 |
| S2 | stage 2 |
| SCO2 | solidified carbon dioxide |
| TC | total carbon |
| TN | total nitrogen |
| TOC | total organic carbon |
| TP | total phosphorus |
| TPAD | temperature phased anaerobic digestion |
| TS | total solids |
| US | ultrasonication |
| VFA | volatile fatty acid |
| VS | volatile solids |
| Ymethane | methane yield |
| ηF | digestion coefficient |
References
- Bin Khawer, M.U.; Naqvi, S.R.; Ali, I.; Arshad, M.; Juchelková, D.; Anjum, M.W.; Naqvi, M. Anaerobic Digestion of Sewage Sludge for Biogas & Biohydrogen Production: State-of-the-Art Trends and Prospects. Fuel 2022, 329, 125416. [Google Scholar] [CrossRef]
- Ghaleb, A.A.S.; Kutty, S.R.M.; Ho, Y.C.; Jagaba, A.H.; Noor, A.; Al-Sabaeei, A.M.; Almahbashi, N.M.Y. Response Surface Methodology to Optimize Methane Production from Mesophilic Anaerobic Co-Digestion of Oily-Biological Sludge and Sugarcane Bagasse. Sustainability 2020, 12, 2116. [Google Scholar] [CrossRef]
- Ghangrekar, M.M. Sludge Management. In Wastewater to Water; Springer: Berlin/Heidelberg, Germany, 2022; pp. 619–691. [Google Scholar] [CrossRef]
- Di Capua, F.; Spasiano, D.; Giordano, A.; Adani, F.; Fratino, U.; Pirozzi, F.; Esposito, G. High-Solid Anaerobic Digestion of Sewage Sludge: Challenges and Opportunities. Appl. Energy 2020, 278, 115608. [Google Scholar] [CrossRef]
- Kazimierowicz, J.; Dzienis, L.; Dębowski, M.; Zieliński, M. Optimisation of Methane Fermentation as a Valorisation Method for Food Waste Products. Biomass Bioenergy 2021, 144, 105913. [Google Scholar] [CrossRef]
- Llano, T.; Arce, C.; Finger, D.C. Optimization of Biogas Production through Anaerobic Digestion of Municipal Solid Waste: A Case Study in the Capital Area of Reykjavik, Iceland. J. Chem. Technol. Biotechnol. 2021, 96, 1333–1344. [Google Scholar] [CrossRef]
- Almahbashi, N.M.Y.; Kutty, S.R.M.; Ayoub, M.; Noor, A.; Salihi, I.U.; Al-Nini, A.; Jagaba, A.H.; Aldhawi, B.N.S.; Ghaleb, A.A.S. Optimization of Preparation Conditions of Sewage Sludge Based Activated Carbon. Ain Shams Eng. J. 2021, 12, 1175–1182. [Google Scholar] [CrossRef]
- Ambrose, H.W.; Chin, C.T.L.; Hong, E.; Philip, L.; Suraishkumar, G.K.; Sen, T.K.; Khiadani, M. Effect of Hybrid (Microwave-H2O2) Feed Sludge Pretreatment on Single and Two-Stage Anaerobic Digestion Efficiency of Real Mixed Sewage Sludge. Process Saf. Environ. Prot. 2020, 136, 194–202. [Google Scholar] [CrossRef]
- Gahlot, P.; Balasundaram, G.; Tyagi, V.K.; Atabani, A.E.; Suthar, S.; Kazmi, A.A.; Štěpanec, L.; Juchelková, D.; Kumar, A. Principles and Potential of Thermal Hydrolysis of Sewage Sludge to Enhance Anaerobic Digestion. Environ. Res. 2022, 214, 113856. [Google Scholar] [CrossRef]
- Liu, X.; Wang, Q.; Tang, Y.; Pavlostathis, S.G. Hydrothermal Pretreatment of Sewage Sludge for Enhanced Anaerobic Digestion: Resource Transformation and Energy Balance. Chem. Eng. J. 2021, 410, 127430. [Google Scholar] [CrossRef]
- Liu, H.; Wang, X.; Qin, S.; Lai, W.; Yang, X.; Xu, S.; Lichtfouse, E. Comprehensive Role of Thermal Combined Ultrasonic Pre-Treatment in Sewage Sludge Disposal. Sci. Total Environ. 2021, 789, 147862. [Google Scholar] [CrossRef]
- Kazimierowicz, J.; Dębowski, M.; Zieliński, M. Effect of Pharmaceutical Sludge Pre-Treatment with Fenton/Fenton-like Reagents on Toxicity and Anaerobic Digestion Efficiency. Int. J. Environ. Res. Public Health 2022, 20, 271. [Google Scholar] [CrossRef]
- Zieliński, M.; Dȩbowski, M.; Krzemieniewski, M.; Rusanowska, P.; Zielińska, M.; Cydzik-Kwiatkowska, A.; Głowacka-Gil, A. Application of an Innovative Ultrasound Disintegrator for Sewage Sludge Conditioning before Methane Fermentation. J. Ecol. Eng. 2018, 19, 240–247. [Google Scholar] [CrossRef]
- Kazimierowicz, J.; Bartkowska, I.; Walery, M. Effect of Low-Temperature Conditioning of Excess Dairy Sewage Sludge with the Use of Solidified Carbon Dioxide on the Efficiency of Methane Fermentation. Energies 2020, 14, 150. [Google Scholar] [CrossRef]
- Zawieja, I. Effect of Dry Ice Modification of Excess Sludge on the Methane Fermentation Process. Annu. Set Environ. Prot. 2018, 20, 558–573. [Google Scholar]
- Pellegrini, L.A.; De Guido, G.; Langé, S. Biogas to Liquefied Biomethane via Cryogenic Upgrading Technologies. Renew. Energy 2018, 124, 75–83. [Google Scholar] [CrossRef]
- Shah, G.; Ahmad, E.; Pant, K.K.; Vijay, V.K. Comprehending the Contemporary State of Art in Biogas Enrichment and CO2 Capture Technologies via Swing Adsorption. Int. J. Hydrogen Energy 2021, 46, 6588–6612. [Google Scholar] [CrossRef]
- Liu, J.; Zhang, W.; Jin, H.; Li, Z.; Liu, G.; Xing, F.; Tang, L. Exploring the Carbon Capture and Sequestration Performance of Biochar-Artificial Aggregate Using a New Method. Sci. Total Environ. 2023, 859, 160423. [Google Scholar] [CrossRef]
- Sun, F.; Xiao, K.K.; Zhu, W.; Withanage, N.; Zhou, Y. Enhanced Sludge Solubilization and Dewaterability by Synergistic Effects of Nitrite and Freezing. Water Res. 2018, 130, 208–214. [Google Scholar] [CrossRef]
- Kazimierowicz, J.; Dębowski, M. Characteristics of Solidified Carbon Dioxide and Perspectives for Its Sustainable Application in Sewage Sludge Management. Int. J. Mol. Sci. 2023, 24, 2324. [Google Scholar] [CrossRef]
- Nowicka, E.; Machnicka, A.; Grűbel, K. Improving of Anaerobic Digestion by Dry Ice Disintegration of Surplus Activated Sludge. In Proceedings of the Praca Była Prezentowana Podczas Konferencji ECOpole’13, Jarnołtówek, Poland, 23–26 October 2013; pp. 239–247. [Google Scholar] [CrossRef]
- Zawieja, I.E. The Course of the Methane Fermentation Process of Dry Ice Modified Excess Sludge. Arch. Environ. Prot. 2019, 45, 50–58. [Google Scholar] [CrossRef]
- Singh, A.; Kumar, V. Recent Developments in Monitoring Technology for Anaerobic Digesters: A Focus on Bio-Electrochemical Systems. Bioresour. Technol. 2021, 329, 124937. [Google Scholar] [CrossRef] [PubMed]
- Kozłowski, D.; Ignatowicz, K. Effect of Dosing PIX 113 Coagulant to the Batch on Mesophilic Fermentation Process and Reducing Hydrogen Sulfide Content in Biogas. J. Ecol. Eng. 2022, 23, 286–293. [Google Scholar] [CrossRef]
- PN-EN 15935:2022-01; Soil, Waste, Treated Bio-Waste and Sewage Sludge—Determination of Losses on Ignition. Health, Environment and Medicine Sector Technical Body of Soil Chemistry: Warsaw, Poland, 2022.
- ImageJ. Available online: https://imagej.net/software/imagej/ (accessed on 27 December 2022).
- Machnicka, A.; Nowicka, E.; Grübel, K. Disintegration as a Key-Step in Pre-Treatment of Surplus Activated Sludge. J. Water Chem. Technol. 2017, 39, 47–55. [Google Scholar] [CrossRef]
- Nowicka, E.; Machnicka, A. Confirmation of Effectiveness Surplus Activated Sludge Dry Ice Disruption by Infrared Wave Analysis. In Proceedings of the 42nd International Conference of Slovak Society of Chemical Engineering, Tatranské Matliare, Slovakia, 25–29 May 2015. [Google Scholar]
- Machnicka, A.; Grübel, K.; Wacławek, S.; Sikora, K. Waste-Activated Sludge Disruption by Dry Ice: Bench Scale Study and Evaluation of Heat Phase Transformations. Environ. Sci. Pollut. Res. 2019, 26, 26488–26499. [Google Scholar] [CrossRef] [PubMed]
- Elango, D.; Pulikesi, M.; Baskaralingam, P.; Ramamurthi, V.; Sivanesan, S. Production of Biogas from Municipal Solid Waste with Domestic Sewage. J. Hazard. Mater. 2007, 141, 301–304. [Google Scholar] [CrossRef]
- Qin, S.; Wainaina, S.; Liu, H.; Soufiani, A.M.; Pandey, A.; Zhang, Z.; Awasthi, M.K.; Taherzadeh, M.J. Microbial Dynamics during Anaerobic Digestion of Sewage Sludge Combined with Food Waste at High Organic Loading Rates in Immersed Membrane Bioreactors. Fuel 2021, 303, 121276. [Google Scholar] [CrossRef]
- Parchami, M.; Wainaina, S.; Mahboubi, A.; I’Ons, D.; Taherzadeh, M.J. MBR-Assisted VFAs Production from Excess Sewage Sludge and Food Waste Slurry for Sustainable Wastewater Treatment. Appl. Sci. 2020, 10, 2921. [Google Scholar] [CrossRef]
- Uma Rani, R.; Adish Kumar, S.; Kaliappan, S.; Yeom, I.T.; Rajesh Banu, J. Impacts of Microwave Pretreatments on the Semi-Continuous Anaerobic Digestion of Dairy Waste Activated Sludge. Waste Manag. 2013, 33, 1119–1127. [Google Scholar] [CrossRef]
- Houtmeyers, S.; Degrève, J.; Willems, K.; Dewil, R.; Appels, L. Comparing the Influence of Low Power Ultrasonic and Microwave Pre-Treatments on the Solubilisation and Semi-Continuous Anaerobic Digestion of Waste Activated Sludge. Bioresour. Technol. 2014, 171, 44–49. [Google Scholar] [CrossRef]
- Riau, V.; De la Rubia, M.A.; Pérez, M. Upgrading the Temperature-Phased Anaerobic Digestion of Waste Activated Sludge by Ultrasonic Pretreatment. Chem. Eng. J. 2015, 259, 672–681. [Google Scholar] [CrossRef]
- Oosterhuis, M.; Ringoot, D.; Hendriks, A.; Roeleveld, P. Thermal Hydrolysis of Waste Activated Sludge at Hengelo Wastewater Treatment Plant, The Netherlands. Water Sci. Technol. 2014, 70, 1–7. [Google Scholar] [CrossRef]
- Pilli, S.; More, T.; Yan, S.; Tyagi, R.D.; Surampalli, R.Y. Anaerobic Digestion of Thermal Pre-Treated Sludge at Different Solids Concentrations–Computation of Mass-Energy Balance and Greenhouse Gas Emissions. J. Environ. Manag. 2015, 157, 250–261. [Google Scholar] [CrossRef]
- Lee, I.-S.; Rittmann, B.E. Effect of Low Solids Retention Time and Focused Pulsed Pre-Treatment on Anaerobic Digestion of Waste Activated Sludge. Bioresour. Technol. 2011, 102, 2542–2548. [Google Scholar] [CrossRef]
- Onyeche, T. Economic Benefits of Low Pressure Sludge Homogenization for Wastewater Treatment Plants. In Proceedings of the Moving forward Wastewater Biosolids Sustainability: Technical, Managerial, and Public Synergy, Moncton, NB, Canada, 24–27 June 2007; pp. 417–422. [Google Scholar]
- Pilli, S.; More, T.T.; Yan, S.; Tyagi, R.D.; Surampalli, R.Y. Fenton Pre-Treatment of Secondary Sludge to Enhance Anaerobic Digestion: Energy Balance and Greenhouse Gas Emissions. Chem. Eng. J. 2016, 283, 285–292. [Google Scholar] [CrossRef]
- Wang, Q.; Jiang, G.; Ye, L.; Yuan, Z. Enhancing Methane Production from Waste Activated Sludge Using Combined Free Nitrous Acid and Heat Pre-Treatment. Water Res. 2014, 63, 71–80. [Google Scholar] [CrossRef]
- Devlin, D.C.; Esteves, S.R.R.; Dinsdale, R.M.; Guwy, A.J. The Effect of Acid Pretreatment on the Anaerobic Digestion and Dewatering of Waste Activated Sludge. Bioresour. Technol. 2011, 102, 4076–4082. [Google Scholar] [CrossRef]
- Li, H.; Li, C.; Liu, W.; Zou, S. Optimized Alkaline Pretreatment of Sludge before Anaerobic Digestion. Bioresour. Technol. 2012, 123, 189–194. [Google Scholar] [CrossRef]
- Grübel, K.; Machnicka, A. The Use of Hybrid Disintegration of Activated Sludge to Improve Anaerobic Stabilization Process. Ecol. Eng. Environ. Technol. 2020, 21, 1–8. [Google Scholar] [CrossRef]
- Machnicka, A.; Grübel, K. The Effect of Pre-Treatment and Anaerobic Digestion for Pathogens Reduction in Agricultural Utilization of Sewage Sludge. Environ. Sci. Pollut. Res. 2023, 30, 13801–13810. [Google Scholar] [CrossRef]
- Villa, R.; Ortega Rodriguez, L.; Fenech, C.; Anika, O.C. Ensiling for Anaerobic Digestion: A Review of Key Considerations to Maximise Methane Yields. Renew. Sustain. Energy Rev. 2020, 134, 110401. [Google Scholar] [CrossRef]
- Camacho-Muñoz, R.; Villada-Castillo, H.S.; Solanilla-Duque, J.F. Anaerobic Biodegradation under Slurry Thermophilic Conditions of Poly(Lactic Acid)/Starch Blend Compatibilized by Maleic Anhydride. Int. J. Biol. Macromol. 2020, 163, 1859–1865. [Google Scholar] [CrossRef] [PubMed]
- Sivagurunathan, P.; Kumar, G.; Mudhoo, A.; Rene, E.R.; Saratale, G.D.; Kobayashi, T.; Xu, K.; Kim, S.H.; Kim, D.H. Fermentative Hydrogen Production Using Lignocellulose Biomass: An Overview of Pre-Treatment Methods, Inhibitor Effects and Detoxification Experiences. Renew. Sustain. Energy Rev. 2017, 77, 28–42. [Google Scholar] [CrossRef]
- Logan, M.; Visvanathan, C. Management Strategies for Anaerobic Digestate of Organic Fraction of Municipal Solid Waste: Current Status and Future Prospects. Waste Manag. Res. 2019, 37 (Suppl. 1), 27–39. [Google Scholar] [CrossRef] [PubMed]
- Srisowmeya, G.; Chakravarthy, M.; Nandhini Devi, G. Critical Considerations in Two-Stage Anaerobic Digestion of Food Waste—A Review. Renew. Sustain. Energy Rev. 2020, 119, 109587. [Google Scholar] [CrossRef]
- Wang, X.; Li, Y.; Zhang, Y.; Pan, Y.R.; Li, L.; Liu, J.; Butler, D. Stepwise PH Control to Promote Synergy of Chemical and Biological Processes for Augmenting Short-Chain Fatty Acid Production from Anaerobic Sludge Fermentation. Water Res. 2019, 155, 193–203. [Google Scholar] [CrossRef]
- Sarkar, O.; Rova, U.; Christakopoulos, P.; Matsakas, L. Influence of Initial Uncontrolled PH on Acidogenic Fermentation of Brewery Spent Grains to Biohydrogen and Volatile Fatty Acids Production: Optimization and Scale-Up. Bioresour. Technol. 2021, 319, 124233. [Google Scholar] [CrossRef]
- Vázquez-Fernández, A.; Suárez-Ojeda, M.E.; Carrera, J. Review about Bioproduction of Volatile Fatty Acids from Wastes and Wastewaters: Influence of Operating Conditions and Organic Composition of the Substrate. J. Environ. Chem. Eng. 2022, 10, 107917. [Google Scholar] [CrossRef]
- Nelabhotla, A.B.T.; Dinamarca, C. Bioelectrochemical CO2 Reduction to Methane: MES Integration in Biogas Production Processes. Appl. Sci. 2019, 9, 1056. [Google Scholar] [CrossRef]
- Sánchez, E.; Borja, R.; Travieso, L.; Martín, A.; Colmenarejo, M.F. Effect of Organic Loading Rate on the Stability, Operational Parameters and Performance of a Secondary Upflow Anaerobic Sludge Bed Reactor Treating Piggery Waste. Bioresour. Technol. 2005, 96, 335–344. [Google Scholar] [CrossRef]
- Ambrose, H.W.; Philip, L.; Suraishkumar, G.K.; Sen, T. Anaerobic Co-Digestion of Mixed Activated Sewage Sludge and Fruit and Vegetable Waste on Two-Stage Digester Stability. Authorea Prepr. 2020. [Google Scholar] [CrossRef]
- Nkuna, R.; Roopnarain, A.; Adeleke, R. Effects of Organic Loading Rates on Microbial Communities and Biogas Production from Water Hyacinth: A Case of Mono- and Co-Digestion. J. Chem. Technol. Biotechnol. 2019, 94, 1294–1304. [Google Scholar] [CrossRef]
- Gagliano, M.C.; Braguglia, C.M.; Gallipoli, A.; Gianico, A.; Rossetti, S. Microbial Diversity in Innovative Mesophilic/Thermophilic Temperature-Phased Anaerobic Digestion of Sludge. Environ. Sci. Pollut. Res. 2015, 22, 7339–7348. [Google Scholar] [CrossRef]
- Boonapatcharoen, N.; Meepian, K.; Chaiprasert, P.; Techkarnjanaruk, S. Molecular Monitoring of Microbial Population Dynamics during Operational Periods of Anaerobic Hybrid Reactor Treating Cassava Starch Wastewater. Microb. Ecol. 2007, 54, 21–30. [Google Scholar] [CrossRef]
- Zieliński, M.; Dębowski, M.; Kazimierowicz, J. Performance of an Innovative Low-Cost Recycled Filling (LCRF) in Anaerobic Treatment of Dairy Effluent—A Pilot-Scale Study. Materials 2022, 15, 7815. [Google Scholar] [CrossRef]
- Passos, F.; García, J.; Ferrer, I. Impact of Low Temperature Pretreatment on the Anaerobic Digestion of Microalgal Biomass. Bioresour. Technol. 2013, 138, 79–86. [Google Scholar] [CrossRef]
Disclaimer/Publisher’s Note: The statements, opinions and data contained in all publications are solely those of the individual author(s) and contributor(s) and not of MDPI and/or the editor(s). MDPI and/or the editor(s) disclaim responsibility for any injury to people or property resulting from any ideas, methods, instructions or products referred to in the content. |
© 2023 by the authors. Licensee MDPI, Basel, Switzerland. This article is an open access article distributed under the terms and conditions of the Creative Commons Attribution (CC BY) license (https://creativecommons.org/licenses/by/4.0/).