
Coupling RetinaFace and Depth Information to Filter False Positives


Abstract
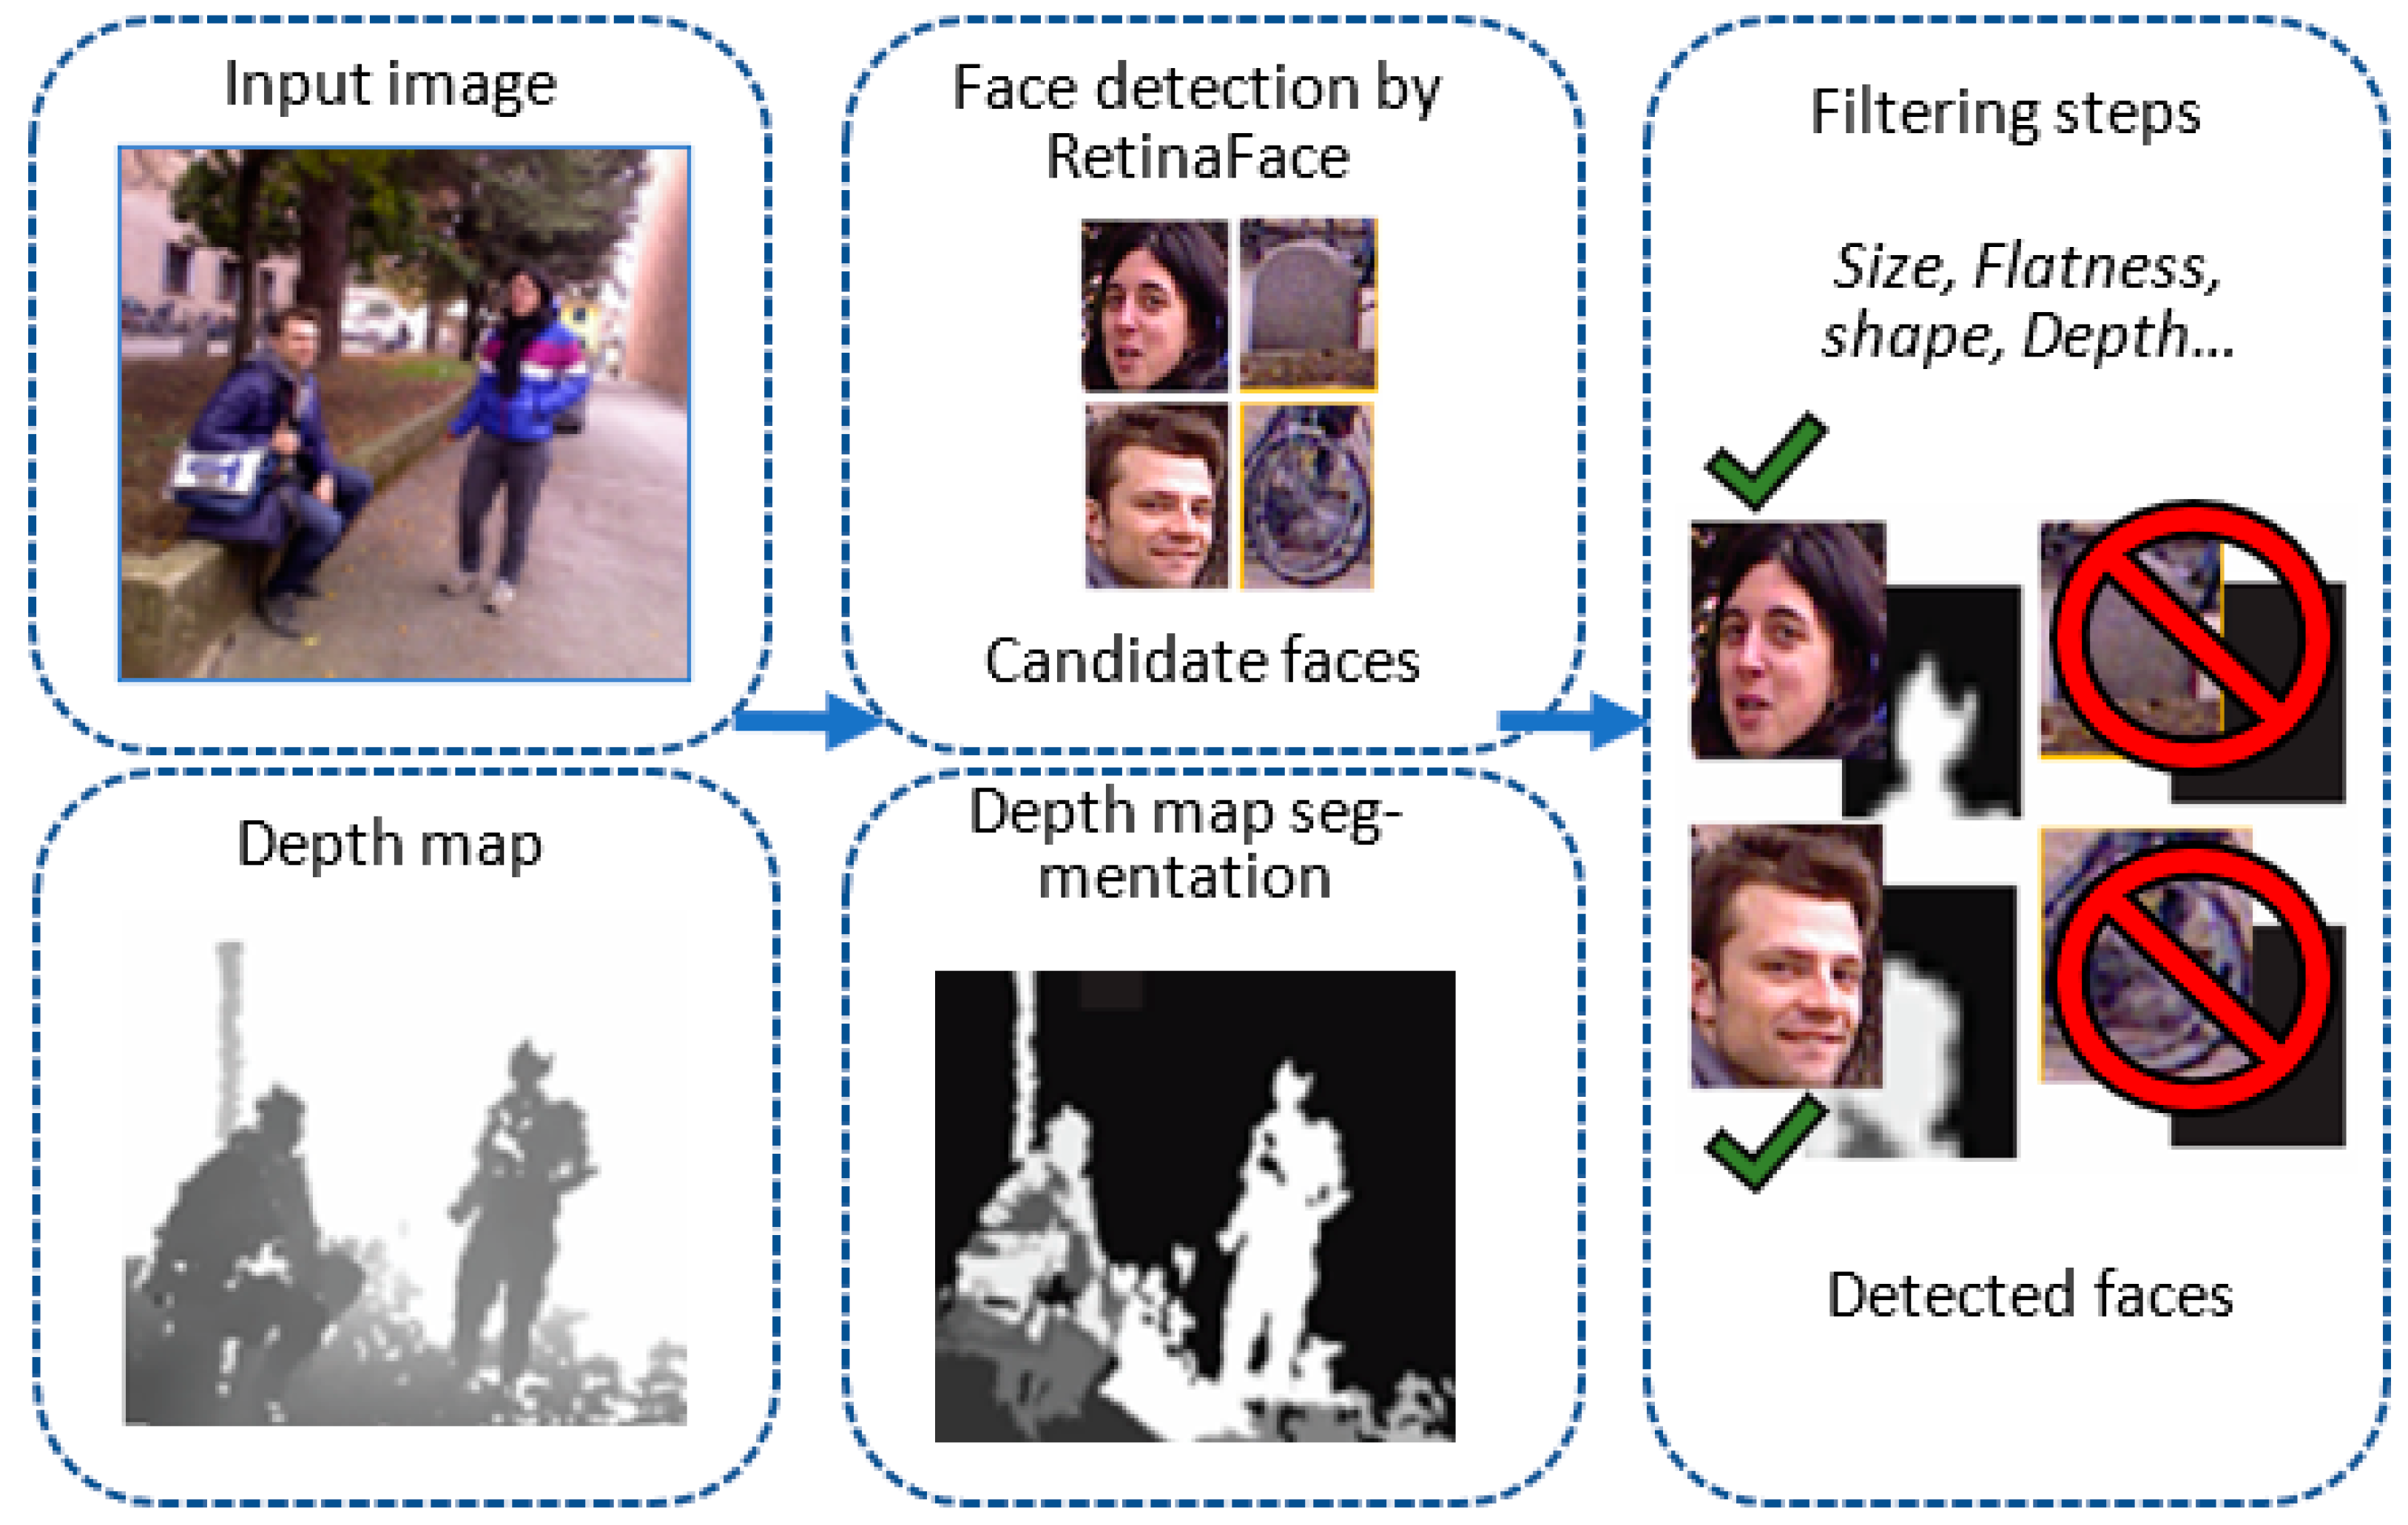
1. Introduction
2. Materials and Methods
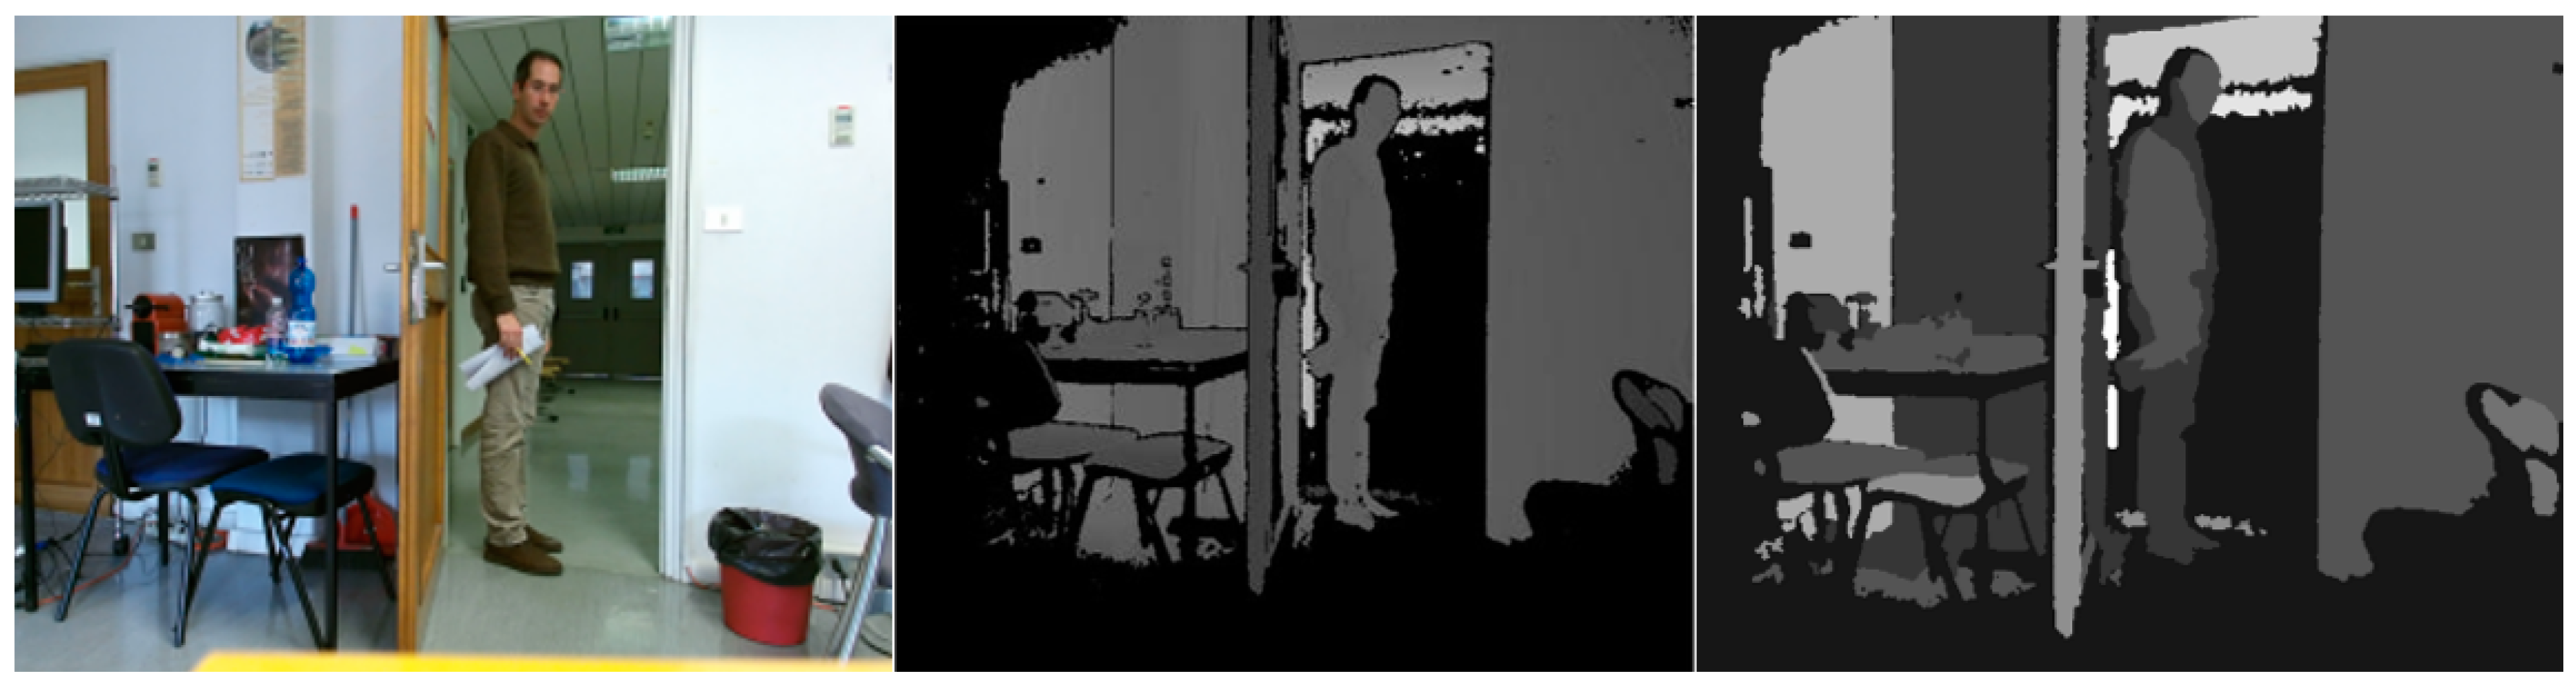
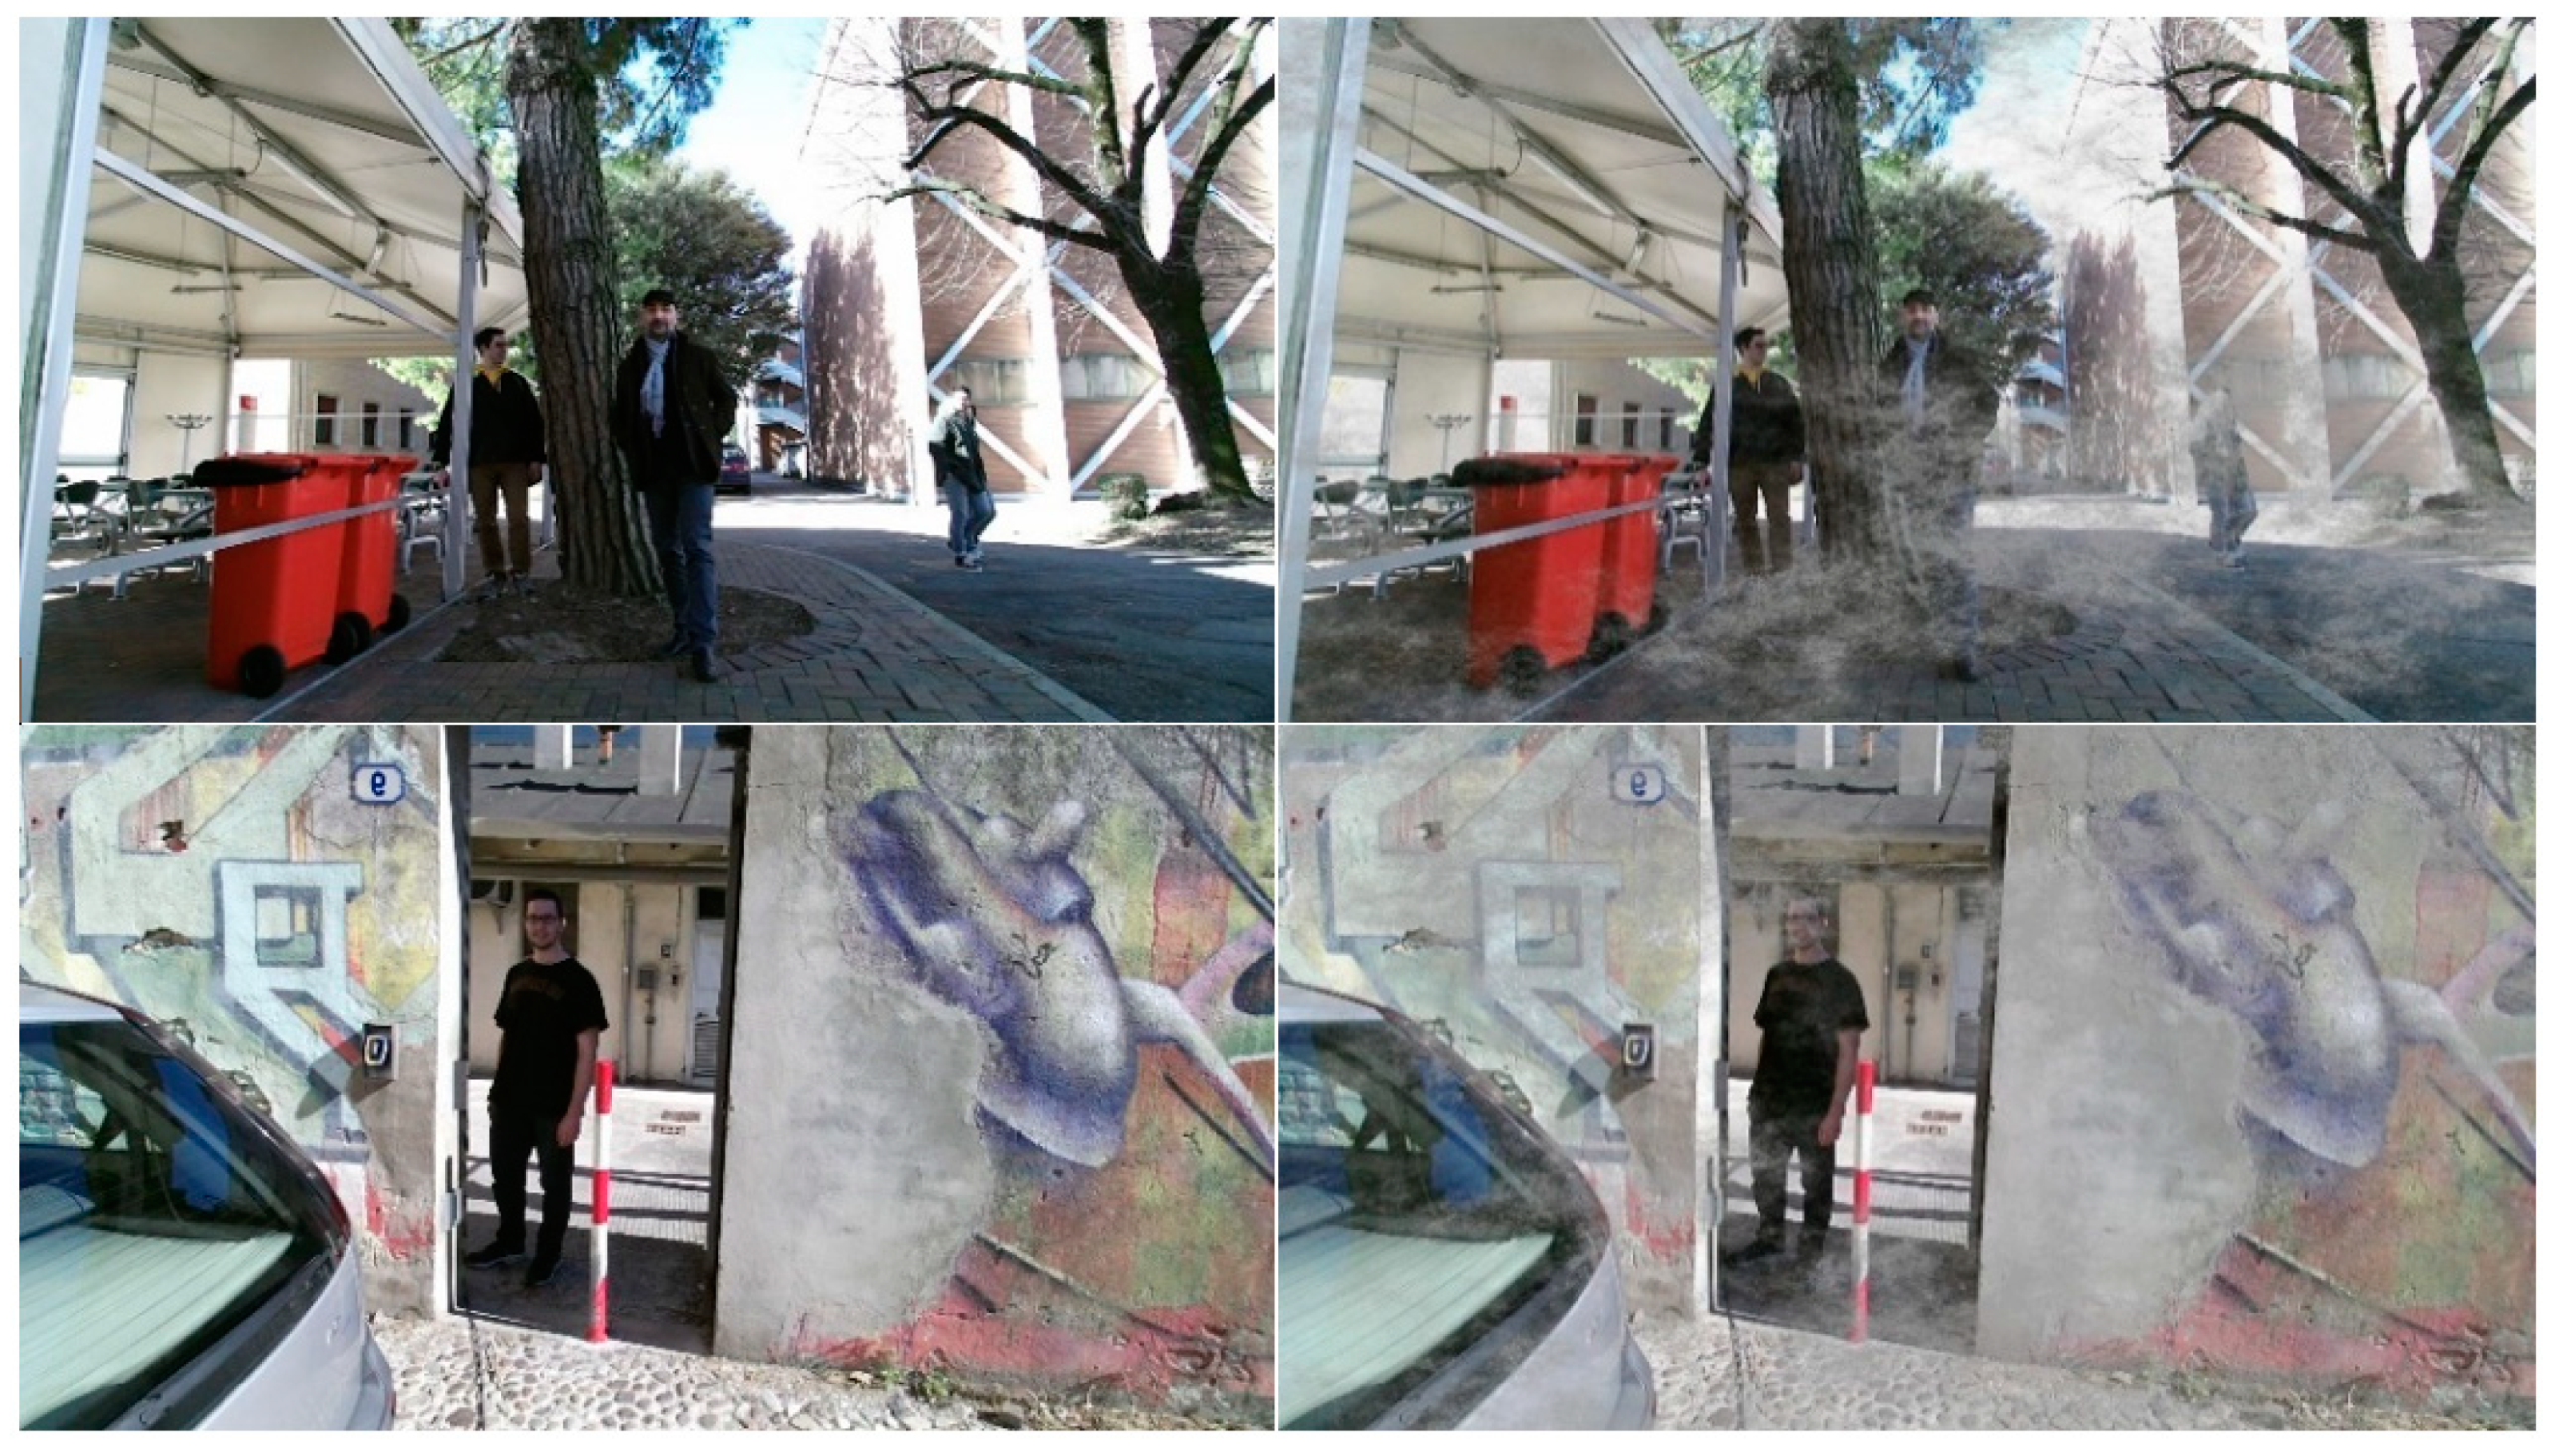
2.1. Depth Map Alignment and Segmentation
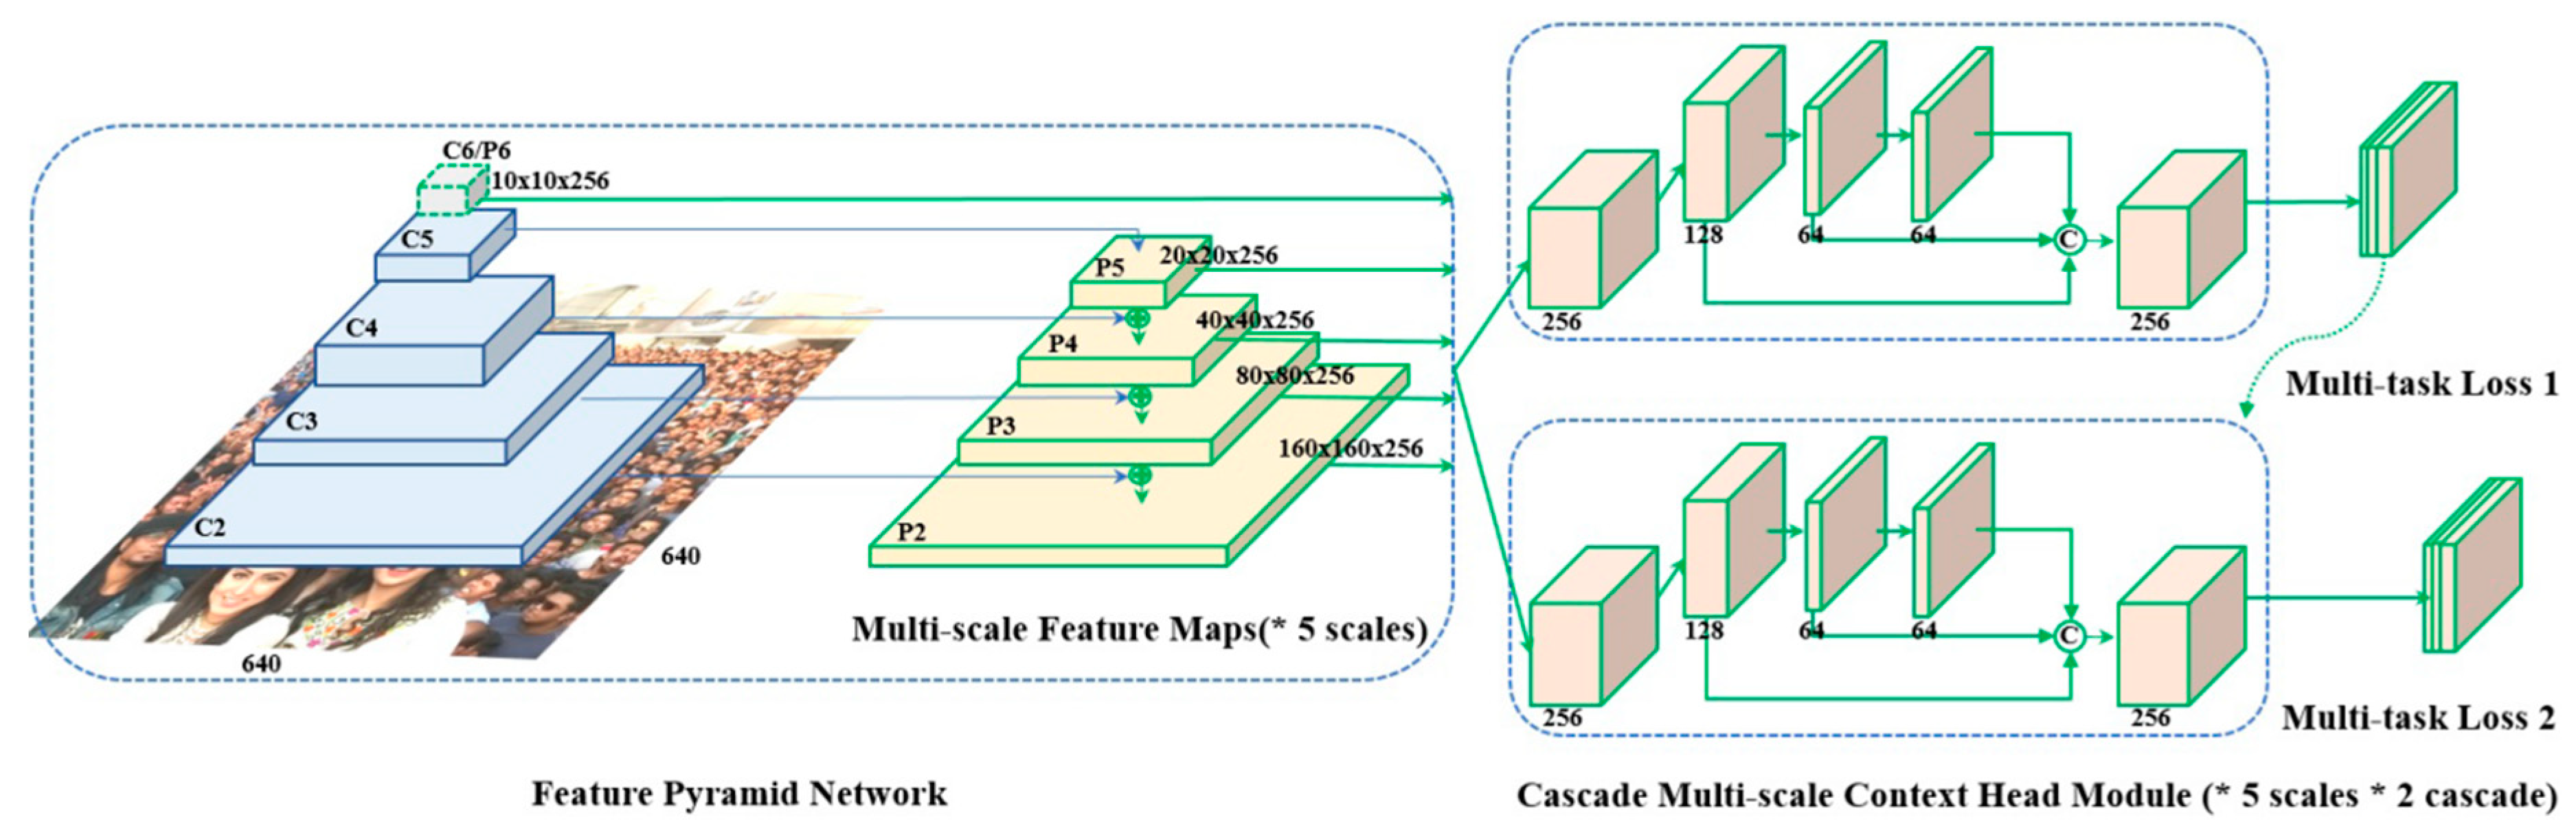
2.2. Face Detectors: RetinaFace and YOLOv7
2.3. Filtering Steps
2.3.1. Filter Based on Image Size (SIZE)
2.3.2. Flatness\Unevenness Filter (STD)
2.3.3. Segmentation-Based Filtering (SEG and ELL)
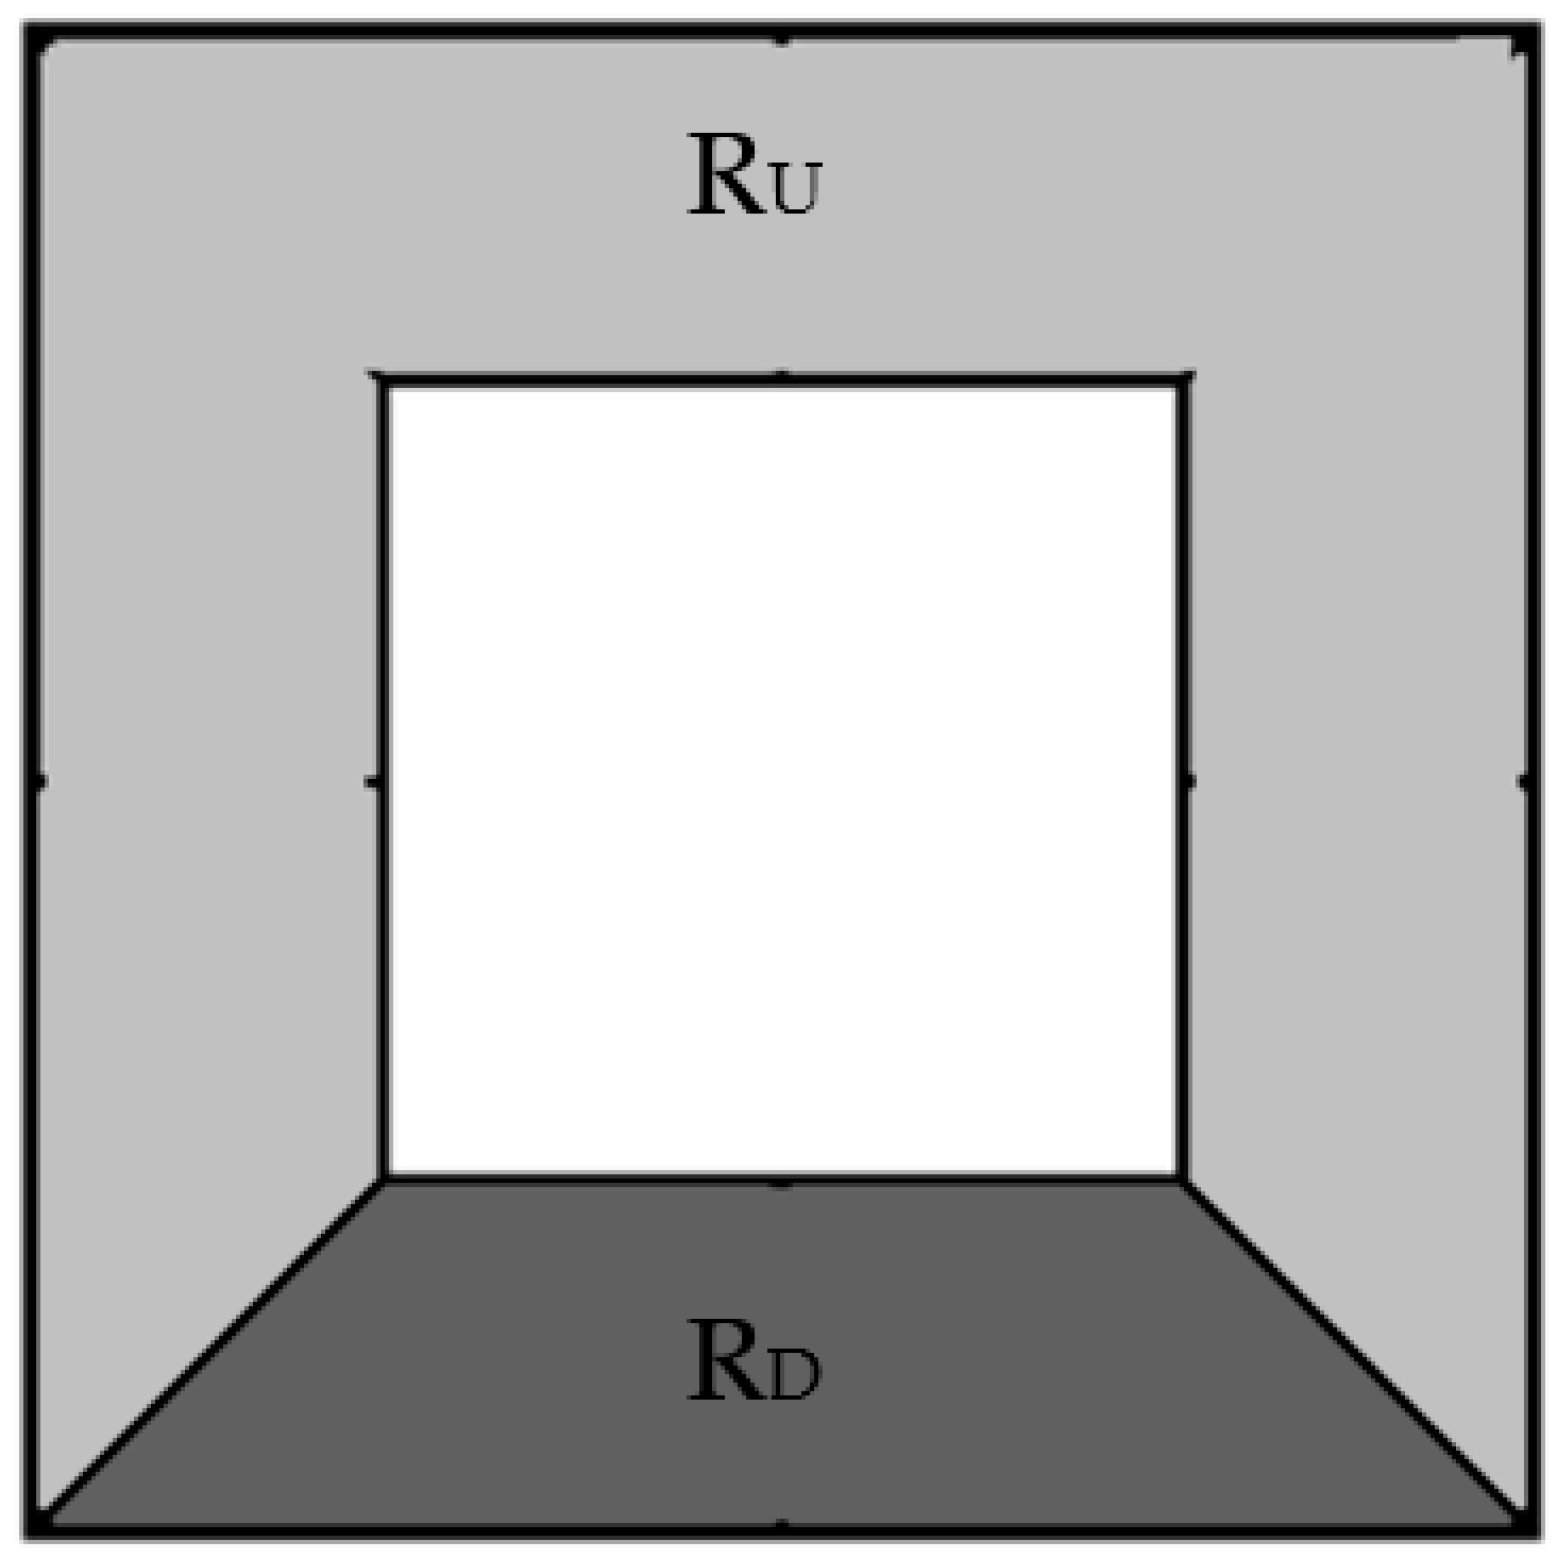
2.3.4. Filtering Based on the Analysis of the Depth Values (SEC)
3. Results and Discussion
3.1. Datasets
3.2. Performance Indicators
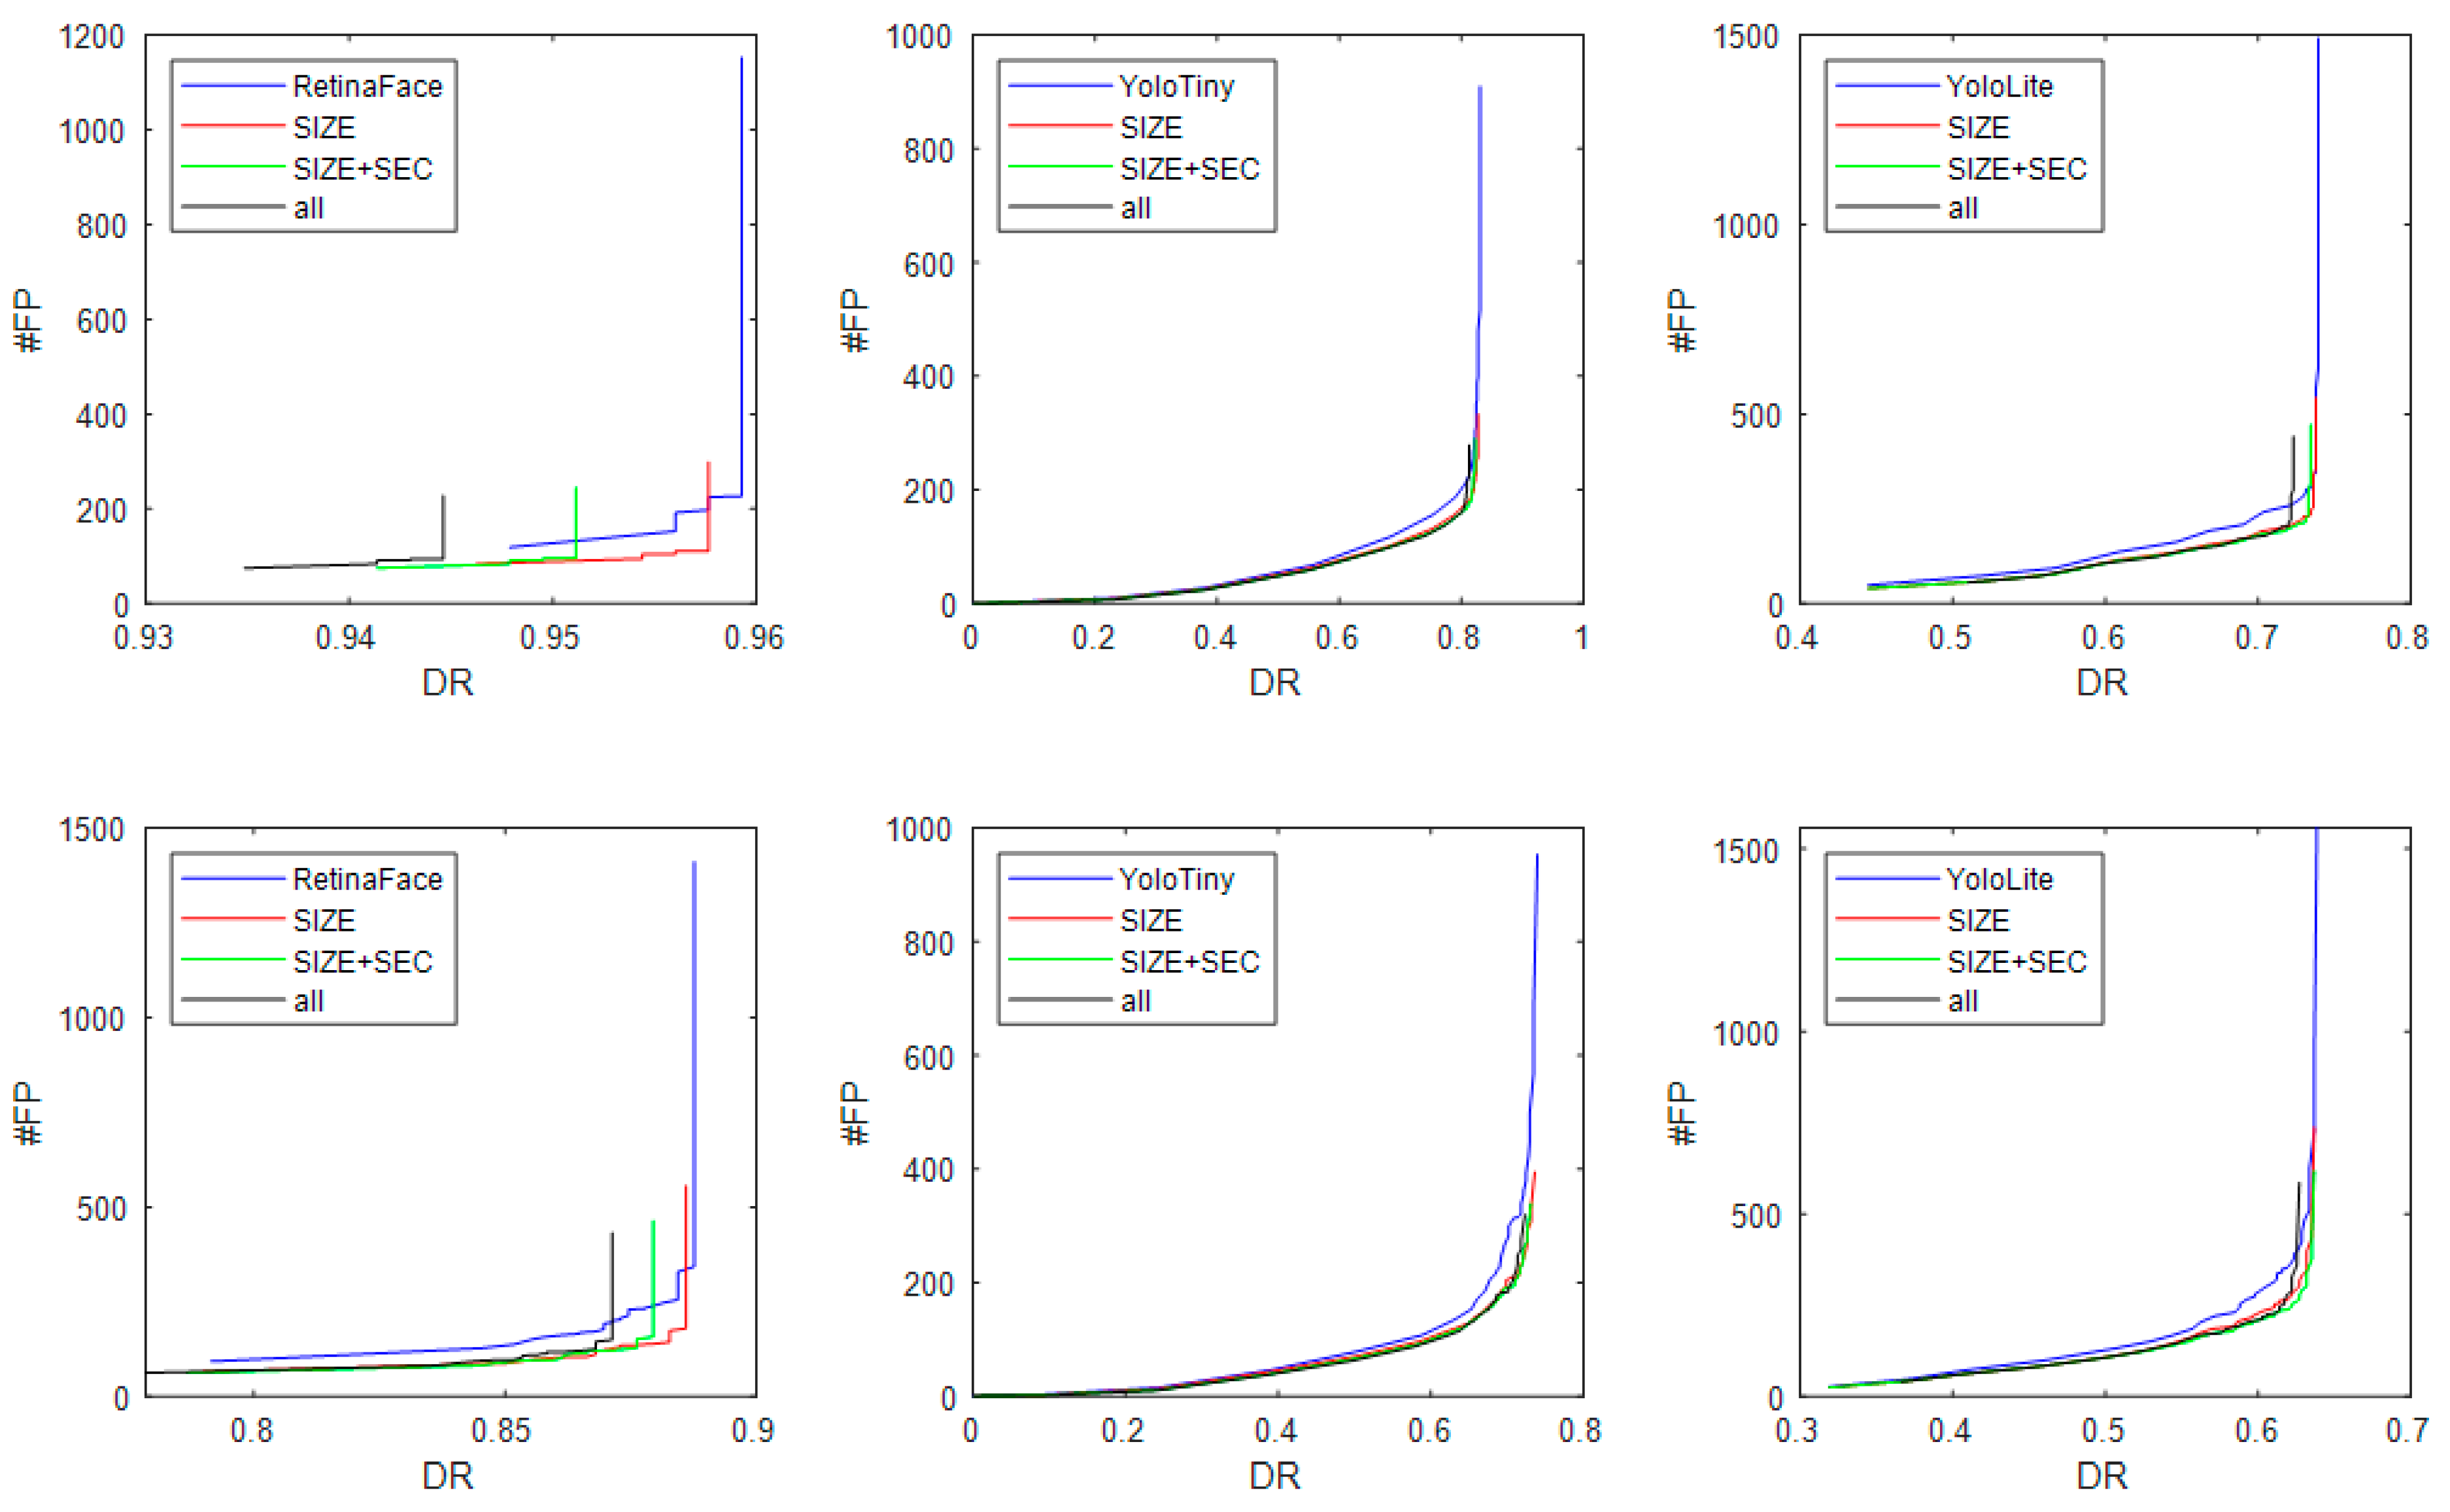
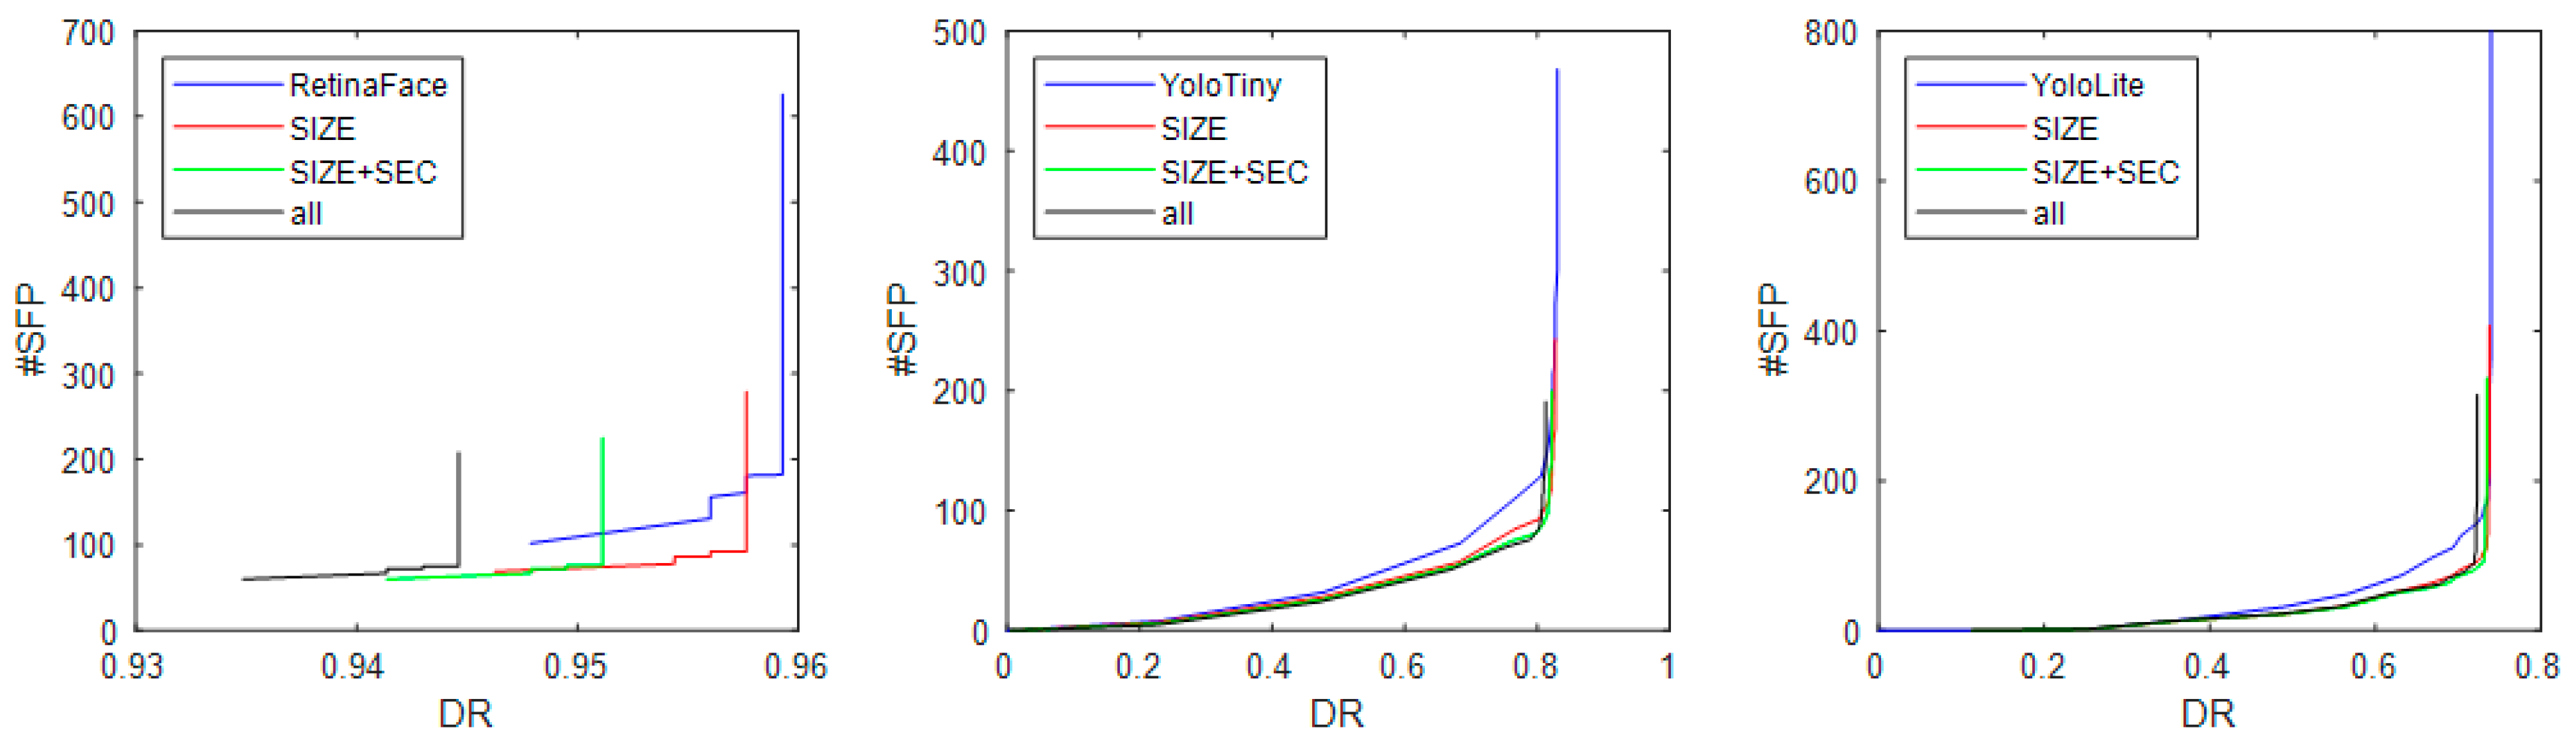
- Detection rate (DR): this metric measures the accuracy of the face detection algorithm by comparing the number of faces correctly detected to the total amount of faces in the dataset. All faces in the dataset have been manually labeled for this evaluation. Let be the Euclidean distance between the manually extracted positions that are centered left and right, and let be the detected centered left and right eye positions. The relative error of detection (ED) is defined as , where is the Euclidean distance between the expected eye centers. In this work, ED ≤ 0.35 is the value used as a criterion to claim a right eye detection.
- False positives (FP): this is the number of candidate faces with no face correctly extracted (i.e., incorrect eye detection, having ED > 0.35).
3.3. Experiments
- The best trade-off of DR and FP is obtained by RetinaFace (0.5) with the SIZE filter applied. Clearly, SIZE increases the effectiveness of RetinaFace on the test set;
- The other filters reduce the number of FP but also decrease DR;
- SIZE permits to reduce FP without a considerable reduction in DR, even when coupled with YOLOv7.
4. Conclusions
Author Contributions
Funding
Institutional Review Board Statement
Informed Consent Statement
Conflicts of Interest
References
- Nanni, L.; Brahnam, S.; Lumini, A. Face Detection Ensemble with Methods Using Depth Information to Filter False Positives. Sensors 2019, 19, 5242. [Google Scholar] [CrossRef] [PubMed]
- Zhu, X.; Liu, X.; Lei, Z.; Li, S.Z. Face Alignment in Full Pose Range: A 3D Total Solution. IEEE Trans. Pattern Anal. Mach. Intell. 2019, 41, 78–92. [Google Scholar] [CrossRef] [PubMed]
- Taigman, Y.; Yang, M.; Ranzato, M.; Wolf, L. DeepFace: Closing the Gap to Human-Level Performance in Face Verification. In Proceedings of the 2014 IEEE Conference on Computer Vision and Pattern Recognition, Columbus, OH, USA, 23–28 June 2014; pp. 1701–1708. [Google Scholar]
- Kumar, A.; Kaur, A.; Kumar, M. Face detection techniques: A review. Artif. Intell. Rev. 2019, 52, 927–948. [Google Scholar] [CrossRef]
- Yang, M.-H.; Kriegman, D.; Ahuja, N. Detecting faces in images: A survey. IEEE Trans. Pattern Anal. Mach. Intell. 2002, 24, 34–58. [Google Scholar] [CrossRef]
- Zhang, S.; Zhu, X.; Lei, Z.; Shi, H.; Wang, X.; Li, S.Z. S3fd: Shot Scale-Invariant Face Detector. In Proceedings of the 2017 IEEE International Conference on Computer Vision (ICCV), 22–29 October 2017; pp. 192–201. [Google Scholar]
- Jiang, B.; Ren, Q.; Dai, F.; Xiong, J.; Yang, J.; Gui, G. Multi-task Cascaded Convolutional Neural Networks for Real-Time Dynamic Face Recognition Method. Lect. Notes Electr. Eng. 2020, 517, 59–66. [Google Scholar] [CrossRef]
- Viola, P.; Jones, M. Rapid object detection using a boosted cascade of simple features. In Proceedings of the 2001 IEEE Computer Society Conference on Computer Vision and Pattern Recognition, CVPR, Kauai, HI, USA, 8–14 December 2001. [Google Scholar]
- Liao, S.; Jain, A.K.; Li, S.Z. A Fast and Accurate Unconstrained Face Detector. IEEE Trans. Pattern Anal. Mach. Intell. 2016, 38, 211–223. [Google Scholar] [CrossRef] [PubMed]
- Markuš, N.; Frljak, M.; Pandžić, I.S.; Ahlberg, J.; Forchheimer, R. Fast Localization of Facial Landmark Points. arXiv 2014, arXiv:1403.6888. [Google Scholar] [CrossRef]
- Li, H.; Lin, Z.; Shen, X.; Brandt, J.; Hua, G. A convolutional neural network cascade for face detection. In Proceedings of the 2015 IEEE Conference on Computer Vision and Pattern Recognition (CVPR), Boston, MA, USA, 7–12 June 2015; pp. 5325–5334. [Google Scholar]
- Farfade, S.S.; Saberian, M.; Li, L.J. Multi-view face detection using Deep convolutional neural networks. In Proceedings of the 5th ACM on International Conference on Multimedia Retrieva, Shanghai, China, 23–26 June 2015. [Google Scholar]
- Yang, W.; Zhou, L.; Li, T.; Wang, H. A Face Detection Method Based on Cascade Convolutional Neural Network. Multimed. Tools Appl. 2019, 78, 24373–24390. [Google Scholar] [CrossRef]
- Zhang, K.; Zhang, Z.; Li, Z.; Qiao, Y. Joint Face Detection and Alignment Using Multitask Cascaded Convolutional Networks. IEEE Signal Process. Lett. 2016, 23, 1499–1503. [Google Scholar] [CrossRef]
- Girshick, R.; Donahue, J.; Darrell, T.; Malik, J. Rich Feature Hierarchies for Accurate Object Detection and Semantic Segmentation. In Proceedings of the IEEE Computer Society Conference on Computer Vision and Pattern Recognition, Columbus, OH, USA, 23–28 June 2014; pp. 580–587. [Google Scholar]
- Deng, J.; Guo, J.; Ververas, E.; Kotsia, I.; Zafeiriou, S. Retinaface: Single-shot multi-level face localisation in the wild. In Proceedings of the IEEE/CVF conference on computer vision and pattern recognition, Seattle, WA, USA, 14–19 June 2020; pp. 5203–5212. [Google Scholar]
- Min, R.; Kose, N.; Dugelay, J.L. Kinectfacedb: A kinect database for face recognition. IEEE Trans. Syst. Man Cybern. Syst. 2014, 44, 1534–1548. [Google Scholar] [CrossRef]
- Gupta, S.; Castleman, K.R.; Markey, M.K.; Bovik, A.C. Texas 3D Face Recognition Database. In Proceedings of the 2010 IEEE Southwest Symposium on Image Analysis & Interpretation (SSIAI), Austin, TX, USA, 23–25 May 2010; pp. 97–100. [Google Scholar]
- Faltemier, T.C.; Bowyer, K.W.; Flynn, P.J. Using a Multi-Instance Enrollment Representation to Improve 3D Face Recognition. In Proceedings of the 2007 First IEEE International Conference on Biometrics: Theory, Applications, and Systems, Crystal City, VA, USA, 27–29 September 2007; pp. 1–6. [Google Scholar]
- Shotton, J.; Sharp, T.; Kipman, A.; Fitzgibbon, A.; Finocchio, M.; Blake, A.; Cook, M.; Moore, R. Real-time human pose recognition in parts from single depth images. Commun. ACM 2013, 56, 116–124. [Google Scholar] [CrossRef]
- Mattheij, R.; Postma, E.; Van den Hurk, Y.; Spronck, P. Depth-based detection using Haar-like features. In Proceedings of the Belgian/Netherlands Artificial Intelligence Conference, Maastricht, The Netherlands, 25–26 October 2012; pp. 162–169. [Google Scholar]
- Anisetti, M.; Bellandi, V.; Damiani, E.; Arnone, L.; Rat, B. A3fd: Accurate 3d face detection. In Signal Processing for Image Enhancement and Multimedia Processing; Signal, I., Ed.; Springer: Boston, MA, USA, 2008; pp. 155–165. [Google Scholar]
- Herrera, D.; Kannala, J.; Heikkilä, J. Joint Depth and Color Camera Calibration with Distortion Correction. IEEE Trans. Pattern Anal. Mach. Intell. 2012, 34, 2058–2064. [Google Scholar] [CrossRef] [PubMed]
- Mutto, C.D.; Zanuttigh, P.; Cortelazzo, G.M. Fusion of Geometry and Color Information for Scene Segmentation. IEEE J. Sel. Top. Signal Process. 2012, 6, 505–521. [Google Scholar] [CrossRef]
- Comaniciu, D.; Meer, P. Mean shift: A robust approach toward feature space analysis. IEEE Trans. Pattern Anal. Mach. Intell. 2002, 24, 603–619. [Google Scholar] [CrossRef]
- Wang, C.Y.; Bochkovskiy, A.; Liao, H.Y.M. YOLOv7: Trainable bag-of-freebies sets new state-of-the-art for real-time object detectors. arXiv 2022, arXiv:2207.02696. [Google Scholar] [CrossRef]
- Nanni, L.; Lumini, A.; Dominio, F.; Zanuttigh, P. Effective and precise face detection based on color and depth data. Appl. Comput. Inform. 2014, 10, 1–13. [Google Scholar] [CrossRef]
- Lumini, A.; Nanni, L. Fair comparison of skin detection approaches on publicly available datasets. Expert Syst. Appl. 2020, 160, 113677. [Google Scholar] [CrossRef]


| Dataset | Number Images | Number Faces | Depth Resolution | Color Resolution | Difficulty Level |
|---|---|---|---|---|---|
| MHG | 42 | 42 | 640 × 480 | 640 × 480 | Low |
| PHG | 59 | 59 | 640 × 480 | 1280 × 1024 | Low |
| PFD | 132 | 150 | 640 × 480 | 1280 × 1024 | High |
| PFD2 | 316 | 363 | 512 × 424 | 1920 × 1080 | High |
| MERGED | 549 | 614 | --- | --- | High |
| Face Detector: | RetinaFace | YOLOv7Tiny | YOLOv7Lite | |||
|---|---|---|---|---|---|---|
| Threshold | DR | FP | DR | FP | DR | FP |
| 0.02 | 95.93 | 1152 | 83.06 | 909 | 73.94 | 1491 |
| 0.2 | 95.93 | 281 | 82.74 | 405 | 73.78 | 427 |
| 0.5 | 95.93 | 227 | 82.41 | 309 | 73.45 | 305 |
| 0.9 | 95.60 | 171 | 0.16 | 0 | 0 | 0 |
| 0.98 | 94.79 | 119 | 0 | 0 | 0 | 0 |
| Face Detector: | RetinaFace | YOLOv7Tiny | YOLOv7Lite | ||||
|---|---|---|---|---|---|---|---|
| Threshold | Filter | DR | FP | DR | FP | DR | FP |
| 0.98 | None | 94.79 | 119 | 0 | 0 | 0 | 0 |
| SIZE | 94.63 | 84 | 0 | 0 | 0 | 0 | |
| SIZE + SEC | 94.14 | 75 | 0 | 0 | 0 | 0 | |
| all | 92.67 | 71 | 0 | 0 | 0 | 0 | |
| 0.5 | None | 95.93 | 227 | 82.41 | 309 | 73.45 | 305 |
| SIZE | 95.77 | 111 | 82.08 | 199 | 73.29 | 230 | |
| SIZE + SEC | 95.11 | 95 | 81.60 | 180 | 72.96 | 213 | |
| all | 93.65 | 85 | 79.80 | 162 | 71.01 | 194 | |
| 0.2 | None | 95.93 | 281 | 82.74 | 405 | 73.78 | 427 |
| SIZE | 95.77 | 128 | 82.41 | 229 | 73.62 | 283 | |
| SIZE + SEC | 95.11 | 109 | 81.92 | 206 | 73.29 | 254 | |
| all | 93.65 | 94 | 80.13 | 179 | 71.34 | 220 | |
| Face Detector: | RetinaFace | YOLOv7Tiny | YOLOv7Lite | ||||
|---|---|---|---|---|---|---|---|
| Threshold | Filter | DR | FP | DR | FP | DR | FP |
| 0.98 | none | 79.15 | 93 | 0 | 0 | 0 | 0 |
| SIZE | 78.99 | 66 | 0 | 0 | 0 | 0 | |
| SIZE + SEC | 78.66 | 63 | 0 | 0 | 0 | 0 | |
| all | 77.36 | 59 | 0 | 0 | 0 | 0 | |
| 0.5 | none | 87.46 | 219 | 69.54 | 264 | 59.77 | 274 |
| SIZE | 87.30 | 132 | 69.22 | 186 | 59.61 | 217 | |
| SIZE + SEC | 86.64 | 118 | 68.73 | 172 | 59.61 | 201 | |
| all | 85.34 | 101 | 67.26 | 153 | 57.98 | 189 | |
| 0.2 | none | 88.64 | 321 | 72.15 | 363 | 62.54 | 398 |
| SIZE | 88.27 | 171 | 71.82 | 233 | 62.38 | 289 | |
| SIZE + SEC | 87.62 | 149 | 71.34 | 211 | 62.38 | 257 | |
| all | 86.32 | 123 | 69.71 | 180 | 60.59 | 234 | |
Disclaimer/Publisher’s Note: The statements, opinions and data contained in all publications are solely those of the individual author(s) and contributor(s) and not of MDPI and/or the editor(s). MDPI and/or the editor(s) disclaim responsibility for any injury to people or property resulting from any ideas, methods, instructions or products referred to in the content. |
© 2023 by the authors. Licensee MDPI, Basel, Switzerland. This article is an open access article distributed under the terms and conditions of the Creative Commons Attribution (CC BY) license (https://creativecommons.org/licenses/by/4.0/).
Share and Cite
Nanni, L.; Brahnam, S.; Lumini, A.; Loreggia, A. Coupling RetinaFace and Depth Information to Filter False Positives. Appl. Sci. 2023, 13, 2987. https://doi.org/10.3390/app13052987
Nanni L, Brahnam S, Lumini A, Loreggia A. Coupling RetinaFace and Depth Information to Filter False Positives. Applied Sciences. 2023; 13(5):2987. https://doi.org/10.3390/app13052987
Chicago/Turabian StyleNanni, Loris, Sheryl Brahnam, Alessandra Lumini, and Andrea Loreggia. 2023. "Coupling RetinaFace and Depth Information to Filter False Positives" Applied Sciences 13, no. 5: 2987. https://doi.org/10.3390/app13052987
APA StyleNanni, L., Brahnam, S., Lumini, A., & Loreggia, A. (2023). Coupling RetinaFace and Depth Information to Filter False Positives. Applied Sciences, 13(5), 2987. https://doi.org/10.3390/app13052987