Abstract
In the step-by-step roadmap for limiting and eliminating power sources that use fossil fuel, especially coal-fired power, as well as for setting the Vietnamese government targets for developing renewable energy for replacement, solar farms and rooftop solar power, followed by floating photovoltaic (PV) power, are considered the best candidates for meeting the goals of land space, PV system operation efficiency, and meeting environmental goals. In addition to the rapid development of PV cell technology are the government’s incentives and financial support for PV plants on the water surface area, which is still very large. Floating PV plants will strongly attract investors in the near future. This study could help stakeholders in the market understand the economic–technical aspects from analyzing economic–financial indicators of floating PV plants with a capacity of 47.5 MW connected to the national utility grid 110 kV at Da Mi hydropower reservoir in Binh Thuan province, Vietnam, in May 2019. This is the first floating PV plant on the reservoir in Vietnam, and is the property of a third party.
1. Introduction
Global warming is the worst thing for the earth in the future, and the use of renewable energy sources is a valuable solution to prevent adverse effects on human life [1]. It is necessary to keep the global temperature increase to a maximum of 1.5 °C above pre-industrial times [2]. According to 2016 data for Southeast Asian countries, energy demand has increased by 60% in 15 years [3]. Renewable energy targets are set by each country to enhance their respective goals.
In the context of the world, every country has a step-by-step plan for limiting and eliminating power sources that use fossil fuel, especially coal-fired power, as well as for setting targets for developing renewable energy instead. The real understanding of solar energy is that it offers the most natural, ubiquitous, sustainable, abundant and clean processes [4,5,6]. The global potential of solar energy is thousands of times greater than the current global energy demand [7].
The government of Vietnam has put mechanisms in place in order to encourage investment in and development of renewable energy, of which, solar power is the most prioritized industry because it offers many advantages. Vietnam also previously applied an import tax (FiT) on solar photovoltaic, solid waste, biomass, wind, and small hydroelectricity in 2017. On 6 April 2020, the Prime Minister approved decision 13, for which, the purchase price of electricity from PV plants were listed as follows:
- ○
- Floating PV plants have a selling price of 1783 VND/kWp, which is equal to 7.69 UScent/kWp.
- ○
- Solar farm PV plants have a selling price of 1644/kWp VND, which is equal to 7.09 UScent/kWp.
- ○
- Rooftop PV plants have a selling price of 1943 VND/kWp, which is equal to 8.38 UScent/kWp.
According to the report on electricity demand in Vietnam at the Mastering Energy Supply for International Isolated Areas conference on 31 March 2022, the Government determined the aim of increasing the total generation and importation electricity capacity from 70,000 MW in 2000 to 146,8000 MW in 2030. Total generation and importation electricity energy is meant to increase from 330 million kWh in 2020 to 695 million kWh in 2030. Currently, Vietnam has produced more than 170 million kWh of electricity from fossil sources and cannot exploit anymore, so it is imperative to shift to renewable energy sources to generate electricity without incurring high electricity production costs as energy demand increases.
Vietnam’s energy target of “Zero CO2” by 2050 was determined by the Prime Minister at COP26. According to the national targets, solar energy will become the main renewable energy source of the country in the future. According to the news from the Electricity of Vietnam (EVN), as of 31 October 2021, the total installed capacity of renewable energy sources reached 20,644 MW, of which, hydroelectricity accounted for 29.6%, solar energy 22.57%, wind energy 5.16%, gas 10%, oil approximately 2%, and biomass 0.28% of the total power capacity. The renewable energy development target for power plant VIII, approved on 1 October 2019, identified the promotion for exploitation and use of effectively renewable energy sources for electricity production, in which, priority is given to distributed solar power for the main purpose of self-use.
The variations of energy parameters and economy parameters of the configurations were analyzed based on an economic point of view, and will help to predict and design an optimal hybrid photovoltaic system, cogeneration system, or stand-alone solar power system. Looking at the recent progress results provides a different view of the aspects detailed in several papers, as shown in Table 1.

Table 1.
The recent progress and similar work.
Vietnam has many hydroelectric reservoirs and nearly 7000 irrigation reservoirs. In addition to exploiting hydropower capacity and creating water sources for irrigating agricultural lands, with the large surface areas, these can also be used to install other floating PV plants. Regarding various renewable and sustainable energy technologies [21,22,23,24,25,26,27,28], the Hybrid renewable system [10,11,12,16,17,19,29,30], Hybrid PV system [13,14,15,20,31,32,33], Energy conservation of smart grid system [34], the floating PV plant can utilize the large water surface areas of hydropower reservoirs to add more capacity to the national utility grid, and has been promoted by many researchers and agreed upon by the Vietnamese government.
The selection of evaluation criteria is one of the most important concerns. The criteria must be explicitly selected to avoid inconsistencies when solving values of the aggregation function between different objectives (Technical objective—Economic objective—Environmental objective—Social objective) [14,27]. The floating solar power plants with a capacity of 47.5 MW connected to the national utility grid 110 kV at Da Mi hydropower reservoir in Binh Thuan province were selected to be electrically empowered and beneficially analyzed because they represent one of the first efforts to develop floating solar power plants connected to the utility grid with a large PV capacity. The importance of the present work is expected to be beneficial for both government and other stakeholders in decision-making, as a premise for plants to utilize the water surface of hydroelectric reservoirs to install more floating PV plants.
In this paper, the layout and environmental impact assessment, national economy analysis, and plant financial analysis (taking into account the sensitivity analysis results [8,26]) have been carried out. All these specific objectives highlight the great benefits for implementing the plant, especially taking advantage of the available space, helping to protect the environment and regulate the climate, replacing the PV plants installed on agricultural land, forest land, and buildings (in the case of ground-mounted PV power plants, a great dilemma facing investors concerning the ratio of the useful area is posed by the need to take the transmission towers and their conductors into consideration, since their shading effects are extremely great and significant) [35]. Therefore, the floating PV plants will provide higher electricity output than the conventional ones and increase economic benefits.
2. Environmental, Technical, Financial Specifications of the Plant
2.1. Solar Radiation Data at the Plant Area
Solar radiation data can be obtained from a variety of sources, for example Chao Wang et al. [36] from the National Aeronautics and Space Administration (NASA). The floating PV plant at Da Mi hydropower reservoir, Binh Thuan province is built in Tanh Linh district and Ham Thuan Bac district, Binh Thuan province. From the software Meteonorm 7, this calculated data is synthesized and interpolated from radiation measuring stations around the world. Combined with measured radiation data of satellites, the global horizontal irradiation GHI at the hydroelectric reservoir area is about 1777 kWh/m2/year, which is equivalent to 4.87 kWh/m2/day (Figure 1).
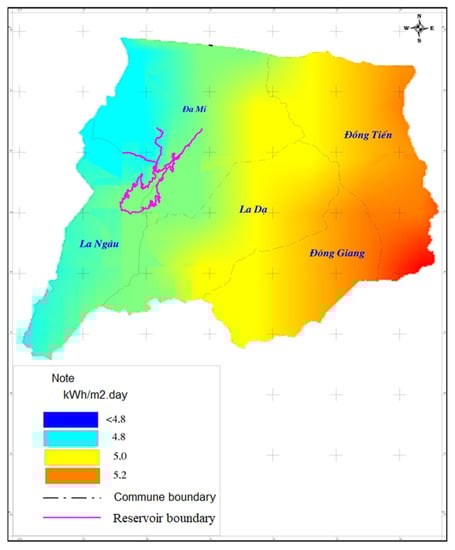
Figure 1.
GHI Map of theoretical average day recording of project area.
The data collected from NASA’s free public data source (at website: https://eosweb.larc.nasa.gov/sse/, accessed on 13 April 2017), the global horizontal irradiation in the plant area is 1874 kWh/m2/year, which is equivalent to 5.13 kWh/m2/day.
The data collected from SolarGIS’s free publicly available data source (at website: http://solargis.com/, accessed on 13 April 2017), the global horizontal irradiation in the plant area is 1846 kWh/m2/year, which is equivalent to 5.06 kWh/m2/day.
Through research and evaluation, the PV plant is proposed to use data sources purchased from SolarGIS. This is a commercial database that is measured from satellites over a long time series, from which, the data are aggregated and calculated to produce a typical meteorological value of a typical year for the plant. The SolarGIS data source has been rated by many independent research organizations as the most reliable source of solar data.
2.2. Specifications
A direct grid-connected PV plant includes the components described in Figure 2:
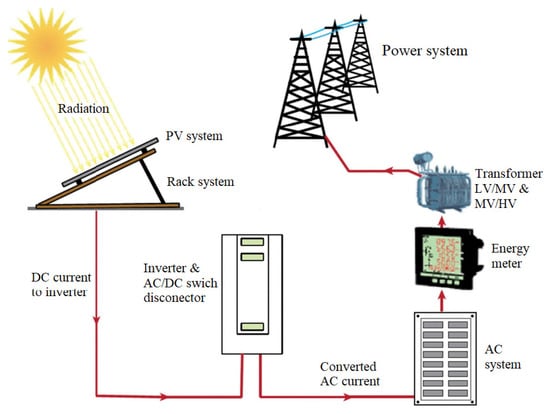
Figure 2.
Overview diagram of grid-connected PV plant.
- ○
- PV module: each photovoltaic panel consists of many photovoltaic cells (PV cells) connected together; the photovoltaic panels will be connected in series (string) and parallel (array) to achieve the required DC output power.
- ○
- Inverter: a power electronic device that converts DC current into AC current suitable for connection to the power grid.
- ○
- Mounting system: with the solution of installing panels on the water, the rack system is replaced by a floating float system.
- ○
- Step up transformers: depending on the capacity scale and regional utility grid conditions, the voltage level can be changed appropriately (for example 22 kV, 35 kV, 110 kV, 220 kV…). With high voltage levels, the electricity will need to go through 2 levels of transformers.
- ○
- Infrastructure for grid connection: specifically, here is the substation, including protection, metering, and control equipment.
2.2.1. PV Module
Currently, the main semiconductor material used to manufacture PV is silicon. The most widely used PV technologies are polycrystalline (p-Si), monocrystalline (m-Si), and amorphous silicon (a-Si). There are also other materials such as CdTe or CIGS/CIS for the production of thin-film PV, including Amorphous Silicon (a-Si), Cadmium Telluride (CdTe), Copper Indium Selenide (CIS), Copper Indium (Gallium), and Copper Indium Selenide (CIS), Di-Selenide (CIGS/CIS), and Heterojuntion with intrinsic thin-film layer (HIT). Due to the low production cost, high efficiency, and decades-old production technology, crystalline silicon photovoltaic cells still dominate the market (Figure 3). Si (crystalline) photovoltaic modules can achieve efficiencies up to 21.9% and 25.6%, respectively [37,38,39,40,41,42]. In Europe, the m-Si, p-Si type has a typical yield of 10 ÷ 18% [43]. Amorphous silicon (a-Si) has an efficiency of 4 ÷ 6% and amorphous silicon (a-Si) thin film PV has a maximum efficiency of 10.5%. The selection of panels with the right capacity needs to be evaluated with many different conditions. Table 2 shows the average efficiency of current PV panel technologies.
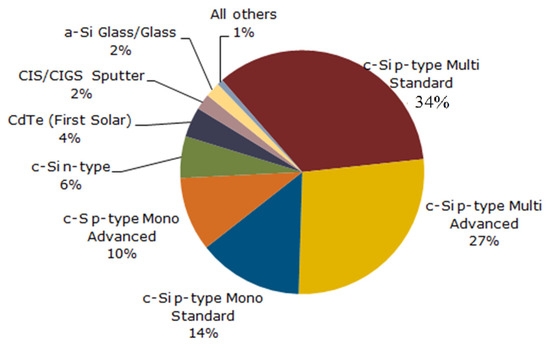
Figure 3.
Market share of PV panel technologies in the world in 2016.
Table 2.
The average efficiency of current PV panel technologies.
Calculation results of different capacities panel are presented in Table 3 below, calculated using Pvsyst software. In order to improve the efficiency of the plant and reduce the area and installation cost, the proposed plant for Da Mi solar power plant is a 72-cell silicon photovoltaic panel with a large capacity (more than 330 Wp). The panel efficiency is not less than 17%. This range of power and performance is currently popular across the world, with many manufacturers responding.
Table 3.
Calculation results of different silicon panels.
2.2.2. Inverter
The inverter is one of the most important devices in the PV system with the function of converting direct current DC into AC current from the high-frequency switching semiconductor components (FET, MOSFET, IGBT, etc.). There are many major manufacturers in the world, such as Huawei Technologies Co., Ltd. (Shenzhen, China), Sungrow Power Supply Co., Ltd. (Sydney, Australia), SMA Solar Technology AG (Niestetal, Germany), and Growatt New Energy Technology Co., Ltd (Shenzhen, China). According to the technical documents of most inverter manufacturers around the world, inverters have the ability to adjust the power factor in the range of 0.9 (early phase to late phase), ensuring the system connection requirements, as in Circular 39/TT-BCT. The parameter of some inverters are shown in Table 4:
Table 4.
Main parameters of some types of inverters in the world.
Due to the manufacturing characteristics, the inverter is coupled from many smaller units with a capacity of 500 kW or 600 kW to ensure the installation area on the reservoir surface, together with 0.6/22 kV transformer equipment and 22 kV electrical cabinet. The plant recommends the capacity of each inverter be 2500 kW, connected to an 01 transformer and 22 kV distribution cabinet system with a circuit breaker to protect against short circuit failure occuring on the transformer circuit.
2.3. Environmental Impact Assessment
2.3.1. Current Status of Da Mi Hydropower Reservoir
Da Mi hydropower reservoir is a day-regulating reservoir with a high average depth, large surface area, surface discharge through free overflow, small discharge volume, and low flow rate, which is convenient for large scale PV installation. The reservoir is currently being used to raise sturgeon, which is an aquatic species of high economic value.
By studying the topography of Da Mi reservoir, the different colors in the topographic map represent the density of the mountain rock layer. The terrain around the reservoir is mostly high mountains covered with thick forest (Figure 4). The southeast and southwest areas of the reservoir have flatter terrain. The reservoir bed environment has no specific aquatic species and has been operated since 2000. The mineral issues of the reservoir bed had been evaluated before the construction of Da Mi hydropower plant period.
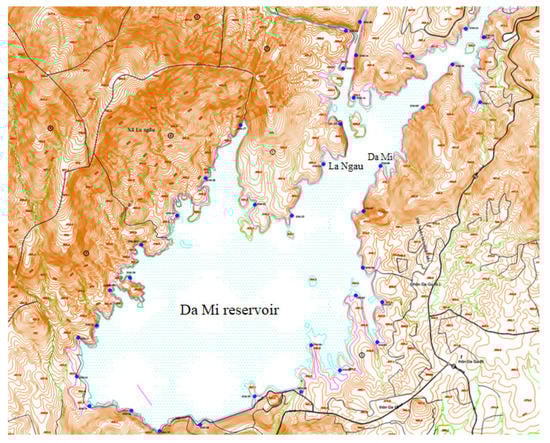
Figure 4.
Topography of Da Mi hydropower reservoir area.
2.3.2. Impact of System Components on the Natural Environment
PV Panel
The level of environmental impact during the operating period is negligible and is globally defined as a form of clean energy. After an operating period, large volumes of PV panels can be collected and recycled.
Positive impact during the operating period: the installation of solar cells has the effect of reducing water evaporation, reducing solar energy absorption, tends to decrease water temperature, increase dissolved oxygen concentration in water, and has good impact on the activities of fishery in the lake.
Substation
110 kV substations using oil-immersed transformers can be a source of water pollution, fire, and explosion hazards, threatening human life and property safety.
Power Line
Power lines are at risk of electrical safety for plants and animals when there is a ground fault, short circuit, or a violation of the grid safety corridor.
2.3.3. Effects on People’s Livelihood, National Security, History and Culture
The plant is built mostly on the lake and does not affect residents, a 110 kV transformer station is located on the land area that has been allocated by the local government for the investor to manage and protect the reservoir. The 110 kV connection line only affects people’s arable land, not people’s settlements.
The construction location does not affect national security or any historical- cultural relics of the area.
2.4. Incentives and Financial Support
2.4.1. Tax
According to Circular 78/2014/TT-BTC on 18 June 2014 guiding the implementation of the Law on income tax and Decree No. 218/2013/ND-CP on 26 December 2013 of the Government regulations on the implementation of the Law on income tax, the tax rates are as follows:
- ○
- First 4 years of profit: 0% tax rate
- ○
- Next 9 years: 5% tax rate
- ○
- Next 2 years: 10% tax rate
- ○
- The remaining years: 20% tax rate
2.4.2. Electricity Price
Electricity selling price in financial analysis 9.35 UScents/kWh applying Decision No. 11/2017/QD-TTg on 11 April 2017 on encouragement development mechanism of PV plants in Vietnam.
2.4.3. Loan Interest Rate
50%/70% (loan for imported equipment) is temporarily calculated from a credit source, and the supplier expects the interest rate in USD is 5.0%/year.
20%/70% loans for domestic items, commercial loans with a mobilizing interest rate of 9.5%/year.
2.4.4. Pay
Interest during construction (IDC) will be accrued to the commercial operation day (COD) and this accrued interest will be added to the principal payment during the course of commercial operation.
The principal and interest payment plan can be any one of the methods, depending on the agreement between the investor and the lending institutions. The plant is expected to pay the principal annually for 10 years and pay interest annually for 10 years after commercial operation.
2.5. Other Financial Parameters
Debt repayment: Interest during construction will be accrued through the date of commercial operation and this accrued interest will be added to the principal payment during commercial operation. The principal and interest payment plant can be selected, depending on the agreement between the Investor and the lending organizations. The plant is expected to pay the principal annually for 12 years and pay the interest every year for 12 years after commencing commercial operation.
Slippage of Vietnam Dong vs. the Dollar according to statistics from the last 10 years (2007–2016) averaged 4%/year, and in the last six years (2010–2016), was 3%/year. Over the life of the plant, the average price slippage is 2%/year for revenue calculation based on the central exchange rate set by the National Bank.
2.6. Cost of PV System
Technical and financial parameters relevant to the economic-financial analysis
Plant capacity: 47.5 MW
Power output: 69.99 million kWh/year
The highest rate of degradation of photovoltaic modules: 0.7%/year
Economic and financial life: 20 years
Operation and maintenance costs:
- ○
- Operation and maintenance (O&M) cost is temporarily calculated as: 1.2% (value of construction and equipment of the work) O&M cost increases every year by 2.5%.
- ○
- The cost of dismantling and handling the equipment of the PV plant after the end of the plant includes the following costs: the cost of dismantling the panels and equipment, the cost of transportation to the concentrated location, and the cost of treatment. The cost of handling PV panels is calculated by the cost of destroying the lead battery. All dismantling, transportation, and disposal costs are included in the final year operating costs of the plant.
2.6.1. Depreciation
- ○
- Depreciation of fixed assets by the linear method: Depreciation period of equipment is 10 years, depreciation of the remaining value is 15 years. Value for depreciation calculation is the total investment value of the plant.
2.6.2. Discount Factor
- ○
- Applying Decision No. 2014/QD-BCN on 13 June 2007 on promulgating provisional regulations on economic and financial analysis of investment by the Ministry of Industry and Trade in this plant are as follows:
- ○
- Analysis of financial performance: calculated according to the average financial discount rate for investment sources (WACC) is 7.03%.
- ○
- Economic discount rate 10%.
2.6.3. Total Investment
- ○
- Total investment includes all expenses, such as: costs of compensation, support and resettlement; construction cost; equipment cost; plant management cost; construction investment consulting cost; other expenses and provision expenses are presented in Table 5, below.
Table 5. Total investment amount (Unit: million VND).
3. Economy-Financial Analysis
3.1. Main Calculation
3.1.1. Net Profit Value—NPV
The plant’s NPV is calculated for the total investment cost of the plant, calculating both operation and maintenance costs using a simple formula assuming constant annual utilization of the system, operating costs and maintenance remains constant and total investment costs, with a focus on year 0:
- ○
- where, R is the annual revenue, com is the cost of operating and maintaining the system, IT is the total investment cost of the plant and
- ○
- where, a is the discount rate and n is the life of the plant in years.
For PV installations, while the panels come with a long 25-year performance warranty, the inverter is the weak point of the system that needs to be replaced. Therefore, the NPV formula has been modified to account for substitutions according to Equation (3) [17,35,44,45]:
- ○
- where, 𝐶𝑖𝑛𝑣 is the replacement cost of the inverters and 𝑛1, 𝑛2 and 𝑛3 is the year in which the replacement will take place.
NPV shows the feasibility or infeasability of a plant. When the NPV is positive, the investment is recouped, the minimum rate of capital return is achieved, a surplus is obtained, and thus, the plant is viable. When the NPV is negative, the plant is not profitable because the minimum rate of return is not achieved. The higher the discount rate, the lower the NPV.
3.1.2. Internal Rate of Return—ROI (IRR)
The internal rate of return defines the amount of profit gained by investing in an energy system. [8,17,35]. The internal rate of return measures the amount of profit relative to the cost of an investment. The return on an investment, in this case the savings accumulated over the life of the plant, is divided by the cost of the investment, in this case the initial investment. The results can be expressed as a ratio.
Solar plants will be profitable when IRR > Ik. Ik is the cost price determined by the loan interest rate or the required cost of the corresponding source of capital.
3.1.3. Benefit–Cost Ratio—B/C
Benefit–cost ratio: The ratio of the present value of benefits to the present value of costs.
- ○
- where, Bi is the revenue in year i, Ci is the cost at year i.
If the plant has a B/C greater than or equal to 1, the plant is financially viable. In the case of multiple plants that cancel each other, the B/C is a standard for ranking according to the principle of ranking higher for the plant with the larger B/C.
3.1.4. Payback Period—PP (Years)
A plant is considered good when it has a Payback Period that is less than the number of years of the life of the plant. It is inevitable that investors want to recover capital as quickly as possible, avoiding fluctuations and difficult-to-identify risks [10,17,35,46,47].
- ○
- where, Ct is discounted (net) cash inflow for the duration of investment ($), C0 is total initial investment costs ($), DPP is discounted payback period (years).
3.1.5. Net Present Cost—NPC
The net present cost of a cost analysis remark component taking into account all costs and revenues incurred over the plant’s lifespan. The total NPC is determined by Equation (7) [8,10,13,15,16,17,31,48,49].
- ○
- where Tp is the plant lifetime (year), Ctot,ann is the total annualized cost ($/year), i is the real interest rate (percent), and CRF is the capital recovery factor which is calculated by Equation (8) [8,10,13,15,16,17,31,48,49]:
- ○
- where n refers to the number of years.
Additionally, the operating cost is calculated by subtracting the total annual cost from the initial cost, as shown by Equation (9) [20].
The COE is the mean cost of fruitful electrical energy per kWh, and is one of the most important parameters for comparing the cost effectiveness of hybrid systems and for finding the optimal size of the system [8,9,10,13,15,17,20,50].
- ○
- where, Cann.t is the annualized total cost (including the component-related expenses such as capital, replacement, and maintenance ($)) and Eserved is the annual served energy (kWh).
3.2. National Economy Analysis of the Plant
The objective of the national economy analysis is to evaluate the feasibility and effectiveness of an investment plant for the economy. The analysis results are used to select the optimal parameters and layout of the works, as the basis for the competent authorities to decide whether to allow or not to allow the plant investment or to decide on mechanisms and policies to the investment support in order to encourage the plant implementation.
The socio-economic efficiency of an investment plant is the difference between the economic benefits that the national economy and society derive from the plant and the costs that society must spend when the plant is completed. The effects of the plant on the national economy will be analyzed in detail in both qualitative and quantitative terms.
3.2.1. Meeting the Demand for Electricity Load Growth
The floating PV plant at Da Mi hydropower reservoir, Binh Thuan province will partially meet the demand for the increased electricity load of the Vietnamese power system. On the other hand, the plant also contributes to increasing the proportion of renewable energy in the system, contributing to stabilizing the electricity supply for the economy.
3.2.2. Impact on the Environment
At present, the issue of environmental protection has become a global issue, attracting more and more attention from society; investment in the construction of PV plants and renewable energy sources is receiving more attention and becoming more popular.
Solar power is considered a clean energy source that does not pollute the air when producing electricity. Thereby, solar power can significantly reduce the amount of CO2 emitted into the environment by the power generation industry, contributing to a reduction in climate change and helping to protect the environment.
3.2.3. Other Effects
The floating PV plant at Da Mi hydropower reservoir, Binh Thuan province will play an important role in the development of the region’s electricity grid, as a basis for facilitating the development of other industries in the locality.
In addition, the construction of a PV plant on a hydroelectric reservoir is intended to make the most of the plant’s available resources to improve economic efficiency, and at the same time, to reduce the land fund used in the electricity production process. This also benefits the economy.
When the plant is put into operation, the number of human resources used in the PV plant is minimal. However, the PV plant needs to use trained local human resources, and some jobs use local untrained workers. This also contributes to increasing the income and stabilizing the lives of workers.
For state budget payment: will contribute to state budget revenue through taxes.
3.2.4. Evaluation of Economic Benefits with Other Alternative Energy Sources
With the current situation of the accompanying natural gas source having been reduced in output, the combined cycle thermal power plants must reduce capacity or run DO oil. According to Decision 428/QD-TTg on 18 March 2016 of the Prime Minister on approving the adjustment of the National Power Development Master Plant for the period 2011–2020 with a vision towards 2030, in the coming time, after about 2020, the need to import liquefied natural gas (LNG) to operate the Phu My, O Mon, Nhon Trach Power Centers with high fuel prices, the introduction of solar power into the power system is necessary to meet the national energy demand. According to the forecast of the General Power Plant 7, the price of liquefied natural gas in the period through 2025 will increase 2.5 times the current price, specifically:
The PNG source with the most potential is Indonesia’s Natuna D Alpha mine, with an output ranging from 5–7–10 billion m3/year, when considered after 2018, the estimated price is about 10 USD/million BTU.
Source of LNG: can be purchased on the world spot market or purchased under long-term contracts. In which, priority should be given to buy under long-term contracts from Australia, the Middle East, or Russia, with a forecast price of 12–14 USD/million BTU. To import by this method, it is necessary to build a system of LNG terminals.
The cost of operating power plants will increase; comparing the economic efficiency of a PV plant with a typical alternative source such as diesel thermal power, with cost-effectiveness at 90% capacity and updating, the current oil price is about 14.5 US cent/kWh, which is considered as input for comparison. The economic analysis results are shown in Table 6 below.
Table 6.
Economic analysis results.
3.3. Plant Financial Analysis
The objective of the financial analysis is to evaluate the feasibility of the plant from the investor’s view to orient the investor to the method of capital mobilization methods, financial mechanisms for the plant to achieve a reasonable level of profitability, ensuring the plant’s sustainable, long-term, and effective operation. Financial analysis results are the basis for prioritizing investment decisions.
For a plant to be considered financially viable, it must satisfy the following conditions:
- ○
- The financial internal rate of return FIRR must be greater than the cost of capital determined by the borrowing rate or the required cost of the corresponding source of capital.
- ○
- NPV > 0 when calculated according to the discount factor of each required capital source.
- ○
- Benefit-to-cost ratio B/C > 1
- ○
- The sooner the payback period, the better
Financial analysis results are shown in Table 7:
Table 7.
Financial analysis results.
In order to assess risks and find a safe margin for the plant, in financial analysis, it is necessary to analyze the sensitivity of changed levels in investment capital; generated electricity or operating hours; purchase price of main equipment of the PV plant; O&M costs; combination of changes in investment capital; and generated electricity.
Financial sensitivity analysis aims to consider the possibility of changes in economic and financial parameters affecting the financial evaluation criteria of the plant. Thereby helping investors make optimal investment decisions. Sensitivity analysis is conducted with the following cases (Table 8):
Table 8.
Sensitivity analysis results.
When considering the individual parameters: investment capital, electricity output, and O&M costs, the following chart shows the influence of factors on the efficiency of the plant (Figure 5):
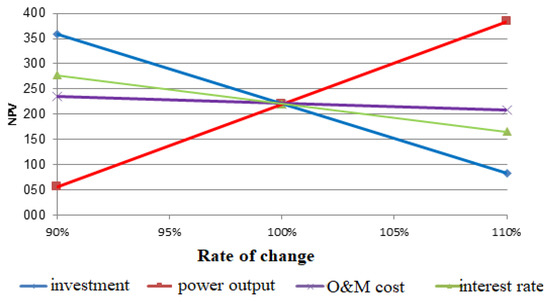
Figure 5.
Sensitivity analysis results.
From the results of the sensitivity analysis, it is shown that evaluating the financial efficiency in individual cases, considering the factors, investment capital increases, electricity decreases, and operating costs increase. With effective plant options, especially the plant of combining investment capital increased by 10% and electricity reduced by 10% of the plant did not guarantee financial efficiency.
However, in recent times, the price of panels has still been on a downward trend. Therefore, in order to increase the financial efficiency of the plant, the investor needs to manage the investment capital closely, combining effective management and operation to minimize the reduction of generating capacity. In addition, finding capital sources with low interest rates will also contribute to ensuring the financial efficiency of the plant.
4. Conclusions
Through the analysis and evaluation of both economic and financial aspects, it has been found that with the base cases of both:
Economic evaluation of the plant is the first main finding for the verification consultant and the national agency to select the solution and optimal plan, to compare the general economic criteria of the plant. The national economy points of view with the electricity price of 14.5 UScent/kWh, IRR = 17.2%, NPV = 664.3 billion VND, B/C = 1.55 > 1, payback period is 9.3 years and;
Financial evaluation of the plant based on the factors constituting the electricity price, including revenue sources, reasonable expenses through electricity selling price, risk evaluation from sensitive analysis results is the second main finding for investors to make investment decisions. The investor’s opinion with financial discount coefficient (iF = 6.95%); electricity selling price 9.35 UScent/kWh, IRR = 11.14%, NPV = 220.3 billion VND, B/C = 1211 > 1, payback period is 14.4 years.
Therefore, the plants are effective, have the ability to recover capital, and can ensure debt repayment obligations for banks as well as capital sponsors. The plant is feasible, considering both economic and financial aspects, especially taking advantage of the available space, helping to protect the environment and regulate the climate, replacing the PV plants installed on agricultural land, forest land, and buildings.
Author Contributions
Conceptualization, T.-T.B.; methodology, N.-H.N.; software, B.-C.L.; validation, N.-H.N. and B.-C.L.; formal analysis, N.-H.N. B.-C.L.; investigation, N.-H.N. and T.-T.B.; resources, N.-H.N. and T.-T.B.; data curation, N.-H.N. and T.-T.B.; writing—original draft preparation, N.-H.N. and B.-C.L.; writing—review and editing, N.-H.N. and T.-T.B.; visualization, N.-H.N. and B.-C.L.; supervision, N.-H.N. and B.-C.L.; project administration, N.-H.N. and T.-T.B.; funding acquisition, Nguyen, N.-H and T.-T.B. All authors have read and agreed to the published version of the manuscript.
Funding
This work was supported by Da Nhim - Ham Thuan - Da Mi Hydropower Joint Stock Company and Industrial University of Ho Chi Minh City, Ho Chi Minh 700000, Vietnam.
Institutional Review Board Statement
Not applicable.
Informed Consent Statement
Not applicable.
Data Availability Statement
All data generated or analyzed during this study are included in this published article.
Conflicts of Interest
The auhors declare no conflict of interest.
References
- Saavedra, M.M.R.; Fontes, C.H.d.O.; Freires, F.G.M. Sustainable and Renewable Energy Supply Chain: A System Dynamics Overview. Renew. Sustain. Energy Rev. 2018, 82, 247–259. [Google Scholar] [CrossRef]
- Dominkovi, D.F.; Bacekovi, I.; Sveinbjörnsson, D.; Pedersen, A.S.; Krajaci, G. On the way towards smart energy supply in cities: The impact of interconnecting geographically distributed district heating grids on the energy system. Energy 2017, 137, 941–960. [Google Scholar] [CrossRef]
- Erdiwansyah; Mamat, R.; Sani, M.; Sudhakar, K. Renewable energy in Southeast Asia: Policies and recommendations. Sci. Total Environ. 2019, 670, 1095–1102. [Google Scholar] [CrossRef] [PubMed]
- Daliento, S.; Chouder, A.; Guerriero, P.; Pavan, A.M.; Mellit, A.; Moeini, R.; Tricoli, P. Monitoring, Diagnosis, and Power Forecasting for Photovoltaic Fields: A Review. Int. J. Photoenergy 2017, 2017, 1356851. [Google Scholar] [CrossRef]
- Lin, A.; Lu, M.; Sun, P.; Lin, A.; Lu, M.; Sun, P. The Influence of Local Environmental, Economic and Social Variables on the Spatial Distribution of Photovoltaic Applications across China’s Urban Areas. Energies 2018, 11, 1986. [Google Scholar] [CrossRef]
- Alsafasfeh, M.; Abdel-Qader, I.; Bazuin, B.; Alsafasfeh, Q.; Su, W. Unsupervised Fault Detection and Analysis for Large Photovoltaic Systems Using Drones and Machine, Vision. Energies 2018, 11, 2252. [Google Scholar] [CrossRef]
- Zsiborács, H.; Baranyai, N.H.; Csányi, S.; Vincze, A.; Pintér, G. Economic Analysis of Grid-Connected PV System Regulations: A Hungarian Case Study. Electronics 2019, 8, 149. [Google Scholar] [CrossRef]
- Islam, M.M.M.; Kowsar, A.; Haque, A.K.M.M.; Hossain, M.K.; Ali, H.; Rubel, M.H.K.; Rahman, F. Techno-economic Analysis of Hybrid Renewable Energy System for Healthcare Centre in Northwest Bangladesh. Process Integr. Optim. Sustain. 2022, 1–14. [Google Scholar] [CrossRef]
- Ahmed, P.; Rahman, M.F.; Haque, A.K.M.M.; Mohammed, M.K.A.; Toki, G.F.I.; Ali, M.H.; Kuddus, A.; Rubel, M.H.K.; Hossain, M.K. Feasibility and Techno-Economic Evaluation of Hybrid Photovoltaic System: A Rural Healthcare Center in Bangladesh. Sustainability 2023, 15, 1362. [Google Scholar] [CrossRef]
- Chowdhury, T.; Chowdhury, H.; Hasan, S.; Rahman, S.; Bhuiya, M.M.K.; Chowdhury, P. Design of a stand-alone energy hybrid system for a makeshift health care center: A case study. J. Build. Eng. 2021, 40, 102346. [Google Scholar] [CrossRef]
- Glaisa, K.A.; Elayeb, M.E.; Shetwan, M.A. Potential of Hybrid System Powering School in Libya. Energy Procedia 2014, 57, 1411–1420. [Google Scholar] [CrossRef]
- Aisa, A.; Sharata, A.; Alkhrbash, A.A.; Almoner, M. Modeling and Simulation of a Hybrid Power System for Hospital in Sabratha, Libya via HOMER Software. In Proceedings of the 2022 IEEE 2nd International Maghreb Meeting of the Conference on Sciences and Techniques of Automatic Control and Computer Engineering (MI-STA), Sabratha, Libya, 23–25 May 2022; pp. 161–166. [Google Scholar]
- Aziz, A.S.; Tajuddin, M.F.N.; Adzman, M.R.; Mohammed, M.F.; Ramli, M.A.M. Feasibility analysis of grid-connected and islanded operation of a solar PV microgrid system: A case study of Iraq. Energy 2020, 191, 116591. [Google Scholar] [CrossRef]
- Al-Karaghouli, A.; Kazmerski, L.L. Optimization and life-cycle cost of health clinic PV system for a rural area in southern Iraq using HOMER software. Sol. Energy 2010, 84, 710–714. [Google Scholar] [CrossRef]
- Rad, M.A.V.; Vaghar, M.P.; Kouravand, A.; Bellos, E.; Kasaeian, A. Techno-economic evaluation of stand-alone energy supply to a health clinic considering pandemic diseases (COVID-19) challenge. Sustain. Energy Technol. Assess. 2022, 51, 101909. [Google Scholar]
- Isa, N.M.; Das, H.S.; Tan, C.W.; Yatim, A.H.M.; Lau, K.Y. A techno-economic assessment of a combined heat and power photovoltaic/fuel cell/battery energy system in Malaysia hospital. Energy 2016, 112, 75–90. [Google Scholar] [CrossRef]
- Riayatsyah, T.M.I.; Geumpana, T.A.; Fattah, I.M.R.; Rizal, S.; Mahlia, T.M.I. Techno-Economic Analysis and Optimisation of Campus Grid-Connected Hybrid Renewable Energy System Using HOMER Grid. Sustainability 2022, 14, 7735. [Google Scholar] [CrossRef]
- Sharma, S.K.; Palwalia, D.K.; Shrivastava, V. Performance Analysis of Grid-Connected 10.6 kW (Commercial) Solar PV Power Generation System. Appl. Sol. Energy 2019, 55, 269–281. [Google Scholar] [CrossRef]
- Shahzad, M.K.; Zahid, A.; Rashid, T.U.; Rehan, M.A.; Ali, M.; Ahmad, M. Techno-economic feasibility analysis of a solar-biomass off grid system for the electrification of remote rural areas in Pakistan using HOMER software. Renew. Energy 2017, 106, 264–273. [Google Scholar] [CrossRef]
- Alsagri, A.S.; Alrobaian, A.A.; Nejlaoui, M. Techno-economic evaluation of an off-grid health clinic considering the current and future energy challenges: A rural case study. Renew. Energy 2021, 169, 34–52. [Google Scholar] [CrossRef]
- Guerra, K.; Haro, P.; Gutiérrez, R.E.; Gómez-Barea, A. Facing the high share of variable renewable energy in the power system: Flexibility and stability requirements. Appl. Energy 2022, 310, 118561. [Google Scholar] [CrossRef]
- Karim, M.E.; Karim, R.; Islam, M.T.; Muhammad-Sukki, F.; Bani, N.A.; Muhtazaruddin, M.N. Renewable Energy for Sustainable Growth and Development: An Evaluation of Law and Policy of Bangladesh. Sustainability 2019, 11, 5774. [Google Scholar] [CrossRef]
- Kowsar, A.; Haque, N.; Islam, S.; Debnath, S.C.; Rahaman, M.; Alam, F. Techno-economic evaluation of a 29-kW micro-grid hybrid photovoltaic system for a healthcare center in Bangladesh. AIP Conf. Proc. 2022, 2681, 020071. [Google Scholar] [CrossRef]
- Montero, I.; Miranda, M.T.; Barrena, F.; Sepúlveda, F.J.; Arranz, J.I. Analysis of photovoltaic self-consumption systems for hospitals in southwestern Europe. Energy Build. 2022, 269, 112254. [Google Scholar] [CrossRef]
- Singh, A.; Baredar, P.; Gupta, B. Computational Simulation & Optimization of a Solar, Fuel Cell and Biomass Hybrid Energy System Using HOMER Pro Software. Procedia Eng. 2015, 127, 743–750. [Google Scholar] [CrossRef]
- Thevenard, D.; Pelland, S. Estimating the uncertainty in long-term photovoltaic yield predictions. Sol. Energy 2013, 91, 432–445. [Google Scholar] [CrossRef]
- Rojas-Zerpa, J.C.; Yusta, J.M. Application of Multicriteria Decision Methods for Electric Supply Plantning in Rural and Remote Areas. Renew. Sustain. Energy Rev. 2015, 52, 557–571. [Google Scholar] [CrossRef]
- Praveenkumar, S.; Agyekum, E.B.; Kumar, A.; Ampah, J.D.; Afrane, S.; Amjad, F.; Velkin, V.I. Techno-Economics and the Identification of Environmental Barriers to the Development of Concentrated Solar Thermal Power Plants in India. Appl. Sci. 2022, 12, 10400. [Google Scholar] [CrossRef]
- Ghaithan, A.M.; Mohammed, A. An Optimization Model for Sizing a Hybrid Photovoltaic-Wind-Grid-Connected System in Saudi Arabia. Process Integr. Optim. Sustain. 2022, 6, 1027–1042. [Google Scholar] [CrossRef]
- Adaramola, M.S.; Quansah, D.A.; Agelin-Chaab, M.; Paul, S.S. Multipurpose renewable energy resources based hybrid energy system for remote community in northern Ghana. Sustain. Energy Technol. Assess. 2017, 22, 161–170. [Google Scholar] [CrossRef]
- Lau, K.Y.; Tan, C.W.; Yatim, A.H.M. Effects of ambient temperatures, tilt angles, and orientations on hybrid photovoltaic/diesel systems under equatorial climates. Renew. Sustain. Energy Rev. 2018, 81, 2625–2636. [Google Scholar] [CrossRef]
- Nourdine, B.; Saad, A. Hybrid System for Powering Moroccan Healthcare Centers in Remote Rural Areas. J. Electr. Eng. Technol. 2021, 16, 809–820. [Google Scholar] [CrossRef]
- Olatomiwa, L.; Mekhilef, S. Techno-economic feasibility of hybrid renewable energy system for rural health centre (RHC): The wayward for quality health delivery. In Proceedings of the 2015 IEEE Conference on Energy Conversion (CENCON), Johor Bahru, Malaysia, 19–20 October 2015; pp. 504–509. [Google Scholar] [CrossRef]
- Rahman, M.M.; Saha, S.; Majumder, M.Z.H.; Suki, T.T.; Akter, F.; Haque, M.A.S.; Hossain, M.K. Energy Conservation of Smart Grid System Using Voltage Reduction Technique and Its Challenges. Evergreen 2022, 9, 924–938. [Google Scholar] [CrossRef]
- Zsiborács, H.; Baranyai, N.H.; Vincze, A.; Pintér, G. An Economic Analysis of the Shading Effects of Transmission Lines on Photovoltaic Power Plant Investment Decisions: A Case Study. Sensors 2021, 21, 4973. [Google Scholar] [CrossRef] [PubMed]
- Wang, C.; Liu, Y.; Zhang, X.; Yang, X.T. Simulation Design and Benefit Analysis of Grid-Connected Photovoltaic System. Appl. Mech. Mater. 2014, 694, 169–172. [Google Scholar] [CrossRef]
- Zsiborács, H.; Pályi, B.; Baranyai, H.N.; Veszelka, M.; Farkas, I.; Pintér, G. Energy performance of the cooled amorphous silicon photovoltaic (PV) technology. Idojaras 2016, 120, 415–430. [Google Scholar]
- International Energy Agency. Technology Roadmap Solar Photovoltaic Energy; International Energy, Agency: Paris, France, 2014; pp. 1–60. [Google Scholar]
- Green, M.A.; Emery, K.; Hishikawa, Y.; Warta, W.; Dunlop, E.D. Solar cell efficiency tables (version 48). Prog. Photovolt. Res. 2016, 24, 905–913. [Google Scholar] [CrossRef]
- Benick, J.; Richter, A.; Muller, R.; Hauser, H.; Feldmann, F.; Krenckel, P.; Riepe, S.; Schindler, F.; Schubert, M.C.; Hermle, M. High-Efficiency n-Type HP mc Silicon Solar Cells. IEEE J. Photovolt. 2017, 7, 1171–1175. [Google Scholar] [CrossRef]
- Green, M.A.; Hishikawa, Y.; Dunlop, E.D.; Levi, D.H.; Hohl-Ebinger, J.; Ho-Baillie, A.W.Y. Solar cell efficiency tables (version 51). Prog. Photovolt. Res. 2018, 26, 3–12. [Google Scholar] [CrossRef]
- Panasonic Corporation. Solar Cell Achieves World’s Highest Energy Conversion Efficiency of 25.6% at Research Level. Available online: http://news.panasonic.com/global/press/data/2014/04/en140410-4/en140410-4.html (accessed on 15 February 2018).
- SecondSol Inc. New and Used PV Module Prices. Available online: https://www.secondsol.com/en/categories/Photovoltaic-Modules_40939 (accessed on 20 February 2018).
- Gionta, E. Design, Feasibility study and environmental analysis of a grid connected PV system in Cambodia. Thesis to obtain the Master of Science Degree in Energy Engineering and Management. Master’s Thesis, TÉCNICO LISBOA, Lisbon, Portugal, November 2018. [Google Scholar]
- HOMERPro. HOMER Help Files; HOMER Pro, version 3.14.5; HOMER Grid: Boulder, CO, USA, 2021. [Google Scholar]
- Brealey, R.; Myers, S.; Allen, F. Principles of Corporate Finance, 13th ed.; McGraw-Hill/Irwin: New York, NY, USA, 2019. [Google Scholar]
- Mandal, S.; Das, B.K.; Hoque, N. Optimum sizing of a stand-alone hybrid energy system for rural electrification in Bangladesh. J. Clean. Prod. 2018, 200, 12–27. [Google Scholar] [CrossRef]
- Peerapong, P.; Limmeechokchai, B. Optimal electricity development by increasing solar resources in diesel-based micro grid of island society in Thailand. Energy Rep. 2017, 3, 1–13. [Google Scholar] [CrossRef]
- Singh, S.; Singh, M.; Kaushik, S.C. Feasibility study of an islanded microgrid in rural area consisting of PV, wind, biomass and battery energy storage system. Energy Convers. Manag. 2016, 128, 178–190. [Google Scholar] [CrossRef]
- Heydari, A.; Askarzadeh, A. Optimization of a biomass-based photovoltaic power plant for an off-grid application subject to loss of power supply probability concept. Appl. Energy 2016, 165, 601–611. [Google Scholar] [CrossRef]


Disclaimer/Publisher’s Note: The statements, opinions and data contained in all publications are solely those of the individual author(s) and contributor(s) and not of MDPI and/or the editor(s). MDPI and/or the editor(s) disclaim responsibility for any injury to people or property resulting from any ideas, methods, instructions or products referred to in the content. |
© 2023 by the authors. Licensee MDPI, Basel, Switzerland. This article is an open access article distributed under the terms and conditions of the Creative Commons Attribution (CC BY) license (https://creativecommons.org/licenses/by/4.0/).