Abstract
This study proposes a new algorithm for a higher-order vector finite element method based on two new types of second-order edge elements to solve the electromagnetic field diffusion problem in a 3D anisotropic medium. To avoid source singularity in the quasistatic variant of Maxwell’s function, a secondary field formulation was adopted. The modeling domain was discretized using two types of quadratic edge hexahedral elements, which were obtained using the edge unification method to reduce variables on each side of two conventional quadratic edge elements. Compared with the traditional quadratic element, the number of unknowns that needed to be solved was significantly reduced. The sparse linear equation of the finite element system was solved using an open-source direct solver called MUMPS. The numerical results demonstrated that the proposed algorithm has the same level of accuracy as the conventional vector finite element method and has a significant advantage over it in terms of computational cost.
1. Introduction
The marine controlled-source electromagnetic method (MCSEM) uses controllable artificial field sources to transmit electromagnetic signals in the ocean and measures the electric or magnetic fields at a location far away from the field source to detect the electrical distribution of the media below the seabed. The resistance characteristics of oil and gas reservoirs are the most important properties, which can generate characteristic surface electromagnetic signals. In other words, MCSEM technology can distinguish underground oil and gas from other fluids. In theory, CSEM measurement is to record data with multiple power-receiver offsets, several different frequencies, and a certain power-receiver arrangement. The marine controlled-source electromagnetic (MCSEM) method has become a popular geophysical exploration tool for offshore hydrocarbon (HC) exploration [1,2,3]. During the last decade, marine CSEM has been widely used to reduce ambiguities in data interpretation and reduce the risk of exploration. With the rapid development of MCSEM exploration instruments, large-scale and high-quality data have been obtained, resulting in the need to develop high-precision MCSEM three-dimensional (3D) data interpretation tools. The 3D inversion algorithm technology of MCSEM is commonly used for data interpretation. Forward modeling is the basis of inversion, and high-precision forward modeling technology is key to achieving high-precision inversion.
The integral equation (IE) [4,5,6], finite difference (FD) [7,8,9,10,11,12], and finite element (FE) methods [13,14,15,16,17] are popular numerical techniques for electromagnetic (EM) field modeling. In the FE method, it is easier to use an unstructured mesh to create an irregular body, locally refine the interest region, and coarsen the boundary area of the model domain [15]. With this processing, numerical modeling becomes efficient and effective. Therefore, these advantages make the FE method more suitable for simulating the complex EM response of irregular models than FD and IE methods.
Compared with the conventional finite element method, which is based on a node, the edge-based finite element method has the advantage that divergence-free conditions are automatically satisfied by appropriately selected basic functions [18]. In recent years, the vector finite element method based on edge elements has been used to solve the electromagnetic field problem, and is known as Maxwell’s equations [19,20]. It should be noted that to date, most formulations for the 3D CSEM problem have implemented the lowest order. In addition, some studies have used higher-order elements to solve three-dimensional forward modeling of CSEM, but these were all aimed at tetrahedral elements [14,21]. To the best of our knowledge, no high-order hexahedron element is currently used for three-dimensional forward modeling of the controlled-source electromagnetic method. As we know, high-order edge elements can provide accurate solutions but result in an increase in unknown variables and lead to larger computing costs. Fortunately, we can improve the accuracy of the solution at a small computational cost by eliminating some variables when using higher-order elements [22,23].
In this study, we applied the unification method to the edge to reduce one edge variable on each side of the conventional serendipity and the Lagrange-type quadratic hexahedral element, resulting in two new types of second order edge elements. We also introduced a new vector FE method based on the proposed elements to solve the 3D marine CSEM modeling problem in an anisotropic medium. For a complex bathymetry simulation, we used a general hexahedral element to discretize the modeling domain. We validated our code by using several models in isotropic and anisotropic media.
2. Theory
In geophysical applications, the displacement current is typically ignored when the frequency of the electromagnetic field is low. Maxwell’s equations can then be simplified as follows [24]:
where the space magnetic permeability is denoted by , angular frequency is denoted by , source current is denoted by , and conductivity tensor is denoted by :
where , and are principal conductivities. In this study, we discuss only the principal axis anisotropy case. However, our formulation also works in the case of general anisotropy.
Calculate the curl at the left and right ends of Equation (1), and use Equation (2) to eliminate the magnetic field:
The total and secondary field formulations are two types of formulations that are typically used for solving the 3D MCSEM modeling problem. In contrast to the total field formulation, the secondary field formulation’s source term comprises a primary electric field. This type of source term is smoother than the current source used in the total-field formulation. Therefore, in this study, we use a secondary field formulation to address the marine CSEM modeling problem in an anisotropic medium. In this formulation, the total field can be decomposed into two parts: the background (primary field, ) and the anomaly fields (secondary field, ):
Similarly, the conductivity tensor can be decomposed into background () and anomalous conductivities ():
With substitution of Equations (5) and (6) into Equation (4), the Helmholtz equation with the electric component of the secondary field can be written as:
The secondary magnetic component can easily be calculated using Equation (8) once the secondary electric component in Equation (7) can be solved:
3. Edge-Based Finite Element Analysis
In this study, we used the edge-based FE method with quadratic elements, as discussed in the previous section. We used the edge shape function to approximate the secondary electric field within an edge element:
where denotes the total number of edges in the edge element. For the first-order edge element, the ; for conventional serendipity and Lagrange-type second-order hexahedral elements, and , respectively.
By substituting (9) into (7) and applying the Galerkin method, we can determine that the weak form of the original differential equation is:
where denotes the modeling area.
Applying first vector Green’s theorem to Equation (10), the secondary electric field is given, and it is continuous across the inner boundary; the surface term in Equation (10) vanishes. Then, the discretized form of Equation (10) for each element can be expressed as follows:
where and and are the local stiffness matrices defined as follows:
where denotes the domain of an element.
By assembling a global matrix with local matrices, a linear equation for the elements is obtained. The equation is typically sparse:
Here denotes the global stiffness matrix, and denotes the RHSs of the equations.
To solve Equation (14), a proper condition should be added to the equation. For simplicity, let us consider the homogeneous Dirichlet boundary condition:
Here, is the boundary area.
IDR(s) iterative solvers with an ILU preconditioner were used to solve the linear equations in Equation (15).
4. First and Conventional Quadratic Edge Elements
In the edge-based FE method, we can use regular rectangular, general tetrahedral, general hexahedral, or other complex elements to discretize the modeling domain. To simplify the problem and simulate bathymetry, hexahedral elements were used to discretize the modeling domain in this study.
To calculate the stiffness matrix of the hexahedral element, a general hexahedral element should be transformed into an origin-centered cubic element. A general hexahedron in Cartesian coordinates is shown in Figure 1a, and a transformed reference domain (cubic element) in Cartesian coordinates is shown in Figure 1b.
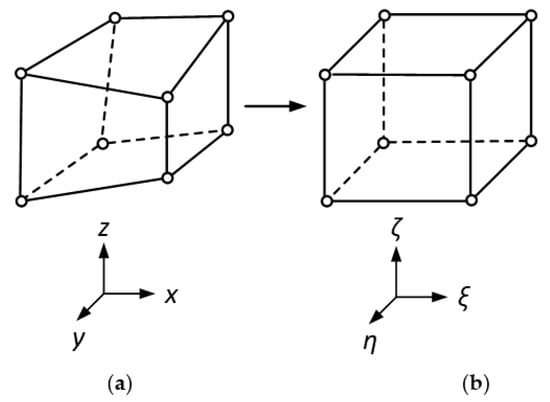
Figure 1.
(a) Hexahedron element in Cartesian coordinates ; (b) the transformed cubic element in Cartesian coordinates .
The transformation can be described by the following formulas [25]:
where is the scalar node-based shape function, which can be defined as follows:
where is a local node index of the element.
In the analysis of the vector finite element, two volume integrals (12)–(14) must be evaluated. For a hexahedron element, it is easy to transform with two integrals in the -coordinate using the Jacobian transform:
and denote the Jacobian matrix and determinant of , respectively.
In the next section, we introduce several conventional first-order and quadratic hexahedral elements and two quadratic edge hexahedral elements of the new type.
4.1. First-Order Edge Hexahedral Element
A conventional first-order hexahedral element is shown in Figure 2, which has eight nodes and twelve edges. The shape function of the edge on the sides along the -axis direction are accordingly defined as [25]:
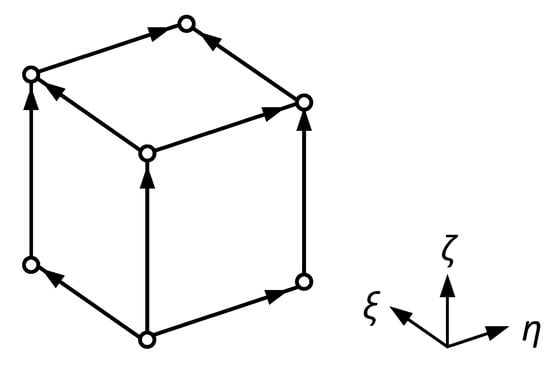
Figure 2.
Conventional first-order edge hexahedral element.
Similarly, the shape function of the edge on the sides along the -axis or -axis direction is defined as:
and
where , and denote the local coordinate in the elements.
4.2. A Quadratic Hexahedron Element of a Conventional Serendipity Type
Figure 3 shows a conventional serendipity quadratic hexahedron element with 12 edges on its surface, 20 nodes in the element, and 24 edges on the sides. The shape function for the serendipitous quadratic hexahedron element can be defined as follows: the shape function of the edge on sides which along -axis direction should be:
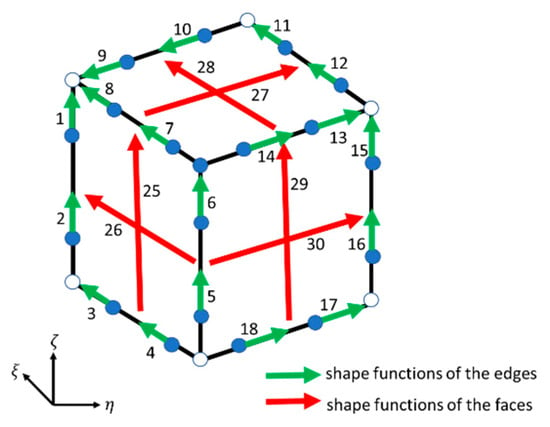
Figure 3.
The location and number of shape functions of a conventional serendipity quadratic hexahedron element (SC). The green arrows and the red arrows represent the shape functions on the edge and on the face, respectively.
The edge shape function of the edges along the -axis direction on the surface:
The edge shape function of the edges along the -axis direction on the surface:
The sides along the -axis direction on the sides:
The edges along the -axis direction on the surface:
The edges along the -axis direction on the surface:
The edges along the -axis direction on the surface:
4.3. Lagrange Quadratic Hexahedron Element
Figure 4 shows a Lagrange quadratic hexahedron element (LC) with 27 nodes and 24 edges on the sides, 24 edges on the surface, and 8 edges within the element. The shape function of the Lagrange quadratic hexahedron element is defined as the edges on the sides along the -axis direction:
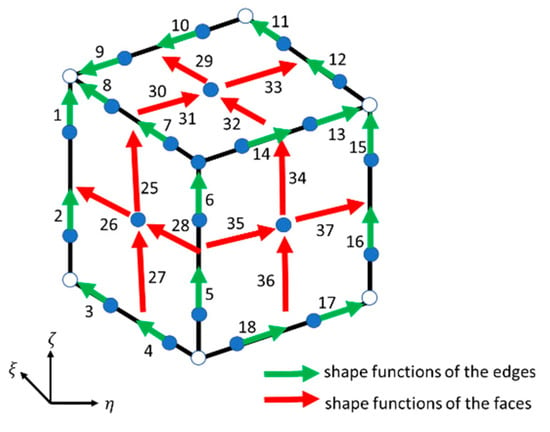
Figure 4.
The location and number of shape functions of a Lagrange quadratic hexahedron element (LC). The green arrows and the red arrows represent the shape functions on the edges and on the faces, respectively.
The edges along -axis direction on the surface:
The edges along the -axis direction on the surface:
The edges along -axis direction within the element:
The edges along -axis direction on the sides:
The edges along the -axis direction on the surface:
The edges along the -axis direction on the surface:
The edges along the -axis direction within the element:
The edges along the -axis direction on the sides:
The edges along the -axis direction on the surface:
The edges along the -axis direction on the surface:
The edges along the -axis direction within the element:
4.4. A New Type of Quadratic Edge Element
There are two edges on the side of a conventional quadratic hexahedron element. Within an edge element, because the curls of the edge shape functions are linearly dependent, many edge variables are redundant. The computation time and storage requirements of these elements has increased significantly. Therefore, eliminating these redundant variables helps improve efficiency at no cost to computational accuracy. In this section, we adopt a new method to eliminate redundant variables from the conventional quadratic element.
Let us first consider a one-sided conventional quadratic edge element, as shown in Figure 3 and Figure 4. We named the two edges on this side edge1 and edge2. and are the shape functions of edge1 and edge2, and their corresponding edge variables are and . Because one of these is redundant, we decided to eliminate and consider . Assume is the vector field interpolation contribution of the two edges:
Make a line integration of along this side and name it as . Note that the following integration is orthogonal:
Here, is the differential vector of the line element along edge and represents the Kronecker delta. Thus, the integration is written as:
Then Equation (47) is rewritten as:
In Equation (50), we obtain a new shape function for the edge, as shown in Figure 5b. According to this, can be written in detail as follows:
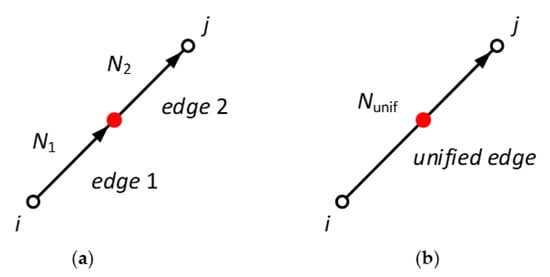
Figure 5.
Two-edge unification: (a) edge before unification; (b) edge after unification.
For the serendipity quadratic hexahedron element, the edges on the sides along the -axis direction:
The edges on the sides along -axis direction:
The edges on the sides along the -axis direction:
For the Lagrange quadratic hexahedron element, the edges on the sides along the -axis direction:
The edges on the sides along the -axis direction:
The edges on the sides along the -axis direction:
The shape functions of the edges in the element and the faces remained intact. Therefore, we obtained two new quadratic edge elements (Figure 6). There is only one edge on the sides of the two new quadratic edge elements (Figure 6); therefore, the redundant variable can be effectively eliminated. Table 1 lists various types of elements and the distribution of their basis functions.
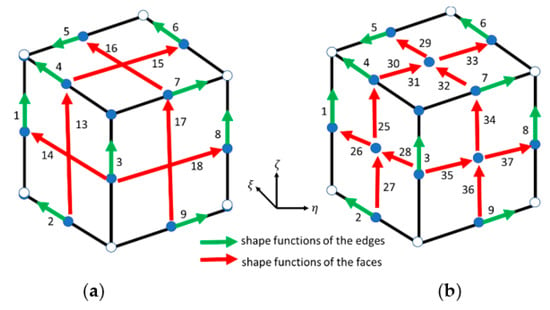
Figure 6.
The location and number of shape functions of two new types quadratic elements: (a) new serendipity quadratic element (SN); (b) new Lagrange quadratic element (LN). The green arrows and the red arrows represent the shape functions on the edges and on the faces, respectively.

Table 1.
Elements and the distribution of their basic functions.
4.5. Interpolation and Convergence
Interpolation capacity and convergence tests are performed using two new types of second-order element. Those functions are approximated in the domain defined by . Figure 7 shows the error of interpolation of the tested functions and their respective convergence rates. The two basis functions (SC, LC) have similar convergence rates, both close to one.
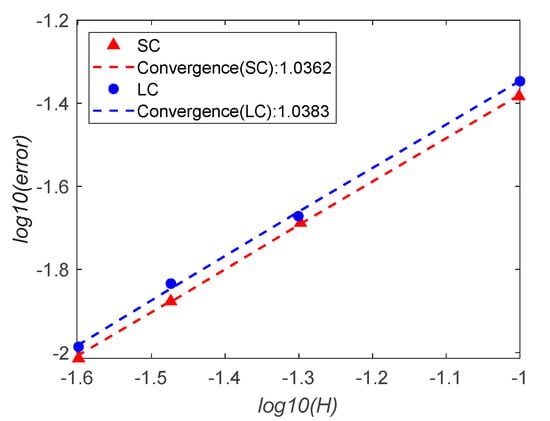
Figure 7.
Interpolation errors and convergence rates for the two basis functions approximated by EFEM. H is the length of edge of a element.
5. Model Studies
All MCSEM response simulations were performed on a platform with hardware and operation, as follows. The CPU was a double Intel processor, each processor having 6 cores and 12 threads, and RAM memory was 64 GB at a frequency of approximately 1333 MHz. The operating system was a 64-bit Windows 7 professional version.
5.1. Verification of the New Algorithm
To verify the new algorithm, an isotropic horizontal layered geoelectrical model, as shown in Figure 8, was considered first. In this model, air and seawater were thick. A thin-layer reservoir was embedded in the sediment at to depth. The EM field response was based on the model presented in Table 2. An x-oriented frequency current source was placed at the location . The receiving stations were located on the seafloor . The modeling domain was square and 4 km in the vertical direction . A non-uniform rectangular grid was used to discretize . We refined the grid near the current source, receiving stations, and target layer. The analytical response was calculated using the numerical integration of the Hankel transform [25,26,27,28,29].
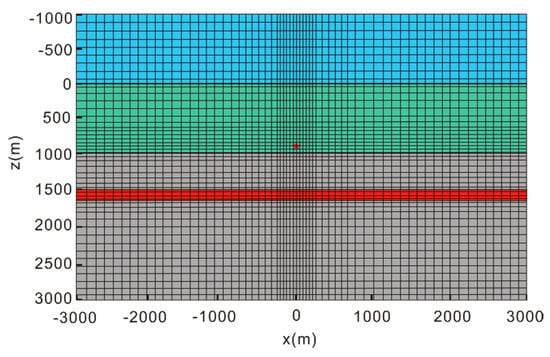
Figure 8.
Horizontally layered geoelectric model with rectangular mesh; the red star denotes the electric dipole source. The blue, green, red and gray areas represent the air layer, sea water, oil and gas, and bedrock, respectively.

Table 2.
The conductivities of an isotropic horizontally layered geoelectric model.
Figure 9 and Figure 10 show the difference in the -component of the electric field by applying conventional serendipity (SC)-and Lagrange (LC)-type second-order hexahedral elements, and the proposed elements (new serendipity (SN) and Lagrange element (LN)). These new quadratic edge elements were at the same level of accuracy as conventional quadratic elements, both higher than that of linear edge elements.
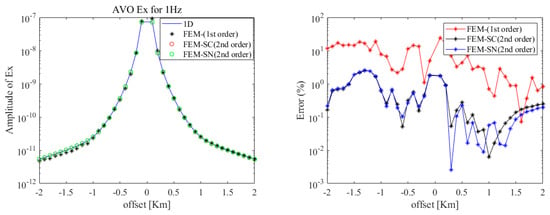
Figure 9.
A comparison of -component of the electric field using different FEM methods (serendipity-type second-order element) with the analytical solution.
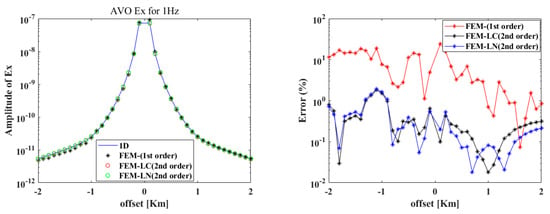
Figure 10.
A comparison of the -component of the secondary electric field by using different FEM methods (Lagrange-type second-order element) with the analytical solution.
Table 3 lists the CPU times for different elements. Less time was required when using new quadratic elements than when using conventional quadratic elements. Therefore, one can say that the computation is reduced at no cost to accuracy.

Table 3.
The comparison of CPU time by using different methods.
5.2. Off-Shore Hydrocarbon ReservoirMmodel
Consider a geoelectric model with a hydrocarbon reservoir embedded in sediment, as shown in Figure 11 and Figure 12. In this model, air and seawater were thick, similar to the previous model. The conductivity values of each component are listed in Table 4. The modeling domain was a × 4 km cube with . The hydrocarbon reservoir was buried deep and occupied a area horizontally. An -oriented 1 Hz frequency current source was placed at the location . Receiving stations were placed on the seafloor . We used the same type of rectangular grid used in the previous model to discretize the model domain. We also refined the local grid for the current source, receiving stations, and the target layer area.
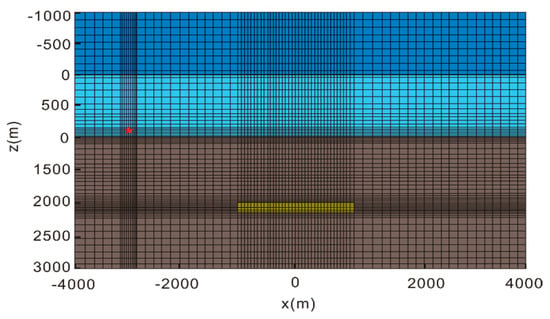
Figure 11.
Horizontally layered geoelectrical model with rectangular mesh. The red star identifies the location of the current source. The dark blue, light blue, yellow, and brown areas represent the air layer, sea water, reservoir, and sediment, respectively.
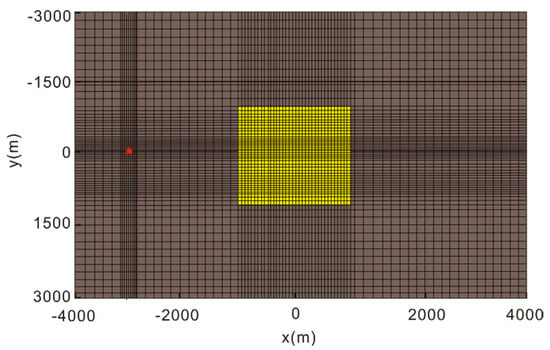
Figure 12.
Plane view of the grid. The yellow area is the area occupied with reservoir, and the red star identifies the location of the current source.

Table 4.
The conductivities of a hydrocarbon reservoir geoelectrical model.
Figure 13 and Figure 14 show the -component of the secondary electric field calculated with different edge elements. The results of the four types of second-order elements were in agreement with each other. Furthermore, a strong anomalous field distortion caused by the background conductivity anisotropy can also be observed. Table 5 shows the cost-time of calculation with four types of quadratic edge elements. Similar to the previous model, the efficiencies of the two types of quadratic edge elements (SN and LN) were higher than those of conventional serendipity or Lagrange-type quadratic hexahedron elements (SC, LC).
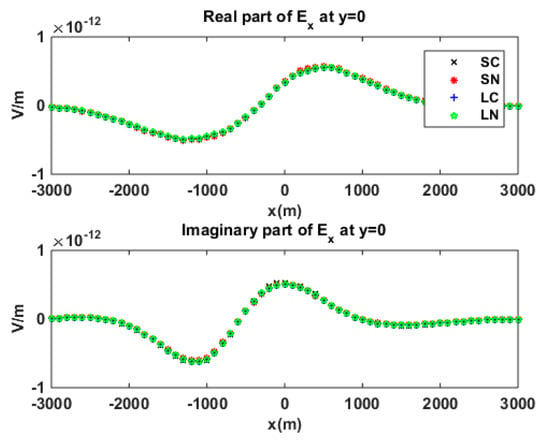
Figure 13.
Secondary electric component in the -direction, calculated by using different elements for isotropic sediment.
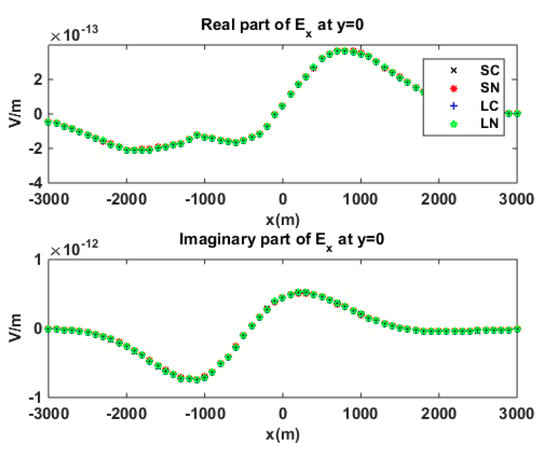
Figure 14.
Secondary electric component in the -direction, calculated by using different elements for anisotropic sediment.

Table 5.
The cost-time of CPU when using different methods.
5.3. Pyramid Type Bathymetry Model
Further verification of the new algorithm was performed by considering a pyramid-type bathymetry model (Figure 15) without a reservoir. The top area of the pyramid-type bathymetry model was in square, at depth. The bottom area was square, at in depth. Air and sea water were thick. In the domain of pyramid-type bathymetry, the depth of seawater ranges from to . Figure 16 shows the pyramid-type bathymetry model with a reservoir. The domain of the reservoir was . The modeling domain was . In these models, the conductivities of air, seawater, and sediment were the same as previously, whereas the reservoir’s conductivity was . The electric dipole source was -oriented at at frequency, and the receiving station was located at .
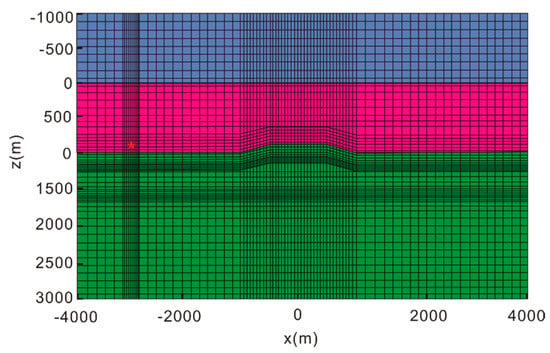
Figure 15.
Section view of the grid used for the bathymetry model without reservoir. The red star locates the dipole source. The dark blue, pink, blue, and green areas represent the air layer, sea water, oil and gas, and bedrock, respectively.
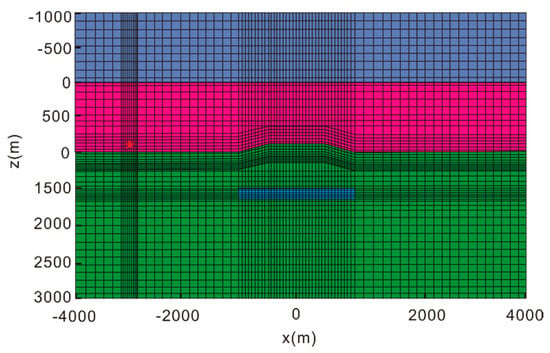
Figure 16.
Section view of the grid used for the bathymetry model with reservoir. The reservoir occupies the blue area, and the current source is located at the red star. The dark blue, pink, blue, and green areas represent the air layer, sea water, oil and gas, and bedrock, respectively.
Figure 17, Figure 18, Figure 19 and Figure 20 show the secondary electric component in the -direction of the bathymetry model, which has no reservoir or one reservoir in the isotropic sediment. Figure 21, Figure 22, Figure 23 and Figure 24 show a comparison of the -component of the secondary electric field of the bathymetry model with and without a reservoir in anisotropic sediment. Bathymetry and anisotropic background clearly affected the distribution of the marine controlled-source electromagnetic field (Figure 18, Figure 19, Figure 20, Figure 21, Figure 22, Figure 23 and Figure 24), which should be considered in the processing of MCSEM data. Figure 25 and Figure 26 show a comparison of the degrees of freedom (DOF) and CPU time using different elements, respectively. Clearly, these two new elements contributed significantly to reducing the CPU time in computing.
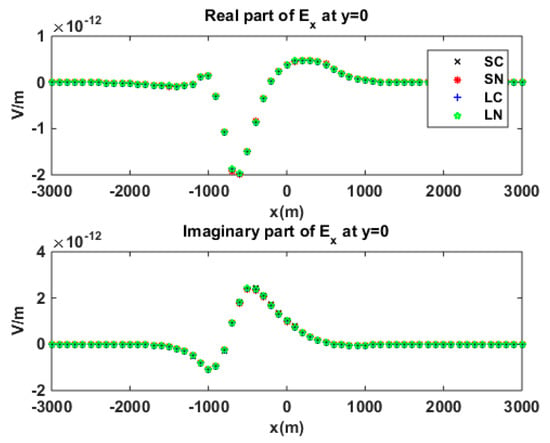
Figure 17.
No-reservoir bathymetry model in isotropic sediment. The secondary electric field was calculated by using different second-order edge elements; here is the comparison.
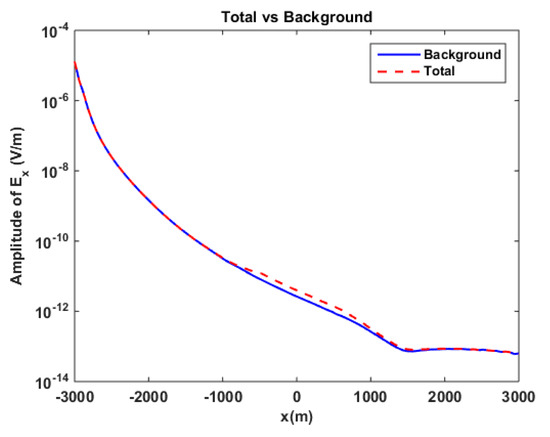
Figure 18.
No-reservoir bathymetry model in isotropic sediment. Amplitude comparison between background field (blue line) and total field (dashed red line) for component, at .
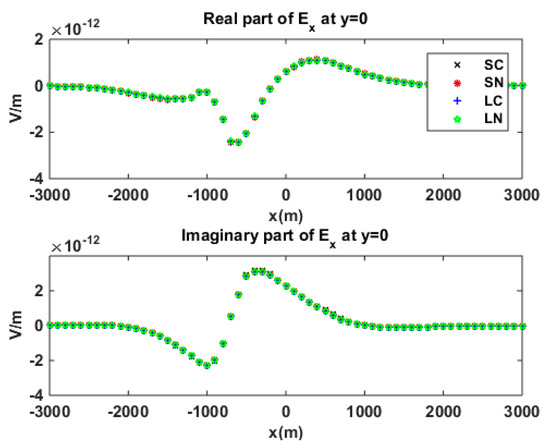
Figure 19.
Reservoir-embedded bathymetry model in isotropic sediment. Second electric component in the -direction, which was calculated by using different quadratic edge elements.
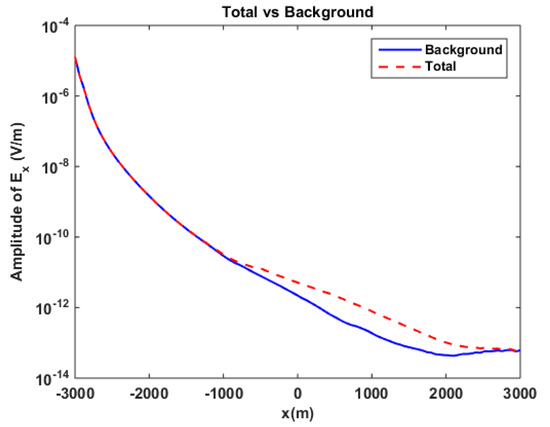
Figure 20.
Reservoir-embedded bathymetry model in isotropic sediment. Amplitude comparison between background field (blue line) and total field (dashed red line) for component, at .
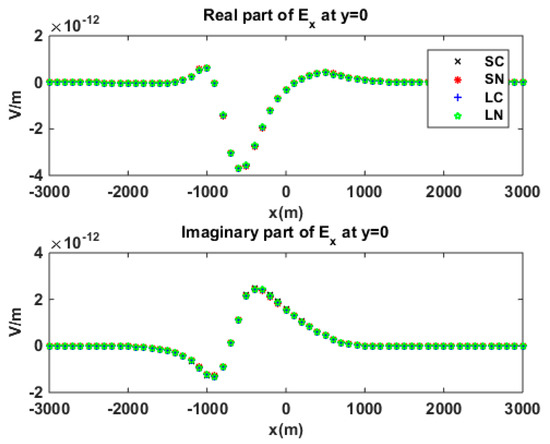
Figure 21.
No-reservoir bathymetry model in anisotropic sediment. Second electric component in the -direction, which was calculated by using different quadratic edge elements.
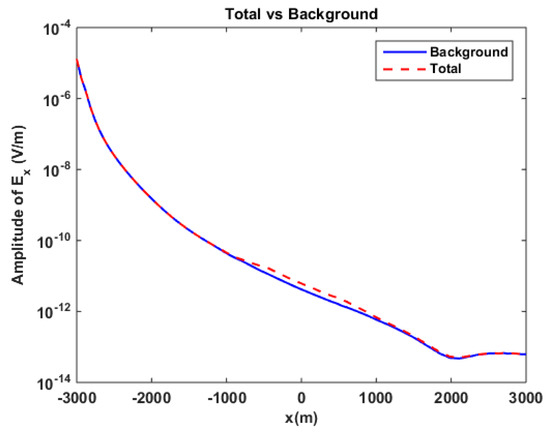
Figure 22.
No-reservoir bathymetry model in anisotropic medium. Amplitude comparison between background field (blue line) and total field (dashed red line) for component, at .
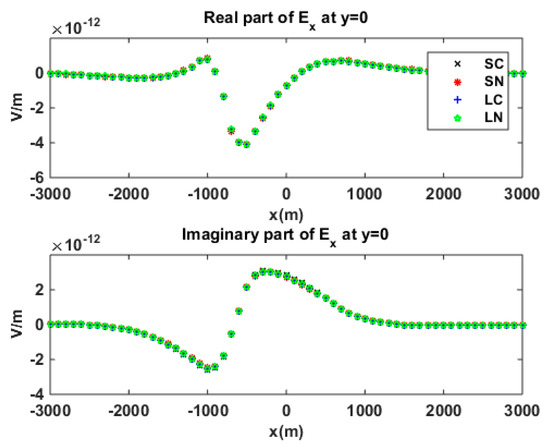
Figure 23.
Reservoir-embedded bathymetry model in anisotropic sediment. Second electric component in the -direction, which was calculated by using different quadratic edge elements.
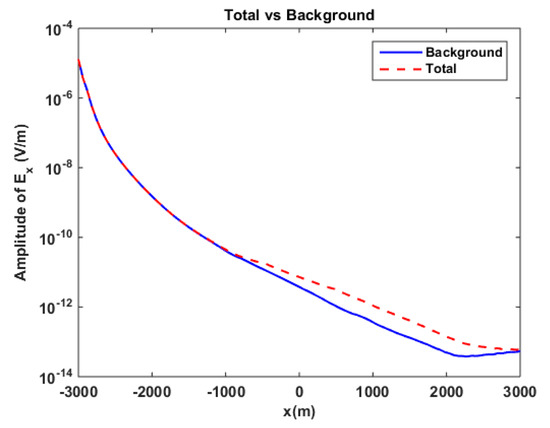
Figure 24.
Bathymetry model with a reservoir in anisotropic medium. Amplitude comparison between background field (blue line) and total field (dashed red line) for component, at .
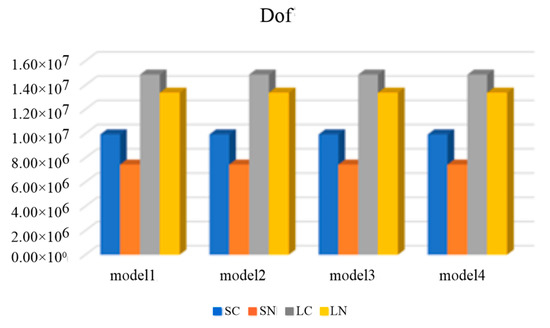
Figure 25.
A comparison of DOF using different elements. Model 1 = bathymetry + isotropic sediment; model 2 = bathymetry + isotropic sediment + reservoir; model 3 = bathymetry + anisotropic sediment; model 4 = bathymetry + anisotropic sediment + reservoir.
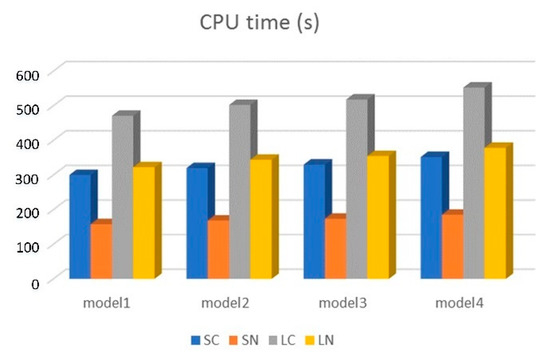
Figure 26.
Comparison of CPU time using different elements. Model 1 = bathymetry + isotropic sediment; model 2 = bathymetry + isotropic sediment + reservoir; model 3 = bathymetry + anisotropic sediment; model 4 = bathymetry + anisotropic sediment + reservoir.
6. Conclusions
We developed a new vector finite element algorithm to solve the 3D marine CSEM modeling problem in an anisotropic medium. An algorithm based on a secondary field formulation and two new quadratic edge elements was proposed. Compared with the vector FEM algorithm based on the conventional quadratic edge element, the proposed algorithm significantly reduced the computational cost without losing accuracy. The algorithm in this paper has good generality and is suitable for solving other electromagnetic induction problems in isotropic and anisotropic media, including airborne and borehole electromagnetic methods.
Author Contributions
Conceptualization, B.X. and H.C.; methodology, H.C.; software, H.C. and Y.L.; validation, Z.C. and Y.H.; formal analysis, Y.L.; investigation, H.L.; resources, H.C.; data curation, H.C.; writing—original draft preparation, H.C.; writing—review and editing, Y.L.; visualization, B.X.; supervision, B.X. and H.C.; project administration, B.X.; funding acquisition, H.C. and B.X. All authors have read and agreed to the published version of the manuscript.
Funding
This research was supported by the National Natural Science Foundation of China No. 42174080. It was also supported by the Natural Science Foundation of Guangxi (No. 2020GXNSFAA297079) and the China Postdoctoral Science Foundation funded project (No. 2021MD703820) and the Research Start-up Foundation of Guilin University of Technology (No. RD2100002165).
Institutional Review Board Statement
The study did not require ethical approval.
Informed Consent Statement
The study did not involve humans.
Data Availability Statement
The data is unavailable due to privacy or ethical restrictions.
Conflicts of Interest
The authors declare no conflict of interest.
References
- Constable, S.; Srnka, L.J. An introduction to marine controlled source electromagnetic methods for hydrocarbon exploration. Geophysics 2007, 72, WA3–WA12. [Google Scholar] [CrossRef]
- Constable, S. Ten years of marine CSEM for hydrocarbon exploration. Geophysics 2010, 75, A67–A81. [Google Scholar] [CrossRef]
- Weitemeyer, K.; Gao, G.; Constable, S.; Alumbaugh, D. The practical application of 2D inversion to marine controlled-source electromagnetic data. Geophysics 2010, 75, F199–F211. [Google Scholar] [CrossRef]
- Wannamaker, P.; Hohmann, G.; San Filipo, W. Electromagnetic modeling of 3-dimensional bodies in layered earths using integral equations. Geophysics 1984, 49, 60–74. [Google Scholar] [CrossRef]
- Avdeev, D.B.; Kuvshinov, A.V.; Pankratov, O.V.; Newman, G.A. High performance three-dimensional electromagnetic modeling using modified Neumann series: Wide band numerical solution and examples. J. Geomag. Geoelectr. 1997, 49, 1519–1539. [Google Scholar] [CrossRef]
- Zhdanov, M.S.; Fang, S. Quasi-linear series in three-dimensional electromagnetic modeling. Radio Sci. 1997, 32, 2167–2188. [Google Scholar] [CrossRef]
- Newman, G.A.; Alumbaugh, D.L. Frequency-domain modelling of airborne electromagnetic responses using staggered finite differences. Geophys. Prospect. 1995, 43, 1021–1042. [Google Scholar] [CrossRef]
- Davydycheva, S.; Druskin, V.; Habashy, T. An efficient finite difference scheme for electromagnetic logging in 3D anisotropic inhomogeneous media. Geophysics 2003, 68, 1525–1536. [Google Scholar] [CrossRef]
- Abubakar, A.; Habashy, T.M.; Druskin, V.L.; Knizhnerman, L.; Alumbaugh, D. 2.5D forward and inverse modeling for interpreting low-frequency electromagnetic measurements. Geophysics 2008, 73, F165–F177. [Google Scholar] [CrossRef]
- Commer, M.; Newman, G.A. New advances in three-dimensional controlled-source electromagnetic inversion. Geophys. J. Int. 2008, 172, 513–535. [Google Scholar] [CrossRef]
- Sasaki, Y.; Meju, M.A. Useful characteristics of shallow and deep marine CSEM responses inferred from 3D finite-difference modeling. Geophysics 2009, 74, F67–F76. [Google Scholar] [CrossRef]
- Streich, R.; Becken, M. Electromagnetic fields generated by finite length wire sources: Comparison with point dipole solutions. Geophys. Prospect. 2011, 59, 361–374. [Google Scholar] [CrossRef]
- Badea, E.A.; Everett, M.E.; Newman, G.A.; Biro, O. Finite-element analysis of controlled-source electromagnetic induction using Coulomb gauged potentials. Geophysics 2001, 66, 786–799. [Google Scholar] [CrossRef]
- Schwarzbach, C.; Borner, R.-U.; Spitzer, K. Three-dimensional adaptive higher order finite element simulation for geo-electromagnetics—A marine CSEM example. Geophys. J. Int. 2011, 187, 63–74. [Google Scholar] [CrossRef]
- Ansari, S.; Farquharson, C.G. 3D finite-element forward modeling of electromagnetic data using vector and scalar potentials and unstructured grids. Geophysics 2014, 79, E149–E165. [Google Scholar] [CrossRef]
- Cai, H.; Xiong, B.; Han, M.; Zhdanov, M. 3D controlled-source electromagnetic modeling in anisotropic medium using edge-based finite element method. Comput. Geosci. 2014, 73, 164–176. [Google Scholar] [CrossRef]
- Cai, H.; Xiong, B.; Zhdanov, M. Three-dimensional marine controlled-source electromagnetic modelling in anisotropic medium using finite element method. Chin. J. Geophys. 2015, 58, 2839–2850. [Google Scholar]
- N′ed′elec, J.C. Mixed finite elements in R3. Numer. Math. 1980, 35, 315–341. [Google Scholar] [CrossRef]
- Mukherjee, S.; Everett, M.E. 3D controlled-source electromagnetic 455 edge-based finite element modeling of conductive and permeable heterogeneities. Geophysics 2011, 76, F215–F226. [Google Scholar] [CrossRef]
- Silva, N.V.; Morgan, J.V.; MacGregor, L.; Warner, M. A finite element multifrontal method for 3D CSEM modeling in the frequency domain. Geophysics 2012, 77, E101–E115. [Google Scholar] [CrossRef]
- Castillo-Reyes, O.; Amor-Martin, A.; Botella, A.; Anquez, P.; García-Castillo, L.E. Tailored meshing for parallel 3D electromagnetic modeling using high-order edge elements. J. Comput. Sci. 2022, 63, 101813. [Google Scholar] [CrossRef]
- Bíró, O.; Preis, K.; Richter, K.R. On the use of the magnetic vector potential in the nodal and edge finite element analysis of 3D magnetostatic problems. IEEE Trans. Magn. 1996, 32, 651–654. [Google Scholar] [CrossRef]
- Biró, O.; Preis, K. Partial tree-gauging of second order edge element vector potential formulations. In Proceedings of the Computational Electromagnetics, Montreal, QC, Canada, 28 June–2 July 2015. [Google Scholar]
- Zhdanov, M.S. Geophysical Electromagnetic Theory and Methods; Elsevier: Amsterdam, The Netherlands, 2009. [Google Scholar]
- Jin, J. Finite Element Method in Electromagnetics; Wiley-IEEE Press: New York, NY, USA, 2002. [Google Scholar]
- Ward, S.H.; Hohmann, G.W. Electromagnetic Theory for Geophysical Applications; SEG: Oklahoma City, OK, USA, 1988. [Google Scholar]
- Anderson, W.L. A hybrid fast Hankel transform algorithm for electromagnetic modeling. Geophysics 1989, 54, 263–266. [Google Scholar] [CrossRef]
- Zhdanov, M.S.; Keller, G. The Geoelectrical Methods in Geophysical Exploration; Elsevier: Amsterdam, The Netherlands, 1994. [Google Scholar]
- Guptasarma, D.; Singh, B. New digital linear filters for Hankel J0 and J1 transforms. Geophys. Prospect. 1997, 54, 263–266. [Google Scholar]
Disclaimer/Publisher’s Note: The statements, opinions and data contained in all publications are solely those of the individual author(s) and contributor(s) and not of MDPI and/or the editor(s). MDPI and/or the editor(s) disclaim responsibility for any injury to people or property resulting from any ideas, methods, instructions or products referred to in the content. |
© 2023 by the authors. Licensee MDPI, Basel, Switzerland. This article is an open access article distributed under the terms and conditions of the Creative Commons Attribution (CC BY) license (https://creativecommons.org/licenses/by/4.0/).