Abstract
The purpose of this study was to differentiate post-chemoradiotherapy (CRT) changes from tumor persistence/recurrence in early follow-up of naso-oropharyngeal carcinoma on magnetic resonance (MRI) with diffusion (DWI) and dynamic contrast-enhanced perfusion-weighted imaging (DCE-PWI). A total of 37 patients were assessed with MRI both for tumor staging and 4-month follow-up from ending CRT. Mean apparent diffusion coefficient (ADC) values, area under the curve (AUC), and K(trans) values were calculated from DWI and DCE-PWI images, respectively. DWI and DCE-PWI values of primary tumor (ADC, AUC, K(trans)pre), post-CRT changes (ADC, AUC, K(trans)post), and trapezius muscle as a normative reference before and after CRT (ADC, AUC, K(trans)muscle pre and muscle post; AUCpost/muscle post:AUCpre/muscle pre (AUCpost/pre/muscle); K(trans)post/muscle post:K(trans)pre/muscle pre (K(trans)post/pre/muscle) were assessed. In detecting post-CRT changes, ADCpost > 1.33 × 10⁻³ mm2/s and an increase >0.72 × 10⁻³ mm2/s and/or >65.5% between ADCpost and ADCpre values (ADCpost-pre; ADCpost-pre%) had 100% specificity, whereas hypointense signal intensity on DWIb800 images showed specificity 80%. Although mean AUCpost/pre/muscle and K(trans)post/pre/muscle were similar both in post-CRT changes (1.10 ± 0.58; 1.08 ± 0.91) and tumor persistence/recurrence (1.09 ± 0.11; 1.03 ± 0.12), K(trans)post/pre/muscle values < 0.85 and >1.20 suggested post-CRT fibrosis and inflammatory edema, respectively. In early follow-up of naso-oropharyngeal carcinoma, our sample showed that ADCpost > 1.33 × 10⁻³ mm2/s, ADCpost-pre% > 65.5%, and ADCpost-pre > 0.72 × 10⁻³ mm2/s identified post-CRT changes with 100% specificity. K(trans)post/pre/muscle values less than 0.85 suggested post-CRT fibrosis, whereas K(trans)post/pre/muscle values more than 1.20 indicated inflammatory edema.
1. Introduction
Head and neck cancers represent the sixth most common cancer worldwide and a major cause of morbidity and mortality [1]. More than 90% of head and neck cancers are squamous cell carcinomas (HNSCC) arising from the mucosal surfaces of the oral cavity, naso-oropharynx, and larynx [2]. Crucial risk factors aligned with head and neck cancers include tobacco, alcohol consumption, and human papillomavirus (HPV) or Epstein–Barr virus infections [3].
Chemoradiotherapy (CRT) has become more popular over the past decade because the organ preservation possibilities are higher with CRT as compared to surgery [4]. The relapse rate is still 50% (35–65%) in patients with advanced HNSCC [5] and reaches 25% in early-stage cancers [6]. Almost 90% of HNSCC recurrences following CRT develop within 2 years [7]; the early detection of tumor recurrence prompts curative salvage treatment and may allow the preservation of organ functions [6].
The interpretation of post-treatment follow-up via imaging techniques is complicated by post-actinic edema, soft tissue necrosis, and fibrosis. Such post-treatment changes make it difficult to detect tumor recurrence within a distorted anatomy [8]. Biopsy with negative findings does not exclude HNSCC recurrence, and multiple biopsies may increase overall morbidity [6]. Therefore, in addition to clinical and histological parameters, other biomarkers are needed to stratify patients for optimal therapy [9].
Magnetic resonance imaging (MRI) is an accurate technique for the assessment of deep tumor invasion and morphological tumor features [10], but it is not able to identify early locoregional recurrences, predict tumor response to treatment and monitor post-treatment changes [11,12].
Metabolic imaging with 18F-fluorodeoxyglucose positron emission tomography/computed tomography (18F-FDG PET/CT) has evolved as a tool for the post-treatment evaluation of HNSCC, but it is generally delayed for at least 12 weeks due to the potential false-positive results in early post-treatment inflammatory changes [13].
Nowadays, a multiparametric approach employing MRI has been proposed with diffusion (DWI) and dynamic contrast-enhanced perfusion-weighted imaging (DCE-PWI) for the distinction between post-treatment changes and tumor persistence/recurrence [14,15]. Moreover, MRI is ideally suited to serial scanning, reducing the use of ionizing radiations commonly emitted by CT examinations [16,17,18,19].
DWI with apparent diffusion coefficient (ADC) maps can theoretically differentiate between inflammation and neoplastic tissues since the water molecule diffusion is increased into inflammatory tissues (T2* loss of signal and high ADC values), whereas water molecules have restricted diffusion within neoplastic tissues (T2* signal maintenance and low ADC values) [20].
DCE-PWI examines microvascular tumor tissue characteristics [21] and can potentially assess the reduction of tumor blood perfusion by means of K(trans), which represents the volume transfer constant from the vascular to the extravascular extracellular spaces [22,23,24,25].
We aimed to retrospectively differentiate post-CRT changes from tumor persistence/recurrence in the early follow-up of patients with primary naso-oropharyngeal carcinoma using multiparametric MRI with DWI and DCE-PWI sequences.
2. Materials and Methods
2.1. Inclusion Criteria
From January 2016 to December 2021, MRI examinations of 104 patients with histological diagnoses of nasopharynx or oropharynx carcinoma investigated in the radiology department of the Careggi Hospital of Florence (Italy) were retrieved. This study was approved by the research ethics committee (Protocol Number 21800_oss), and informed written consent was obtained from all individual participants included in the study. All procedures performed in studies involving human participants were in accordance with the ethical standards of the institutional and/or national research committee and with the 1964 Helsinki Declaration and its later amendments or comparable ethical standards.
Patients who met the following criteria were included:
- Adult patients (≥18 years);
- Histological confirmation of oropharynx or nasopharynx carcinoma through biopsy;
- Exclusive CRT;
- MRI examination for both tumor staging and 4-month follow-up after ending CRT;
- DWI and DCE-PWI MR sequences;
- Two years of clinical and cross-sectional imaging follow-ups including consecutive 18F-FDG PET/CT and MRI.
Patients were excluded in case of previous head and neck radiotherapy treatment (4), surgical treatment (5), MRI without both DWI and DCE-PWI sequences (14), MRI not performed for both tumor staging and follow-up (41), and follow-up lasting less than 2 years (3). We considered the first two years after completing CRT at a higher risk of neoplastic recurrence.
The patients that matched our inclusion criteria were 37 (19 males, 18 females) with a mean age of 59 years (median age: 58.5 years, range: 36–81 years); 26 patients were affected by oropharyngeal carcinoma (16 HPV positive, 4 HPV negative, and 6 unknowns for HPV status) and 11 patients by nasopharyngeal carcinoma. TNM staging—eighth edition of the American Joint Commission on Cancer—HPV status, and tumor locations were summarized in Table S1 in the Supplementary Materials.
2.2. DWI and DCE-PWI
MRI examinations for tumor staging and follow-up were performed with a 1.5 T MR device (Magnetom Aera, Siemens Healthcare, Erlangen, Germany) with a devoted head and neck coil. The MR acquisition protocol included pre- and post-contrast sequences (Table S2 in Supplementary Materials). An axial fat-saturated echo-planar imaging-based DWI with two different b-values (b50−800 s/mm2) was acquired. ADC values of primitive tumors and residual tissues after CRT were calculated by positioning three regions of interest (ROI) with an average intratumoral area of 0.30–0.40 cm2 each on three contiguous axial sections. DCE-PwI was obtained through two volumetric interpolated breath-hold examination (VIBE) T1-w sequences characterized by 3.5 mm slice thickness, 0.7 interslice gap, FOV 250 × 226 mm, matrix 139 × 192, flip angles 5° and 15°, and acceleration factor 3 for baseline T1-mapping acquisitions. After contrast agent administration, one VIBE T1-w lasting 350 s and with a temporal resolution of 5 s was acquired as follows: TR 4.65 ms, TE 1.66 ms, 3.5 mm slice thickness, FOV 250 × 226.6 mm, matrix 139 × 192, flip angle 30°, acceleration factor 3, and peripheral K space sampling with time to center 2.2 s. Time/intensity curve, area under the curve (AUC), and K(trans) values of primitive tumor and tumor residual/relapse tissues after CRT were generated by using IntelliSpace software version 9.0 (Philips, Amsterdam, The Netherlands) from the native DCE-PWI images by drawing an ROI including at least 50% of the largest lesion diameter. Before lesion sampling, an ROI was placed on the internal carotid artery to obtain the arterial input function curve, defined as the contrast concentration in vessels feeding to tissue at each point in time during the contrast passage. Vessels, cystic areas within solid lesions, and necrotic, hemorrhagic, or proteinaceous areas detected on T1-w and T2-w sequences were excluded in both DWI and DCE-PWI analysis. ADC, AUC, and K(trans) values of the trapezius muscle on the same side of the tumor were also obtained.
2.3. Image Assessment
MRIs performed both for tumor staging and 4-month follow-up after the end of CRT were independently reviewed by two radiologists with 12 (CN) and 7 (MP) years of experience in head and neck imaging, respectively.
The following morphologic, DWI, and DCE-PWI features were assessed:
- -
- Maximum size of the primitive tumor and submucosal thickness of the residual tissue after CRT on contrast-enhanced T1 images.
- -
- Signal intensity (SI), hyper- or hypointense, of the residual tissue after CRT on DWIb800 images;
- -
- Mean ADC values of the primitive tumor (ADCpre), residual tissue after CRT (ADCpost), and ipsilateral trapezius muscle as a normative reference on both pre- and post-CRT (ADCmuscle pre and muscle post);
- -
- Mean AUC and K(trans) values of the primitive tumor (AUCpre, K(trans)pre), residual tissue after CRT (AUCpost, K(trans)post), and ipsilateral trapezius muscle as a normative reference on both pre- and post-CRT (AUC, K(trans)muscle pre and muscle post);
- -
- Ratio between ADCpre and ADCmuscle pre (ADCpre/muscle pre);
- -
- Ratio between ADCpost and ADCmuscle post (ADCpost/muscle post);
- -
- Ratio between AUC values of the residual tissue after CRT and primitive tumor (AUCpost/pre);
- -
- Ratio between K(trans) values of the residual tissue after CRT and primitive tumor (K(trans)post/pre);
- -
- Ratio between AUC and K(trans) values of the residual tissue after CRT and primitive tumor, standardized with respect to AUC and K(trans) values of the ipsilateral trapezius muscle as a normative reference (AUCpost/pre/muscle and K(trans)post/pre/muscle), as follows:
The diagnosis of tumor response to CRT (post-treatment changes) or tumor persistence/recurrences (post-treatment residual cancer) was defined at the 2-year follow-up, with clinical examinations and cross-sectional imaging including MRI and 18F-FDG PET/CT. Post-treatment biopsy was performed only in case of positive 18F-FDG PET/CT during follow-up (12 patients). Clinical examinations and MRI were used to validate results as true negatives both in patients with negative 18F-FDG PET/CT (25) and in patients with positive 18F-FDG PET/CT and negative post-treatment biopsy (7).
2.4. Statistical Analysis
Quantitative continuous variables are expressed as mean ± standard deviation or median and range, whereas categorical values are reported as absolute counts and percentages. The interobserver reliability for MRI was calculated using the Cohen kappa coefficient. Kappa values of 0.01–0.20, 0.21–0.40, 0.41–0.60, 0.61–0.80, 0.81–0.99, and 1 represented slight, fair, moderate, substantial, almost perfect, and perfect agreement, respectively. Data were presented as a percentage or mean (±standard deviation) and median (interquartile range). Continuous variables were tested for normality using the Kolmogorov–Smirnov test. The association of each parameter and the diseased status at the follow-up (i.e., tumor persistence/recurrence or post-CRT changes) was tested using the Student’s t-test or Mann–Whitney U-test for independent samples, as appropriate. For the parameters with statistically significant association with the diseased status at follow-up, a cut-off value to discriminate post-CRT changes with respect to tumor persistence/recurrence was calculated using receiver operating characteristic (ROC) curve analysis. In particular, sensitivity and specificity were calculated for the entire spectrum of values, and cut-offs were chosen as the values with the highest combination/multiplication of sensitivity and specificity. The area under the ROC curve was considered as a measure of the overall performance of each parameter (diagnostic accuracy) to discriminate the diseased status at follow-up. The analyses were performed using the SPSS® v. 27.0 statistical analysis software (IBM Corp., New York, NY, USA; formerly SPSS Inc., Chicago, IL, USA), considering an alpha level of 0.05 as significant.
3. Results
Post-CRT changes were found in 32 patients, whereas 5 patients had tumor persistence/recurrence. Results were summarized in Table 1 and Tables S3–S5 in Supplementary Materials. Cohen kappa values showed substantial agreement between the two observers for DWI and DCE-PWI assessments (K values 0.75 to 0.79).

Table 1.
Mean, standard deviation, and range values of the post-chemoradiotherapy tissue changes and tumor persistence/recurrence. CRT: chemoradiotherapy. ADC: apparent diffusion coefficient. AUC: area under the curve. K(trans): the volume transfer constant from the vascular space to the extravascular extracellular space. p-value: probability value.
ADCpost values > 1.33 × 10⁻³ mm2/s, a percentage increase greater than 65.5% in mean ADCpost values compared to mean ADCpre values (ADCpost-pre%), and values > 0.72 × 10⁻³ mm2/s in the difference between mean ADCpost and ADCpre values (ADCpost-pre) strongly correlated with post-CRT changes (100% specificity, Figure 1A–C). ADCpost/muscle post values > 1.15 and >0.85 showed 96.2% sensitivity and 100% specificity in the detection of post-CRT changes, respectively (Figure 1D). Hypointense SI on DWIb800 images well identified post-CRT changes since it was found in 30 patients (93.7%) with no residual cancer and 1 patient (20.0%) with tumor persistence/recurrence (specificity 80%).
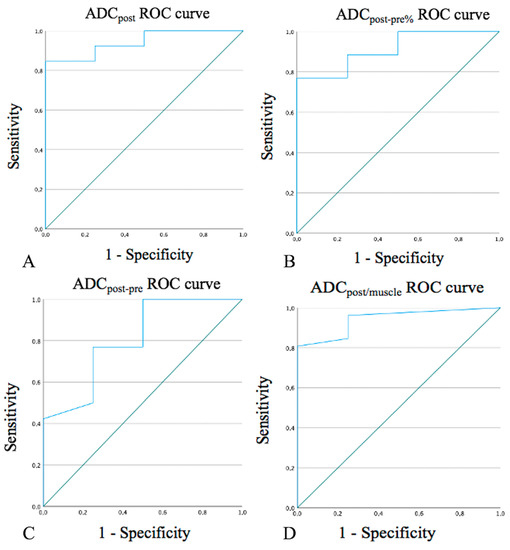
Figure 1.
Receiver operating characteristic (ROC) curves for ADCpost values (A), ADCpost-pre% (B), ADCpost-pre values (C), and ADCpost/muscle values (D). ADC: apparent diffusion coefficient. ADCpost: residual tissue mean ADC value.
An overlap was found between mean ADCpost (Figure 2A), AUCpost/pre/muscle, and K(trans)post/pre/muscle values of post-CRT changes and tumor persistence/recurrence (Figure 2B,C). However, K(trans)post/pre/muscle values of 27 successfully treated patients (84.4%) were significantly different, higher or lower, than K(trans)post/pre/muscle values of all 5 patients with tumor persistence/recurrence. In such 27 patients, K(trans)post/pre/muscle values less than 0.85 suggested post-CRT fibrosis, whereas K(trans)post/pre/muscle values more than 1.20 indicated inflammatory edema.
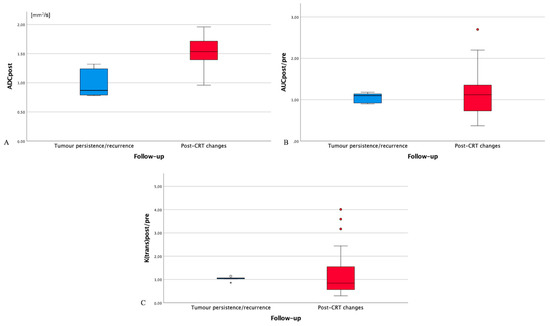
Figure 2.
Box plot for post-treatment residual tissue ADC values (ADCpost, (A)), AUCpost/(AUC muscle post):(AUC pre)/(AUC muscle pre) values (AUCpost/pre/muscle, (B)), and (K(trans)post)/(K(trans) muscle post):(K(trans) pre)/(K(trans) muscle pre) values (K(trans)post/pre/muscle, (C)) in patients with tumor persistence/recurrence (blue box) and post-chemoradiotherapy (CRT) changes (red box). ADC: apparent diffusion coefficient. AUC: area under the curve. CRT: chemoradiotherapy. AUCpre: AUC values of primitive tumor. AUCpost: AUC values of the residual tissue after CRT. AUCmuscle pre: AUC values of ipsilateral trapezius muscle on pre-treatment magnetic resonance imaging. AUCmuscle post: AUC values of ipsilateral trapezius muscle on post-treatment magnetic resonance imaging. K(trans)pre: K(trans) values of primitive tumor. K(trans)post: K(trans) values of the residual tissue after CRT. K(trans)muscle pre: K(trans) values of ipsilateral trapezius muscle on pre-treatment magnetic resonance imaging. K(trans)muscle post: K(trans) values of ipsilateral trapezius muscle on post-treatment magnetic resonance imaging. Circles: drawing of comparison circles is a way to display whether or not the mean values of boxes in the box plot are significantly different from each other. Asterisk: asterisk is an indication that an extreme outlier is present in the data.
4. Discussion
Quantitative DWI and DCE-PWI analyses may portend the efficacy of CRT and early identification of potential treatment failure, resulting in an improvement in cancer management. In the current study, the quantitative analysis with DWI sequences allowed a reliable tumor assessment during the treatment phase. A low increase in ADCpost-pre and ADCpost-pre% values was indicative of a high risk of residual cancer as directed by Wong et al. [26]. ADCpost/muscle post values > 0.85 and hypointense SI on DWIb800 images strongly correlated with post-CRT changes. Most of our patients with post-CRT changes (27/32, 84.3%) showed K(trans)post/pre/muscle values significantly lower (<0.85, 19 patients) or higher (>1.20, 8 patients) than all 5 patients with tumor persistence/recurrence. As for DWI [7], the aforementioned variations of DCE-PWI values could reflect the different tissue components, mainly fibrotic (Figure 3) or inflammatory (Figure 4) alterations, of post-treatment changes.
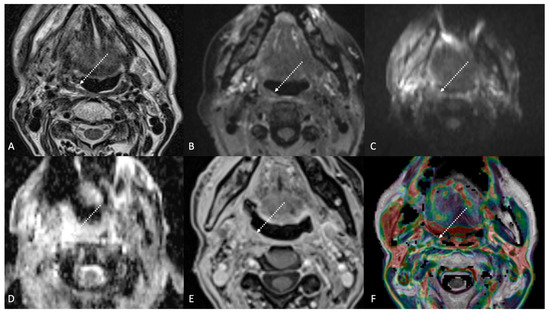
Figure 3.
Post-treatment magnetic resonance imaging (MRI) of a 63-year-old female patient with human-papillomavirus-positive carcinoma of the right palatine tonsil with ipsilateral lymph node metastasis (T2N1) recently treated (3 months before) with chemoradiotherapy (CRT). Post-CRT MRI showed linear fibrotic tissues in the right palatine tonsil (white striped arrows) with hypointense signal intensity on T2-weighted (A), T2-weighted fat-saturated, (B) and diffusion-weighted b800 images (C), and intermediate apparent diffusion coefficient values (1.44 × 10⁻³ mm2/s) (D). After gadolinium contrast agent injection, post-CRT fibrotic tissue showed no submucosal enhancement (E) and low K(trans) value (48.36 × 10⁻³ mm2/s) on dynamic contrast enhancement-perfusion weighted imaging (F). Ratio between K(trans) values of the primitive tumor and residual tissue after CRT, standardized with respect to K(trans) value of the ipsilateral trapezius (K(trans)post/pre/muscle), was 0.307. These findings are typical of post-CRT scar tissue.
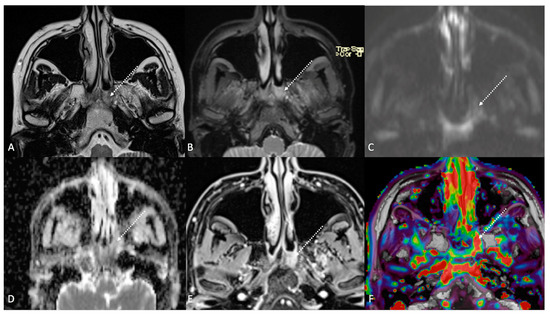
Figure 4.
Post-treatment magnetic resonance imaging (MRI) of a 36-year-old female patient affected by nasopharyngeal carcinoma with left lymph node metastasis (T3N3) and tumoral extension to bilateral Ronsemüller fossa, left nasal choana, and middle skull base, recently treated (3 months before) with chemoradiotherapy (CRT). Early post-treatment MRI demonstrated post-CRT inflammatory residual tissue (white striped arrows) in the left Ronsemüller fossa and ipsilateral nasal choana. Post-CRT inflammatory changes showed hyperintense signal on T2-weighted (A), T2-weighted fat-saturated (B), and diffusion-weighted b800 images (C); high apparent diffusion coefficient value (1.53 × 10⁻³ mm2/s) (D). After gadolinium contrast agent injection, post-CRT inflammatory residual tissue shows submucosal enhancement of 5 mm thickness (E), and very high K(trans) value (595.25 × 10⁻³ mm2/s) on dynamic contrast enhancement-perfusion weighted imaging (F). Ratio between K(trans) values of the primitive tumor and residual tissue after CRT, standardized with respect to K(trans) value of the ipsilateral trapezius (K(trans)post/pre/muscle), was 3.17. These findings suggested an increase in capillary permeability caused by CRT.
Sherif et al. [27] found ADC values of 1.42 ± 0.23 × 10⁻³ mm2/s and 1.02 ± 0.20 × 10⁻³ mm2/s in post-therapy changes of patients treated for tongue carcinoma and tongue carcinoma recurrence, respectively. Taking as a reference such ADC values, in our study, 24 patients with post-CRT changes showed ADCpost values > 1.42 × 10⁻³ mm2/s (mean = 1.56 × 10⁻³ mm2/s), whereas in the remaining 8 patients with post-CRT changes, ADCpost values (mean = 1.24 × 10⁻³ mm2/s; range = 0.96–1.35 × 10⁻³ mm2/s) were similar to ADCpost values of all 5 patients with tumor persistence/recurrence (mean = 1.05 × 10⁻³ mm2/s; range = 0.78–1.32 × 10⁻³ mm2/s) (Figure 2A). Ailianou et al. [7] found that mean ADC values in post-treatment HNSCC highly differed between post-radiation therapy inflammatory edema (1.75 ± 0.34 × 10⁻³ mm2/s) and late fibrosis (0.98 ± 0.26 × 10⁻³ mm2/s). These results may justify overlaps of ADC values between post-CRT and tumor recurrence both in our study and in other papers [28,29,30,31,32,33,34,35,36,37,38,39,40,41,42].
18F-FDG PET/CT is frequently used for treatment response assessment. It shows high sensitivity but low specificity [43], especially in the first 6 months after treatment due to inflammation, granulation, and scar tissues [44]. In the present study, 18F-FDG PET/CT performed 3–6 months after ending the treatment was positive in 12 patients, but only 5 of them had tumor persistence/recurrence at the 2-year follow-up. Compared to 18F-FDG PET/CT, ADC can be also performed in the first months after CRT to assess treatment response, but false positives and negatives cannot be fully excluded. However, studies that used ADC values without taking into account DWI SI underestimated the accuracy of diffusion-weighted MRI [45]. Scar tissue generally displays low ADC values in combination with the hypointense signal on high b value DWI images due to the low number of resonant protons. Residual cancer usually shows low values on ADC maps too, but together with the hyperintense signal on DWI images [46]. The combination of DWI and morphologic MRI features yields better results than DWI alone [7,31,44,47]. The evaluation of SI on T2 images in the current study agreed with the literature since masslike alterations with moderately high (i.e., intermediate) SI, diffuse alterations with high SI, and linear or triangular alterations with very low SI (similar to or lower than muscle) were suggestive for tumor persistence/recurrence, post-CRT inflammatory edema, and post-CRT fibrosis, respectively.
In the current study, K(trans)post/pre/muscle values less than 0.85 suggested post-CRT fibrosis, whereas K(trans)post/pre/muscle values more than 1.20 indicated inflammatory edema. Vascular changes associated with residual cancer represent neoangiogenesis; on the contrary, post-treatment non-tumoral alterations show vascular changes of continued successful therapy and fibrosis [48]. Post-treatment changes may lead to significant variations in DCE-PWI parameter values since K(trans) is sensitive to angiogenic modifications [49]. Therefore, although with some degrees of overlap, little or no change in AUCpost/pre/muscle and mean K(trans)post/pre/muscle values, i.e., tumoral neoangiogenesis, may be considered a post-treatment indicator of tumor persistence/recurrence (Figure 5).
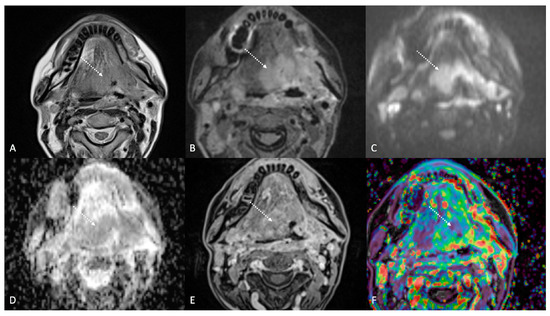
Figure 5.
Post-treatment magnetic resonance imaging (MRI) of a 47-year-old female patient with human-papillomavirus-negative carcinoma of the left palatine tonsil with ipsilateral lymph node metastasis (T4aN1) and buccal space and mandibular invasion, recently treated (4 months before) with chemoradiotherapy (CRT). Early post-treatment MRI showed tumor progression with wide extension to the extrinsic muscles of the contralateral tongue (maximum tumor thickness 45 mm). Post-CRT tumor residual/relapse disease (white striped arrows) showed moderately high (intermediate) T2-weighted signal intensity (A,B), high signal on diffusion-weighted b800 imaging (C), low apparent diffusion coefficient value (0.79 × 10⁻³ mm2/s, (D), and moderate enhancement after gadolinium contrast injection (E). K(trans) value of the tumor (56.24 × 10⁻³ min) decreased on dynamic contrast enhancement-perfusion weighted imaging (F), compared to pre-treatment MRI (117.63 × 10⁻³ min). However, the ratio between K(trans) values of the primitive tumor and residual tissue after CRT, standardized with respect to K(trans) value of the ipsilateral trapezius (K(trans)post/pre/muscle), was 1.14. These findings suggested little or no reduction in tumor neoangiogenesis after CRT.
Some limitations need to be mentioned. The relationship among MRI and HNSCC stage, lymph node, distant metastasis, histological tumor grading, histopathological parameters, progression-free survival, HPV status, intravoxel incoherent motion, or tumoral 18F-FDG PET/CT standard uptake values were not performed. Moreover, we compared tissue changes between pre- and post-CRT without taking into account pre-treatment MRI features only as predictors of treatment response.
Another limitation of the present study was the relatively low sample size. Nevertheless, most papers regarding HNSCC and functional MRI did not consider both DWI and DCE-PWI for therapy assessment or did not include both pre- and post-treatment MRI examinations. Moreover, few papers exclusively recruited patients with pharyngeal cancer [11,28,50,51], and only two of these were performed with both DWI and DCE-PWI [11,51]. In addition, the small number of patients with tumor persistence/recurrence (5 individuals) needed to be related to the well-known excellent response to CRT treatment of oropharyngeal—especially when HPV positive—and nasopharyngeal carcinomas. Furthermore, HPV+ and HPV− HNSCC generally differ in radiological imaging and prognosis [52], thus representing a possible bias in the current study.
Moreover, our single-center results cannot be generalized until more evidence is gathered.
Finally, the study design did not allow the calculation of the outcome incidence. For this reason, a discussion of the appropriateness of the cut-off values with respect to the rate of false positives was not possible. Future studies with a different design should help in choosing appropriate cut-off values that balance the benefits to true positives (e.g., increased survival) versus the costs to false positives (e.g., unnecessary procedures).
To date, MRI evaluation in strictly morphologic terms represented by the SI on T1 and T2 images and grade of enhancement is still mandatory in HNSCC. Considering the relative complexity of DWI and DCE-PWI parameters that have been used and the low number of retrieved patients, the results obtained in our study are currently available for research purposes only. Further studies will be needed to establish whether or not multiparametric MRI examinations can be successfully used in clinical daily practice.
5. Conclusions
In early follow-up of naso-oropharyngeal carcinoma, ADCpost values > 1.33 × 10⁻³ mm2/s, ADCpost-pre% > 65.5%, and ADCpost-pre values > 0.72 × 10⁻³ mm2/s identified post-CRT changes with excellent specificity. Although mean AUCpost/pre/muscle and K(trans)post/pre/muscle were similar in post-CRT changes (1.10 ± 0.58; 1.08 ± 0.91) and tumor persistence/recurrence (1.09 ± 0.11; 1.03 ± 0.12), in our sample K(trans)post/pre/muscle values less than 0.85 suggested post-CRT fibrosis, whereas K(trans)post/pre/muscle values more than 1.20 indicated inflammatory edema.
Supplementary Materials
The following supporting information can be downloaded at: https://www.mdpi.com/article/10.3390/app13052799/s1, Materials and Methods. Table S1: Patients’ data retrieved in the study. M: male; F: female; O: oropharynx; N: nasopharynx; P: positive; N: negative; U: unknown; RT: post-chemoradiotherapy changes; PR: tumor persistence/recurrence. *The eighth edition of the American Joint Commission on Cancer TNM staging; Table S2. Magnetic resonance acquisition protocol performed for the study of naso-oropharyngeal carcinoma staging and 4-month follow-up from ending chemoradiotherapy. Unenhanced scans included sagittal fat-saturated T1- and T2- weighted sampling perfection with application-optimized contrasts using different flip angle evolution (SPACE) sequences with axial, coronal, and sagittal multiplanar reconstructions; axial T2-weighted turbo spin echo; axial fat-saturated echo-planar DWI spectral attenuated inversion recovery (SPAIR) with two b-values (b50–800 s/mm2) and ADC maps; two axial T1-weighted volumetric interpolated breath-hold examination (VIBE) DCE-PWI with application of flip angles (FAs) 5° and 15°, respectively. Enhanced scans performed after intravenous gadolinium chelates contrast agent injection (gadobutrol, 1 mL/10 kg, flow 3 mL/s, followed by 20 mL saline flush) consisted of an axial VIBE DCE-PWI with application of FA 30° and peripheral K space sampling with time to center 2.2 s, an axial T1-weighted turbo spin echo, and an axial VIBE Dixon. Results. Table S3. Pre-treatment patients’ data. ADC: apparent diffusion coefficient; AUC: area under the curve; k(trans): the volume transfer constant from the vascular space to the extravascular extracellular space; pre: values measured on magnetic resonance imaging performed for tumor staging; Table S4. Post-treatment patients’ data. T2 signal intensity is referred to with respect to the muscle. Hypo: lower than muscle. Hyper+: similar or slightly higher than muscle. Higher++: clearly higher than muscle; ADC: apparent diffusion coefficient; AUC: area under the curve; K(trans): the volume transfer constant from the vascular space to the extravascular extracellular space; post: values measured on magnetic resonance imaging performed for 4-month follow-up; Table S5. Comparison between post-treatment and pre-treatment patients’ data. ADC: apparent diffusion coefficient (expressed in × 10−3 mm2/s). ADCpost-pre: residual tissue mean ADC value—tumor mean ADC value. ADCpost-pre%: residual tissue mean ADC value—tumor mean ADC value, expressed in percentage calculated as follows: (ADCpost-pre × 100)/ADCpre. Negative percentages indicate that ADCpost values are lower than ADCpre. AUC: area under the curve. AUCpost/pre: ratio between the residual tissue AUC and tumor AUC values. AUCpost/pre/muscle: ratio between residual tissue AUC and tumor AUC values, standardized with respect to AUC values of the ipsilateral trapezius muscle. K(trans): the volume transfer constant from the vascular space to the extravascular extracellular space. K(trans)post/pre: ratio between the residual tissue K(trans) value and tumor K(trans) value. K(trans)post/pre/muscle: ratio between the residual tissue K(trans) and tumor K(trans) values, standardized with respect to K(trans) values of the ipsilateral trapezius muscle.
Author Contributions
Conceptualization, M.P. and C.N.; Data curation, A.B.; Formal analysis, C.L.; Investigation, G.M.; Methodology, E.B.; Project administration, M.P.; Resources, L.B.; Software, E.B.; Supervision, A.L.C.; Validation, L.C., F.M. and L.B.; Visualization, P.B. and C.N.; Writing—original draft, M.P. All authors have read and agreed to the published version of the manuscript.
Funding
This research received no external funding.
Institutional Review Board Statement
The study was conducted in accordance with the Declaration of Helsinki, and approved by the “Ethics Committee of Azienda Ospedaliera Universitaria Careggi (Protocol No. 21800_oss, 22 March 2022)” for studies involving humans.
Informed Consent Statement
Informed consent was obtained from all subjects involved in the study.
Data Availability Statement
The original contributions presented in the study are included in the article/Supplementary Material. Further inquiries can be directed to the corresponding author.
Conflicts of Interest
The authors declare no conflict of interest.
References
- Locatello, L.G.; Bruno, C.; Pietragalla, M.; Taverna, C.; Novelli, L.; Nardi, C.; Bonasera, L.; Cannavicci, A.; Maggiore, G.; Gallo, O. A critical evaluation of computed tomography-derived depth of invasion in the preoperative assessment of oral cancer staging. Oral Oncol. 2020, 107, 104749. [Google Scholar] [CrossRef]
- Maraghelli, D.; Pietragalla, M.; Calistri, L.; Barbato, L.; Locatello, L.G.; Orlandi, M.; Landini, N.; Casto, A.L.; Nardi, C. Techniques, Tricks, and Stratagems of Oral Cavity Computed Tomography and Magnetic Resonance Imaging. Appl. Sci. 2022, 12, 1473. [Google Scholar] [CrossRef]
- Mungai, F.; Verrone, G.B.; Pietragalla, M.; Berti, V.; Addeo, G.; Desideri, I.; Bonasera, L.; Miele, V. CT assessment of tumor heterogeneity and the potential for the prediction of human papillomavirus status in oropharyngeal squamous cell carcinoma. Radiol. Med. 2019, 124, 804–811. [Google Scholar] [CrossRef]
- Jajodia, A.; Aggarwal, D.; Chaturvedi, A.K.; Rao, A.; Mahawar, V.; Gairola, M.; Agarwal, M.; Goyal, S.; Koyyala, V.P.B.; Pasricha, S.; et al. Value of diffusion MR imaging in differentiation of recurrent head and neck malignancies from post treatment changes. Oral Oncol. 2019, 96, 89–96. [Google Scholar] [CrossRef]
- Locatello, L.G.; Pietragalla, M.; Taverna, C.; Bonasera, L.; Massi, D.; Mannelli, G. A Critical Reappraisal of Primary and Recurrent Advanced Laryngeal Cancer Staging. Ann. Otol. Rhinol. Laryngol. 2018, 128, 36–43. [Google Scholar] [CrossRef]
- Brockstein, B.; Haraf, D.J.; Rademaker, A.W.; Kies, M.S.; Stenson, K.M.; Rosen, F.; Mittal, B.B.; Pelzer, H.; Fung, B.B.; Witt, M.-E.; et al. Patterns of failure, prognostic factors and survival in locoregionally advanced head and neck cancer treated with concomitant chemoradiotherapy: A 9-year, 337-patient, multi-institutional experience. Ann. Oncol. 2004, 15, 1179–1186. [Google Scholar] [CrossRef]
- Ailianou, A.; Mundada, P.; De Perrot, T.; Pusztaszieri, M.; Poletti, P.-A.; Becker, M. MRI with DWI for the Detection of Posttreatment Head and Neck Squamous Cell Carcinoma: Why Morphologic MRI Criteria Matter. Am. J. Neuroradiol. 2018, 39, 748–755. [Google Scholar] [CrossRef]
- Teicher, B.A. Hypoxia and drug resistance. Cancer Metastasis Rev. 1994, 13, 139–168. [Google Scholar] [CrossRef]
- Mukherji, S.K.; Wolf, G.T. Evaluation of Head and Neck Squamous Cell Carcinoma After Treatment. Am. J. Neuroradiol. 2003, 24, 1743–1746. [Google Scholar]
- Nardi, C.; Maraghelli, D.; Pietragalla, M.; Scola, E.; Locatello, L.G.; Maggiore, G.; Gallo, O.; Bartolucci, M. A practical overview of CT and MRI features of developmental, inflammatory, and neoplastic lesions of the sphenoid body and clivus. Neuroradiology 2022, 64, 1483–1509. [Google Scholar] [CrossRef]
- Martens, R.M.; Koopman, T.; Lavini, C.; Ali, M.; Peeters, C.F.W.; Noij, D.P.; Zwezerijnen, G.; Marcus, J.T.; Vergeer, M.R.; Leemans, C.R.; et al. Multiparametric functional MRI and 18F-FDG-PET for survival prediction in patients with head and neck squamous cell carcinoma treated with (chemo)radiation. Eur. Radiol. 2020, 31, 616–628. [Google Scholar] [CrossRef]
- Gaddikeri, S.; Tailor, T.; Anzai, Y. Dynamic Contrast-Enhanced MR Imaging in Head and Neck Cancer: Techniques and Clinical Applications. Am. J. Neuroradiol. 2015, 37, 588–595. [Google Scholar] [CrossRef]
- Bernstein, J.M.; Homer, J.J.; West, C.M. Dynamic contrast-enhanced magnetic resonance imaging biomarkers in head and neck cancer: Potential to guide treatment? A systematic review. Oral Oncol. 2014, 50, 963–970. [Google Scholar] [CrossRef]
- Mehanna, H.; Wong, W.-L.; McConkey, C.C.; Rahman, J.K.; Robinson, M.; Hartley, A.G.J.; Nutting, C.; Powell, N.; Al-Booz, H.; Robinson, M.; et al. PET-CT surveillance versus neck dissection in advanced head and neck cancer. N. Engl. J. Med. 2016, 374, 1444–1454. [Google Scholar] [CrossRef]
- Meyer, H.J.; Leifels, L.; Schob, S.; Garnov, N.; Surov, A. Histogram analysis parameters identify multiple associations between DWI and DCE MRI in head and neck squamous cell carcinoma. Magn. Reson. Imaging 2018, 45, 72–77. [Google Scholar] [CrossRef]
- Nardi, C.; Tomei, M.; Pietragalla, M.; Calistri, L.; Landini, N.; Bonomo, P.; Mannelli, G.; Mungai, F.; Bonasera, L.; Colagrande, S. Texture analysis in the characterization of parotid salivary gland lesions: A study on MR diffusion weighted imaging. Eur. J. Radiol. 2021, 136, 109529. [Google Scholar] [CrossRef]
- Kabadi, S.J.; Fatterpekar, G.M.; Anzai, Y.; Mogen, J.; Hagiwara, M.; Patel, S.H. Dynamic Contrast-Enhanced MR Imaging in Head and Neck Cancer. Magn. Reson. Imaging Clin. N. Am. 2018, 26, 135–149. [Google Scholar] [CrossRef]
- Connolly, M.; Srinivasan, A. Diffusion-Weighted Imaging in Head and Neck Cancer. Magn. Reson. Imaging Clin. N. Am. 2017, 26, 121–133. [Google Scholar] [CrossRef]
- Malayeri, A.A.; El Khouli, R.H.; Zaheer, A.; Jacobs, M.A.; Corona-Villalobos, C.P.; Kamel, I.R.; Macura, K.J. Principles and Applications of Diffusion-weighted Imaging in Cancer Detection, Staging, and Treatment Follow-up. Radiographics 2011, 31, 1773–1791. [Google Scholar] [CrossRef]
- Baliyan, V.; Das, C.J.; Sharma, R.; Gupta, A.K. Diffusion weighted imaging: Technique and applications. World J. Radiol. 2016, 8, 785–798. [Google Scholar] [CrossRef]
- Nardi, C.; Vignoli, C.; Vannucchi, M.; Pietragalla, M. Magnetic resonance features of sinonasal melanotic mucosal melanoma. BMJ Case Rep. 2019, 12, e229790. [Google Scholar] [CrossRef]
- Pietragalla, M.; Nardi, C.; Bonasera, L.; Mungai, F.; Taverna, C.; Novelli, L.; De Renzis, A.G.D.; Calistri, L.; Tomei, M.; Occhipinti, M.; et al. The role of diffusion-weighted and dynamic contrast enhancement perfusion-weighted imaging in the evaluation of salivary glands neoplasms. Radiol. Med. 2020, 125, 851–863. [Google Scholar] [CrossRef]
- Mungai, F.; Verrone, G.B.; Bonasera, L.; Bicci, E.; Pietragalla, M.; Nardi, C.; Berti, V.; Mazzoni, L.N.; Miele, V. Imaging biomarkers in the diagnosis of salivary gland tumors: The value of lesion/parenchyma ratio of perfusion-MR pharmacokinetic parameters. Radiol. Med. 2021, 126, 1345–1355. [Google Scholar] [CrossRef]
- Rajabi, M.; Mousa, S.A. The Role of Angiogenesis in Cancer Treatment. Biomedicines 2017, 5, 34. [Google Scholar] [CrossRef]
- Petralia, G.; Summers, P.E.; Agostini, A.; Ambrosini, R.; Cianci, R.; Cristel, G.; Calistri, L.; Colagrande, S. Dynamic contrast-enhanced MRI in oncology: How we do it. Radiol. Med. 2020, 125, 1288–1300. [Google Scholar] [CrossRef]
- Wong, K.H.; Panek, R.; Welsh, L.C.; Mcquaid, D.; Dunlop, A.; Riddell, A.; Murray, I.; Du, Y.; Chua, S.; Koh, D.-M.; et al. The Predictive Value of Early Assessment After 1 Cycle of Induction Chemotherapy with 18F-FDG PET/CT and Diffusion-Weighted MRI for Response to Radical Chemoradiotherapy in Head and Neck Squamous Cell Carcinoma. J. Nucl. Med. 2016, 57, 1843–1850. [Google Scholar] [CrossRef]
- Sherif, M.M.A.-R.A.F.M. Value of Diffusion-Weighted and Perfusion-Weighted MR Imaging in Differentiation of Recurrent Tongue Carcinoma from Post-Treatment Changes. Med. J. Cairo Univ. 2020, 88, 1893–1902. [Google Scholar] [CrossRef]
- Connor, S.; Sit, C.; Anjari, M.; Lei, M.; Guerrero-Urbano, T.; Szyszko, T.; Cook, G.; Bassett, P.; Goh, V. The ability of post-chemoradiotherapy DWI ADCmean and 18F-FDG SUVmax to predict treatment outcomes in head and neck cancer: Impact of human papilloma virus oropharyngeal cancer status. J. Cancer Res. Clin. Oncol. 2021, 147, 2323–2336. [Google Scholar] [CrossRef]
- Galbán, C.J.; Lemasson, B.; Hoff, B.A.; Johnson, T.D.; Sundgren, P.; Tsien, C.; Chenevert, T.L.; Ross, B.D. Development of a Multiparametric Voxel-Based Magnetic Resonance Imaging Biomarker for Early Cancer Therapeutic Response Assessment. Tomography 2015, 1, 44–52. [Google Scholar] [CrossRef]
- Paudyal, R.; Oh, J.H.; Riaz, N.; Venigalla, P.; Li, J.; Hatzoglou, V.; Leeman, J.; Nunez, D.A.; Lu, Y.; Deasy, J.O.; et al. Intravoxel incoherent motion diffusion-weighted MRI during chemoradiation therapy to characterize and monitor treatment response in human papillomavirus head and neck squamous cell carcinoma. J. Magn. Reson. Imaging 2016, 45, 1013–1023. [Google Scholar] [CrossRef]
- King, A.; Keung, C.; Yu, K.-H.; Mo, F.; Bhatia, K.; Yeung, D.; Tse, G.; Vlantis, A.; Ahuja, A. T2-Weighted MR Imaging Early after Chemoradiotherapy to Evaluate Treatment Response in Head and Neck Squamous Cell Carcinoma. Am. J. Neuroradiol. 2013, 34, 1237–1241. [Google Scholar] [CrossRef]
- King, A.D.; Chow, K.-K.; Yu, K.-H.; Mo, F.K.F.; Yeung, D.K.W.; Yuan, J.; Bhatia, K.S.; Vlantis, A.; Ahuja, A.T. Head and Neck Squamous Cell Carcinoma: Diagnostic Performance of Diffusion-weighted MR Imaging for the Prediction of Treatment Response. Radiology 2013, 266, 531–538. [Google Scholar] [CrossRef]
- King, A.D.; Mo, F.K.F.; Yu, K.-H.; Yeung, D.K.W.; Zhou, H.; Bhatia, K.S.; Tse, G.M.K.; Vlantis, A.; Wong, J.K.T.; Ahuja, A.T. Squamous cell carcinoma of the head and neck: Diffusion-weighted MR imaging for prediction and monitoring of treatment response. Eur. Radiol. 2010, 20, 2213–2220. [Google Scholar] [CrossRef]
- Vandecaveye, V.; Dirix, P.; De Keyzer, F.; de Beeck, K.O.; Poorten, V.V.; Hauben, E.; Lambrecht, M.; Nuyts, S.; Hermans, R. Diffusion-Weighted Magnetic Resonance Imaging Early After Chemoradiotherapy to Monitor Treatment Response in Head-and-Neck Squamous Cell Carcinoma. Int. J. Radiat. Oncol. 2011, 82, 1098–1107. [Google Scholar] [CrossRef]
- Brenet, E.; Barbe, C.; Hoeffel, C.; Dubernard, X.; Merol, J.-C.; Fath, L.; Servagi-Vernat, S.; Labrousse, M. Predictive Value of Early Post-Treatment Diffusion-Weighted MRI for Recurrence or Tumor Progression of Head and Neck Squamous Cell Carcinoma Treated with Chemo-Radiotherapy. Cancers 2020, 12, 1234. [Google Scholar] [CrossRef]
- Kim, S.; Loevner, L.; Quon, H.; Sherman, E.; Weinstein, G.; Kilger, A.; Poptani, H. Diffusion-Weighted Magnetic Resonance Imaging for Predicting and Detecting Early Response to Chemoradiation Therapy of Squamous Cell Carcinomas of the Head and Neck. Clin. Cancer Res. 2009, 15, 986–994. [Google Scholar] [CrossRef]
- Berrak, S.; Chawla, S.; Kim, G.; Quon, H.; Sherman, E.; Loevner, L.A.; Poptani, H. Diffusion Weighted Imaging in Predicting Progression Free Survival in Patients with Squamous Cell Carcinomas of the Head and Neck Treated with Induction Chemotherapy. Acad. Radiol. 2011, 18, 1225–1232. [Google Scholar] [CrossRef]
- Cao, Y.; Aryal, M.; Li, P.; Lee, C.; Schipper, M.; Hawkins, P.G.; Chapman, C.; Owen, D.; Dragovic, A.F.; Swiecicki, P.; et al. Predictive Values of MRI and PET Derived Quantitative Parameters for Patterns of Failure in Both p16+ and p16– High Risk Head and Neck Cancer. Front. Oncol. 2019, 9, 1118. [Google Scholar] [CrossRef]
- Matoba, M.; Tuji, H.; Shimode, Y.; Toyoda, I.; Kuginuki, Y.; Miwa, K.; Tonami, H. Fractional Change in Apparent Diffusion Coefficient as an Imaging Biomarker for Predicting Treatment Response in Head and Neck Cancer Treated with Chemoradiotherapy. Am. J. Neuroradiol. 2013, 35, 379–385. [Google Scholar] [CrossRef]
- Marzi, S.; Piludu, F.; Sanguineti, G.; Marucci, L.; Farneti, A.; Terrenato, I.; Pellini, R.; Benevolo, M.; Covello, R.; Vidiri, A. The prediction of the treatment response of cervical nodes using intravoxel incoherent motion diffusion-weighted imaging. Eur. J. Radiol. 2017, 92, 93–102. [Google Scholar] [CrossRef]
- Ding, Y.; Hazle, J.D.; Mohamed, A.S.; Frank, S.J.; Hobbs, B.P.; Colen, R.R.; Gunn, G.B.; Wang, J.; Kalpathy-Cramer, J.; Garden, A.S.; et al. Intravoxel incoherent motion imaging kinetics during chemoradiotherapy for human papilloma-virus-associated squamous cell carcinoma of the oropharynx: Preliminary results form a prospective pilot study. NMR Biomed. 2015, 28, 1645–1654. [Google Scholar] [CrossRef]
- Vogel, D.W.T.; Zbaeren, P.; Geretschlaeger, A.; Vermathen, P.; De Keyzer, F.; Thoeny, H.C. Diffusion-weighted MR imaging including bi-exponential fitting for the detection of recurrent or residual tumour after (chemo)radiotherapy for laryngeal and hypopharyngeal cancers. Eur. Radiol. 2012, 23, 562–569. [Google Scholar] [CrossRef]
- Sheikhbahaei, S.; Taghipour, M.; Ahmad, R.; Fakhry, C.; Kiess, A.P.; Chung, C.H.; Subramaniam, R.M. Diagnostic Accuracy of Follow-Up FDG PET or PET/CT in Patients With Head and Neck Cancer After Definitive Treatment: A Systematic Review and Meta-Analysis. Am. J. Roentgenol. 2015, 205, 629–639. [Google Scholar] [CrossRef]
- Varoquaux, A.; Rager, O.; Dulguerov, P.; Burkhardt, K.; Ailianou, A.; Becker, M. Diffusion-weighted and PET/MR Imaging after Radiation Therapy for Malignant Head and Neck Tumors. Radiographics 2015, 35, 1502–1527. [Google Scholar] [CrossRef]
- Van Der Hoorn, A.; Van Laar, P.J.; Holtman, G.A.; Westerlaan, H.E. Diagnostic accuracy of magnetic resonance imaging techniques for treatment response evaluation in patients with head and neck tumors, a systematic review and meta-analysis. PLoS ONE 2017, 12, e0177986. [Google Scholar] [CrossRef]
- Hustinx, R.; Lucignani, G. PET/CT in head and neck cancer: An update. Eur. J. Nucl. Med. 2010, 37, 645–651. [Google Scholar] [CrossRef]
- Becker, M.; Varoquaux, A.D.; Combescure, C.; Rager, O.; Pusztaszeri, M.; Burkhardt, K.; Delattre, B.M.A.; Dulguerov, P.; Dulguerov, N.; Katirtzidou, E.; et al. Local recurrence of squamous cell carcinoma of the head and neck after radio(chemo)therapy: Diagnostic performance of FDG-PET/MRI with diffusion-weighted sequences. Eur. Radiol. 2017, 28, 651–663. [Google Scholar] [CrossRef]
- El Beltagi, A.H.; ElSotouhy, A.H.; Own, A.M.; Abdelfattah, W.; Nair, K.; Vattoth, S. Functional magnetic resonance imaging of head and neck cancer: Performance and potential. Neuroradiol. J. 2018, 32, 36–52. [Google Scholar] [CrossRef]
- Albano, D.; Bruno, F.; Agostini, A.; Angileri, S.A.; Benenati, M.; Bicchierai, G.; Cellina, M.; Chianca, V.; Cozzi, D.; Danti, G.; et al. Dynamic contrast-enhanced (DCE) imaging: State of the art and applications in whole-body imaging. Jpn. J. Radiol. 2021, 40, 341–366. [Google Scholar] [CrossRef]
- Straub, J.M.; New, J.; Hamilton, C.D.; Lominska, C.; Shnayder, Y.; Thomas, S.M. Radiation-induced fibrosis: Mechanisms and implications for therapy. J. Cancer Res. Clin. Oncol. 2015, 141, 1985–1994. [Google Scholar] [CrossRef]
- D’Urso, P.; Farneti, A.; Marucci, L.; Marzi, S.; Piludu, F.; Vidiri, A.; Sanguineti, G. Predictors of Outcome after (Chemo)Radiotherapy for Node-Positive Oropharyngeal Cancer: The Role of Functional MRI. Cancers 2022, 14, 2477. [Google Scholar] [CrossRef]
- Bicci, E.; Nardi, C.; Calamandrei, L.; Pietragalla, M.; Cavigli, E.; Mungai, F.; Bonasera, L.; Miele, V. Role of Texture Analysis in Oropharyngeal Carcinoma: A Systematic Review of the Literature. Cancers 2022, 14, 2445. [Google Scholar] [CrossRef]


Disclaimer/Publisher’s Note: The statements, opinions and data contained in all publications are solely those of the individual author(s) and contributor(s) and not of MDPI and/or the editor(s). MDPI and/or the editor(s) disclaim responsibility for any injury to people or property resulting from any ideas, methods, instructions or products referred to in the content. |
© 2023 by the authors. Licensee MDPI, Basel, Switzerland. This article is an open access article distributed under the terms and conditions of the Creative Commons Attribution (CC BY) license (https://creativecommons.org/licenses/by/4.0/).