Abstract
Bridges are key social overhead capital facilities with a direct impact on citizen safety and the socioeconomic development of a country. Many bridges in South Korea were completed during the nation’s period of rapid economic growth in the 1970s and 1980s, meaning that bridge aging is now accelerating and should be of real concern. Based on records of other highly developed countries not having adequate maintenance systems for old bridges and consequently experiencing a number of tragic bridge collapses, Korea is at risk of following suit. Being able to measure the efficiency of bridge management considering economic and social values is therefore critical. In this work, a qualitative bridge maintenance priority evaluation model using open-source bridge information was developed. The model was evaluated by applying it to eight actual bridges located in Daegu Metropolitan City, Korea. It is concluded that aging bridge maintenance and management can be performed more efficiently and reliably if the model proposed in this work is used.
1. Introduction
Bridges are important social overhead capital (SOC) facilities that help connect national transportation networks. They are directly related to the safety of people in social and economic aspects [1]. Many bridges in South Korea were completed during the country’s rapid economic growth period of the 1970s and the 1980s. They account for about 63% (c. 19,000 bridges) of all bridges in Korea as of 2022, and the number of old bridges over 30 years old, which will increase rapidly, is expected to increase to about 72% (c. 21,000 bridges) by 2035 [2,3,4,5]. The sudden overwhelming number of aging bridges was the result of the conservative evaluation of SOC facilities when they were designed and constructed several decades ago.
The aging of bridges can heighten people’s worries about the potential for major structural failures. Down the line, considerable funds need to be spent on ad-hoc repairs, squeezing funding in other important areas for future generations. Unfortunately, bridge aging is accelerating in Korea, and preventive, preemptive, and economic maintenance must be carried out to effectively cope with the problem. Ideally, a systematic maintenance system should be established to improve maintenance efficiency at the national level, and the appropriateness and adequacy of investment in maintenance should be determined based on quantitative and qualitative indicators such as bridge size, age, and risk [6,7].
A lack of means for determining a maintenance system for old bridges is not a new problem. There are plenty of past cases in other highly developed nations in which bridges shockingly collapsed, leading to loss of life and public inquiries [8]. In the United States alone, there have been several hundred documented bridge collapses since the 1980s. These include the Mianus River Bridge in 1983, the Schoharie Creek Bridge in 1987, the Interstate 35W bridge over the Mississippi River in August 2007, and the Interstate 5 bridge in Washington state in 2013. Also, in August 2018, the Polcevera Bridge collapsed in Genoa, Itlay, killing approximately 40 people. Rymsza, J., warned of the danger of collapsing the Polcevera Bridge about 20 years ago before it collapsed [9]. Even though structural defects were discovered, the bridge was not maintained properly, as it was believed that maintenance could damage aesthetics. Italy’s bridge management regulations have been significantly impacted by this accident, and the importance of bridge maintenance has been reconfirmed. In Japan, the importance of paying greater attention to aging SOC facilities was recognized because of the 2012 Sasago Tunnel collapse near Tokyo, resulting in a fresh $3.5 billion investment in maintenance projects for bridges, roads, and schools. Following similar disasters, other countries such as the UK, Canada, and Australia have introduced and operated evaluation systems for infrastructure by moving away from centralized government schemes to localized schemes. Korea needs to prepare for upcoming bridge aging by adopting good examples of maintenance system practices and more efficient investment principles from those who have already learned harsh lessons. Presently, in the case of Korea, the investment in maintenance costs compared to the asset value of facilities is only about one-third of that of other developed countries. In order to solve this problem, studies that can evaluate the stability of bridges are being actively conducted, and the representative methods for evaluating the stability of bridges include the probabilistic method and the neural network method [10,11,12,13,14,15,16,17]. However, probabilistic and neural network methods are limited to evaluating single bridges based on complex correlations [18]. Therefore, simplification is needed to evaluate numerous bridges and use them in government.
To help address the impending aging bridge issues in Korea, and to derive a more efficient and effective system for managing old bridges, factors that can reflect bridge risk factors, importance, and relativity were identified. Based on these factors, a model was developed to evaluate the maintenance priority of megacity bridges. In this work, a maintenance priority asses procedure was developed from open-source bridge information [19,20,21]. A total of seven factors (safety grade, age, design load, seismic design status, ADT, facility classification, and the number of lanes) were required for the maintenance priority model, and the factors were applied by dividing them into risk scores, importance, and comparison scores. In the case of factors related to the risk score, an analytic hierarchy process (AHP) was used in order to determine the importance of each factor [22]. This involved conducting a survey with 35 experts in the field of bridges and maintenance. Eight bridges located in megacities were then selected, and the applicability of the proposed model was assessed through the application of the maintenance priority evaluation model of each selected bridge.
2. Concept of Risk
The International Organization for Standardization (ISO) defines “risk” as the effect of uncertainty on objects [23]. Merz, B. noted that risk-based approaches provide a methodological framework formed by three elements (hazard, exposure and vulnerability) [24]. In addition, studies using the framework to which these three factors are applied are being actively conducted. However, such methods are particularly suitable for low-probability high-impact events, such as floods and seismic [25].
Risk management can be understood as the process of assessing the probability and outcome of risk, establishing a response plan, and achieving objectives through active and continuous management. As shown in Figure 1, the National Health Service (NHS) in England refers to the repeated relationship between risk identification, risk assessment, risk response, planning, and risk monitoring [26].
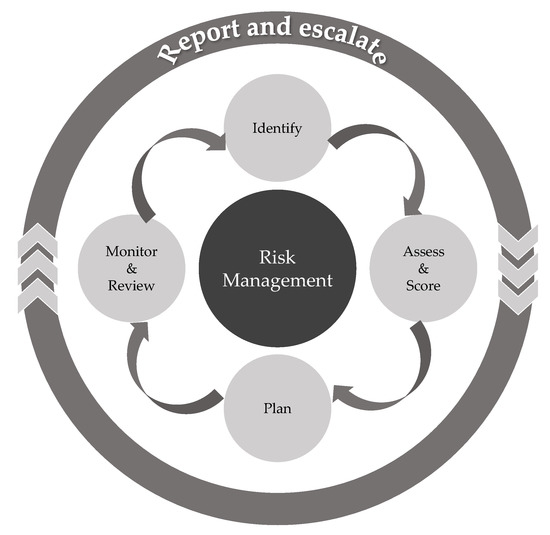
Figure 1.
The risk management process (NHS England, 2020).
Risk analysis is divided into quantitative risk analysis and qualitative risk analysis. Quantitative risk analysis is a process of numerically deriving and analyzing the influence of various factors on the target, and qualitative risk analysis is derived from the relationship between possibility and weight by analyzing the impact of each factor and evaluating the degree of risk relative advantage.
Coe described the necessity of a complex management system that included risk analysis so as to effectively perform bridge asset management [27]. He also stated that standardized inspection programs, inspection cycles, efficient distribution of repair and reinforcement costs, and priority determination are required for risk analysis. Elsewhere, the International Infrastructure Management Manual (IIMM) [28], published by the National Asset Management Steering Committee (NAMS), presents research on SOC facilities and recommends how to apply findings. In IIMM, improved bridge management procedures are described. These include details on risk analysis, added procedures such as condition evaluation and performance measurement, damage type and risk assessment, response evaluation and selection, and optimal response.
Spangler et al.’s “Risk Management Strategy for Bridges and Structures” puts forward a risk index combining status ratings with road classification indicators, forming a business plan network (BPN) for risk analysis. This was limited to the direct function of bridges, and existing research analyzing risk levels was improved to additionally derive risk factors for indirect functions [29].
Cremona proposed evaluating risk through qualitative evaluation because of the challenge of quantitatively deriving the probability and associated effects of an event that did not occur [30]. He emphasized the need for continuous correction through expert consultation to increase the accuracy of qualitative evaluation.
Santarsiero, G. describes the bridge management guidelines in Italy and points out their differences from other approaches adopted worldwide [31]. In addition, open data such as Google street view and OpenStreetMap were used for additional data required for the study. Through this, considering the characteristics of the risk classification results, a higher evaluation level and a method of prioritizing bridges were proposed.
3. Proposal for a Bridge Maintenance Priority Selection Model
This work proposed a model that can select priorities when planning bridge maintenance. The model made use of open source information collected using a facility management system (FMS), a road bridge and tunnel status information system, a public data portal, and Daegu Metropolitan City traffic comprehensive information. The process of formulating the bridge maintenance priority selection model is shown in Figure 2.
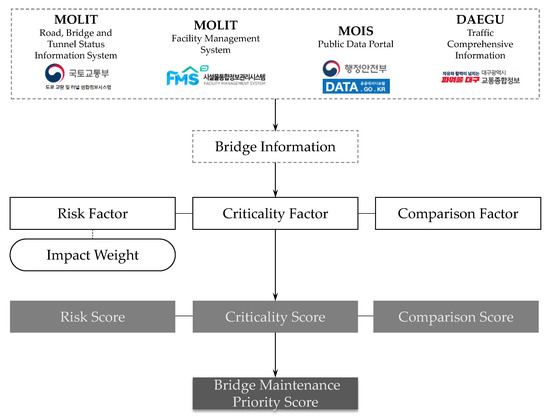
Figure 2.
Bridge maintenance priority selection model derivation process.
Bridge maintenance priority is established by multiplying the scores derived by comprehensively evaluating three factors—risk, criticality, and comparison—as shown in Equation (1).
Here, the Risk Score is calculated as the multiplication of the weight to the Risk Factor of the bridge targeting the Risk Factor and priority derivation. Here, the Risk Score can be calculated as a product of Risk Factor and Impact Weight. The risk factor does not take into account factors such as bridge size or social value and consists of elements reflected in the design of the bridge and elements corresponding to maintenance. The Criticality Score consists of the average daily traffic (ADT) as a Criticality Factor for evaluating bridge importance, which is an indicator of the importance of their impact on society. The Comparison Score consists of the classification of facilities and two-way lanes according to whether they are Type 1 or Type 2 facilities under Korea’s Enforcement Decree of the Special Act on Safety and Maintenance of Facilities shown in Table 1 [32].

Table 1.
Classification of facilities in Korea.
3.1. Risk Score Assessment Criteria
For the bridge information, a total of four factors, that is, age, design load, presence or absence of seismic design, and safety grade, were selected to calculate the risk score. However, the effects on a bridge are all different depending on the characteristics of the selected factors, and it is difficult to establish standards by analyzing the effects of each factor on a bridge. Therefore, in this study, weights for risk factors were derived through an AHP, and the scores according to the evaluation criteria for each factor were calculated by multiplying the weights.
The AHP consisted of a total of 35 experts, including 15 professors of civil engineering, 10 researchers in the area of bridges, and 10 maintenance practitioners. The 33 results with a consistency index (CI) evaluated below 0.1 were analyzed. The Consistency Index (CI) can be used to measure the consistency of questioners performing pairwise comparisons, as well as to identify any contradictions in the choices of the questioners [22]. In case the consistency index is high, it means that the questionnaire did not answer correctly or the respondent could not be trusted. It is considered unreliable if the consistency index is 0.1 (10%) or more. Generally, the higher the expertise of the respondent, the lower the consistency index. As a result of the AHP, the safety grade was highest among a total of four risk factors, the presence or absence of seismic design, age, and design load were high, and the final weight was selected in high order. The AHP analysis results are shown in Figure 3.
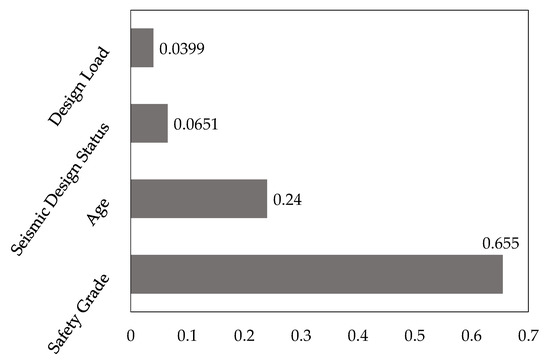
Figure 3.
Factor ranking results following the analytical hierarchical process (AHP).
The score for each factor that can evaluate the risk factor was calculated as follows. Age and design load were classified into four classes: less than 10 years, more than 10 years to less than 20 years, more than 20 years, less than 30 years, more than 30 years, DB-24, DB-18, DB-13.5, and unclear; and were classified into two classes according to the presence or absence of seismic design. In Korea, DB loads are virtual-designed vehicles in the form of semi-trailers, and they follow the same design procedures as AASHTO’s LRFD bridge design specifications. Safety grades were classified into five grades from A to E according to the standards in Korea’s Enforcement Decree of the Special Act on the Safety and Maintenance of Facilities [31], and these are displayed in Table 2. Table 3 shows the score composition according to the evaluation criteria for each risk factor through the information on the bridge and calculates the risk score using Equation (2).

Table 2.
Score organization by risk factor.

Table 3.
Score composition by risk factor.
3.2. Criticality Score Assessment Criteria
To propose a bridge maintenance priority selection model, an indicator that can quantitatively evaluate the social importance of the bridge, as well as the risk of the bridge, is needed. Quantitative indicators that can indicate the social importance of bridges include traffic volume, bridge asset value, and bridge location. In this study, average daily traffic (ADT) was used as an indicator of the social importance of bridges; ADT is the most accurate indicator that can quantitatively represent the number of citizens using bridges. The ADT value used in this study was cited following a survey conducted in Daegu, Korea, on 24 weekdays between September and December 2021.
In order to calculate the importance score, ADT was classified into six evaluation criteria, and a corresponding score was assigned to each section. The scores and ranges according to the evaluation criteria can be adjusted according to the perspective of the bridge management entity, and in this work, Table 4 shows the composition of scores according to the evaluation criteria for each criticality factor.

Table 4.
Score by criticality factor.
3.3. Comparison Score Assessment Criteria
The comparison score is an indicator that can represent the size of a bridge. It is calculated by multiplying the factor that can compare the relative size of a bridge by the score corresponding to the evaluation criteria. The comparison factor should be able to consider the unique size of the bridge to be calculated to compare the relative size of the bridge. This is to consider the relativity of each bridge as an indicator that can quantitatively express the value of a bridge. Therefore, the comparison factor was adopted as a total of two factors, comprising the classification of facilities designated by the country and the total number of lanes in both directions. In this case, the facilities were classified into Type 1, Type 2, and Type 3 facilities by using the standards in the Enforcement Decree of the Special Act on the Safety and Maintenance of Facilities [14]. Table 1 shows the classification of Korean facilities, and Table 5 shows the scores according to the evaluation criteria for each comparative factor.

Table 5.
Scores by comparison factor.
4. Application of the Proposed Model to Eight Megacity Bridges
For the evaluation of the maintenance priority selection model proposed in this work, maintenance priority was derived by applying the proposed model to actual bridges located in megacities.
4.1. Bridge Selection with Maintenance Priority Mode
In order to select bridges to which the maintenance priority model could be applied, the research team collected data on bridges in Daegu, one of Korea’s major cities, where ADT data were available. There were a total of 18 bridges with ADT data in Daegu. Among the 18 bridges with an ADT value of 50,000 or more were targeted for the maintenance priority model, and a total of eight bridges were selected. Table 6 shows input information on eight bridges with the maintenance priority model.

Table 6.
Data on the eight bridges to which the maintenance priority model could be applied.
All bridges applied to the proposed maintenance priority model are located in megacities, with completion years distributed from 1986 to 2003. The design loads are all identical to DB-24, and some bridges have seismic designs, and some bridges do not. The B safety grade constitutes seven bridges, and C grade constitutes one bridge, and ADT values range from 53,644 to 94,687. The facilities are classified into four places of Type 1 and four places of Type 2, and bridges have 6–10 lanes.
4.2. Selection of Maintenance Priorities for Megacity Bridges
The collected bridge information, as shown in Table 6, was applied in the proposed maintenance priority model using open data and calculated through Excel. Figure 4 shows an example of data entry into Excel to help prioritize bridge maintenance. Figure 5 and Table 7 show the results of the maintenance priority selection for the eight bridges to which the proposed model could be applied.
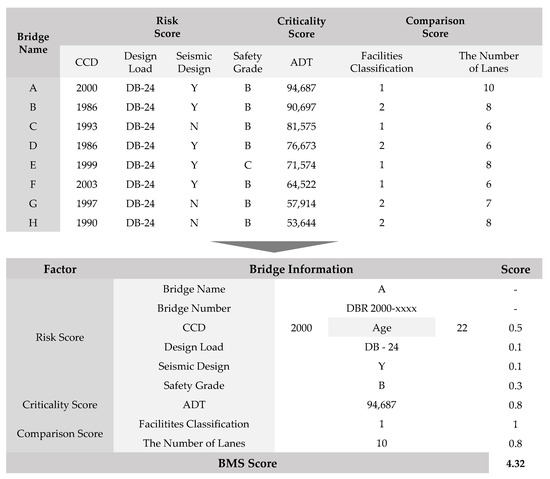
Figure 4.
Examples of data input into Excel to help prioritize bridge maintenance.
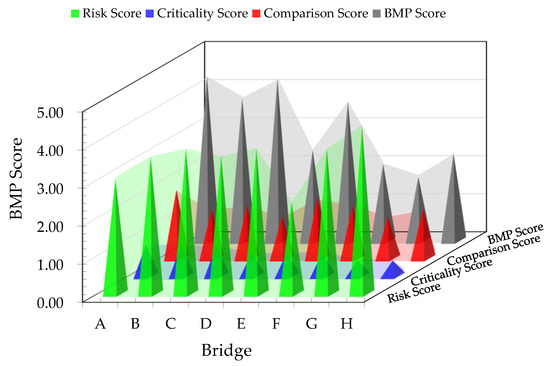
Figure 5.
Distribution by factors according to BMP score results.

Table 7.
Maintenance priority selection results.
To identify the maintenance priority of megacity bridges, the BMP (Bridge Maintenance Priority) score for the A bridge, which, at 4.32 points, was calculated to be the highest scoring, meaning the A bridge should be given the highest maintenance priority among the eight comparative bridges. In contrast, the G bridge obtained a BMP score of 1.67, indicating that maintenance could be carried out last among the eight bridges. In addition, the bridge with the highest risk score was 4.40 for the H bridge, the highest importance score was 0.80 for the A, B, and C bridges, and the highest comparison score was 1.80 for the A bridge. This means that even if one of the three scores constituting the BMP score (risk score, criticality score, and comparison score) is located in a high area, the maintenance ranking may be lowered if the scoring area of another area is located in a low area. Figure 6 shows the results by maintenance priority.
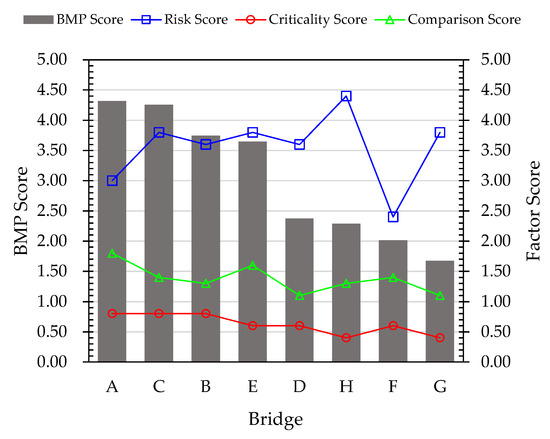
Figure 6.
Results by maintenance priority.
4.3. Analysis of Maintenance Priorities of Bridges in Megacities
As shown in Table 7, the result of the BMP score data analysis, the risk score of the bridge was most affected by age. Age has the greatest impact on the risk score, through the safety grade, and is the most important factor. This is because regular inspections and safety diagnoses are carried out based on the safety grade. In the case of low safety grades, the safety grade of the bridge is raised to a safe level by performing immediate maintenance, resulting in a small deviation of safety grade for each bridge. In the risk score, the effect of design load was found to be the smallest because most of the bridges in Megacity were designed with DB-24, giving the same score. The H bridge had the highest risk score of 4.4; at the same time, the BMP score was 2.29, which was the sixth-highest number among the eight bridges. Bridge A, which had the highest BMP score of 4.32 and the lowest risk score of 3.0 among eight bridges, except for Bridge F, had the highest BMP score and the lowest risk score. This is because Critically Score and Comparison Score were the highest among the eight bridges.
The results of this study are different from the case of considering only the stability level that determines the existing maintenance priority. It is judged that the model developed in this study reflects the influence and importance of bridges well. As shown in Figure 5, the BMP score is not calculated by only one of the three factors. A combination of factors is used to calculate the BMP score, not just one of these factors. However, as shown in Figure 6, It can be seen that when the BMP score is ranked in ascending order, the tendency is similar to that of the Criticality score and Comparison Score. This is because the factors constituting Criticality Score and Comparison Score have social values. As such, the maintenance priority of the bridge should reflect not only the safety level of the bridge but also the social value of the bridge. The combined factors of the model proposed in this study can help determine the maintenance priority of the Megacity bridge, and further accuracy can be achieved by applying adding factors related to the life and influence of the bridge.
5. Conclusions
Some countries, such as Korea, face serious consequences from the increasing number of aging major bridge structures. Ad hoc maintenance and repair can be costly and not always well-targeted. It is important to have an effective and efficient maintenance system in place.
Instead of simply determining risk according to a bridge’s structural details and comparing the maintenance order (as is often done), a maintenance priority selection model for megacity bridges was proposed based on the qualitative risk, importance, and comparison score drawn from a dataset of actual bridges. In the case of selecting the existing maintenance priority, maintenance is performed on bridges with low safety grades based on national standards. This approach is a result of the lack of consideration of the social value and importance of bridges. In the proposed bridge maintenance priority model, not only the risk score but also the criticality score were used to reflect the social value and importance of the bridge. This can be exemplified by the values of Bridge A and Bridge H in Table 7 Maintenance priority selection results. In the case of bridge A, the risk score was 3.0, and it had the second lowest value among the eight bridges but had the highest BMP score. In addition, the H bridge had the highest risk score of 4.4 but showed the sixth-highest BMP score.
In the proposed maintenance priority model of bridges, bridge social value and importance were reflected by using not only risk scores but also importance scores. Therefore, it can be judged that it is possible to select the bridge maintenance ranking that is required by broader society rather than purely bridge maintenance ranking according to existing safety grades. The model proposed in this study uses only data provided by national institutions and local governments and takes a total of three scores (risk score, importance score, and comparison score) so that a total of seven factors constituting each score can be applied. Further research is needed on additional factors that can represent risks in bridges other than the seven factors used to determine the maintenance priority of a proposed bridge. For example, it is necessary to add the effects caused by the closure of the bridge during maintenance and the presence or absence of other facilities on the upper and lower parts of the bridge. This is a limitation that occurs because the factors of the model developed in this study use only data that can be utilized by national institutions and local governments, and it is judged that these problems should be recognized and improved by the national and local governments. In addition, since there is no consideration for hazards that act as an absolute factor in the stability of bridges, there is a need to consider factors for hazards in the future.
Due to the fact that the model in this present work uses relative criteria for prioritization, it can be more efficiently used as a decision-making model when combined with conventional prioritization methods rather than just using it independently. This is because the proposed model has a problem in that it is impossible to evaluate each bridge compared to previous studies based on probabilistic methods and neural networks, and the accuracy of the evaluation may be reduced. However, the number of bridges that the bridge management entity is in charge of is very large, and there are difficult problems in accessing a significant number of bridges in a sophisticated manner. Therefore, it is judged that the reliability and accuracy of the proposed model should be improved through continuous research, and through the improvement of the proposed model, the bridge management entity will be able to reasonably and simply determine the priority of bridge maintenance. In addition, it is emphasized once again that the purpose of this study is not to evaluate the stability of bridges but to help determine the priorities for performing bridge maintenance.
Author Contributions
Conceptualization, J.L., S.C., J.-M.Y. and C.C.; methodology, J.L., S.C., J.-M.Y. and C.C.; software, J.L. and C.C.; validation, J.L., S.C., J.-M.Y. and C.C.; formal analysis, J.L., S.C., J.-M.Y. and C.C.; investigation, J.L. and C.C.; resources, J.L. and C.C.; data curation, J.L. and C.C.; writing—original draft preparation, J.L.; writing—review and editing, J.L., S.C., J.-M.Y. and C.C.; visualization, J.L.; supervision, C.C.; project administration, S.C. and C.C.; funding acquisition, S.C. and C.C. All authors have read and agreed to the published version of the manuscript.
Funding
This work is supported by the Korea Agency for Infrastructure Technology Advancement (KAIA) grant funded by the Ministry of Land, Infrastructure and Transport (Grant 22NSPS-B153962-05).
Institutional Review Board Statement
Not applicable.
Informed Consent Statement
Not applicable.
Data Availability Statement
Data available in a publicly accessible repository that does not issue DOIs Publicly available datasets were analyzed in this study. This data can be found here: [https://www.fms.or.kr/com/mainFrame.do (accessed on 12 February 2023)], [https://www.data.go.kr/index.do (accessed on 12 February 2023)].
Conflicts of Interest
The authors declare no conflict of interest.
References
- Imhof, D. Risk Assessment of Existing Bridge Structures. Ph.D. Thesis, University of Cambridge, Cambridge, UK, 2004. [Google Scholar]
- Lee, I.K. Improvement of Bridge Inspection System by the Damage Analysis; Expressway and Transportation Research Institute: Gimcheon-si, Republic of Korea, 2013. [Google Scholar]
- Jeong, D.S. Establishment of a Research Base for Longevity of Public Bridges through Performance Evaluation of Old (Removed) Bridges; Korea Institute of Civil Engineering and Building Technology (KICT): Goyang-si, Republic of Korea, 2016. [Google Scholar]
- MOLIT. Yearbook of Road Bridge and Tunnel Statistics; Ministry of Land, Infrastructure and Transport (MOLIT): Sacheon-si, Republic of Korea, 2022.
- Kang, J.M.; Lee, D.Y.; Park, J.B.; Lee, M.J. A Study on Development of BIM-Based Asset Management Model for Maintenance of the Bridge. Korean J. Constr. Eng. Manag. 2012, 15, 3–11. [Google Scholar] [CrossRef]
- Kim, D.; Lee, M. Basic Study for Development of Risk Based Bridge Maintenance Priority Decision Model. Korean J. Constr. Eng. Manag. 2017, 18, 108–116. [Google Scholar] [CrossRef]
- Park, S.; Oh, E.; Choi, B.; Kim, J. A Development Direction of Infrastructure Based Disaster Mitigation & Management Integrated System. Korean J. Constr. Eng. Manag. 2016, 17, 134–142. [Google Scholar]
- Enke, D.L.; Tirasirichai, C.; Luna, R. Estimation of Earthquake Loss Due to Bridge Damage in the St. Louis Metropolitan Area. II: Indirect Losses. Nat. Hazards Rev. 2008, 9, 12–19. [Google Scholar] [CrossRef]
- Rymsza, J. Cause of the Collapse of the Polcevera Viaduct in Genoa, Italy. Appl. Sci. 2021, 11, 8098. [Google Scholar] [CrossRef]
- Banks, J.C.; Camp, J.C.; Abkowitz, M.D. A Screening Method for Bridge Scour Estimation and Flood Adaptation Planning Utilizing HAZUS-MH 2.1 and HEC-18. Nat. Hazards 2016, 83, 1731–1746. [Google Scholar] [CrossRef]
- Barbetta, S.; Camici, S.; Moramarco, T. A Reappraisal of Bridge Piers Scour Vulnerability: A Case Study in the Upper Tiber River Basin (central Italy). J. Flood Risk Manag. 2017, 10, 283–300. [Google Scholar] [CrossRef]
- Deng, L.; Cai, C.S. Bridge Scour: Prediction, Modeling, Monitoring, and Countermeasures. Pract. Period. Struct. Des. Constr. 2010, 15, 125–134. [Google Scholar] [CrossRef]
- Dikanski, H.; Hagen-Zanker, A.; Imam, B.; Avery, K. Climate Change Impacts on Railway Structures: Bridge Scour. Proc. Inst. Civ. Eng.-Eng. Sustain. 2016, 170, 237–248. [Google Scholar] [CrossRef]
- Hung, C.C.; Yau, W.G. Vulnerability evaluation of Scoured Bridges Under Floods. Eng. Struct. 2017, 132, 288–299. [Google Scholar] [CrossRef]
- Wang, Y.M.; Elhag, T.M. Evidential Reasoning Approach for Bridge Condition Assessment. Expert Syst. Appl. 2008, 34, 689–699. [Google Scholar] [CrossRef]
- Liu, M.; Frangopol, D.M. Probility-Based Bridge Network Performance Evaluation. J. Bridge Eng. 2006, 11, 633–641. [Google Scholar] [CrossRef]
- Ni, Y.Q.; Ye, X.W.; Ko, J.M. Monitoring-Based Fatigue Reliability Assessment of Steel Bridges: Analytical Model and Application. J. Struct. Eng. 2010, 136, 1563–1573. [Google Scholar] [CrossRef]
- Pregnolato, M. Bridge Safety is not for Granted-A Novel Approach to Bridge Management. Eng. Struct. 2019, 196, 109193. [Google Scholar] [CrossRef]
- Facility Managements System. Available online: https://www.fms.or.kr/com/mainForm.do (accessed on 5 February 2023).
- MOLIT Road Bridge and Tunnel Status Information System. Available online: https://bti.kict.re.kr/bti/publicMain/main.do (accessed on 5 February 2023).
- Daegu Statistics. Available online: http://stat.daegu.go.kr/statsPublication/policyPart/trafficResearch.do (accessed on 5 February 2023).
- Al-Harbi, K.M.A.S. Application of the AHP in Project Management. Int. J. Proj. Manag. 2001, 19, 19–27. [Google Scholar] [CrossRef]
- ISO 31000:2018; Risk Management. International Organization for Standardization (ISO): Geneva, Switzerland, 2018.
- Merz, B.; Hall, J.; Disse, M.; Schumann, A. Fluvial Flood Risk Management in a Changing World. Nat. Hazards Earth Syst. Sci. 2010, 10, 509–527. [Google Scholar] [CrossRef]
- Mondoro, A.; Frangopol, D.M. Risk-Based Cost-Benefit Analysis for the Retrofit of Bridges Exposed to Extreme Hydrologic Events Considering Multiple Failure Modes. Eng. Struct. 2018, 159, 310–319. [Google Scholar] [CrossRef]
- National Health Service (NHS). Risk Management Policy and Procedure; National Health Service (NHS): London, UK, 2015.
- Coe, D. Risk Based Bridge Asset Management. In Proceedings of the Australian Small Bridge Conference, Sydney, NSW, Australia, 12–13 October 2005. [Google Scholar]
- IPWEA. International Infrastructure Management Manual (IIMM); IPWEA: North Sydney, Australia, 2006. [Google Scholar]
- Spangler, B.; Thompson, P.D.; Baker, M., Jr. Risk Management Strategy for Bridges and Structures; Federal Highway Administration: Washingto, DC, USA, 2009.
- Cremona, C.F. Risk Analysis of Vulnerable Bridges on the national Road Network in France. Transp. Res. Rec. 2015, 2481, 18–25. [Google Scholar] [CrossRef]
- Santarsiero, G.; Masi, A.; Picciano, V.; Digrisolo, A. The Italian guidelines on risk classification and management of bridges: Applications and remarks on large scale risk assessments. Infrastructures 2021, 6, 111. [Google Scholar] [CrossRef]
- Ministry of Land, Infrastructure and Transport. Enforcement Decree of the Special Act on Safety and Maintenance of Facilities; MOLIT: Sacheon-si, Republic of Korea, 2020.
Disclaimer/Publisher’s Note: The statements, opinions and data contained in all publications are solely those of the individual author(s) and contributor(s) and not of MDPI and/or the editor(s). MDPI and/or the editor(s) disclaim responsibility for any injury to people or property resulting from any ideas, methods, instructions or products referred to in the content. |
© 2023 by the authors. Licensee MDPI, Basel, Switzerland. This article is an open access article distributed under the terms and conditions of the Creative Commons Attribution (CC BY) license (https://creativecommons.org/licenses/by/4.0/).