Abstract
Piezoelectric atomization, which breaks liquid into tiny droplets, is widely used in aerospace, medicine, and health. Most research in piezoelectric atomizers has increased the atomization amount by improving mechanical structure and optimizing the vibration characteristics. However, as the core component of the atomizer is to realize atomization using the dynamic conical angle effect, the micro-tapered hole on the atomizing sheet has not been deeply studied. To eliminate the negative influence of the uneven burr caused by the hole machining process on the atomizing sheet, electrolytic polishing processing is proposed in this study to improve the quality of the micro-tapered holes. First, a theoretical model of the atomization amount and the conical angle is established. Second, the hole diameter and burr height are measured using a microscope, and the effectiveness of polishing on the burr removal of holes is verified. Lastly, the relationship between the conical angle and atomization amount is determined through an atomization amount experiment, which guides the revision of the theoretical model. The experimental results show that when the conical angle is 48,267° (the polishing time is 5 min), the atomization amount reaches a maximum of 5.202 mL/min, which is 3.93 times larger than that of the untreated one. This study demonstrates that polishing can effectively remove burr in the process of hole machining, which provides theoretical guidance for improving the quality of atomization sheets, and will further improve the atomization number of atomizers.
1. Introduction
Piezoelectric atomization is a process that uses piezoelectric drive technology to disperse a liquid into tiny droplets. Dispersing a liquid into tiny droplets can be used in fuel injection, medical aerosol inhalation therapy, and inkjet printing. Piezoelectric atomizers are divided into two types: surface acoustic wave atomizers and mesh atomizers. Mesh atomizers can be divided into static mesh atomizers and vibrating mesh atomizers (VMA) in accordance with whether the microplate vibrates during the working process. Specifically, the VMA uses the inertial force generated by the piezoelectric vibrator to break the capillary force indicated by the liquid, thus clamping droplets to achieve atomization. It has the advantages of a simple structure, a high energy utilization rate, small atomized droplets, and uniform distribution [1,2,3].
With the increasing requirements for the atomization quantity and particle size of atomizers, traditional atomizers hardly meet the requirements due to the limitation of their structure and the imperfect working principle. Therefore, researchers have proposed two main solutions: mechanical structure improvement and vibration optimization in the mesh atomizer.
Maehara pioneered the construction of a VMA composed of multi-pinhole thin plates. The results showed that the maximum atomization rate was approximately proportional to the number of micro-tapered holes [4]. Subsequently, to improve the atomization number of atomizers, researchers have improved the mechanical structure of mesh atomizers. Toda proposed a flat plate atomizer with small holes and then removed the relevant water supply device to obtain the smallest piezoelectric atomizer at that time, which was not only convenient to carry, but also exhibited improved atomization amount [5,6,7]. After Lu and Shen et al. studied an atomizer with a cymbal-type high-power driver [8,9], Huang et al. proposed applying it during the cooling of electronic products. The research showed that the ultrasonic atomizer composed of an annular design and a micro-nozzle plate with multiple tiny nozzles had the advantages of a high atomization rate and amount under low power consumption [10]. Soon afterward, Chen designed a new piezoelectric ceramic ultrasonic atomizer. The piezoelectric atomizer was composed of two piezoelectric ceramic films (110 kHz) and a stainless steel micropore disk with different outlet diameters. The volumetric flow rate increased with the increase in micropore outlet diameter. As the flow rate increased, the heat flux increased, but the spray cooling efficiency decreased [11].
At the same time, researchers have optimized vibration to improve the atomization amount. After Maehara et al. proposed the VMA, they conducted a further study and found that when the first resonance frequency of the internal and external parts of the components coincided with the second resonance frequency of the whole system, the atomization amount of the atomizer was large [12]. Whereafter, based on a piezoelectric-driven droplet injection device proposed by Percin et al., Lam found that a PMN-PT single crystal with ultrahigh voltage electric coefficient could generate higher axial displacement at a lower driving voltage [13,14,15]. Recently, Yan conducted extensive research on mesh atomizer devices, particularly on the influence of the dynamic conical angle, frequency, voltage, and other parameters on atomization rate [16]. Pallavi then performed a system vibration analysis of a micro-electro-mechanical system-based VMA through finite element analysis to study the resonant frequencies, dispositions, velocities, and mode shapes of the nebulizer’s various dynamic modes. The results could be used to design performance-enhanced VMA for specific future applications [17,18,19].
Existing research has focused on mechanical structure improvement and the vibration optimization of mesh atomizers. However, the influence of the dynamic conical angle effect and the machining performance of the micro-tapered hole, as the core component of an atomizer, on the atomization effect has rarely been mentioned by researchers, let alone deeply studied. In this study, the influence of laser processing technology on the morphology of micro-tapered holes and on atomization was studied.
At present, the micro-tapered hole group of industrial metal sheets is made by laser thermal processing technology, so the molten metal fragments will gather near the micro-tapered holes and form uneven burrs, which will affect the atomization amount of the metal sheets [20]. To solve the influence of burr caused by micro-tapered hole machining on the atomization effect, electrolytic polishing technology is proposed to treat metal sheets. First, a theoretical model of atomization amount and electrolytic polishing time was established to provide theoretical guidance for finding the appropriate electrolytic process time. The diameter and burr height of the metal sheets after different electrolysis time were then measured using an ultra-depth-of-field 3D microscope to verify the effectiveness of electrolytic polishing on the removal of burr of metal sheets. Lastly, the relationship between electrolytic time and atomization amount was determined through an atomization amount experiment, which proved that the electrolytic process had the effect of improving the atomization performance and guided the revision of the theoretical model. In sum, the electrolytic process was put forward to remove the burr of micro-tapered holes, and the relationship between electrolytic time and atomization amount was established, which provided a theoretical basis for improving the processing quality of industrial atomizers and further enhanced the atomization effect of micro-tapered hole piezoelectric atomizers.
2. Theoretical Model of Atomization Amount and Electrolysis Time
2.1. Factors Affecting Electrolytic Polishing
The main factors altering the effect of electrolytic polishing are polishing voltage, electrolyte temperature, polishing time, and the distance between anode and cathode plates [21].
First, when the polishing voltage is excessively low, the metal anode surface is in the activated state and dissolved, inducing surface erosion, resulting in a rough surface. When the polishing voltage is comparatively high, oxygen will precipitate out of the anode surface, causing the local surface of the anode to be covered by bubbles and leading to poor conductivity. At the same time, local overheating may occur, resulting in excessive corrosion of the metal surface, thus making the surface rougher [22,23,24]. Second, a relatively high temperature will cause the liquid around the anode to boil and create bubbles, which will destroy the solid film on the anode surface, but the polishing effect is not obvious when the temperature is below 30 °C. Lastly, if the distance between the cathode and the anode is relatively long, the resistance and power consumption will increase, which will make the solution easy to heat up, thus affecting the polishing quality. On the contrary, if the distance is too small, it is easy to short circuit, resulting in damage to the metal sheet [25,26].
Considering that the effectiveness of electrolytic polishing is influenced by the many factors mentioned above, to explore whether the atomization effect will change due to electrolytic polishing, this study will control other variables of electrolytic polishing and only change the electrolytic polishing time.
2.2. Mathematical Expressions of Atomization Amount and Polishing Time
Given that the metal sheet is made of 304 stainless steel, the quality of the whole metal sheet is
where is the density of the stainless steel, is the radius of the metal sheet, and is the thickness of the metal sheet.
The micro-tapered hole of the metal sheet has a circular shape; given , , the mass of the micro-tapered hole is
where D is the diameter of the large end of a micro-tapered hole, d is the diameter of the small end of a micro-tapered hole, and is the number of micro-tapered holes.
The actual metal sheet mass is the mass of the entire metal sheet without laser processing minus the mass of micro-tapered holes:
According to Faraday’s law of electrolysis, the mass of a metal sheet with chemical reaction on the electrode is
where M is the molar mass of the reactive substance, F is the Faraday constant, is the electron measurement coefficient in the electrode reaction measurement equation, t is the reaction time, and I is the current intensity.
By the law of conservation of mass,
where is the radius of the metal sheet after electropolishing, D′ is the diameter of the large end of a micro-tapered hole after electropolishing, and d′ is the diameter of the small end of a micro-tapered hole after electropolishing.
Figure 1 shows a structural drawing of the atomization sheet. Given that the radius R of the metal sheet minimally changes in electrolytic polishing, it can be ignored. Hence, Equation (5) can be simplified as
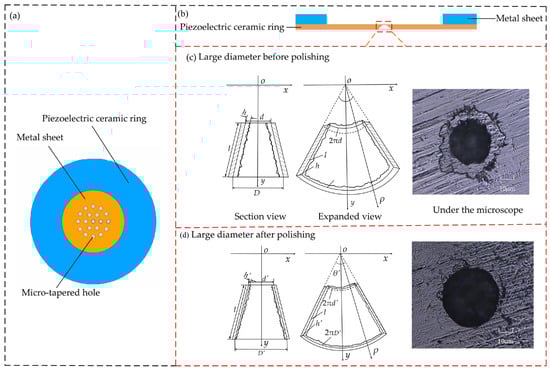
Figure 1.
Structural drawing of the atomization sheet: (a) Vertical view; (b) Side view; (c) Large end of a micro-tapered hole before polishing; (d) Large end of a micro-tapered hole after polishing.
The volume of micro-tapered holes is the theoretical volume of the metal sheet minus the volume of burr. The burr height inside the hole cannot be measured. Only the burr height near the hole can be determined to represent the burr height inside the hole, and the burr is regarded as evenly distributed on the surface of the hole. Thus, this paper adds a correction coefficient γ when calculating the burr. Given , the following equation is obtained:
where represents the correction coefficient, h is the burr height, and l is the busbar length.
The busbar length is expressed as follows,
where represents the conical angle of a micro-tapered hole. It is expressed as follows:
Given , the difference between the volume of the cavity where the atomization sheet reaches the maximum deformation when vibrating after electrolytic polishing and the maximum deformation when vibrating before electrolytic polishing is
For the micro-tapered hole, the fluid flows from the large hole side to the small hole side. The structure is a conical diffuser, and the flow from the small hole side to the large hole side is a conical nozzle. If the same device has both a conical diffuser and a conical nozzle, when the periodic volume change occurs in the cavity connected by the conical diffuser and conical nozzle, the liquid in the cavity will have one-way transportation, and the atomization volume delivered is as follows [27],
where Q is the amount of atomization produced by the atomization sheet, f is the vibration frequency, is the conical diffuser loss coefficient, and is the nozzle diffuser loss coefficient. Given , in summary, the expression of the atomization quantity of the atomization sheet can be written as
Given that f, M, I, , F, , and are constants or measurable quantities and the change in Z is minimal in a short electrolytic time, the change in Z is temporarily ignored. The relationship between electrolytic time t and Z is then discussed in the following experiment. Moreover, the value of atomization quantity Q can be calculated by integrating the parameters D, d, h, and θ measured or calculated in the experiment into Equation (12).
3. Experimental Study on Electrolytic Polishing of Metal Sheet
3.1. Electrolyte Composition
Traditional electrolytic polishing uses a strong acid composite solution, so there are a series of safety problems, such as in transportation, storage, preparation, operation, waste liquid pollution, corrosion, and hydrogen infiltration [28]. There are advantages in this experiment. Firstly, the amount of phosphoric acid and sulfuric acid were comparatively reduced. Secondly, chromium anhydride components were cleared out. Lastly, polyethylene glycol was added as a thickening agent to replace the traditional process containing chromium anhydride. Polyethylene glycol cannot only form a thick protective film on the surface of stainless steel, but also plays a significant role in regulating the viscosity of the solution. This is a more environment-friendly acid composite solution, thus avoiding the main problem of strong acid polishing, and provides convenience for electrolyte circulation and reuse [29,30].
The phosphoric acid–sulfuric acid system is the most used electrolyte at present. Phosphoric acid is the main component of an electrochemical polishing liquid; its chemical corrosion is weaker than that of sulfuric acid, but stronger than that of acetic acid, and it is easy to form a passivation film with metal. Moreover, the high viscosity of phosphoric acid can slow down the leveling rate and play a certain role in improving the metal surface quality. When the volume fraction is comparatively high, the activation effect is large, while the passivation effect is small, easily leading to stainless steel surface corrosion. In this experiment, only the burrs with a height of a micrometer were removed, so the volume fraction of phosphoric acid and sulfuric acid was low, and the electrolyte did not contain chromic acid, chloride, fluoride, and other harmful substances, which met the ROHS standard. Cationic surfactants can reduce the surface tension of liquid, with good washing, solubilization, leveling, corrosion resistance, and other characteristics. The addition of a small amount of glycerin can improve the viscosity of the polishing liquid, improve the brightness of the surface polishing of metal sheet, and reduce sensitivity to metal impurities [31,32]. The electrolyte components used in this experiment are shown in Table 1.

Table 1.
Electrolyte composition table.
3.2. Experimental Equipment System
The uneven burr on the surface of the micro-tapered hole of the metal sheet was removed by electrochemistry electrolysis. The metal sheet was polished in a beaker equipped with electrolyte under the condition of a DC power supply. The power supply was a LW-K3010D (Shenzhen, China) series adjustable DC-regulated power supply with an output voltage range between 0 and 30 V and an output current between 0 and 10 A. The metal sheet was the anode, and the lead sheet was the cathode. Figure 2 shows the electrolytic polishing experiment diagram. An 85-2 digital display constant-temperature magnetic agitator (Shanghai, China) was selected. It was composed of magnetic beads, a heating device, and a temperature sensor. The magnetic beads were used for magnetic stirring, so that the electrolyte could be fully mixed in the polishing process to prevent excessive concentration difference of the electrolyte. The heating device could adjust the electrolyte to the desired temperature. The temperature sensor was used to measure the electrolyte temperature in real time. The experimental value of a is 50 mm, which is the distance between the metal sheet and the liquid surface; b is the distance between the anode and cathode plates, and the experimental value was 40 mm. According to the above analysis, the polishing voltage was controlled at 5 V, the electrolyte temperature was 40 °C, and the distance between anode and cathode sheets was 40 mm. The polishing time range was 1–7 min, and the interval time was 1 min for the group experiment.
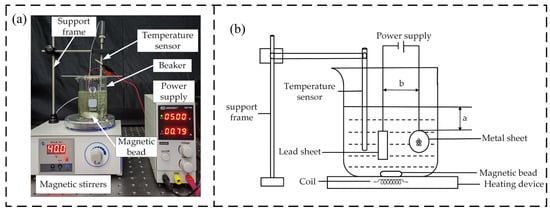
Figure 2.
Experimental diagram of electrolytic polishing: (a) Picture of real products; (b) Schematic.
4. Burr Measurement Experiment of Metal Sheet
After the electropolishing experiment, to explore the influence of electropolishing treatment on the diameter of the large and small ends of micro-tapered holes and the surface quality of a laser-machined metal sheet, the holes of the metal sheet were observed using a microscope. In particular, the diameter of the large and small ends of micro-tapered holes and the height of the burr of the metal sheet were measured using an ultra-depth-of-field 3D microscope (VHX-600, Keyence, Japan) before and after electrolytic polishing.
4.1. Burr Measurement of Metal Sheet
In accordance with the difference in electrolytic polishing time, the experiment was divided into eight groups. The untreated metal sheets were the first group; the second to the eighth groups had a 1–7 min polishing time. When the diameter of the large end of micro-tapered holes of the metal sheet was measured, the diameter of 100 holes was measured for each group of metal sheets, corresponding to 800 values. Similarly, when the diameter of the small end of micro-tapered holes in the groups of metal sheets was measured, a total of 800 diameter values were determined.
Figure 3a is the measurement diagram of the ultra-depth-of-field 3D microscope. When measuring the burr height of the metal sheet, to keep the metal sheet measured in a horizontal state, the metal sheet was first placed on a magnet with a strong magnetic force, and the magnet with the atomization sheet was then placed at the center of the horizontal platform. Figure 3b is a schematic of enlarging the burr height of the metal sheet. During measurement, the left and right endpoints 1 and 2 of the diameter of the hole were taken as the cross sections, and horizontal line l was taken as the reference to measure the burr height of the metal sheet at the lowest point of the burr at both ends closest to the hole. The burr height in the hole can be expressed by measuring the burr height near the hole. The burr heights c and d at the left and right ends of the hole can be measured. If the burr height near the hole decreases, the burr height in the hole will also decrease; that is, the burr trend near the metal sheet hole is the burr trend in the hole. Each group of experiments measured the burr height of 100 holes of the metal sheet, and there were 800 data before polishing with a polishing time of 1–7 min.
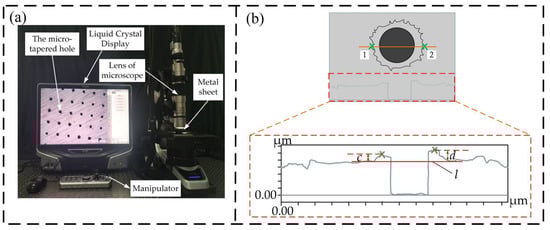
Figure 3.
Picture of ultra-depth-of-field 3D microscopic measurement: (a) Microscope measurement object diagram; (b) Schematic of enlarging the burr height of the metal sheet.
Figure 4a–h shows the burr height h of the untreated metal sheet and the treated sheets for 1–7 min. The burr height h of the untreated metal sheet is the highest, while the burr height of the metal sheet treated for 7 min is the smallest; that is, the burr height h of the metal sheet decreases as the electrolytic polishing time increases.
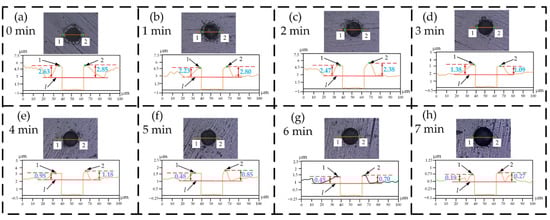
Figure 4.
Burr height of metal sheet: (a) Untreated sheet; (b) Sheet treated for 1 min; (c) Sheet treated for 2 min; (d) Sheet treated for 3 min; (e) Sheet treated for 4 min; (f) Sheet treated for 5 min; (g) Sheet treated for 6 min; (h) Sheet treated for 7 min.
4.2. Data Analysis
A box plot based on the statistical data of the previous experiments is drawn in Figure 5. Figure 5a presents the relationship between the electrolytic polishing time and the diameter of micro-tapered holes of the metal sheet, and Figure 5b presents the relationship between the electrolytic polishing time and the burr height of micro-tapered holes of the metal sheet. Each box plot is composed of 800 groups of data. There is a point in the box that represents the average value of a group of data, and the lines in the diagram are the lines of the mean value. Twenty-five to seventy-five percent of the data are indicated in the box, so the height of the box reflects the fluctuation of the data to some extent. The top and bottom edges represent the maximum and minimum values for that set of data, respectively.
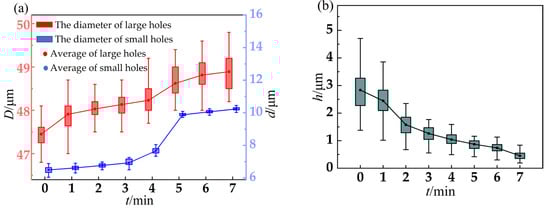
Figure 5.
The relationship between electrolytic polishing time and metal sheet: (a) Relationship between electrolytic polishing time and the diameter of micro-tapered holes; (b) Relationship between electrolytic polishing time and burr height.
According to Equation (9) and the measured data in the experiment, the relation between the conical angle of a micro-tapered hole and polishing time and image can be obtained.
If future researchers can measure and calculate the conical angle, even if the experimental conditions are different when conducting similar experiments, then find the corresponding time t according to Figure 6, and then substitute it into Formula (12) to obtain the atomization amount.
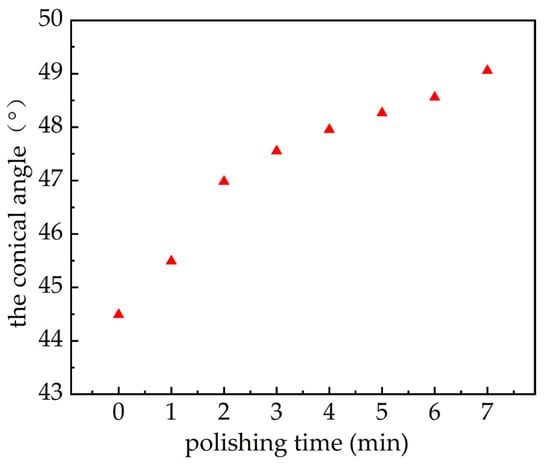
Figure 6.
The relationship between the conical angle and electrolytic polishing time.
According to Equation (12) and the measured data in the experiment, because it is not known how long the electrolytic polishing time t will be, Z will significantly change. Hence, Z will be temporarily treated as a constant and then corrected in accordance with the atomization experiment. A diagram of the relationship between the conical angle and atomization amount is shown in Figure 7. When the electrolytic polishing time is 1 min, the atomization amount decreases somewhat. Nonetheless, overall, the atomization amount Q increases with the increase in electrolytic polishing time t.
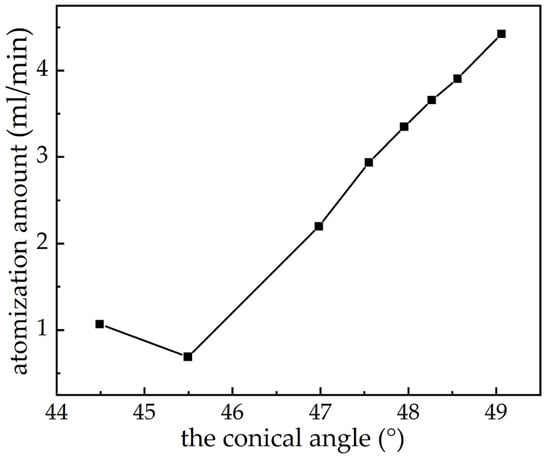
Figure 7.
Theoretical relationship between atomization amount and the conical angle.
5. Experimental Analysis of Atomization Amount
5.1. Frequency Sweep Experiment
Figure 8 shows the frequency sweep curve of piezoelectric atomizers. The resonant frequencies of the piezoelectric atomizers measured by the experiment are 75, 104, 155, 159, and 164 kHz. When the working frequency exceeds 150 kHz, the piezoelectric ceramics will have violent vibrations while working, which will not only greatly reduce their service life, but may also lead to atomization sheet breakage. Therefore, working frequencies exceeding 150 kHz will not be considered in the experiment. When the frequency is 75 kHz, the piezoelectric ceramics have a certain vibration velocity. However, because the vibration amplitude in the center area of the distribution of the micro-tapered holes is small, the change in the volume of the micro-tapered holes can be almost negligible. Basically, no dynamic conical angle effect will be formed, and only slight atomization will occur at this time. Based on experimental comparison, the driving frequency is 104 kHz in this experiment.
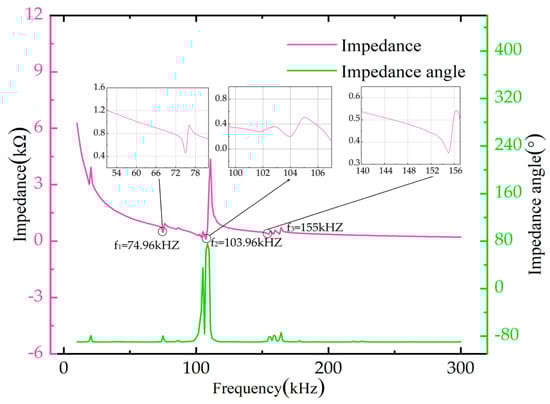
Figure 8.
Impedance and phase curves of atomization sheet with frequency.
5.2. Atomization Amount Measurement
To further verify the influence of electrolytic polishing on atomization amount, the atomization amount measurement scheme was designed as follows: In the experiment, the output of the signal generator was placed in a sinusoidal gear (an oscilloscope was used to capture the sinusoidal signal in the figure) to obtain the AC voltage. A power amplifier was used to amplify the signal as the driver, the atomizer was connected, and the oscilloscope was used to monitor the input signal of the atomizer. The liquid in the experiment was distilled water. Figure 9 depicts the atomization experiment device. Before the experiment, the atomizer with water was first placed on a balance. When the time reached 1 min, the power supply to the atomizer was stopped. At this time, the value reduction displayed in the balance was the atomization amount of the atomizer. The atomization volume of the above eight groups of piezoelectric atomizers with an operating voltage of 45 V and polishing time of 1–7 min was measured.
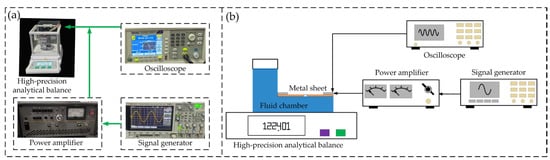
Figure 9.
Atomization experiment device: (a) Picture of real products; (b) Schematic.
From the atomization experiment, the atomization amount of different polishing time is basically consistent with the theory analyzed above. However, with the increase in electrolytic time, the influence of Z on Q can no longer be ignored; that is, when t > 5, Z cannot be regarded as a constant. The reason is that with the increase in electrolytic polishing time, Z will affect the conical angle θ along with the change in t. The conical and nozzle diffuser loss coefficients are then gradually affected, thus altering Z. According to the experiment, when t > 5, the correction coefficient should be added to make the correction.
From Equation (13), the change in atomization amount with conical angle can be obtained, as shown in Figure 10. The atomization amount basically increases with the increase in electrolytic polishing time, indicating that the theoretical analysis is consistent with the experimental results. When the conical angle is 48,267° (the polishing time is 5 min), the atomization amount reaches the maximum value of 5.202 mL/min.
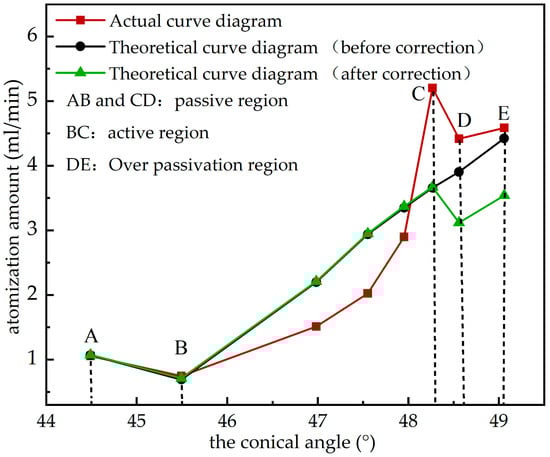
Figure 10.
Atomization amount under different conical angles.
In zone AB in Figure 10, the surface of the atomization sheet is covered with a passivation film formed in the air before electrolytic polishing. The existence of this initial passivation film prevents the metal dissolution, and the initial passivation film begins to gradually break at the beginning of electrolysis, resulting in a low atomization amount. Later, with the increase in polishing time, the atomization amount increases. When the conical angle is 48,267° (the polishing time is 5 min), the atomization amount reaches the maximum at 5.202 mL/min, and then the atomization amount begins to decrease again. When the anode enters the activated dissolution zone in the BC zone, the metal enters the solution in the form of ions, with phosphoric acid ions to form a phosphate mucous layer on the anode surface. The mucous layer in the convex part of the anode surface is thinner than that in the concave part. Consequently, the resistance is smaller, and the current density is higher. The convex part is preferentially dissolved, and the surface begins to show a small preliminary flattening. As the electrolysis time continues, the atomization sheet enters the CD passivation zone, and a new passivation film is formed on the anode surface. The passivation film is continuously dissolved and formed at the same time. At the beginning, the formation rate of the passivation film is greater than the dissolution rate, and the thickness of the passivation film keeps increasing. At this point, the metal dissolution is still going on, but the rate of metal dissolution is very slow due to the obstruction of the passivation film [20]. Owing to the existence of a passivation film and measurement error, the atomization amount measured by the atomizers with an electrolytic polishing time of 1 min is slightly lower than that generated by the untreated atomization sheet. When the formation speed and the dissolution rate of the passivation film reach an equilibrium, the atomization sheet enters the DE overpassivation zone, and the thickness of the passivation film stops growing. Metal dissolution occurs at a relatively steady rate. Therefore, to achieve a good polishing effect, the electrolytic time should be controlled within a reasonable range of the overpassivation zone.
According to the experiment, when the electrolytic polishing time is 5 min, it is the time node with the maximum atomization amount, which reaches 5.202 mL/min. When t > 5, Z cannot be treated as a constant because Z will affect the conical angle θ along with the change in t as the electrolytic polishing time increases. The conical and nozzle diffuser loss coefficients are then gradually affected, thus altering Z. Consequently, the atomization amount is reduced.
6. Conclusions
- With the increase in polishing time, the diameter of the metal sheet increases, but its burr height decreases. The dispersion of the burr height also decreases. Polishing can dissolve the uneven burr on the surface of the atomization sheet and improve the surface quality.
- Electrolytic polishing treatment can improve the atomization effect of atomizers. Due to the existence of passivation film, the atomization amount of the piece with short polishing time is slightly lower. Later, with the increase in polishing time, the atomization amount increases. Specifically, when the conical angle is 48,267° (the polishing time is 5 min), the maximum atomization amount reaches 5.202 mL/min.
- When the polishing time is relatively long, the atomization amount will decrease. This is because when the polishing time t is excessively long, Z can no longer be treated as a constant. With the continuous increase in the electrolytic polishing time t, Z will affect the conical angle θ with the change in t, and the conical and nozzle diffuser loss coefficients are then gradually affected, thus altering Z. According to the atomization experiment, Z should be corrected when t > 5.
Author Contributions
J.-L.L.: methodology, validation, formal analysis, investigation, writing—original draft preparation; J.-H.Z.: conceptualization, resources, supervision; F.Z.: writing—review and editing; W.-Q.H.: visualization, project administration, funding acquisition; Y.-X.W.: software; B.-C.C.: data curation. All authors have read and agreed to the published version of the manuscript.
Funding
This research was funded by [National Natural Science Foundation of China (NSFC)], grant number [51705093]; [Science and Technology Program of Guangzhou], grant number [202201020158]; [Guangdong Basic and Applied Basic Research Foundation], grant number [2019B1515120017]; [Graduate Student Innovation Ability Training Funding Program of Guangzhou University], grant number [2022GDJC-M22].
Institutional Review Board Statement
Not applicable.
Informed Consent Statement
Not applicable.
Data Availability Statement
Not applicable.
Conflicts of Interest
The authors declare no conflict of interest.
References
- Guerra-Bravo, E.; Lee, H.-J.; Baltazar, A.; Loh, K.J. Vibration Analysis of a Piezoelectric Ultrasonic Atomizer to Control Atomization Rate. Appl. Sci. 2021, 11, 8350. [Google Scholar] [CrossRef]
- Zhang, J.; Yan, Q.; Sun, W. Advances in Piezoelectric Atomizers. Trans. Nanjing Univ. Aeronaut. Astronaut. 2020, 37, 54–69. [Google Scholar]
- Pritchard, J.N.; Hatley, R.H.; Denyer, J.; von Hollen, D. Mesh nebulizers have become the first choice for new nebulized pharmaceutical drug developments. Ther. Deliv. 2018, 9, 121–136. [Google Scholar] [CrossRef] [PubMed]
- Maehara, N.; Ueha, S.; Mori, E. Influence of the vibrating system of a multipinhole-plate ultrasonic nebulizer on its performance. Rev. Sci. Instrum. 1986, 57, 2870–2876. [Google Scholar] [CrossRef]
- Toda, K.; Ishii, J.I.J. Operation Performance of Self-Oscillation Ultrasonic Vibrating Device for Liquid Atomization. Jpn. J. Appl. Phys. 1995, 34, 5332. [Google Scholar] [CrossRef]
- Toda, K.; Akimura, Y. An ultrasonic atomizing device using coupled-mode vibration. Rev. Sci. Instrum. 1994, 65, 3276–3278. [Google Scholar] [CrossRef]
- Lu, C.; Fu, C.; Yang, J.; Chen, C.; Cheng, C. 4A-3 Traveling Wave Driven Micro-Dispenser for CPU Cooling Application. In Proceedings of the 2006 IEEE Ultrasonics Symposium, Vancouver, BC, Canada, 3–6 October 2006; pp. 54–57. [Google Scholar]
- Shen, S.-C.; Wang, Y.-J.; Chen, Y.-Y. Design and fabrication of medical micro-nebulizer. Sensors Actuators A Phys. 2008, 144, 135–143. [Google Scholar] [CrossRef]
- Huang, Y.-L.; Chang, S.-H. Micro-Droplets Atomizer Using PZT Ring Actuator. J. Mech. 2010, 26, 423–429. [Google Scholar] [CrossRef]
- Chen, H.; Cheng, W.-L.; Peng, Y.-H.; Zhang, W.-W.; Jiang, L.-J. Experimental study on optimal spray parameters of piezoelectric atomizer based spray cooling. Int. J. Heat Mass Transf. 2016, 103, 57–65. [Google Scholar] [CrossRef]
- Maehara, N.; Ueha, S.; Mori, E. Optimum Design Procedure for Multi-Pinhole-Plate Ultrasonic Atomizer. Jpn. J. Appl. Phys. 1987, 26, 215. [Google Scholar] [CrossRef]
- Lam, K.; Chan, H.; Luo, H.; Yin, Q.; Yin, Z. Piezoelectrically actuated ejector using PMN–PT single crystal. Sens. Actuators A Phys. 2005, 121, 197–202. [Google Scholar] [CrossRef]
- Perçin, G.; Levin, L.; Khuri-Yakub, B.T. Piezoelectrically actuated droplet ejector. Rev. Sci. Instrum. 1997, 68, 4561–4563. [Google Scholar] [CrossRef]
- Perçin, G.; Lundgren, T.S.; Khuri-Yakub, B.T. Controlled ink-jet printing and deposition of organic polymers and solid particles. Appl. Phys. Lett. 1998, 73, 2375–2377. [Google Scholar] [CrossRef]
- Yan, Q.; Sun, W.; Zhang, J. Study on the Influencing Factors of the Atomization Rate in a Piezoceramic Vibrating Mesh Atomizer. Appl. Sci. 2020, 10, 2422. [Google Scholar] [CrossRef]
- Dupuis, E.; Momen, A.M.; Patel, V.K.; Shahab, S. Multiphysics modeling of mesh piezoelectric atomizers. In Proceedings of the Active and Passive Smart Structures and Integrated Systems XII, Denver, CO, USA, 5–8 March 2018; pp. 429–437. [Google Scholar]
- Sar, G.; Aydn, Y.N.; Bilekli, M.G.; Gl, M.B. Dynamics of liquid drop on a vibrating micro-perforated plate. Z. Fur Nat. A 2021, 76, 305–314. [Google Scholar] [CrossRef]
- Sharma, P.; Jackson, N. Vibration analysis of MEMS vibrating mesh atomizer. J. Micromechanics Microengineering 2022, 32, 065007. [Google Scholar] [CrossRef]
- Zhang, L.; Tong, H.; Li, Y. Precision machining of micro tool electrodes in micro EDM for drilling array micro holes. Precis. Eng. 2015, 39, 100–106. [Google Scholar] [CrossRef]
- Rahman, Z.U.; Deen, K.M.; Cano, L.; Haider, W. The effects of parametric changes in electropolishing process on surface properties of 316L stainless steel. Appl. Surf. Sci. 2017, 410, 432–444. [Google Scholar] [CrossRef]
- Han, W.; Fang, F. Fundamental aspects and recent developments in electropolishing. Int. J. Mach. Tools Manuf. 2019, 139, 1–23. [Google Scholar] [CrossRef]
- Yang, X.; Yang, X.; Sun, R.; Kawai, K.; Arima, K.; Yamamura, K. Obtaining Atomically Smooth 4H–SiC (0001) Surface by Controlling Balance Between Anodizing and Polishing in Electrochemical Mechanical Polishing. Nanomanufacturing Metrol. 2019, 2, 140–147. [Google Scholar] [CrossRef]
- Łyczkowska-Widłak, E.; Lochyński, P.; Nawrat, G. Electrochemical Polishing of Austenitic Stainless Steels. Materials 2020, 13, 2557. [Google Scholar] [CrossRef] [PubMed]
- Huang, Y.; Wang, C.; Ding, F.; Yang, Y.; Li, N. Principle, process, and application of metal plasma electrolytic polishing: A review. Int. J. Adv. Manuf. Technol. 2021, 114, 1893–1912. [Google Scholar] [CrossRef]
- Ji, G.; Sun, H.; Duan, H.; Yang, D.; Sun, J. Enhancement of Corrosion Resistance for Medical Grade 316L Stainless Steel by Electrolytic Plasma Polishing. J. Mater. Eng. Perform. 2022, 32, 1498–1507. [Google Scholar] [CrossRef]
- Akiyoshi, O. Flow direction of piezoelectric pump with nozzle/diffuser-elements. Chin. J. Mech. Eng. 2004, 17, 107–109. [Google Scholar]
- Zhou, C.; Su, H.; Qian, N.; Zhang, Z.; Xu, J. Characteristics and function of vapour gaseous envelope fluctuation in plasma electrolytic polishing. Int. J. Adv. Manuf. Technol. 2022, 119, 7815–7825. [Google Scholar] [CrossRef]
- Baghdadchi, A.; Hosseini, V.A.; Karlsson, L. Identification and quantification of martensite in ferritic-austenitic stainless steels and welds. J. Mater. Res. Technol. 2021, 15, 3610–3621. [Google Scholar] [CrossRef]
- Han, W.; Fang, F. Electropolishing of 316L Stainless Steel Using Sulfuric Acid-Free Electrolyte. J. Manuf. Sci. Eng. 2019, 141, 101015. [Google Scholar] [CrossRef]
- Chen, H.; Zhang, Y. Eco-friendly oxalic acid and citric acid mixed electrolytes using for plasma electrolytic polishing 304 stainless steel. Proc. J. Phys. Conf. Ser. 2022, 2345, 012029. [Google Scholar] [CrossRef]
- Jhong, Y.-T.; Chao, C.-Y.; Hung, W.-C.; Du, J.-K. Effects of Various Polishing Techniques on the Surface Characteristics of the Ti-6Al-4V Alloy and on Bacterial Adhesion. Coatings 2020, 10, 1057. [Google Scholar] [CrossRef]
- Kim, U.S.; Park, J.W. High-Quality Surface Finishing of Industrial Three-Dimensional Metal Additive Manufacturing Using Electrochemical Polishing. Int. J. Precis. Eng. Manuf. Technol. 2019, 6, 11–21. [Google Scholar] [CrossRef]
Disclaimer/Publisher’s Note: The statements, opinions and data contained in all publications are solely those of the individual author(s) and contributor(s) and not of MDPI and/or the editor(s). MDPI and/or the editor(s) disclaim responsibility for any injury to people or property resulting from any ideas, methods, instructions or products referred to in the content. |
© 2023 by the authors. Licensee MDPI, Basel, Switzerland. This article is an open access article distributed under the terms and conditions of the Creative Commons Attribution (CC BY) license (https://creativecommons.org/licenses/by/4.0/).