Featured Application
Change detection for remote sensing imageries.
Abstract
This study proposes a bilateral attention U-Net with a dissimilarity attention gate (DAG) for change detection on remote sensing imageries. The proposed network is designed with a bilateral dissimilarity encoding for the DAG calculation to handle reversible input images, resulting in high detection rates regardless of the order of the two input images for change detection. The DAG exploits all the combinations of joint features to avoid spectral information loss fed into an attention gate on the decoder side. The effectiveness of the proposed method was evaluated on the KOMPSAT-3 satellite images dataset and the aerial change detection dataset (CDD). Its performance was better than that of conventional methods (specifically, U-Net, ATTUNet, and Modified-UNet++) as it achieved average F1-score and kappa coefficient (KC) values of 0.68 and 66.93, respectively, for the KOMPSAT-3 dataset. For CDD, it achieved F1-score and KC values of 0.70 and 68.74, respectively, which are also better values than those achieved by conventional methods. In addition, we found that the proposed bilateral attention U-Net can provide the same changed map regardless of whether the image order is reversed.
1. Introduction
By utilizing multi-temporal remote sensing imageries, dynamic changes on the Earth’s surface can be detected automatically. In this process, land cover changes on temporal imageries are identified in the same geographical area. Automatic change detection is widely used for both civil and military applications, such as environmental monitoring, disaster evaluation, urban expansion monitoring, and reconnaissance. In general, the change detection process is composed of three steps: pre-processing, feature extraction, and classification. Pre-processing corrects radiometric and geometric distortions and performs image registration. In the feature extraction stage, the features of land cover changes are extracted for classification by an algorithm into two classes: “changed” or “unchanged.”
There are many challenges in identifying land cover changes against the diverse surface structures of Earth and in complex conditions, such as different seasons, different viewing angles, radiometric distortion, and geometric distortion. Many studies have been conducted to develop effective change detection algorithms to identify precise land cover changes while overcoming these problems. Several conventional algorithms based on traditional machine learning have consequently been proposed for change detection [1,2,3,4,5,6,7,8,9,10]. The change detection approach based on unsupervised learning with fuzzy C-mean (FCM) clustering [1,2,3,4,5,6] is an example of classification of feature vectors of land cover change into classes. In this approach, the feature vectors are extracted from the difference image (DI) using an image subtraction or log-ratio (LR) scheme. Then, they are projected using principal component analysis to reduce the feature dimensions by creating an eigenspace. This approach can be useful when labels are unavailable in the training stage. However, without any additional information, it is difficult to achieve reasonably good performance owing to overfitting for various changes. To address this problem, change detection based on supervised learning is widely applied [7,8,9,10]. In this approach, support vector machine (SVM) learning is employed to classify the feature vectors into binary classes along with given ground truths. This approach extracts linear models from a given dataset to find the optimal hyperplanes for distinguishing the feature vectors. However, handcrafted feature selection and feature extraction methods must be well designed for optimal performance.
Recently, deep learning methods, such as deep convolutional neural networks (DCNNs), have been widely employed to learn sophisticated feature spaces from massive amounts of image data. These methods can yield a better performance than traditional machine learning for image analysis tasks. Several deep learning methods have also been proposed to solve change detection problems [11,12,13,14,15,16,17,18,19,20,21,22]. These DCNNs have evolved to use more parameters and layers to improve performance. In particular, the transformer-based methods have obtained high performance because they use global features [20]. However, the transformer has high computational complexity from using a relatively large number of parameters compared to general DCNNs. U-Net is a DCNN architecture used for image segmentation with a relatively low computational load [21,22]. It is composed of encoding and decoding path networks to extract the context of features and enable precise localization [23]. U-Net employs a skip connection at each level to bypass features from the encoder to the decoder path, aiming at enhancing the localization capability. A modified U-Net for change detection has also been proposed that first utilizes the adaptive DI features from feature-level subtraction [21]. Then, the U-Net extracts these features to produce a segmented change map. Peng et al. employed Modified-UNet++ for change detection by reallocating skip connections [22]. Their method exploits multi-scale features to enhance the power of the feature representation.
Recently, an attention U-Net was proposed to enhance the detection performance of U-Net by finding target attention with a small number of additional weight parameters and minimal complexity [24]. This network employs attention gates to suppress node responses at irrelevant background regions and boost them in foreground regions by enhancing the responses through skip connections. Thus, the attention U-Net is more reliable than the conventional U-Net for change detection. However, those architectures involve only a single path encoding that extracts the features of input images based on the DI scheme. By using DI as the input of the U-Net, the same detection result can be obtained regardless of the input image order. It can detect both land cover changes and its inverse changes without any additional training dataset for its inverse order, for instance, construction and destruction changes. However, this leads to spectral information loss of the surface characteristic due to absolute image subtraction. By contrast, a joint feature (JF) can be extracted with its image stacking. The JFs on the U-Net architecture can combine multi-temporal input images by extending the input data dimensionality without any spectral information loss. However, change detection methods using JF tend to be sensitive and dependent on the order at the inference stage; hence, such methods do not work for the reversed order input case. More specifically, because they are order-dependent, they could generate different results in the reverse order of the images, as shown in Figure 1. Owing to the problems mentioned above, order-independency and spectral information preservation are important issues in change detection.
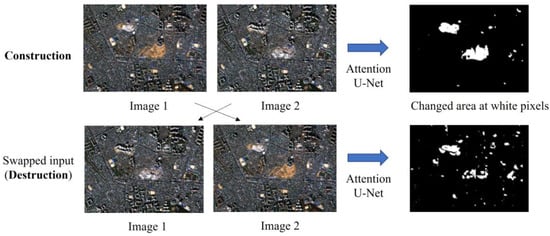
Figure 1.
Change detection for reversed image order.
This study proposes an order-independent bilateral change detection method based on a proposed dissimilarity attention gate (DAG) for attention U-Net that preserves spectral information. This bilateral detection approach avoids spectral information loss by the proposed DAG in the dual-encoding path to facilitate two input images. Feature maps are extracted from both images without any spectral information loss. The proposed algorithm also incorporates a DAG to overcome the order-dependency problem by exploiting two combinations of two joint features and difference features. The DAG boosts the channel feature responses for the most informative channels through channel attention. Overall, the proposed architecture yielded better detection rates than several conventional algorithms based on F1-score and kappa coefficients. The proposed algorithm also resolves the order-dependency problem, resulting in the same detection results even when the order of any pair of input images is reversed.
This work makes the following two key contributions. (1) Unlike conventional U-Net, which consists of a single-path encoder, the proposed architecture facilitates two inputs to preserve each part of spectral information. (2) DAG is introduced to overcome the order-dependency problem by exploiting two combinations of two joint features and difference features.
The remainder of this paper is organized as follows. Section 2 presents related studies on change detection. Section 3 details the proposed change detection architecture. Section 4 outlines the experimental evaluations conducted and analyzes the results obtained compared with conventional algorithms. Section 5 discusses the results obtained vis-a-vis the research objectives. Finally, Section 6 presents concluding remarks.
2. Related Work
Change detection algorithms can be categorized into two approaches: traditional machine learning-based and DNN-based. In this section, both approaches are briefly discussed.
2.1. Change Detection Based on Traditional Machine Learning
Traditional machine learning is applied for change detection by employing feature extraction and unsupervised/supervised learning. First, land cover change features are extracted from two temporal images to be processed in a classification algorithm. There are three feature extraction approaches for change detection: image comparison, image stacking, and independent image analysis. For image comparison, a comparison operator model is used, such as DI or LR. Let I1 and I2 be images for a pair of images with B bands acquired at times t1 and t2, respectively. DI is defined as follows:
whereas LR is defined as follows:
Image stacking concatenates the multi-temporal images by extending the data dimensionality toward the channel direction. By contrast, independent image analysis extracts a classification map for each single temporal image. In conjunction with the classification maps, the classification or clustering algorithm classifies the feature maps into a final binary decision class (changed or unchanged).
Several algorithms have been proposed to identify land cover changes using traditional machine learning. They use unsupervised learning methods based on FCMs for change detection [1,2,3,4,5,6]. Singh et al. extracted the land cover change feature using the LR [1]. They clustered these feature vectors into two clusters (changed and unchanged) using a hybrid genetic FCM. They also employed a simple genetic algorithm to minimize the objective function of the FCM. Bi et al. applied DI and LR as feature vectors of land cover change that used FCM to cluster into changed or unchanged [2]. In addition, Gong et al. proposed a fusion of mean ratio and LR operators to extract land cover change features [3]. They employed simple fuzzy clustering to classify those features into binary change detection. In addition, they improved the process by combining FCM with a Markov random field (MRF) [4]. Hao et al. also used FCM and MRF for change detection by employing change vector analysis as a land cover change feature [5]. They improved the change detection algorithm by incorporating local and global information [6]. Such approaches are useful when labels in the training stages are unavailable.
The learning algorithms in the aforementioned studies are based on observed data without any additional information; thus, their applications lead to overfitting for invariant changes. Furthermore, they do not yield reasonably good performance in terms of change detection rate because they do not incorporate accurate information without supervision. To overcome these problems, supervised machine learning can be an option for change detection algorithms. Gao et al. extracted the land cover change features based on texture information using a gray-level co-occurrence matrix, including angular second moment, contrast, correlation, and entropy features [7]. Then, they implemented an SVM to find an optimum hyperplane for classifying those feature vectors into binary classes (changed or unchanged). In addition, Habib et al. [8], Volpi et al. [9], and Bovolo et al. [10] proposed SVMs to detect land cover changes. However, feature selection and feature extraction methods should be well-designed for optimal hyperplanes. Recently, DCNN algorithms have also been proposed. They can automatically learn a complex feature space from a large amount of data without heuristic feature extractions. Thus, DCNNs can achieve a better generalization model for change detection compared with traditional machine learning approaches.
2.2. Change Detection Based on Deep Convolutional Neural Networks
A CNN is a deep learning architecture and has been successfully employed for image analysis tasks. Deep learning approaches can outperform shallow machine learning approaches in terms of accuracy if an adequate amount of training data is supplied [25]. Convolutional operations are employed to produce feature maps (F) and subsampling layers, followed by fully connected (FC) layers to produce class probability outputs . Several CNN architectures have been proposed for change detection. Wiratama et al. proposed a dual-dense CNN for change detection [13]. They designed two-path networks based on the Siamese network with a dense connection for the pair patch image. In the last layer, the Euclidean distance is used to measure the dissimilarity between two patch images, which represents the change classification corresponding to the patch center pixel. They improved it by combining dual- and single-path networks [14]. They also introduced post-processing to enhance the detection rate of change detection. Zhang et al. [15] proposed a spectral-spatial joint from a deep network that is similar to the Siamese CNN (SCNN). In this case, the last layer of the SCNN joins two feature maps and feeds them into an FC layer for pixel change classification. In addition, Zhang et al. [16] applied the SCNN to change detection by computing the distance between two patch images.
All the algorithms mentioned above are based on patch-based change detection such that a patch around a center pixel is used to determine whether the center pixel is changed or unchanged. This approach incurs a high computational burden because it must identify all the pixels using CNN-based prediction. Image-based change detection with CNN is more effective than patch-based methods, which generate a change map based on image segmentation. Hence, in this study, image-based change detection using semantic image segmentation based on a CNN was implemented.
Semantic image segmentation labels each pixel of an input image with the corresponding class that is being represented. Many image segmentation algorithms based on CNNs have been proposed, such as deconvolution semantic segmentation (DeconvNet) [26] and U-Net [23]. U-Net is precise and fast for segmentation and outperforms the previous best method. It combines the local information by observing contextual information in the encoder and extracting general information combining localization and context in the decoder. The encoder path comprises four blocks. Each block involves 3 × 3 convolution layers, activation layers (ReLU), batch normalization, and 2 × 2 max pooling, starting with 64 feature maps or channels for the first block, and 128 for the second block. In addition, the decoder path consists of 2 × 2 unpooling, 3 × 3 convolution layers, ReLU function, and batch normalization. To enhance feature representation, there is a skip connection in each layer to connect the feature maps from the encoder path to the decoder path via concatenation.
For change detection, U-Net was used by Wiratama et al. to generate a change map [21]. They employed dual layers to receive each image input and generate adaptive difference images via absolute image subtraction. Then, U-Net segments the DI features, producing a change map. In addition, U-Net++ was also proposed by Peng et al. for change detection [22]. They used the backbone of U-Net but varied depths whose decoders were densely connected at the same resolution via the redesigned skip pathways. They also used JF from two images as input. Recently, U-Net was improved by introducing an attention gate to find the attention of the target. The improved U-Net, denoted attention U-Net [24], improves the model sensitivity and accuracy of foreground pixels without incurring significant computation overhead.
3. Proposed Bilateral Attention U-Net for Change Detection
The proposed bilateral attention U-Net detects the changed area regardless of the order of the image inputs. It avoids spectral information loss by facilitating two input images with dual path encoding. The global scheme of the proposed bilateral attention U-Net is shown in Figure 2. The proposed algorithm is designed to employ dual-path encoding while sharing weight parameters instead of using single-path encoding for attention U-Net. The decoding structure was adopted from Attention U-Net [24]. The proposed algorithm also incorporates a DAG to overcome the order-dependency problem by exploiting two combinations of two joint features and difference features. The proposed DAG boosts the channel feature responses for the most informative channels through channel attention. The spatial attention gate was selected by analyzing both the output feature of the DAG (F) and the contextual information provided by the gating signal (g), which is collected at a coarser scale.
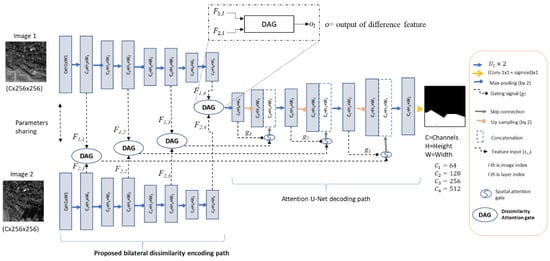
Figure 2.
Proposed bilateral dissimilarity attention U-Net for change detection.
3.1. Bilateral Dissimilarity Encoding
The proposed method replaces the single path encoding that shares weight parameters to facilitate two image inputs. The path receives both input images directly. It is expected to extract independent feature maps (C × H × W) directly from each image, where C, H, and W are the number of channels, height, and width, respectively. The feature maps () of the -th image input at the -th layer can be computed as follows:
where Ul (∙) indicates a block layer that comprises a 3 × 3 convolution, batch normalization, and ReLU at the l-th layer. The transition to the next layer is connected by a max-pooling stage. In addition, we used the same number of feature-map channels of the baseline attention U-Net, with 64, 128, 256, and 512 feature-map channels for each layer, respectively. They share the same parameters for dual-path encoding, which can independently extract feature maps for each image. Then, both feature maps (F1 and F2) are fed into the DAG to produce a difference feature (o).
3.2. Dissimilarity Attention Gate (DAG)
In this study, the proposed DAG is designed to overcome the order-dependency problem by exploiting two combinations of two joint features and difference features. The block diagram of the DAG is shown in Figure 3. in the l-th layer receives both feature maps ( and ). Firstly, this gate boosts the most informative channels by performing channel attention with the squeeze and excitation (SE) module [27]. Channel attention employs the functions of squeeze (SQ) and excitation (EX). SQ observes global spatial information into a channel descriptor by applying global channel-wise average pooling, calculated as follows:
where c is the index of channels. Then, EX captures channel-wise dependencies from the information aggregated in the SQ operation. To limit the model complexity and support generalization, the gating mechanism is parameterized by forming a bottleneck with two FC layers around the nonlinearity. Finally, as shown in Figure 4, attention coefficients are produced by applying the sigmoid function, which is multiplied channel-wise by the original feature-map input (F) to produce the final output.
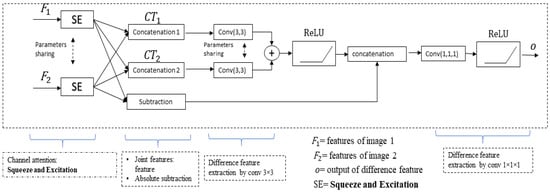
Figure 3.
Block diagram of the proposed dissimilarity attention gate (DAG).
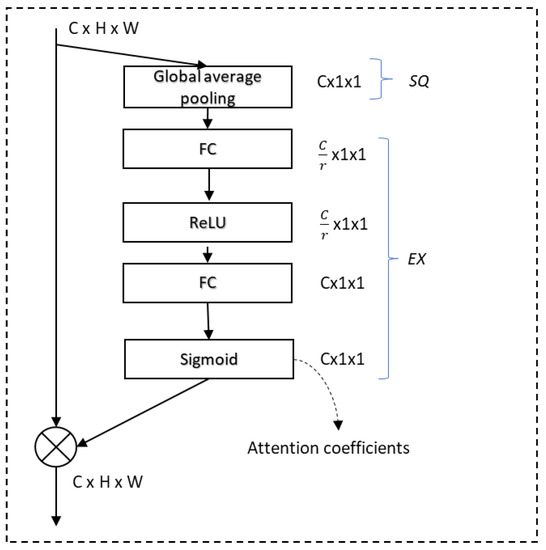
Figure 4.
Flow diagram of the squeeze and excitation (SE) module.
Let us define as the channel attention of the -th image index at the -th layer, resulting in boosted feature maps ( and ). The boosted feature maps are then processed to generate a difference feature by applying JF and absolute subtraction. This gate exploits all combination concatenation orders of JF to generate difference features with the first concatenation () and the second concatenation (), which can be defined as follows:
To extract the difference features of each CT, a 3 × 3 convolution with shared parameters is applied. The kernels convolve and with shared parameters, generating independent difference features from and . Figure 5 shows the independent difference feature maps on average from and , from which the proposed DAG can extract the difference features in both image orders. To obtain a general difference feature, this gate operates for each order of CT, followed by ReLU. To enhance the feature representation, the general feature is combined with subtracted features, generating an enhanced difference feature (o). Then, the difference features are connected to the attention gate at the decoder side. This gate is implemented to the deepest encoding layer, and expanded by the decoder, as shown in Figure 2.
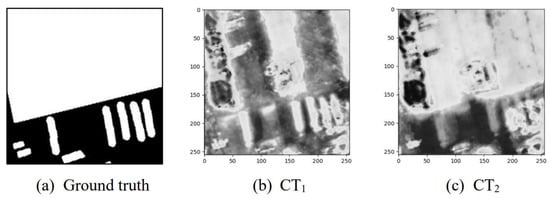
Figure 5.
Example of independent difference feature maps on average for CT1 and CT2.
4. Experimental Results and Analysis
In this study, the KOMPSAT-3 imagery with product level 1G and aerial change detection datasets were used to assess the effectiveness of the proposed method. The KOMPSAT-3 sensors can capture a panchromatic (PAN, 450–900 nm) image characterized by the high resolution of 0.7 m and multi-spectral (MS) images like blue (B, 450–520 nm), green (G, 520–600 nm), red (R, 630–690 nm), and near-infrared (NIR, 760–900 nm) with the lower spatial resolution of 2.8 m. In these images, pre-processing has been done, such as the radiometric correction, atmosphere errors, and geometric correction. The radiometric correction converts the image pixel values (Digital Numbers/DNs) to surface reflectance values. It involves the conversion of DNs to a radiance value, and then to top-of-atmosphere (TOA) radiance. On the other hand, gain and offset values are provided by the KOMPSAT-3 specification [28] to derive the TOA reflectance values. After the atmosphere errors are corrected, the geometric correction is performed. This study defines changes as the result of construction or destruction activities; natural seasonal changes are excluded. The KOMSAT-3 dataset provides MS and PAN with resolutions of 7342 × 6847 × 4 and 29,368 × 27,388 × 1, respectively. The image data used were captured in Seoul city. For our experiments, the multispectral images were enhanced by employing IHS mean-filter pan-sharpening [13] to produce high-resolution R, G, B, NIR, and PAN channels. Five cropped pairs of images were used for the dataset, and different areas were selected with diverse surface characteristics. Figure 6 shows one set of the training images and the ground truth with a size of 3232 × 2206, acquired in March 2014 and December 2015. Note that the images contain multiple construction changes, residential districts, roads, playgrounds, and a small hill in the urban area. For the training setting, the images were divided into multiple patches with a size of 256 × 256 by a raster-scan sliding window with a stride of 70, generating 1024 pairs of patches and their ground truths. For the training, this study applies binary cross-entropy loss function and Adam optimizer with training parameters, including 30, 0.0001, 0.9, 0.999, and 4 as number of epochs, learning rate, β1, β2, and batch size, respectively. The proposed and conventional methods were trained over computer spec of Intel i7-6700 CPU @ 3.4Hz(8CPUs) with NVIDIA GeForce GTX 1080Ti GPU. It was implemented over PyTorch.
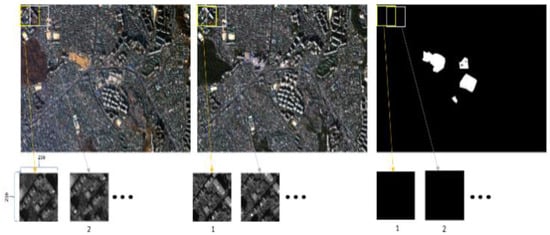
Figure 6.
Dataset generation: (Left) Image P, acquired in March 2014; (middle) Image C, acquired December 2015; (right) Ground truth.
To evaluate the effectiveness of the proposed change detection system, four different areas were selected. Figure 7 shows “Test area 1,” which has under-construction changes, acquired in March 2014 and December 2015. This area is in downtown Seoul, which has tall buildings, residential districts, playgrounds, and roads. Figure 8 shows “Test area 2,” acquired in March 2014 and October 2015, which was also acquired in an urban area with building construction. Figure 9 shows “Test area 3,” acquired in March 2014 and October 2015, which also has construction taking place in a forested area. The two images have significant radiometric differences. In addition, “Test area 4,” located near a river, was acquired in March 2014 and October 2015 (Figure 10). Note that the image data have one bridge on a river for which geometric distortion occurs owing to different viewpoints. The image data for each test area were divided into 117 patches with a size of 256 × 256 and no overlap. All networks were tested for the patch pair. All ground truths were manually generated.
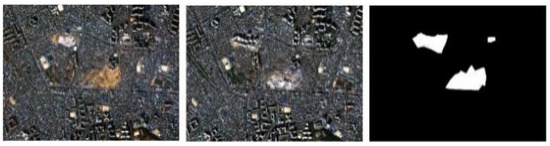
Figure 7.
Test area 1 (3232 × 2206): (left) Image P, acquired in March 2014; (middle) Image C, acquired December 2015; (right) Ground truth.
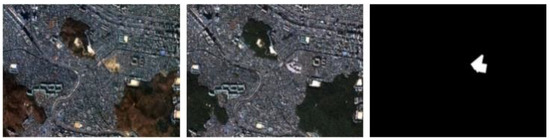
Figure 8.
Test area 2 (3232 × 2206): (left) Image P, acquired in March 2014; (middle) Image C, acquired in October 2015; (right) Ground truth.
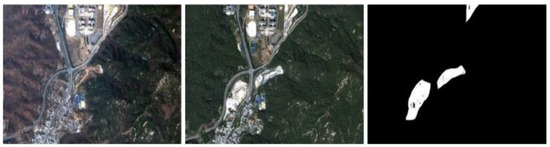
Figure 9.
Test area 3 (3232 × 2206): (left) Image P, acquired in March 2014; (middle) Image C, acquired in October 2015; (right) Ground truth.
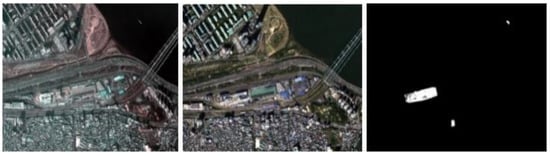
Figure 10.
Test area 4 (3232 × 2206): (left) Image P, acquired in March 2014; (middle) Image C, acquired in October 2015; (right) Ground truth.
The aerial building change detection dataset (CDD) is an open dataset with various resolutions from 3 cm to 100 cm per pixel, and varying times and seasons among the bi-temporal images [29]. The performance of the proposed method was also evaluated for the CDD dataset. The dataset consists of multi-source images with 11 original RGB image pairs selected from Google Earth. Seven pairs contain seasonal changes with an image size of 4725 × 2700. The other four pairs contain seasonal changes with a size of 1900 × 1000. They were cropped into 10,000 pairs with the image size set to 256 × 256 for training and 3000 pairs for testing, as shown in Figure 11.
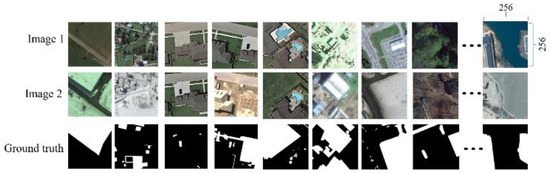
Figure 11.
Samples of change detection dataset (CDD) image pairs.
Because KOMPSAT-3 and CDD have different image characteristics and information, this study trained the specific dataset for generating a model. Hence, individual models were generated for KOMPSAT-3 and CDD and separate analyses on these datasets are presented. We used two metrics to measure the detection accuracy, namely, F1-score and kappa coefficient (KC), to assess the effectiveness of the proposed and conventional architectures. The F1-score can be interpreted as a weighted average of the precision and recall, the best score of F1-score is 1.0, and the worst score is zero. In addition, KC is widely used to measure binary change detection because it is more informative for imbalanced data. The score of KC is interpreted in Table 1 [30,31]. To assess the effectiveness of the proposed method, several conventional architectures (specifically, U-Net [23], ATTUNet [24] and Modified-UNet++ [22]) were trained with the same hyperparameter settings and dataset as the proposed architecture and evaluated on the test datasets.

Table 1.
Interpretation of kappa coefficient (KC) score.
4.1. Performance Evaluation on the KOMPSAT-3 Dataset
Figure 12 shows the detection results of the proposed and conventional methods for “Test area 1.” In this experiment, the image order was set to the same order as in the training configuration, in which ‘Image P’ shows an under-construction area, and ‘Image C’ shows a completed construction area. As shown in Figure 12, the proposed network subjectively yields a more accurate change map compared to the conventional approaches. The conventional U-Net and attention U-Net using DI generate more false positives than when using JF, owing to spectral information loss. JF can preserve the spectral information, which is the reflection characteristic of Earth’s surface; thus, the model can learn a better representation of changes. In addition, the proposed network consistently produces a better change map for reverse input order. Figure 13 depicts the detection results for the reverse input order, which can be interpreted as the destruction change case. Conventional methods, such as U-Net, ATTUNet, and Modified-UNet++ using JF, yield worse change maps compared to the detection outcomes for the original order. These conventional approaches are significantly influenced by the input order established for change detection. However, the proposed algorithm consistently outperforms the conventional methods in terms of change detection, regardless of the input order.
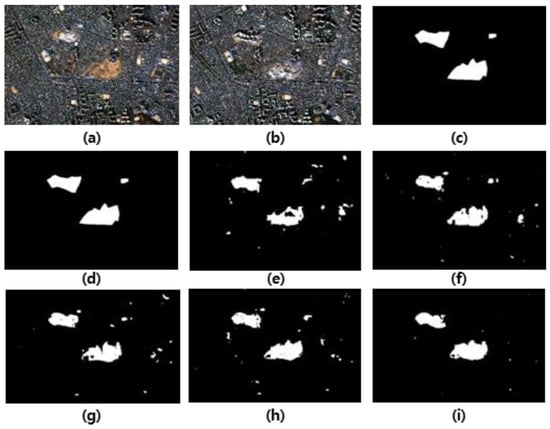
Figure 12.
Changed detection maps of the proposed and conventional algorithms for “Test area 1”: (a) Image P; (b) Image C; (c) Ground truth; (d) DI + UNet; (e) DI + ATTUNet; (f) JF + UNet; (g) JF + ATTUNet; (h) Modified-UNet++; (i) Proposed bilateral dissimilarity U-Net.
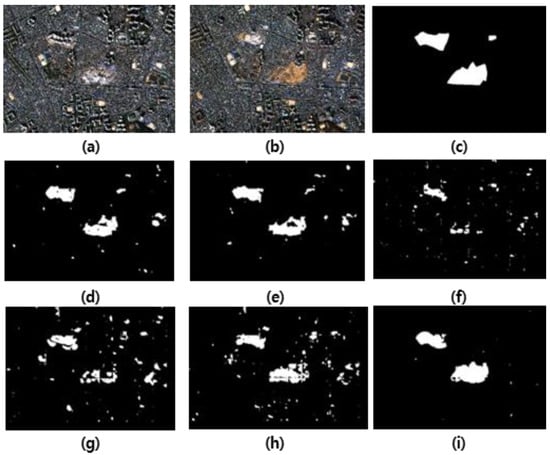
Figure 13.
Changed detection maps of the proposed and conventional algorithms for “Test area 1” for the reverse input order: (a) Image P; (b) Image C; (c) Ground truth; (d) DI + UNet; (e) DI + ATTUNet; (f) JF + UNet; (g) JF + ATTUNet; (h) Modified-UNet++; (i) Proposed bilateral dissimilarity U-Net.
Figure 14 shows the detection results of the proposed and conventional methods for “Test area 2,” in which the input order was the same as that of the training configuration. Conventional studies yield moderate precise change maps. However, U-Nets generate more false positives; in particular, U-Net with DI results in the worst case. ATTUNet and Modified-UNet++ consistently achieve precise change maps using both DI and JF because of their similar surface characteristics with respect to the training dataset. However, the proposed change map visually yields a more accurate change map than other conventional approaches. In the reverse input order, the conventional methods with JF produce worse change maps than those for the original input order, as shown in Figure 15. Their detection outcomes are significantly influenced by the input order. This means that JF is influenced by the image input order when it comes to representing the visual characteristics. Networks with DI can generate relatively consistent change maps, regardless of the reverse input order. In addition, the proposed network consistently maintains a change map regardless of the reverse image order.
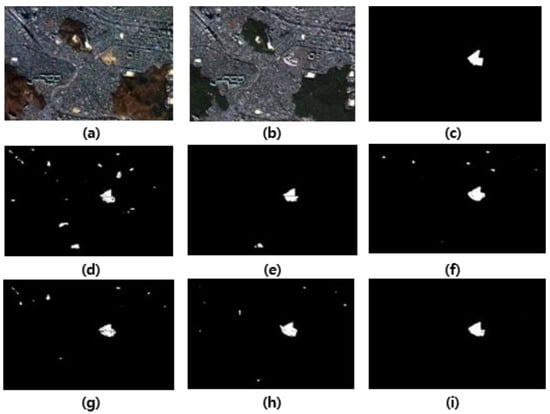
Figure 14.
Changed detection maps of the proposed and conventional algorithms for “Test area 2”: (a) Image P; (b) Image C; (c) Ground truth; (d) DI + UNet; (e) DI + ATTUNet; (f) JF + UNet; (g) JF + ATTUNet; (h) Modified-UNet++; (i) Proposed bilateral dissimilarity U-Net.
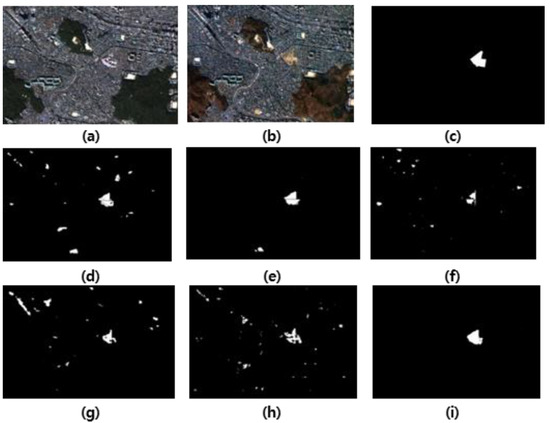
Figure 15.
Changed detection maps of the proposed and conventional algorithms for “Test area 2” for the reverse input order: (a) Image P; (b) Image C; (c) Ground truth; (d) DI + UNet; (e) DI + ATTUNet; (f) JF + UNet; (g) JF + ATTUNet; (h) Modified-UNet++; (i) Proposed Bilateral dissimilarity U-Net.
In “Test area 3,” ATTUNet with JF results in a better change map than that of other networks, as shown in Figure 16. We found that the proposed network cannot identify the changes in some regions. This is due to the surface characteristics of this area, which has a more complex surface. Although the proposed algorithm is worse than ATTUNet for this test case, the proposed algorithm can maintain low false positives. Furthermore, the proposed method still outperforms the conventional approaches with DI and Modified-UNet++. Conventional methods with DI cannot maintain high true positives in some regions. Modified-UNet++ also generates false positives in all the building regions. The proposed method consistently generates a good change map for the reversed input order, as shown in Figure 17. The ATTUNet with JF is significantly degenerated for the reverse order, producing many more false positives. Almost all building regions are detected as changes. In addition, Modified-UNet++ yields a very inaccurate change map.
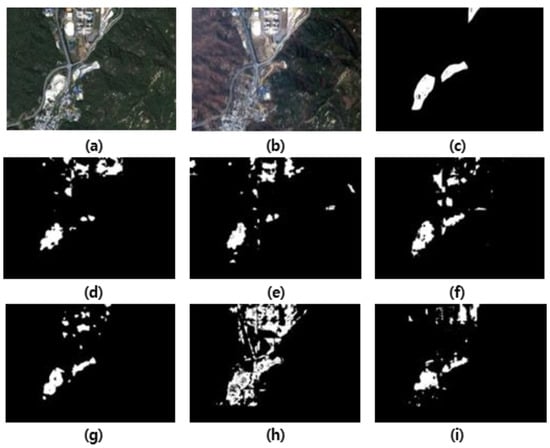
Figure 16.
Changed detection maps of the proposed and conventional algorithms for “Test area 3”: (a) Image P; (b) Image C; (c) Ground truth; (d) DI + UNet; (e) DI + ATTUNet; (f) JF + UNet; (g) JF + ATTUNet; (h) Modified-UNet++; (i) Proposed bilateral U-Net.
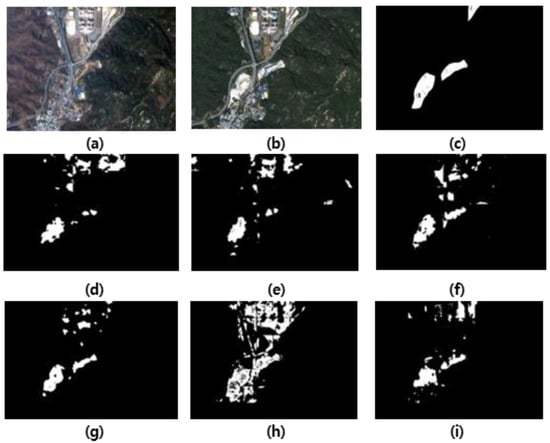
Figure 17.
Changed detection maps of the proposed and conventional algorithms for “Test area 3” for the reverse input order: (a) Image P; (b) Image C; (c) Ground truth; (d) DI + UNet; (e) DI + ATTUNet; (f) JF + UNet; (g) JF + ATTUNet; (h) Modified-UNet++; (i) Proposed bilateral U-Net.
Figure 18 shows the change maps for “Test area 4.” In this area, the proposed network visually achieves better change detection than the conventional approaches. The conventional methods with DI result in worse change maps, which imply ineffective use of DI for surface characteristics having very complex structures. They generate more false positives and false negatives. In addition, the use of JF is more effective than the use of DI, resulting in better change maps. However, the proposed network outperforms the conventional methods. For the reverse input order, the proposed algorithm generates a consistent change map, as shown in Figure 19. The ATTUNet with JF is significantly degraded, producing many more false positives. Almost all the building regions are detected as changes. In addition, Modified-UNet++ yields a very unclear change map in which almost all regions are identified as changes.
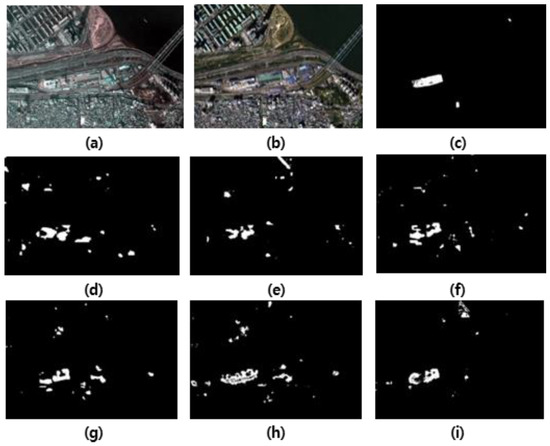
Figure 18.
Changed detection maps of the proposed and conventional algorithms for “Test area 4”: (a) Image P; (b) Image C; (c) Ground truth; (d) DI + UNet; (e) DI + ATTUNet; (f) JF + UNet; (g) JF + ATTUNet; (h) Modified-UNet++; (i) Proposed bilateral U-Net.
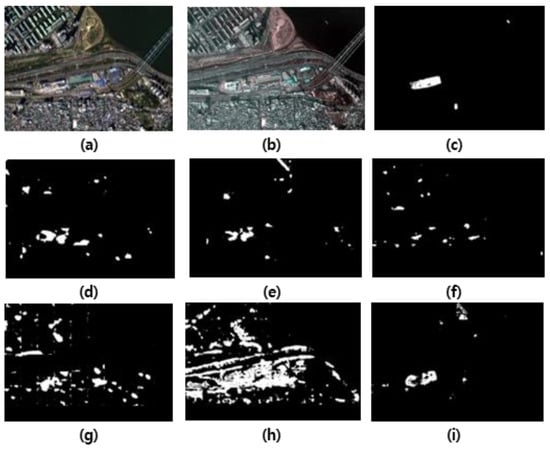
Figure 19.
Changed detection maps of the proposed and conventional algorithm for “Test area 4” in the reversed image order: (a) Image P; (b) Image C; (c) Ground truth; (d) DI + UNet; (e) DI+ ATTUNet; (f) JF + UNet; (g) JF + ATTUNet; (h) Modified-UNet++; (i) Proposed bilateral U-Net.
Table 2 shows the values of F1-score and KC to measure the detection accuracy objectively for the proposed and conventional algorithms. For “Test area 1,” all the algorithms achieve F1-score and KC values greater than 0.75 and 75, respectively. In terms of KC interpretation, as tabulated in Table 1, the conventional approaches with DI yield KC score interpreted as “Good,” which means that they can identify the change precisely, as shown in Figure 14. In addition, the other conventional approaches with JF achieve better scores than when using DI both in terms of F1-score and KC, interpreted as “Very Good,” which means that they can detect changes very well. However, the proposed architecture yields the highest score in terms of F1-score and KC, 0.88 and 87.11, respectively, which implies that the proposed approach can identify changes more precisely than the conventional methods. For “Test area 2,” U-Net with DI still results in the lowest values of F1-score and KC, 0.55 and 54.37, respectively, which mean “moderate” outcomes. The other conventional approaches can produce a change map interpreted as “Good,” achieving F1-score above 0.61 and KC between 61 and 80, respectively. In this area, the proposed algorithm can identify the changes by achieving an F1-score over 0.83 and a KC of 82.8, which implies a “Very Good” level and better detection than the other conventional approaches. For “Test area 3,” Modified-UNet++ results in “Fair” detection. In this area, ATTUNet yields the highest score by achieving an F1-score of 0.63 and a KC of 62.87, resulting in a “Good” interpretation. Note that the proposed algorithm has a slightly worse score than ATTUNet for this case. However, the proposed architecture results in the highest values of F1-score and KC, 0.40 and 39.78, respectively, for “Test area 4.” The conventional approaches achieve F1-score and KC below 0.32 and 31, respectively. Overall, the proposed method yields better detection in terms of F1-score and KC on average by achieving 0.68 and 66.93, respectively, which implies a “Good” detection rate for change detection. In addition, in terms of F1-score and KC of the proposed method, the standard deviations are 0.19 and 21.11, indicating relatively stable change detection performance.
Table 2.
F1-score and KC of the conventional and proposed algorithms for the KOMPSAT-3 dataset.
Table 3 shows the objective evaluation for the proposed and conventional approaches for reverse image input order. Conventional approaches using JF present significant performance degradation compared to the situation before reversing the image order. It seems that the trained networks only solve the change detection with the same image order as the training setting. In contrast to the conventional methods using DI, they can consistently produce the same result as before reversing the image order. However, the use of DI frequently results in poor detection or lower performance caused by spectral information loss. Overall, the proposed architecture can yield consistent performance with a higher detection rate, even for the reverse image order.
Table 3.
F1-score and KC with reverse image order for the KOMPSAT-3 dataset.
To investigate the effectiveness of several existing architectures (U-Net [23], ATTUNet [24], and Modified-UNet++ [22]), they were trained with the reversed as well as forward input pair images like data augmentation methods. Table 4 shows F1-score and KC to objectively measure the detection accuracy for the proposed and existing algorithms for forward input pairs from the data-augmented KOMPSAT-3 dataset. Since the change detection method using DI feature as an input is input-order independent, we only evaluated the existing approaches using JF. The table shows that the existing methods yield higher accuracy on average compared to no data argumentation. In particular, we found that the F1-score and KC for ‘Area 4’ of Modified-UNet++ improved the most. However, the proposed architecture outperforms the existing works on average for all the test datasets.
Table 4.
F1-score and KC with data-augmented training pair images for the KOMPSAT-3 dataset.
Table 5 shows detection accuracy of the proposed and existing algorithms for reversed input order with data-augmented training pair images from the KOMPSAT-3 dataset. While the existing methods are improved in the detection accuracy over those shown in Table 3, the proposed architecture yields better performance on average than the existing methods. Moreover, the proposed architecture can achieve efficiency with no increase in learning time such as data augmentation.
Table 5.
F1-score and KC with reverse image order for the data-augmented KOMPSAT-3 dataset.
4.2. Performance Evaluation on the CDD Dataset
For the CDD dataset, a total of 3000 image pairs with a size of 255 × 255 were used to evaluate the detection performance of the proposed and conventional algorithms. Figure 20 depicts the test images, ground truths, and detection results of the proposed and conventional algorithms for CDD. The proposed algorithm shows that the change map is almost the same as the ground truth. The proposed algorithm exhibits a significant improvement in the false negative (undetection) area compared with the conventional algorithms. In addition, it can detect changes even in small regions. For the conventional approaches, ATTUNet results in better segmentation than U-Net because it achieves better feature representation.
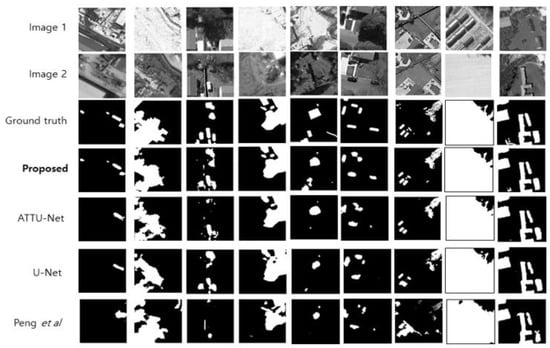
Figure 20.
Subjective evaluation of the proposed and conventional algorithms for CDD dataset.
To assess the detection performance objectively, F1-score and KC metrics were used, as shown in Table 6. The proposed architecture results in better performance than the conventional approaches, achieving F1-score and KC values of 0.70 and 68.74, respectively. It implies that the proposed method can identify the changes in the “Good” level. Table 7 shows the detection accuracy for the reverse input order. We found that the detection performance of the conventional approaches with JF is significantly degraded for reverse input order. However, the proposed method can consistently maintain the performance of change detection.
Table 6.
F1-score and KC for CDD dataset.
Table 7.
F1-score and KC with reverse image order for the CDD dataset.
4.3. Runtime and Parameter Analysis
To measure the runtime, the proposed algorithm was implemented on an Inter(R) Core i7 3.4 GHz CPU, with 48 GB RAM, and an NVIDIA GTX 1080 Ti GPU. Table 8 shows the runtime comparison in inference for the conventional methods and the proposed algorithm for an image pair (256 × 256). The proposed method incurs 77% and 39% runtime increases against U-Net and ATTUNet in milliseconds, respectively. It is caused by the additional layers of DAG and by employing a dual-path network instead of a single-path network.
Table 8.
Inference runtime comparison (unit: ms).
Regarding model parameters, the proposed algorithm has more parameters than conventional algorithms, because it employs the additional layer of DAG for each level over the baseline ATTUNet as shown in Table 9. However, this work presents a novel method to handle reversible input images while preserving the detection rate regardless of the order of the input image pair for change detection.
Table 9.
Number of parameters for each architecture.
5. Discussion
Change detection is the process of detecting land cover changes in a specific geographical area. However, diverse types of land cover changes are affected by varying environmental factors, geographical variability, and various sensors. The domain adaptation transfers knowledge between domains, increasing the robustness of trained models by domain shifting, enabling the generalization of models. The problem of generalization for the practical application of change detection can seriously impair the operability of deep learning-based classification approaches in real-world applications given the high demand for data [32,33]. Moreover, the proposed method incurs a higher computational burden compared with attention U-Net, owing to additional processes of bilateral dissimilarity encoding and DAG. A shallow network may be developed in future work to address the complexity issues.
6. Conclusions
This study proposed a bilateral dissimilarity attention U-Net for change detection on remote sensing imagery, achieving identical performance regardless of the order of image inputs. The proposed architecture is designed to accomplish order-independency and preserve spectral information based on attention U-Net. The proposed design shares weight parameters in the dual-encoding path to facilitate two image inputs. It can directly receive both image inputs without any pre-processing; thus, the spectral information can be preserved.
In addition, this study introduced a DAG to generate order-independent difference features by exploiting all combination orders of joint and difference features. Moreover, the DAG boosts the feature representation response for the most informative channels by channel attention. Difference features are fed into the attention gate at the decoding path to generate a change map.
Several experiments were conducted to evaluate the effectiveness of the proposed method on the KOMPSAT-3 and CDD datasets. The proposed network achieved average F1-score and KC values of 0.68 and 66.93, respectively, for KOMPSAT-3. Based on KC interpretation, this implies that the proposed architecture can detect changes at a reasonably good detection rate and yields better performance than the conventional methods in terms of F1-score and KC. In addition, the proposed network achieved better performance than the conventional methods for the CDD dataset, with F1-score and KC values of 0.70 and 68.74, respectively, regardless of the image order.
Author Contributions
Methodology, J.L., W.W. and D.S.; investigation, W.W. and D.S.; formal analysis J.L., W.L. and I.M.; supervision, D.S.; Writing—original draft preparation, W.W.; Writing—review and editing, J.L., W.L. and D.S.; All authors have read and agreed to the published version of the manuscript.
Funding
This research was supported by the Basic Science Research Program through the National Research Foundation of Korea (NRF) funded by the Ministry of Science and Technology Infor-mation and Communication (NRF-2021R1A2C2092848) and the Research Grant of Kwangwoon University in 2021 and the MSIT (Ministry of Science and ICT), Korea, under the ICAN (ICT Challenge and Advanced Network of HRD) program (IITP-2022-RS-2022-00156215) supervised by the IITP(Institute of Information & Communications Technology Planning & Evaluation).
Institutional Review Board Statement
Not applicable.
Informed Consent Statement
Not applicable.
Data Availability Statement
Not applicable.
Acknowledgments
The authors sincerely appreciate that academic editors and reviewers give their helpful comments and constructive suggestions.
Conflicts of Interest
The authors declare no conflict of interest. The funders had no role in the design of the study; in the collection, analyses, or interpretation of data; in the writing of the manuscript; or in the decision to publish the results.
References
- Singh, K.K.; Mehrotra, A.; Nigam, M.J.; Pal, K. Unsupervised change detection from remote sensing images using hybrid genetic FCM. In Proceedings of the 2013 Students Conference on Engineering and Systems (SCES), Allahabad, India, 12–14 April 2013. [Google Scholar]
- Bi, C.; Wang, H.; Bao, R. SAR image change detection using regularized dictionary learning and fuzzy clustering. In Proceedings of the 2014 IEEE 3rd International Conference on Cloud Computing and Intelligence Systems, Shenzhen, China, 27–29 November 2014; pp. 327–330. [Google Scholar]
- Gong, M.; Zhou, Z.; Ma, J. Change detection in synthetic aperture radar images based on image fusion and fuzzy clustering. IEEE Trans. Image Process. 2012, 21, 2141–2151. [Google Scholar] [CrossRef] [PubMed]
- Gong, M.; Su, L.; Jia, M.; Chen, W. Fuzzy clustering with a modified MRF energy function for change detection in synthetic aperture radar images. IEEE Trans. Fuzzy Syst. 2013, 22, 98–109. [Google Scholar] [CrossRef]
- Hao, M.; Zhang, H.; Shi, W.; Deng, K. Unsupervised change detection using fuzzy c-means and MRF from remotely sensed images. Remote Sens. Lett. 2013, 4, 1185–1194. [Google Scholar] [CrossRef]
- Hao, M.; Hua, Z.; Li, Z.; Chen, B. Unsupervised change detection using a novel fuzzy c-means clustering simultaneously incorporating local and global information. Multimed. Tools Appl. 2017, 76, 20081–20098. [Google Scholar] [CrossRef]
- Fei, G.; Lu, Z.; Jun, W.; Jingyuan, M. Change detection in remote sensing images of damage areas with complex terrain using texture information and SVM. In Proceedings of the 2015 AASRI International Conference on Circuits and Systems (CAS 2015), Paris, France, 9–10 August 2015; pp. 9–10. [Google Scholar]
- Habib, T.; Inglada, J.; Mercier, G.; Chanussot, J. Support vector reduction in SVM algorithm for abrupt change detection in remote sensing. IEEE Geosci. Remote Sens. Lett. 2009, 6, 606–610. [Google Scholar] [CrossRef]
- Volpi, M.; Tuia, D.; Bovolo, F.; Kanevski, M.; Bruzzone, L. Supervised change detection in VHR images using contextual information and support vector machines. Int. J. Appl. Earth Obs. Geoinf. 2013, 20, 77–85. [Google Scholar] [CrossRef]
- Bovolo, F.; Bruzzone, L.; Marconcini, M. A novel approach to unsupervised change detection based on a semisupervised SVM and a similarity measure. IEEE Trans. Geosci. Remote Sens. 2008, 46, 2070–2082. [Google Scholar] [CrossRef]
- Lv, N.; Chen, C.; Qiu, T.; Sangaiah, A.K. Deep learning and super pixel feature extraction based on contractive autoencoder for change detection in SAR images. IEEE Trans. Ind. Inform. 2018, 14, 5530–5538. [Google Scholar] [CrossRef]
- Planinšič, P.; Gleich, D. Temporal change detection in SAR images using log cumulants and stacked autoencoder. IEEE Geosci. Remote Sens. Lett. 2018, 15, 297–301. [Google Scholar] [CrossRef]
- Wiratama, W.; Lee, J.; Park, S.-E.; Sim, D. Dual-dense convolution network for change detection of high-resolution panchromatic imagery. Appl. Sci. 2018, 8, 1785. [Google Scholar] [CrossRef]
- Wiratama, W.; Sim, D. Fusion network for change detection of high-resolution panchromatic imagery. Appl. Sci. 2019, 9, 1441. [Google Scholar] [CrossRef]
- Zhang, W.; Lu, X. The spectral-spatial joint learning for change detection in multispectral imagery. Remote Sens. 2019, 11, 240. [Google Scholar] [CrossRef]
- Zhang, Z.; Vosselman, G.; Gerke, M.; Tuia, D.; Yang, M.Y. Change detection between multimodal remote sensing data using Siamese CNN. arXiv 2018, arXiv:1807.09562. Available online: https://arxiv.org/abs/1807.09562 (accessed on 10 February 2023).
- Hong, D.; Qiu, C.; Yu, A.; Quan, Y.; Liu, B.; Chen, X. Multi-Task Learning for Building Extraction and Change Detection from Remote Sensing Images. Appl. Sci. 2023, 13, 1037. [Google Scholar] [CrossRef]
- Wang, J.; Zhong, Y.; Zhang, L. Change Detection Based on Supervised Contrastive Learning for High-Resolution Remote Sensing Imagery. IEEE Trans. Geosci. Remote. Sens. 2023, 61, 5601816. [Google Scholar] [CrossRef]
- Eftekhari, A.; Samadzadegan, F.; Javan, F.D. Building change detection using the parallel spatial-channel attention block and edge-guided deep network. Int. J. Appl. Earth Obs. Geoinf. 2023, 112, 103180. [Google Scholar] [CrossRef]
- Zhao, B.; Luo, X.; Tang, P.; Liu, Y.; Wan, H.; Ouyang, N. STDecoder-CD: How to Decode the Hierarchical Transformer in Change Detection Tasks. Appl. Sci. 2022, 12, 7903. [Google Scholar] [CrossRef]
- Wiratama, W.; Lee, J.; Sim, D. Change detection on multi-spectral images based on feature-level U-Net. IEEE Access. 2020, 8, 12279–12289. [Google Scholar] [CrossRef]
- Peng, D.; Zhang, Y.; Guan, H. End-to-end change detection for high resolution satellite images using improved unet++. Remote Sens. 2019, 11, 1382. [Google Scholar] [CrossRef]
- Ronneberger, O.; Fischer, P.; Brox, T. U-Net: Convolutional networks for biomedical image segmentation. In Medical Image Computing and Computer-Assisted Intervention 2015; Navab, N., Hornegger, J., Wells, W.M., Frangi, A.F., Eds.; Springer International Publishing: Cham, Switzerland, 2015; pp. 234–241. [Google Scholar] [CrossRef]
- Oktay, O.; Schlemper, J.; Folgoc, L.L.; Lee, M.; Heinrich, M.; Misawa, K.; Mori, K.; McDonagh, S.; Hammerla, N.Y.; Kainza, B.; et al. Attention u-net: Learning where to look for the pancreas. In Proceedings of the International Conference of Medical Imaging with Deep Learning, Amsterdam, Netherlands, 4–6 July 2018; pp. 197–207. [Google Scholar]
- Rasti, B.; Hong, D.; Hang, R.; Ghamisi, P.; Kang, X.; Chanussot, J.; Benediktsson, J.A. Feature extraction for hyperspectral imagery: The evolution from shallow to deep: Overview and toolbox). IEEE Geosci. Remote Sens. Mag. 2020, 8, 60–88. [Google Scholar] [CrossRef]
- Noh, H.; Hong, S.; Han, B. Learning deconvolution network for semantic segmentation. In Proceedings of the IEEE International Conference on Computer Vision, Santiago, Chile, 7–13 December 2015; pp. 1520–1528. [Google Scholar]
- Hu, J.; Shen, L.; Sun, G. Squeeze-and-excitation networks. In Proceedings of the IEEE Conference on Computer Vision and Pattern Recognition (CVPR), Salt Lake City, UT, USA, 18–23 June 2018; pp. 7132–7141. [Google Scholar]
- KOMPSAT-3 Product Specifications Version 2.0. Available online: http://www.si-imaging.com/resources/?pageid=2&uid=232&mod=document (accessed on 20 January 2023).
- Lebedev, M.; Vizilter, Y.V.; Vygolov, O.V.; Knyaz, V.A.; Rubis, A.Y. Change detection in remote sensing images using conditional adversarial networks. Int. Arch. Photogramm. Remote Sens. Spat. Inform. Sci. 2018, 42, 565–571. [Google Scholar] [CrossRef]
- Altman, D.G. Practical Statistics for Medical Research; Chapman & Hall/CRC: London, UK; New York, NY, USA, 1991. [Google Scholar]
- Gwet, K. Hnadbook of Inter-Rater Reliability; Advanced Analytics Press: Gaithersburg, MD, USA, 2014; ISBN 9-780970-806284. [Google Scholar]
- Soto Vega, P.J.; da Costa, G.A.O.P.; Feitosa, R.Q.; Ortega Adarme, M.X.; de Almeida, C.A.; Heipke, C.; Rottensteiner, F. An unsupervised domain adaptation approach for change detection and its application to deforestation mapping in tropical biomes. ISPRS J. Photogramm. 2021, 181, 113–128. [Google Scholar] [CrossRef]
- Fengjiao, G.; Yiming, Y.; Hemin, L.; Ruiyao, S. PIIE-DSA-Net for 3D semantic segmentation of urban indoor and outdoor datasets. Remote Sens. 2021, 14, 12–56. [Google Scholar]


Disclaimer/Publisher’s Note: The statements, opinions and data contained in all publications are solely those of the individual author(s) and contributor(s) and not of MDPI and/or the editor(s). MDPI and/or the editor(s) disclaim responsibility for any injury to people or property resulting from any ideas, methods, instructions or products referred to in the content. |
© 2023 by the authors. Licensee MDPI, Basel, Switzerland. This article is an open access article distributed under the terms and conditions of the Creative Commons Attribution (CC BY) license (https://creativecommons.org/licenses/by/4.0/).