Abstract
Infection with severe acute respiratory syndrome coronavirus 2 (SARS-CoV-2) results in varied clinical outcomes, with virus-induced chronic inflammation and tissue injury being associated with enhanced disease pathogenesis. To determine the role of tissue damage on immune populations recruitment and function, a mathematical model of innate immunity following SARS-CoV-2 infection has been proposed. The model was fitted to published longitudinal immune marker data from patients with mild and severe COVID-19 disease and key parameters were estimated for each clinical outcome. Analytical, bifurcation, and numerical investigations were conducted to determine the effect of parameters and initial conditions on long-term dynamics. The results were used to suggest changes needed to achieve immune resolution.
1. Introduction
Infection with severe acute respiratory syndrome coronavirus 2 (SARS-CoV-2) results in varied individual coronavirus disease 2019 (COVID-19) outcomes ranging from asymptomatic to mild, severe, and fatal disease. The mechanisms responsible for the COVID-19 pathogenesis are not fully understood, but studies suggest that severe outcomes are driven by virus-induced reconfiguration of the innate immune system, which results in inflammation and tissue injury [1,2]. In severe and fatal SARS-CoV-2 infections, transcriptomic, epigenomic, and proteomic analyses revealed widespread dysfunction of peripheral innate immunity, aberrant interferon-related responses, recruitment of hyperactive macrophages and of functionally altered neutrophils, and the suppression of adaptive immunity (such as B-cells and T-cells function) [1,3,4]. Interferon-induced proinflammatory states stimulate uncontrolled complement activation and development of neutrophil extracellular traps (NETS), both of which induce overproduction and uncontrolled release of proinflammatory markers in a process known as cytokine storm [5,6], seen in other inflammatory diseases such as endotoxemia [7] and acute respiratory distress syndrome (ARDS)–complicated sepsis [8].
In general, inflammation can be viewed as a robust physiological process in which the body’s innate immune system provides protection from adverse environmental factors. This process occurs while the immune system tries to resolve homeostatic perturbations initiated within the body (in autoimmune disease) or through external stimuli (bacteria, viral infections, injury, etc.) [9] with the goal of maintaining the structural integrity of tissues and organs [10]. Successful innate immune response is initiated within minutes and resolved within hours, with the affected tissues and immune populations returning to their homeostatic state [9]. Conversely, chronic inflammation results in continual recruitment to the tissue of neutrophils, macrophages, and inflammatory mediators whose activity persists for weeks, months or even years [9,11,12]. The persistent proinflammatory state induces further damage and recruitment of more inflammatory mediators. Several studies examined the differences in proinflammatory cellular and cytokine populations in patients with mild and severe COVID-19 disease [13,14,15,16]. Data in [13] showed elevated levels of proinflammatory (IL-6, IL-2, and IFN-) and anti-inflammatory cytokines (IL-10), elevated levels of neutrophils and reduced levels of CD8 T-cells in patients with severe compared to those with mild COVID-19 disease. Similarly, [15] found elevated neutrophils levels, elevated IL-6 levels, and reduced levels of CD8 T-cells and CD4 T-cells in patients with severe or critical compared to those with moderate COVID-19. Elevated anti-inflammatory cytokines levels (IL-10) in severe disease was reported in [16], as well. Last, the neutrophil-to-CD8 T-cell ratio (N8R) has emerged as an early prognosis method for identifying severe COVID-19 disease [13], with high N8R ratio being indicative of severe outcomes [15,17,18].
While data exists for the magnitude of immune cells and proinflammatory mediators in different disease outcomes, little is known about the mechanistic interactions between these populations, and about the role that feedback, interpopulations effects and regulations play on overall disease outcomes. In this paper, we develop a mathematical model of interactions between neutrophils, macrophages, pro- and anti-inflammatory markers and CD8 T-cells and use it to tease out mechanisms responsible for COVID-19 pathogenesis. Previously, mathematical models have investigated human inflammation following physical injury [19,20,21], cancer [22,23], lung infections [10], rheumatoid arthritis [24,25], atherosclerosis [26], H. pylori [27], diabetes [28], and nonspecific pathogens [29,30,31,32,33,34,35]. Specifically, mathematical modeling of viral infections with pathogens such as influenza [36,37,38,39,40], hepatitis B [41,42,43,44], SARS-CoV [45,46], and SARS-CoV-2 [47,48,49,50,51,52,53,54,55,56] have investigated the role of immune responses in disease resolution or inflammation. Some of these studies highlighted the importance of cytokine production and neutrophil function in modulating disease pathogenesis.
In our study, we do not explicitly model the dynamics of SARS-CoV-2 infection, and instead only model the resulting inflammation. We consider interactions between neutrophils (active and apoptotic), macrophages, proinflammatory mediators, anti-inflammatory mediators and CD8 T-cells. We use the model to investigate the neutrophil responses to tissue damage caused by SARS-CoV-2 infection and to determine the mechanisms leading to resolution or inflammation. Moreover, we fit the model to longitudinal data from mild and severe COVID-19 infections to identify resolution or inflammation-specific parameters, such as the neutrophil-to-CD8 T-cell ratio. These results can inform interventions.
2. Materials and Methods
2.1. Mathematical Model
To determine the mechanistic interactions that lead to increased inflammation in severe COVID-19 infections, we develop a mathematical model of immune responses which extends on a previous model of nonspecific inflammation published in [30]. Briefly, we model the interaction between active and apoptotic neutrophils and , macrophages , proinflammatory mediators , anti-inflammatory mediators , and CD8 T-cells over time t, as follows. We assume that, following SARS-CoV-2 infection, epithelial tissue gets damaged according to function
where
as in [30]. Function Equation (1) accounts for A repeated cycles of tissue damage occurring every days as a result of inflammatory processes triggered by SARS-CoV-2 infection (see Figure 1A for a schematic of a single tissue damage cycle and Figure 1B for a schematic of four tissue damage cycles for ).
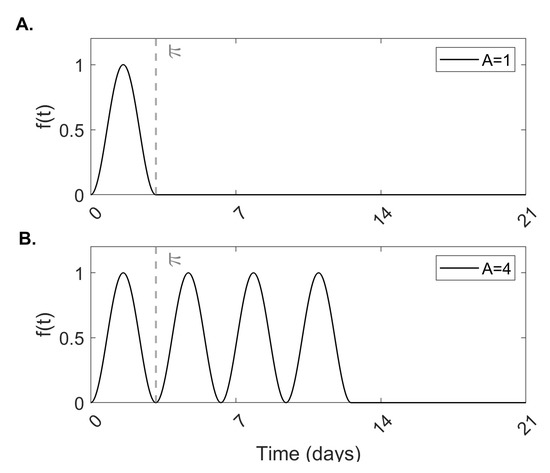
Figure 1.
Tissue damage. Theoretical model of tissue damage given by Equation (1) for (A) a single cycle of damage and (B) four cycles of damage .
The physical damage to tissue results in release of cytokines that further enhance an inflammatory response. While there are a number of proinflammatory cytokines and mediators produced in response to tissue damage or viral infection (IL-1, IL-6, IL-8, TNF-, among others [57]) we model them through a single proinflammatory population , which is produced at rate and decays at per capita rate . This proinflammatory population recruits neutrophils and macrophages at the site of the inflammation. As in [30], we ignore neutrophil activation and differentiation and assume that activated neutrophils are recruited at rate and macrophages are recruited at rate , respectively. Active neutrophils die and transform into apoptotic neutrophils at rate , proportional to regulatory factors (in our model, the anti-inflammatory cytokine IL-10). Both active and apoptotic neutrophils contribute to increased production of proinflammatory mediators. Here, however, we only incorporate the contribution of apoptotic neutrophils, who undergo necrosis at rate , leading to damage of healthy tissue and hence further accumulation of proinflammatory factors [11,58], as necrosis leads to release of toxic chemicals from internal granules [11,58,59,60]. We model this by adding a Hill-type production term with a Hill coefficient of two, , into the proinflammatory population , which saturates at high levels. Here, is the concentration of neutrophils required for half-maximal release of proinflammatory mediators and is the maximal level of proinflammatory population recruited after tissue damage.
We assume that macrophages are recruited in response to proinflammatory mediators at rate , die at per capita rate , and contribute to the removal of apoptotic neutrophils through phagocytosis at rate . Recognition of apoptotic neutrophils by macrophages is thought to reprogram them to release anti-inflammatory signals, which recruit anti-inflammatory populations at rate . We assume that the anti-inflammatory population is present at low levels at the time of the infection, with being the production rate and the per capita decay rate.
Lastly, we consider that the CD8 T-cell population is present in the epithelium at base level , where is the production and is the per capita death rate. Following viral infection, CD8 T-cells expand to become cytotoxic T-cells at rate , proportional to the antigen-presenting cell concentration (in this case macrophages, ). The expansion is suppressed in the presence of regulatory factors , in a density dependent manner with being the concentration of regulatory factors where the effect is half-maximal.
A diagram of our model is given in Figure 2 and the model equations are
subject to initial conditions , , , , , and .
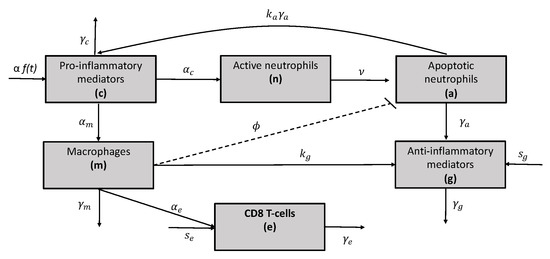
Figure 2.
Network diagram for the mathematical model given in Equation (3).
2.2. Clinical Data
Longitudinal average and standard deviation values for total neutrophils, CD8 T-cells, and IL-10 were collected from 27 patients with mild and 13 patients with severe COVID-19 disease at days post hospitalization and previously published in [13]. Neutrophils and CD8 T-cells were measured in cells /L and IL-10 was measured in pg/mL (see Figure 3, red points and red error bars).
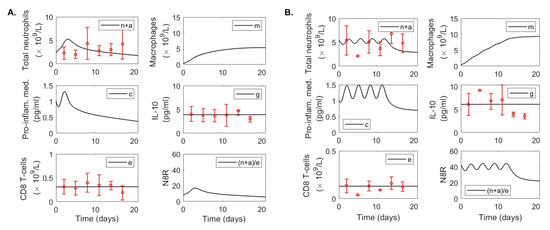
Figure 3.
Data fitting results. Dynamics of variables defined by model Equation (3) over time for parameters in Table 1 and Table 2 versus immunological data (red circles) in (A) mild and (B) severe COVID-19 infections. Time represents days post hospital admission. Error bars represent mean ± standard deviation where total neutrophil and CD8 T-cell data are given in and IL-10 data in pg/mL as in [61].
2.3. Parameter Estimation
We use literature values for some of the parameters to reduce the model’s degrees of freedom and allow for better estimation of the remaining parameters (see Table 1). The reported half-life of neutrophils is = 6–10 h [62]. We use a half-life of ten hours in our model, which corresponds to a decay rate per day. Similarly, the reported half-life of alveolar macrophages is two weeks [63], corresponding to decay rate per day. Nonactivated CD8 T-cell have a lifespan of 34 days [64], however, in the presence of antigen they expand into cytotoxic T-cells, who are short lived [65] with decay rate per day [44,66]. The IL-10 lifespan is 2.7–4.5 h [67]. Here, we assume a lifespan of 3.8 h, corresponding to a decay rate per day. Last, all proinflammatory mediators have a short half-life [68]. We use IL-6 in our model, whose half-life of 15 h [69], to obtain a decay rate per day. We assume that the initial neutrophils, CD8 T-cells and IL-10 are given by the hospitalization admission data, and we split the neutrophil data between active and apoptotic neutrophils in both mild and severe cases. The initial macrophage number is per L, corresponding to monocyte data upon hospital admission in [13]. Last, cytokine initial condition is set arbitrarily to per L. We assume equilibrium conditions before hospitalization, hence the recruitment rates are and . The initial tissue damage is set at for the mild cases and for the severe cases with in both groups. All other parameters are chosen arbitrarily to be cells, macrophages/(proinflammatory cells × day), anti-inflammatory cells/ (apoptotic neutrophils) and anti-inflammatory markers/(apoptotic neutrophils). A summary of fixed parameters is given in Table 1.

Table 1.
Fixed parameter values and initial conditions.
Table 1.
Fixed parameter values and initial conditions.
| Parameter | Description | Mild | Severe | Reference |
|---|---|---|---|---|
| Decay rate of CD8 T-cells | /day | /day | [64] | |
| Decay rate of proinflammatory mediators | /day | /day | [69] | |
| Decay rate of | /day | /day | [70] | |
| Decay rate of alveolar macrophages | /day | /day | [63] | |
| Rate of necrosis of apoptotic neutrophils. | /day | /day | [62] | |
| A | Cycles of tissue damage | 1 | 4 | − |
| Tissue damage magnitude | 1 | 1 | − | |
| Macrophage recruitment rate | − | |||
| Neutrophils where proinflam. release is half-max. | 1 | 1 | − | |
| Reg. cells where CD8 T-cell response is half-max. | 1 | 1 | − | |
| T regulatory cells recruitment rate | − | |||
| CD8 T-cells recruitment rate | − | |||
| Anti-inflammatory production rate | 15 | 15 | − | |
| Initial concentration of active neutrophils | × data | × data | [13] | |
| Initial concentration of apoptotic neutrophils | × data | × data | [13] | |
| Initial concentration macrophages | × /L | × /L | [13] | |
| Initial concentration proinflammatory mediators | /L | /L | − | |
| Initial concentration anti-inflammatory mediators | data | data | [13] | |
| Initial concentration of CD8 T-cells | data | data | [13] | |
| Max. level of proinflam. pop. recruited after damage | 0.6 | 0.6 | − |
We assume time in our model is the day of hospital admission and estimate the remaining parameters , by fitting the solution of model Equation (3) to IL-10, CD8 T-cells, and total neutrophil data given in [13] for mild and severe COVID-19 patients, where . Using the algorithm in Matlab, we minimize the objective function
where , , , are the theoretical solutions of model Equation (3) at times for parameters ; , and are the neutrophil, IL-10 and CD8 T-cell data at times as given in [13], and days post hospitalization. The best parameters estimates are given in Table 2.

Table 2.
Best parameter estimates from fitting model Equation (3) to data from mild and severe COVID-19 cases.
Table 2.
Best parameter estimates from fitting model Equation (3) to data from mild and severe COVID-19 cases.
| Parameter | Description | Mild | Severe |
|---|---|---|---|
| CD8 T-cells expansion rate | |||
| Rate at which macrophages engulf neutrophils | |||
| Rate of neutrophil apoptosis | |||
| Neutrophil recruitment rate | |||
| ssq | Sum of squares | 2.84 | 4.14 |
2.4. Semirelative Sensitivity Analysis
We conduct a formal semirelative sensitivity analysis of system Equation (3) with respect to the fitted parameters. Briefly, we let be the sensitivity curves of with respect to . Then are the semirelative sensitivity curves of with respect to , which measure the change of when parameter is doubled at time t. The corresponding sensitivity equations with respect to parameters are presented in Appendix A, Equations (A1)–(A4), and the corresponding semirelative curves are presented in Figure A3 and Figure A4.
3. Results
Asymptotic Analysis Results
To determine the equilibrium solutions of model Equation (3), we assume that the initial tissue damage stimulus has been eliminated, and hence set .
Proposition 1.
Proof.
We set for in Equation (3) and solve for components of vector in terms of This yields the following expressions
Next, we solve for by substituting and into
Simplifying yields
which has one solution
when
and three solutions
when
Since are positive when is positive, we obtain that a single equilibrium solution called no-inflammation equilibrium exists when condition Equation (5) holds,
Conversely, three equilibria solutions exist when condition Equation (6) holds. They are (as before) and
given by Equations (7) and (10) and called chronic inflammation equilibria. This concludes our proof. □
Proposition 2.
The no-inflammation equilibriumexists and is locally asymptotically stable for all parameters.
Proof.
The Jacobian associated with system Equation (3) at equilibrium point is
The corresponding characteristic equation at the no-inflammation equilibrium point
is
with eigenvalues , , , , , and . Therefore, the no-inflammation equilibrium is always locally asymptotically stable. □
Proposition 3.
One of the chronic inflamation equolibria is always unstable and the other is locally asymptotocally stable when condition (6) holds.
Proof.
The characteristic equation for the chronic-inflammation equilibria , is
where
By Routh-Hurwitz conditions, we have eigenvalues with negative real parts (and hence local asymptotoc stability for ) if and only if the Hurwitz matrices for
have positive determinants. This simplifies to which is always true, , , and , and which happens for and
Solving Equation (14) is cumbersome, so we will present numerical results for the stability of the chronic-inflammation states and from here on. □
4. Numerical Results
4.1. Parameter Variability between Disease Outcomes
Using the data fitting approach described above, we obtained good fits of model Equation (3) to data from patients with mild disease (Figure 3A) and severe disease (Figure 3B). In Table 2, we present the parameter estimates corresponding to the best fits. The neutrophil apoptosis rate is higher in severe compared to mild cases, /(anti-inflam × day) compared to /(anti-inflam × day), which implies that the change in neutrophil phenotype is disease status dependent. Similarly, neutrophil recruitment rate is larger in the severe compared to the mild cases, neutrophils/(proinflamm × day) compared to neutrophils/(pro-inflamm × day), respectively. By contrast, the rate at which macrophages remove apoptotic neutrophils is lower in the severe compared to the mild cases, neutrophils/(macrophage× day) compared to neutrophils/(macrophage × day), respectively. The biggest difference between the two groups, however, is in the recruitment of CD8 T-cells, with the severe patients’ recruitment rate being six order of magnitude lower than the mild patients’ recruitment rate, CD8 T-cells/(macrophage× day) compared to CD8 T-cells/(macrophage × day), respectively. We observe different long-term dynamics between mild and severe cases for total neutrophils , proinflammatory mediator and macrophages , with these populations asymptotically reaching extinction (no-inflammation equilibrium state) in the mild case and persisting at positive levels (chronic-equilibrium state) for severe case (see Figure 4). By contrast, data fitting predicts that the equilibria values for CD8 T-cell and IL-10 populations settle close to the populations’ initial conditions (which correspond to the first mild and severe CD8 T-cell and IL-10 clinical data points, respectively). Hence, as seen in the data, the CD8 T-cell equilibrium value is 2.4-times higher in mild patients, /L, compared to severe patients, /L. Conversely, as seen in the data, the IL-10 equilibrium value is lower in mild patients pg/mL compared to the severe patients, pg/mL (see Figure 4).
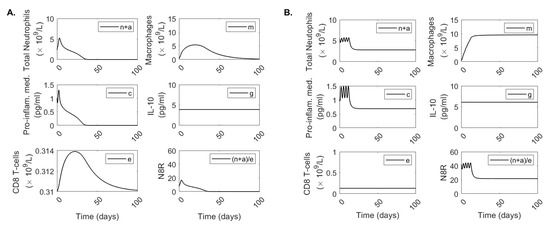
Figure 4.
Long-term dynamics. Dynamics of model Equation (3) over 100 days for parameters for (A) mild and (B) severe COVID-19 infections.
4.2. Bifurcation Analysis
The stability analysis shows bistable behavior between the no-inflammation and chronic-inflammation states when conditions Equations (11) and (14) hold. To determine the parameter space where bistability exists and its relationship with the estimated mild and severe parameters we constructed and bifurcation diagrams. In both diagrams, we start with parameters and initial conditions estimated from severe cases and vary and , respectively. Figure 5 shows that, for low neutrophil recruitment rates , only the no-inflammation equilibrium exists and is stable. This range includes the mild case value (see Figure 5, green line). For larger neutrophil recruitment rates , we obtain bistability of the no-inflammation and chronic-inflammation equilibria. The range includes the severe case value (see Figure 5, red line). The dynamical transition happens at the bifurcation point . These results suggest that when starting with the severe outcome setup, we only need to lower neutrophil recruitment rates to speedup the resolution of inflammation, independently of the other biological processes.

Figure 5.
The bifurcation diagram. Stable (solid black curves) and unstable (dashed black curves) population equilibria for varied for (A) total neutrophils , (B) IL-10 , and (C) N8R . The green and red lines are the values from the mild and severe cases, and .
Conversely, Figure 6 shows that, for low macrophage phagocytosis rates , we obtain bistability of the no-inflammation and chronic-inflammation equilibria. For higher macrophage phagocytosis rates we obtain that only the no-inflammation equilibrium exists and is stable. The transition happens at the bifurcation point . Unlike the bifurcation diagram, however, we note that both the mild and severe values are in the bistable region (see Figure 6, green and red lines) suggesting that the resolution of inflammation seen in the mild case is dependent on other parameters and/or initial conditions.

Figure 6.
The bifurcation diagram. Stable (solid black curves) and unstable (dashed black curves) population equilibria for varied for (A) total neutrophils , (B) IL-10 , and (C) N8R . The green and red lines are the values from the mild and severe cases, and .
4.3. Basin of Attraction
We next determine the basins of attraction for the no-inflammation and chronic-inflammation equilibrium states. For simplicity, we assumed that all parameters and initial conditions are given in Table 1 and Table 2 (severe case), fixed and varied activated neutrophils and anti-inflammatory mediators initial conditions . Under these assumptions, we find a large basin of attraction for the chronic-inflammation equilibrium state where and and a small basin of attraction for the no-inflammation equilibrium state for small and values (see Figure 7A). This means that for low initial anti-inflammatory markers, the inflammation is resolved when few active neutrophils are recruited and inflammation persists otherwise. We further investigate how the basin of attraction for the no-inflammation equilibrium changes when we fix pg/mL and vary both the initial activated neutrophils number and the macrophage phagocytosis rate . We find that for high macrophage phagocytosis rate , the no-inflammation equilibrum state is an attracting set for all , while for low macrophage phagocytosis rate the no-inflammation equilibrium state is an attracting set only when the initial activated neutrophil level is small (see Figure 7B).
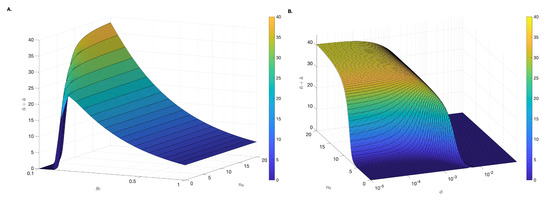
Figure 7.
Basin of attraction. Attracting asymptotic solutions for (A) different initial condition and (B) , different initial condition and changing parameter . We fix neutrophils/(macrophage × day) and all other parameters are as in Table 1 and Table 2 (severe case). Note that and are plotted on log scale.
4.4. The Role of Tissue Damage on Immune Resolution
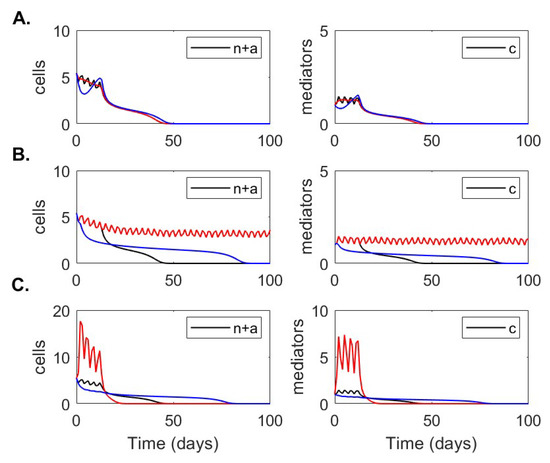
All the stability results presented above assumed that the tissue damage function can be ignored by setting . To determine how relaxing this condition affects dynamics we investigate the short- and long-term behavior of total neutrophils and proinflammatory cytokines when we vary (i) the frequency of oscillations , (ii) the number of tissue damage cycles , and (iii) the magnitude effect that tissue damage has on the proinflammatory cytokine recruitment rate . We start with parameters and initial conditions in Table 1 and Table 2 (severe case), and , which results in resolution of inflammation for the baseline assumptions . We then increase or decrease one of the tissue damage parameters while leaving the other two unchanged. We find that the frequency of oscillations p has no significant effect of the short- and long-term and dynamics (see Figure 8A). The number of tissue damage cycles A, however, has a significant effect on the length of inflammation, with many rounds of tissue damage resulting in prolonged inflammation which persists for longer than 100 days for (see Figure 8B, red curves) and is resolved in 50 days for (see Figure 8B, black curves). The long-term dynamics, however, do not change with the no-inflammation equilibrium state being reached regardless of A. Last, the magnitude of tissue damage, , has a transient effect of both and dynamics. In particular, a large leads to a large transient increase in both total neutrophils and proinflammatory markers over the first 20 days (see Figure 8C, red curves), while a small has a low overall effect (see Figure 8C, blue curves). Interestingly, the transient effect is prolonged for low and decays faster for high .
4.5. Neutrophils-to-CD8 T-Cell Ratio
One marker commonly used for deciding disease severity is the nuetrophils-to-CD8 T-cell ratio, N8R [13,15]. In the context of COVID-19 pathogenesis, the reported N8R median for mild cases is (ranges –) in [15], while the reported N8R median for severe cases is (IQR: –) in [15] and (range –) in [13]. In our model, the N8R ratio at time t is given by
For mild cases, nuetrophils-to-CD8 T-cell ratio peaks 3.25 days after hospital admission to and decays to zero in the long-run. By contrast, for severe cases, the nuetrophils-to-CD8 T-cell ratio starts at at the time of hospital admission and settles at in the long-run.
5. Discussion
In this paper, we developed a mathematical model of innate immunity following SARS-CoV-2 infection that describes neutrophils recruitment into the lungs following epithelial tissue damage and investigates their role in inducing disease resolution or in enhancing disease pathogenesis. We studied the model analytically and numerically and determined that it exhibits monostable and bistable kinetics, where the monstable state corresponds to immune resolution and the bistable state corresponds to tradeoff between immune resolution and chronic-inflammation. We fitted the model to immune marker data from patients with mild and severe COVID-19 disease published in [61]. We estimated several key parameters for each clinical outcome group and determined the immune-specific differences between the groups. We examined the effect on the systems’ long-term behavior of parameters and initial conditions and used the results to derive markers of chronic-inflammation and immune resolution.
Diversity in clinical outcomes following SARS-CoV-2 infection is attributed to heterogeneity in immune responses who, in turn, are influenced by individuals’ age, ethnicity, sex and the presence of comorbidities [71]. Delayed and ineffective innate immunity leads to increased neutrophil recruitment in the blood, neutrophil infiltration into the lungs, changes in neutrophil phenotype, and/or formation of neutrophil extracellular traps [3,12,72,73,74], all of which have been associated with poor disease outcomes. To address the role of neutrophils of different phenotypes, we modeled two neutrophil subpopulations, activated and apoptotic . Using the model, we examined the differences in total neutrophil levels at hospitalization , the estimated neutrophil activation rate , and the estimated neutrophil apoptotosis rate when the model is fitted to immune population data from mild and severe clinical outcomes. We found higher values for all three markers with initial neutrophils having the biggest increase (2.3-times higher), compared to neutrophil activation (1.5-times higher), and phenotype change (1.3-times higher) in severe cases compared to mild cases. Data fitting indicated that the parameter space corresponding to severe disease outcomes is associated with the bistable kinetics of our model, while the parameter space corresponding to mild clinical outcome is associated with the monostable kinetics of our model (Figure 4). One dimensional bifurcation diagrams with respect to neutrophil recruitment rate (Figure 5) and two-dimensional bifurcation diagrams with respect to and initial activated neutrophils (Figure 7B) showed that lowering neutophil recruitment and/or the neutrophil activation can lead to immune resolution. One way to accomplish that is by understanding how comorbidities or pre-existing conditions affect neutrophil functionality, recruitment, are inherent dysregulation [75] as done in other diseases [12,76,77].
In our model, one way to control neutrophil activity is through recruitment of macrophages which, in turn, enhance neutrophil apoptosis at rate . Data fitting showed decreased neutrophil apoptosis rates (12.4-times lower) in severe compared to mild cases. One dimensional bifurcation diagrams with respect to showed that increasing macrophage induced neutophil apoptosis can lead to immune resolution (Figure 6).
A common feature for severe COVID-19 clinical outcomes is the production of high levels of proinflammatory cytokines (such as IL-6), which in our model were generically combined under the cytokine population c. Paradoxically, IL-10, which is classified as an anti-inflammatory cytokine, is also elevated in severe cases [61]. To determine its role on overall immune dynamics, we considered an anti-inflammatory population in our model, modeled its effect on neutrophil phenotype change and on lowering the recruitment of CD8 T-cells, and fitted it to IL-10 data. We found that the magnitude of anti-inflammatory population at hospital admission is 1.5-times higher in severe compared to mild cases. Using bifurcation analyses we investigated how changes in affect the results. We found that lowering allows for immune resolution for a larger parameter space (Figure 7A). This suggests that IL-10 fails to suppress the inflammation in COVID-19, a result seen in other inflammatory diseases [78,79].
An inefficient or delayed innate immune response to SARS-CoV-2 affects adaptive immune response priming, which can lead to long-term immune conditions and or fatalities [71]. In our model, we only consider the CD8 T-cell population , which is primed by antigen presenting cells (macrophages in our case) and inhibited by anti-inflammatory mediators (IL-10 in our case). We fitted the model to CD8 T-cell data from mild and severe cases, and found that the recruitment rate is extremely low in the severe cases (six order of magnitude lower than in the mild cases). Using these results we calculated the neutrophil-to-CD8 T-cell ratio, which has been used in other studies as a severity marker [80,81,82]. We found that in mild cases N8R peak to , 3.25 days after hospital admission and decay to zero in the long-run. By contrast, in severe cases the N8R start at at the time of hospital admission and settle at in the long-run (Figure 4). Interestingly, we predict that these different results are heavily determined by the low recruitment rate of CD8 T-cells in severe cases, rather that differences in neutrophil levels between the two clinical outcomes.
Our study has several limitations. First, we do not explicitly model SARS-CoV-2 dynamics and instead model the inflammatory response following SARS-CoV-2-induced epithelial tissue damage. We use a functional response with oscillatory dynamics and fixed frequency, magnitude, and number of oscillations to model tissue damage (Figure 1). We investigated the dependence of the results on the changes in magnitude, frequency, and number of oscillations. We found that increased cycles of tissue damage result in prolonged inflammation, and higher tissue damage induces larger neutrophil recruitment in the short term, but neither of these factors affect long-term kinetics (Figure 8). More information is needed to determine whether this functional form is indicative of viral-induced tissue damage and early (before hospital admission) virus data would be necessary for a better description of virus-immune system feedback. Second, during data fitting, we made a number of adhoc assumptions that can affect our estimates. Moreover, the fits to limited data may lead to uncertainties in our estimates. To address that, we conducted semirelative sensitivity analyses (Appendix A), which showed that and have strong effect on neutrophil, macrophage and proinflammatory populations and weak effect on the anti-inflammatory and CD8 T-cell populations (Figure A2 and Figure A4) and and have weak effect on all populations (Figure A1 and Figure A3). Last, we considered a half-life of two weeks for macrophages [63]. Several studies have suggested a much longer half-life of 3 weeks–4 months [83,84], which may affect transient (but not long-term) dynamics.
6. Conclusions
In conclusion, we developed a mathematical model of neutrophil dynamics following infection and hospitalization with COVID-19. We fitted the model to the data and determined conditions needed for immune resolution.
Author Contributions
Conceptualization: Q.M.M. and S.M.C.; methodology, Q.M.M., S.M.C.; software, Q.M.M.; validation, Q.M.M., S.M.C.; formal analysis, Q.M.M., S.M.C.; investigation, Q.M.M., S.M.C.; resources, S.M.C.; writing—original draft preparation, Q.M.M., S.M.C.; writing—review and editing, Q.M.M., S.M.C.; supervision, S.M.C.; funding acquisition, S.M.C. All authors have read and agreed to the published version of the manuscript.
Funding
S.M.C. and Q.M.M. were funded by National Science Foundation grants No. 1813011 and 2051820.
Institutional Review Board Statement
Not applicable.
Informed Consent Statement
Not applicable.
Data Availability Statement
Upon acceptance, data and code will be made available through GitHub.
Acknowledgments
S.M.C. and Q.M.M. acknowledge salary support from National Science Foundation grants No. 1813011 and 2051820.
Conflicts of Interest
The authors declare no conflict of interest.
Appendix A
We conduct a formal sensitivity analysis on the system of equations given in Equation (3). We let be the sensitivity curves with respect to The corresponding sensitivity equations with respect to parameter are
Using the parameters in Table 1 and Table 2 (severe case) we plotted the semirelative curves given by which showed low effect of on all populations (see Figure A1).
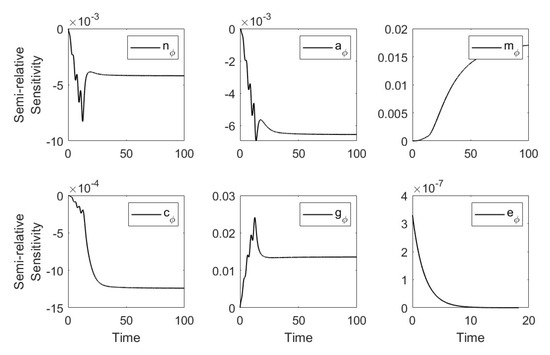
Figure A1.
Semi-relative sensitivity curves with respect to .
We let be the sensitivity curves with respect to The corresponding sensitivity equations with respect to the parameter are
Using the parameters in Table 1 and Table 2 (severe case) we plotted the semirelative curves given by which showed large effect of on the neutrophil, macrophage and proinflammatory populations and weak effect on anti-inflammatory and CD8 T-cell populations (see Figure A2).
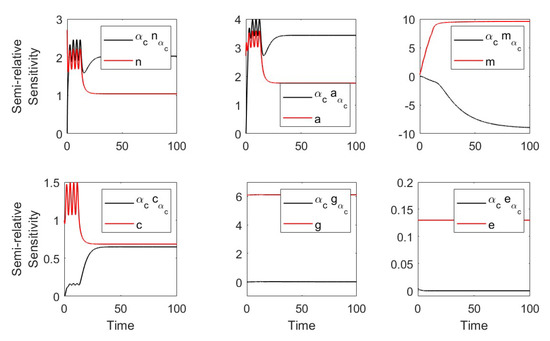
Figure A2.
Semirelative sensitivity curves with respect to .
We let be the sensitivity curves with respect to The corresponding sensitivity equations with respect to the parameter are
Using the parameters in Table 1 and Table 2 (severe case), we plotted the semirelative curves given by which showed low effect of on all populations (see Figure A3).
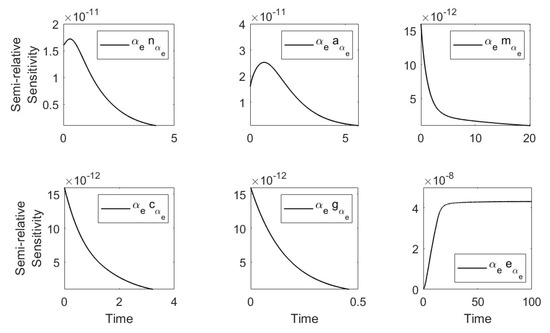
Figure A3.
Semi-relative sensitivity curves with respect to .
We let be the sensitivity curves with respect to The corresponding sensitivity equations with respect to the parameter are
Using the parameters in Table 1 and Table 2 (severe case), we plotted the semirelative curves given by which showed large effect of on the neutrophil, macrophage, and proinflammatory populations and weak effect on anti-inflammatory and CD8 T-cell populations (see Figure A4).
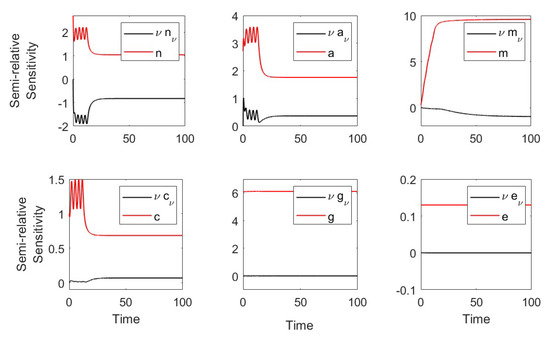
Figure A4.
Semirelative sensitivity curves with respect to .
References
- Borczuk, A.C.; Yantiss, R.K. The pathogenesis of coronavirus-19 disease. J. Biomed. Sci. 2022, 29, 1–15. [Google Scholar] [CrossRef] [PubMed]
- Soy, M.; Keser, G.; Atagündüz, P.; Tabak, F.; Atagu anduz, I.; Kayhan, S. Cytokine storm in COVID-19: Pathogenesis and overview of anti-inflammatory agents used in treatment. Clin. Rheumatol. 2020, 39, 2085–2094. [Google Scholar] [CrossRef]
- Wilk, A.J.; Lee, M.J.; Wei, B.; Parks, B.; Pi, R.; Martinez-Colon, G.J.; Ranganath, T.; Zhao, N.Q.; Taylor, S.; Becker, W.; et al. Multi-omic profiling reveals widespread dysregulation of innate immunity and hematopoiesis in COVID-19. J. Exp. Med. 2021, 218, e20210582. [Google Scholar] [CrossRef]
- Dorgham, K.; Quentric, P.; Gökkaya, M.; Marot, S.; Parizot, C.; Sauce, D.; Guihot, A.; Luyt, C.E.; Schmidt, M.; Mayaux, J.; et al. Distinct cytokine profiles associated with COVID-19 severity and mortality. J. Allergy Clin. Immunol. 2021, 147, 2098–2107. [Google Scholar] [CrossRef]
- Montazersaheb, S.; Hosseiniyan Khatibi, S.M.; Hejazi, M.S.; Tarhriz, V.; Farjami, A.; Ghasemian Sorbeni, F.; Farahzadi, R.; Ghasemnejad, T. COVID-19 infection: An overview on cytokine storm and related interventions. Virol. J. 2022, 19, 1–15. [Google Scholar] [CrossRef]
- Hu, B.; Huang, S.; Yin, L. The cytokine storm and COVID-19. J. Med. Virol. 2021, 93, 250–256. [Google Scholar] [CrossRef] [PubMed]
- De Kleijn, S.; Langereis, J.D.; Leentjens, J.; Kox, M.; Netea, M.G.; Koenderman, L.; Ferwerda, G.; Pickkers, P.; Hermans, P.W. IFN-γ-stimulated neutrophils suppress lymphocyte proliferation through expression of PD-L1. PLoS ONE 2013, 8, e72249. [Google Scholar] [CrossRef] [PubMed]
- Juss, J.K.; House, D.; Amour, A.; Begg, M.; Herre, J.; Storisteanu, D.M.; Hoenderdos, K.; Bradley, G.; Lennon, M.; Summers, C.; et al. Acute respiratory distress syndrome neutrophils have a distinct phenotype and are resistant to phosphoinositide 3-kinase inhibition. Am. J. Respir. Crit. Care Med. 2016, 194, 961–973. [Google Scholar] [CrossRef]
- Nathan, C.; Ding, A. Nonresolving inflammation. Cell 2010, 140, 871–882. [Google Scholar] [CrossRef] [PubMed]
- Minucci, S.B.; Heise, R.L.; Reynolds, A.M. Review of mathematical modeling of the inflammatory response in lung infections and injuries. Front. Appl. Math. Stat. 2020, 6, 36. [Google Scholar] [CrossRef]
- Lawrence, T.; Gilroy, D.W. Chronic inflammation: A failure of resolution? Int. J. Exp. Pathol. 2007, 88, 85–94. [Google Scholar] [CrossRef] [PubMed]
- Reusch, N.; de Domenico, E.; Bonaguro, L.; Schulte-Schrepping, J.; Baßler, K.; Schultze, J.L.; Aschenbrenner, A.C. Neutrophils in COVID-19. Front. Immunol. 2021, 12, 952. [Google Scholar] [CrossRef]
- Liu, J.; Li, S.; Liu, J.; Liang, B.; Wang, X.; Wang, H.; Li, W.; Tong, Q.; Yi, J.; Zhao, L.; et al. Longitudinal characteristics of lymphocyte responses and cytokine profiles in the peripheral blood of SARS-CoV-2 infected patients. eBioMedicine 2020, 55, 102763. [Google Scholar] [CrossRef]
- Wang, D.; Hu, B.; Hu, C.; Zhu, F.; Liu, X.; Zhang, J.; Wang, B.; Xiang, H.; Cheng, Z.; Xiong, Y.; et al. Clinical characteristics of 138 hospitalized patients with 2019 novel coronavirus–infected pneumonia in Wuhan, China. JAMA 2020, 323, 1061–1069. [Google Scholar] [CrossRef] [PubMed]
- Huang, W.; Li, M.; Luo, G.; Wu, X.; Su, B.; Zhao, L.; Zhang, S.; Chen, X.; Jia, M.; Zhu, J.; et al. The inflammatory factors associated with disease severity to predict COVID-19 progression. J. Immunol. 2021, 206, 1597–1608. [Google Scholar] [CrossRef] [PubMed]
- Guan, J.; Wei, X.; Qin, S.; Liu, X.; Jiang, Y.; Chen, Y.; Chen, Y.; Lu, H.; Qian, J.; Wang, Z.; et al. Continuous tracking of COVID-19 patients’ immune status. Int. Immunopharmacol. 2020, 89, 107034. [Google Scholar] [CrossRef] [PubMed]
- Zhang, H.; Wang, X.; Fu, Z.; Luo, M.; Zhang, Z.; Zhang, K.; He, Y.; Wan, D.; Zhang, L.; Wang, J.; et al. Potential factors for prediction of disease severity of COVID-19 patients. medRxiv 2020. [Google Scholar] [CrossRef]
- Kuppalli, K.; Rasmussen, A.L. A glimpse into the eye of the COVID-19 cytokine storm. eBioMedicine 2020, 55, 102789. [Google Scholar] [CrossRef]
- Vaughan, L.E.; Ranganathan, P.R.; Kumar, R.G.; Wagner, A.K.; Rubin, J.E. A mathematical model of neuroinflammation in severe clinical traumatic brain injury. J. Neuroinflamm. 2018, 15, 1–19. [Google Scholar] [CrossRef]
- Yang, Q.; Berthiaume, F.; Androulakis, I.P. A quantitative model of thermal injury-induced acute inflammation. Math. Biosci. 2011, 229, 135–148. [Google Scholar] [CrossRef]
- Minucci, S.; Heise, R.L.; Valentine, M.S.; Gninzeko, F.J.K.; Reynolds, A.M. Mathematical modeling of ventilator-induced lung inflammation. J. Theor. Biol. 2021, 526, 110738. [Google Scholar] [CrossRef]
- Kogan, Y.; Agur, Z.; Elishmereni, M. A mathematical model for the immunotherapeutic control of the Th1/Th2 imbalance in melanoma. Discret. Contin. Dyn. Syst. B 2013, 18, 1017–1030. [Google Scholar] [CrossRef]
- Andersen, M.; Sajid, Z.; Pedersen, R.K.; Gudmand-Hoeyer, J.; Ellervik, C.; Skov, V.; Kjær, L.; Pallisgaard, N.; Kruse, T.A.; Thomassen, M.; et al. Mathematical modelling as a proof of concept for MPNs as a human inflammation model for cancer development. PLoS ONE 2017, 12, e0183620. [Google Scholar] [CrossRef]
- Baker, M.; Denman-Johnson, S.; Brook, B.S.; Gaywood, I.; Owen, M.R. Mathematical modelling of cytokine-mediated inflammation in rheumatoid arthritis. Math. Med. Biol. J. IMA 2013, 30, 311–337. [Google Scholar] [CrossRef]
- Moise, N.; Friedman, A. Rheumatoid arthritis-a mathematical model. J. Theor. Biol. 2019, 461, 17–33. [Google Scholar] [CrossRef] [PubMed]
- El Khatib, N.; Génieys, S.; Kazmierczak, B.; Volpert, V. Mathematical modelling of atherosclerosis as an inflammatory disease. Philos. Trans. R. Soc. A Math. Phys. Eng. Sci. 2009, 367, 4877–4886. [Google Scholar] [CrossRef] [PubMed]
- Leber, A.; Abedi, V.; Hontecillas, R.; Viladomiu, M.; Hoops, S.; Ciupe, S.; Caughman, J.; Andrew, T.; Bassaganya-Riera, J. Bistability analyses of CD4+ T follicular helper and regulatory cells during Helicobacter pylori infection. J. Theor. Biol. 2016, 398, 74–84. [Google Scholar] [CrossRef] [PubMed]
- Nelson, P.; Smith, N.; Ciupe, S.; Zou, W.; Omenn, G.S.; Pietropaolo, M. Modeling dynamic fluctuations in type 1 diabetes progression: Quantifying β-cell variation after the appearance of islet-specific autoimmune responses. Math. Biosci. Eng. MBE 2009, 6, 753–778. [Google Scholar]
- Caudill, L.; Lynch, F. A mathematical model of the inflammatory response to pathogen challenge. Bull. Math. Biol. 2018, 80, 2242–2271. [Google Scholar] [CrossRef]
- Dunster, J.L.; Byrne, H.M.; King, J.R. The resolution of inflammation: A mathematical model of neutrophil and macrophage interactions. Bull. Math. Biol. 2014, 76, 1953–1980. [Google Scholar] [CrossRef]
- Ciupe, S.M.; Boribong, B.P.; Kadelka, S.; Jones, C.N. Bistable Mathematical Model of Neutrophil Migratory Patterns After LPS-Induced Epigenetic Reprogramming. Front. Genet. 2021, 12, 633963. [Google Scholar] [CrossRef]
- Reynolds, A.; Rubin, J.; Clermont, G.; Day, J.; Vodovotz, Y.; Ermentrout, G.B. A reduced mathematical model of the acute inflammatory response: I. Derivation of model and analysis of anti-inflammation. J. Theor. Biol. 2006, 242, 220–236. [Google Scholar] [CrossRef] [PubMed]
- Clermont, G.; Chow, C.C.; Constantine, G.M.; Vodovotz, Y.; Bartels, J. Mathematical and statistical modeling of acute inflammation. In Classification, Clustering, and Data Mining Applications; Springer: Cham, Switzerland, 2004; pp. 457–467. [Google Scholar]
- Mathew, S.; Bartels, J.; Banerjee, I.; Vodovotz, Y. Global sensitivity analysis of a mathematical model of acute inflammation identifies nonlinear dependence of cumulative tissue damage on host interleukin-6 responses. J. Theor. Biol. 2014, 358, 132–148. [Google Scholar] [CrossRef]
- Kadelka, S.; Boribong, B.P.; Li, L.; Ciupe, S.M. Modeling the bistable dynamics of the innate immune system. Bull. Math. Biol. 2019, 81, 256–276. [Google Scholar] [CrossRef]
- Beauchemin, C.A.; Handel, A. A review of mathematical models of influenza A infections within a host or cell culture: Lessons learned and challenges ahead. BMC Public Health 2011, 11, S7. [Google Scholar] [CrossRef]
- Doherty, P.C.; Turner, S.J.; Webby, R.G.; Thomas, P.G. Influenza and the challenge for immunology. Nat. Immunol. 2006, 7, 449–455. [Google Scholar] [CrossRef] [PubMed]
- Thomas, P.G.; Keating, R.; Hulse-Post, D.J.; Doherty, P.C. Cell-mediated protection in influenza infection. Emerg. Infect. Dis. 2006, 12, 48–54. [Google Scholar] [CrossRef]
- Maines, T.R.; Szretter, K.J.; Perrone, L.; Belser, J.A.; Bright, R.A.; Zeng, H.; Tumpey, T.M.; Katz, J.M. Pathogenesis of emerging avian influenza viruses in mammals and the host innate immune response. Immunol. Rev. 2008, 225, 68–84. [Google Scholar] [CrossRef]
- Miao, H.; Hollenbaugh, J.A.; Zand, M.S.; Holden-Wiltse, J.; Mosmann, T.R.; Perelson, A.S.; Wu, H.; Topham, D.J. Quantifying the early immune response and adaptive immune response kinetics in mice infected with influenza A virus. J. Virol. 2010, 84, 6687–6698. [Google Scholar] [CrossRef] [PubMed]
- Ciupe, S.M.; Ribeiro, R.M.; Perelson, A.S. Antibody responses during hepatitis B viral infection. PLoS Comput. Biol. 2014, 10, e1003730. [Google Scholar] [CrossRef] [PubMed]
- Ciupe, S.M.; Vaidya, N.K.; Forde, J.E. Early events in hepatitis B infection: The role of inoculum dose. Proc. R. Soc. B 2021, 288, 20202715. [Google Scholar] [CrossRef] [PubMed]
- Ciupe, S.M.; Hews, S. Mathematical models of e-antigen mediated immune tolerance and activation following prenatal HBV infection. PLoS ONE 2012, 7, e39591. [Google Scholar] [CrossRef] [PubMed]
- Ciupe, S.M.; Ribeiro, R.M.; Nelson, P.W.; Dusheiko, G.; Perelson, A.S. The role of cells refractory to productive infection in acute hepatitis B viral dynamics. Proc. Natl. Acad. Sci. USA 2007, 104, 5050–5055. [Google Scholar] [CrossRef]
- Gralinski, L.E.; Bankhead, A., III; Jeng, S.; Menachery, V.D.; Proll, S.; Belisle, S.E.; Matzke, M.; Webb-Robertson, B.J.M.; Luna, M.L.; Shukla, A.K.; et al. Mechanisms of severe acute respiratory syndrome coronavirus-induced acute lung injury. mBio 2013, 4, e00271-13. [Google Scholar] [CrossRef] [PubMed]
- Guillon, P.; Clément, M.; Sébille, V.; Rivain, J.G.; Chou, C.F.; Ruvoën-Clouet, N.; le Pendu, J. Inhibition of the interaction between the SARS-CoV spike protein and its cellular receptor by anti-histo-blood group antibodies. Glycobiology 2008, 18, 1085–1093. [Google Scholar] [CrossRef]
- Jenner, A.L.; Aogo, R.A.; Alfonso, S.; Crowe, V.; Smith, A.P.; Morel, P.A.; Davis, C.L.; Smith, A.M.; Craig, M. COVID-19 virtual patient cohort reveals immune mechanisms driving disease outcomes. PLoS Pathog. 2021, 17, e1009753. [Google Scholar] [CrossRef]
- Du, S.Q.; Yuan, W. Mathematical modeling of interaction between innate and adaptive immune responses in COVID-19 and implications for viral pathogenesis. J. Med. Virol. 2020, 92, 1615–1628. [Google Scholar] [CrossRef]
- Hernandez-Vargas, E.A.; Velasco-Hernandez, J.X. In-host mathematical modelling of COVID-19 in humans. Annu. Rev. Control. 2020, 50, 448–456. [Google Scholar] [CrossRef]
- Chimal-Eguia, J.C. Mathematical model of antiviral immune response against the COVID-19 virus. Mathematics 2021, 9, 1356. [Google Scholar] [CrossRef]
- Sahoo, S.; Jhunjhunwala, S.; Jolly, M.K. The good, the bad and the ugly: A mathematical model investigates the differing outcomes among COVID-19 patients. J. Indian Inst. Sci. 2020, 100, 673–681. [Google Scholar] [CrossRef]
- Ghosh, I. Within host dynamics of SARS-CoV-2 in humans: Modeling immune responses and antiviral treatments. SN Comput. Sci. 2021, 2, 1–12. [Google Scholar] [CrossRef] [PubMed]
- Heitzman-Breen, N.; Ciupe, S.M. Modeling within-host and aerosol dynamics of SARS-CoV-2: The relationship with infectiousness. PLoS Comput. Biol. 2022, 18, e1009997. [Google Scholar] [CrossRef]
- Ke, R.; Zitzmann, C.; Ho, D.D.; Ribeiro, R.M.; Perelson, A.S. In vivo kinetics of SARS-CoV-2 infection and its relationship with a person’s infectiousness. Proc. Natl. Acad. Sci. USA 2021, 118, e2111477118. [Google Scholar] [CrossRef] [PubMed]
- Ciupe, S.M.; Tuncer, N. Identifiability of parameters in mathematical models of SARS-CoV-2 infections in humans. Sci. Rep. 2022, 12, 14637. [Google Scholar] [CrossRef] [PubMed]
- Wang, X.; Wang, S.; Wang, J.; Rong, L. A Multiscale Model of COVID-19 Dynamics. Bull. Math. Biol. 2022, 84, 99. [Google Scholar] [CrossRef] [PubMed]
- Schwarze, J.; Mackenzie, K.J. Novel insights into immune and inflammatory responses to respiratory viruses. Thorax 2013, 68, 108–110. [Google Scholar] [CrossRef] [PubMed]
- Sugimoto, M.A.; Sousa, L.P.; Pinho, V.; Perretti, M.; Teixeira, M.M. Resolution of inflammation: What controls its onset? Front. Immunol. 2016, 7, 160. [Google Scholar] [CrossRef] [PubMed]
- Eming, S.A.; Martin, P.; Tomic-Canic, M. Wound repair and regeneration: Mechanisms, signaling, and translation. Sci. Transl. Med. 2014, 6, 265sr6. [Google Scholar] [CrossRef]
- Serhan, C.N.; Savill, J. Resolution of inflammation: The beginning programs the end. Nat. Immunol. 2005, 6, 1191–1197. [Google Scholar] [CrossRef]
- Liu, Y.; Yang, Y.; Zhang, C.; Huang, F.; Wang, F.; Yuan, J.; Wang, Z.; Li, J.; Li, J.; Feng, C.; et al. Clinical and biochemical indexes from 2019-nCoV infected patients linked to viral loads and lung injury. Sci. China Life Sci. 2020, 63, 364–374. [Google Scholar] [CrossRef]
- Henson, P.M. Dampening inflammation. Nat. Immunol. 2005, 6, 1179–1181. [Google Scholar] [CrossRef] [PubMed]
- Godleski, J.J.; Brain, J.D. The origin of alveolar macrophages in mouse radiation chimeras. J. Exp. Med. 1972, 136, 630–643. [Google Scholar] [CrossRef] [PubMed]
- McDonagh, M.; Bell, E. The survival and turnover of mature and immature CD8 T cells. Immunology 1995, 84, 514–520. [Google Scholar]
- Ahmed, R.; Gray, D. Immunological memory and protective immunity: Understanding their relation. Science 1996, 272, 54–60. [Google Scholar] [CrossRef]
- Ciupe, S.M.; Ribeiro, R.M.; Nelson, P.W.; Perelson, A.S. Modeling the mechanisms of acute hepatitis B virus infection. J. Theor. Biol. 2007, 247, 23–35. [Google Scholar] [CrossRef] [PubMed]
- Fedorak, R.N.; Gangl, A.; Elson, C.O.; Rutgeerts, P.; Schreiber, S.; Wild, G.; Hanauer, S.B.; Kilian, A.; Cohard, M.; LeBeaut, A.; et al. Recombinant human interleukin 10 in the treatment of patients with mild to moderately active Crohn’s disease. Gastroenterology 2000, 119, 1473–1482. [Google Scholar] [CrossRef]
- Aziz, N.; Detels, R.; Quint, J.J.; Li, Q.; Gjertson, D.; Butch, A.W. Stability of cytokines, chemokines and soluble activation markers in unprocessed blood stored under different conditions. Cytokine 2016, 84, 17–24. [Google Scholar] [CrossRef]
- Kuribayashi, T. Elimination half-lives of interleukin-6 and cytokine-induced neutrophil chemoattractant-1 synthesized in response to inflammatory stimulation in rats. Lab. Anim. Res. 2018, 34, 80–83. [Google Scholar] [CrossRef]
- Huhn, R.D.; Radwanski, E.; Gallo, J.; Affrime, M.B.; Sabo, R.; Gonyo, G.; Monge, A.; Cutler, D.L. Pharmacodynamics of subcutaneous recombinant human interleukin-10 in healthy volunteers. Clin. Pharmacol. Ther. 1997, 62, 171–180. [Google Scholar] [CrossRef]
- Sette, A.; Crotty, S. Adaptive immunity to SARS-CoV-2 and COVID-19. Cell 2021, 184, 861–880. [Google Scholar] [CrossRef] [PubMed]
- Del Valle, D.M.; Kim-Schulze, S.; Huang, H.H.; Beckmann, N.D.; Nirenberg, S.; Wang, B.; Lavin, Y.; Swartz, T.H.; Madduri, D.; Stock, A.; et al. An inflammatory cytokine signature predicts COVID-19 severity and survival. Nat. Med. 2020, 26, 1636–1643. [Google Scholar] [CrossRef] [PubMed]
- Radermecker, C.; Detrembleur, N.; Guiot, J.; Cavalier, E.; Henket, M.; d’Emal, C.; Vanwinge, C.; Cataldo, D.; Oury, C.; Delvenne, P.; et al. Neutrophil extracellular traps infiltrate the lung airway, interstitial, and vascular compartments in severe COVID-19. J. Exp. Med. 2020, 217, e20201012. [Google Scholar] [CrossRef] [PubMed]
- McKenna, E.; Wubben, R.; Isaza-Correa, J.M.; Melo, A.M.; Mhaonaigh, A.U.; Conlon, N.; O’Donnell, J.S.; Ní Cheallaigh, C.; Hurley, T.; Stevenson, N.J.; et al. Neutrophils in COVID-19: Not Innocent Bystanders. Front. Immunol. 2022, 13, 2548. [Google Scholar] [CrossRef]
- Bigdelou, B.; Sepand, M.R.; Najafikhoshnoo, S.; Negrete, J.A.T.; Sharaf, M.; Ho, J.Q.; Sullivan, I.; Chauhan, P.; Etter, M.; Shekarian, T.; et al. COVID-19 and Preexisting Comorbidities: Risks, Synergies, and Clinical Outcomes. Front. Immunol. 2022, 13, 2077. [Google Scholar] [CrossRef] [PubMed]
- Rennard, S.I.; Dale, D.C.; Donohue, J.F.; Kanniess, F.; Magnussen, H.; Sutherland, E.R.; Watz, H.; Lu, S.; Stryszak, P.; Rosenberg, E.; et al. CXCR2 antagonist MK-7123. A phase 2 proof-of-concept trial for chronic obstructive pulmonary disease. Am. J. Respir. Crit. Care Med. 2015, 191, 1001–1011. [Google Scholar] [CrossRef] [PubMed]
- Stockley, R.; de Soyza, A.; Gunawardena, K.; Perrett, J.; Forsman-Semb, K.; Entwistle, N.; Snell, N. Phase II study of a neutrophil elastase inhibitor (AZD9668) in patients with bronchiectasis. Respir. Med. 2013, 107, 524–533. [Google Scholar] [CrossRef]
- Antoniv, T.T.; Ivashkiv, L.B. Dysregulation of interleukin-10–dependent gene expression in rheumatoid arthritis synovial macrophages. Arthritis Rheum. 2006, 54, 2711–2721. [Google Scholar] [CrossRef]
- Ji, J.D.; Tassiulas, I.; Park-Min, K.H.; Aydin, A.; Mecklenbrauker, I.; Tarakhovsky, A.; Pricop, L.; Salmon, J.E.; Ivashkiv, L.B. Inhibition of interleukin 10 signaling after Fc receptor ligation and during rheumatoid arthritis. J. Exp. Med. 2003, 197, 1573–1583. [Google Scholar] [CrossRef]
- Xue, T.C.; Zhang, L.; Xie, X.Y.; Ge, N.L.; Li, L.X.; Zhang, B.H.; Ye, S.L.; Ren, Z.G. Prognostic significance of the neutrophil-to-lymphocyte ratio in primary liver cancer: A meta-analysis. PLoS ONE 2014, 9, e96072. [Google Scholar] [CrossRef]
- Carus, A.; Ladekarl, M.; Hager, H.; Nedergaard, B.; Donskov, F. Tumour-associated CD66b+ neutrophil count is an independent prognostic factor for recurrence in localised cervical cancer. Br. J. Cancer 2013, 108, 2116–2122. [Google Scholar] [CrossRef]
- Hufford, M.M.; Richardson, G.; Zhou, H.; Manicassamy, B.; García-Sastre, A.; Enelow, R.I.; Braciale, T.J. Influenza-infected neutrophils within the infected lungs act as antigen presenting cells for anti-viral CD8+ T cells. PLoS ONE 2012, 7, e46581. [Google Scholar] [CrossRef]
- Murphy, J.; Summer, R.; Wilson, A.A.; Kotton, D.N.; Fine, A. The prolonged life-span of alveolar macrophages. Am. J. Respir. Cell Mol. Biol. 2008, 38, 380–385. [Google Scholar] [CrossRef] [PubMed]
- Ufimtseva, E.; Eremeeva, N.; Petrunina, E.; Umpeleva, T.; Karskanova, S.; Bayborodin, S.; Vakhrusheva, D.; Kravchenko, M.; Skornyakov, S. Ex vivo expansion of alveolar macrophages with Mycobacterium tuberculosis from the resected lungs of patients with pulmonary tuberculosis. PLoS ONE 2018, 13, e0191918. [Google Scholar] [CrossRef] [PubMed]
Disclaimer/Publisher’s Note: The statements, opinions and data contained in all publications are solely those of the individual author(s) and contributor(s) and not of MDPI and/or the editor(s). MDPI and/or the editor(s) disclaim responsibility for any injury to people or property resulting from any ideas, methods, instructions or products referred to in the content. |
© 2023 by the authors. Licensee MDPI, Basel, Switzerland. This article is an open access article distributed under the terms and conditions of the Creative Commons Attribution (CC BY) license (https://creativecommons.org/licenses/by/4.0/).
