Article

Analysis of the Seismic Performance of a Masonry Structure with RC Frames on the First Story with Concrete-Filled Steel Tubular Dampers

1
Key Laboratory of Education Ministry for Construction and New Technology of Mountain Cities, Chongqing University, Chongqing 400045, China
2
College of Civil Engineering, Chongqing University, Chongqing 400045, China
*
Author to whom correspondence should be addressed.
Appl. Sci. 2023, 13(4), 2408; https://doi.org/10.3390/app13042408
Submission received: 26 January 2023 / Revised: 8 February 2023 / Accepted: 11 February 2023 / Published: 13 February 2023
(This article belongs to the Section Civil Engineering)

Abstract

:
The concrete shear walls of masonry structures with RC frames on the first story are low-rise shear walls with a height–width ratio of less than 1. The strength, stiffness, and ductility of these low-rise shear walls are not matched, resulting in poor seismic performance. Based on the idea of the passive control theory and multi-seismic defensive lines, the scheme of a masonry structure with RC frames on the first story with a concrete-filled steel tubular (CFST) dampers is proposed in this paper. To explore the seismic mitigation effect of CFST dampers applied to a masonry structure with RC frames on the first story, the seismic performance under low-reversed cyclic loading of the frame with the CFST dampers is first compared with that of the energy-dissipated low-rise concrete shear wall proposed by previous researchers and the ordinary low-rise concrete shear wall. Furthermore, the response of the masonry structure model with RC frames on the first story with CFST dampers and two other comparative structural models under earthquake action are discussed. The results show that a masonry structure with RC frames on the first story with CFST dampers has a fuller hysteretic loop, lighter pinching, better energy dissipation ability, and better seismic performance. Compared with the other two structures, the energy dissipation capacity of the masonry structure with RC frames on the first story with CFST dampers is significantly improved, by 1.25~1.5 times. The amplification effect of the deformation angle allows the CFST dampers to play a significant role in energy dissipation, whereas the main structure still undergoes a small deformation. The CFST dampers can dissipate more seismic energy to protect the main structure from damage and improve the seismic performance of masonry structures with RC frames on the first story.

1. Introduction

Low-rise concrete shear walls generally refer to shear walls with a height–width ratio of less than 1, and are often used for masonry structures with RC frames on the first story. Research has shown [1,2] that low-rise concrete shear walls suffer mainly from brittle shear failures, and have poor ductility and energy dissipation capacity. For masonry structures with RC frames on the first story, the upper masonry structure is used as a residence, office room, or hotel room, and the lower part is used as commercial housing. Such structures have superior utility and exist in many existing buildings. However, in the Wenchuan and Hanshin earthquakes, buildings having a masonry structure with RC frames on the first story were severely damaged [3,4]. Fundamentally, the main reason for the severe damage of such buildings in earthquakes is the insufficient design of the ductility and energy dissipation capacity of the first story of the structure [5]. Because the research on the seismic performance of large space structures on the first story is lacking, promotion of the seismic performance in earthquake areas is limited. At present, seismic design codes in China, Japan, and other earthquake-prone countries have enforced strict restrictions on the use of these structures [6]. However, through investigation and research, it was found that this kind of structure, when reasonable designs and measures are used, has a considerable degree of seismic resistance in the event of a major earthquake [7]. At present, it would be relatively ineffective to impose tighter restrictions. It would be a wise development approach to identify a seismic system that has less impact on the structure’s utility and can greatly improve its seismic capacity [8].
In in-depth studies of the seismic performance of structural systems, structural components and systems are required to have energy-absorbing and energy-dissipating mechanisms, and multi-seismic defensive lines are required [9]. Under the action of horizontal seismic load, the structural members enter a nonlinear state in the later stage, and the seismic performance of the members is not only related to their strength, but also their deformation performance. The seismic capacity of the structure cannot be measured only by the load-carrying capacity, but the ability of structural members to dissipate seismic energy should be comprehensively considered and the variation in the different types of energy components accurately analyzed [10]. This basic concept has been confirmed by a large number of earthquake damage examples and results obtained by many researchers [11,12].
To improve the seismic performance of the concrete low-rise concrete shear wall, many scholars have proposed improvement schemes. Tang et al. [13] proposed a steel fiber high-strength concrete shear wall with vertical slots. This kind of shear wall is made of steel fibers and high-strength concrete, and vertical slots are arranged in the wall panels. In addition, the steel bars are not cut off in the slots. The seismic performance of this steel fiber high-strength concrete shear wall with vertical slots is better than that of ordinary concrete shear walls. Due to the high strength of steel fiber high-strength concrete, the section size is reduced, but the stiffness and load-carrying capacity certainly decline. Dai et al. [14] designed a low-rise concrete shear wall with horizontal short slits. The design of this new type of ductile low-rise concrete shear wall is the same as that of the reinforcement of an ordinary concrete shear wall; the difference is that stepped horizontal semi-through slits are arranged along the diagonal direction of the wall. When the horizontal slits are arranged reasonably, the load-carrying capacity of the low-rise concrete shear wall with short horizontal slits is about 90% of that of the ordinary concrete shear wall, but its energy dissipation effect is not significantly improved. Pan et al. [15] proposed adding a certain number of stiffening steel damping devices in the middle of the vertical slits of the wall. The plastic deformation of the shear wall limbs at both ends of the coupling beam under earthquake action is used to dissipate the seismic energy. During an earthquake, the damping devices in the slits are destroyed before the main structure to protect it. Li et al. [16] proposed a new type of ductile low-rise concrete shear wall with friction-damp control devices. The method consists of the opening of a certain number of vertical through seams along the entire height in the wall panel so that the whole section of the wall becomes several wall panel columns, and the wall panels on both sides of the vertical seam are effectively connected by the friction control device arranged at the through seams. The two-layer splint in the friction-damp control device will produce relative dislocation under the action of an earthquake to dissipate the seismic energy, but due to the small vertical deformation of the low-rise concrete shear wall, the energy dissipated through friction is also limited. Li et al. [17] proposed an energy-dissipated low-rise concrete shear wall having tubes filled with concrete. The ordinary reinforced concrete shear wall is cut horizontally at half of the wall height and then connected by concrete-filled steel tubular short columns. Due to the excellent energy dissipation effect of CFST, the high ductility effect of concrete-filled steel tube ductile columns is fully exerted during the earthquake, and the seismic energy is offset by its plastic deformation to reduce the seismic response of the structure. Yan et al. [18] proposed a frame structure with an RC damper. Through experimental research and theoretical analysis, it was shown that the new system increases the energy dissipation effect and improves the integrity of the structure.
The energy dissipation capacity of ordinary RC energy dissipators in earthquakes is still poor. Considering CFST columns usually have good ductility and energy dissipation capacity, and that the first story of a masonry structure with RC frames shear walls lacks ductility and energy dissipation capacity, this paper proposes placing CFST dampers at appropriate positions on the first story of a masonry structure with RC frames on the first story, instead of ordinary concrete shear walls. This can increase the energy dissipation effect of the structure and easily adjust the stiffness of the first story of the masonry structure with RC frames, so that it is more reasonable. Firstly, the seismic performance under low-reversed cyclic loading of the frame with CFST dampers was compared with that of the energy-dissipated low-rise concrete shear wall with CFST short columns proposed by previous researchers and the ordinary low-rise concrete shear wall. The failure process and mode, hysteretic loops, skeleton curve, stiffness degradation, displacement ductility factor, equivalent viscous damping coefficient, and energy dissipation capacity of the three components are discussed. Furthermore, a masonry structure model with RC frames on the first story with CFST dampers and two other comparative structural models are designed. The seismic response of the three structures under earthquake action is discussed, and the acceleration response, interlayer displacement, maximum layer displacement, base shear, and energy dissipation distribution of the three structures are compared and analyzed.

2. The Working Principle of CFST Ductile Column Energy Dissipation Device (CFST Dampers)

The CFST dampers is composed of multiple (4 to 6) CFST ductile columns in parallel with a height of about 1/2 to 1/4 of the story height and rigid supports on both sides, as shown in Figure 1. It is placed between the frame structure foundation and the beam or beam-to-beam in the form of columns or short-limb wall, and the connection method can be cast-in-place or prefabricated assembly. According to the assumption that the in-plane stiffness of the floor is infinite, when the inter-story displacement of the main structure is Δ, then the displacement angle of the CFST ductile column is θ 1 = / h , and the inter-story displacement angle of the frame column is θ = / H ; then, θ 1 / θ = H / h . If the height of the CFST ductile column is 1/2~1/4 of the story height, the inter-story displacement angle of the CFST ductile column is amplified by 2~4 times, as shown in Figure 1. The amplification effect of the deformation angle allows the CFST dampers to play a significant role in energy dissipation, whereas the main structure still undergoes a small deformation. The damper can dissipate more seismic energy to protect the structure from damage and improve the seismic performance of the building.
Compared with the ordinary energy dissipators installed on the diagonal braces [16], the energy dissipators of concrete-filled steel tubular ductile columns avoid serious local stress problems at the connection between the structure and the diagonal braces, and overcome many shortcomings, e.g., the ordinary energy dissipators have different material from the main body of the structure, and are high in price, have a highly professional design, and need regular maintenance.

2.1. Lateral Stiffness of CFST Dampers

2.1.1. Yield Stage of CFST Ductile Columns

Analysis of the stress mechanism of the frame structure with CFST dampers shows that the supports and the energy-dissipating columns are first connected in series, and then connected in parallel with the frame columns at both ends, so the overall initial stiffness is described by Formula (1)
K 1 = K s c z 1 + 2 K c 1
where K c 1 is the initial stiffness of a single column of frame column, which refers to reference [19]; K s c z 1 is the initial stiffness of n CFST ductile columns when it is connected in series with the supports at both ends.
K s c z 1 = K z 1 × n K s c 1 K z 1 + 2 n K s c 1
where K z 1 is the initial stiffness of the support; K s c 1 is the initial stiffness of a single CFST ductile column.
The details of Formulas (3) and (4) are specified in reference [20].
K z 1 = 1 1.2 h 1 G z A z + h 1 3 3 E z I z
K s c 1 = 12 E s c I s c h 3
where h 1 is the height of the support; h is the height of the CFST ductile column; E z is the elastic modulus of the support; G z is the shear elastic modulus of the support; E s c is the elastic modulus of the CFST ductile column; I s c is the inertia moment of the CFST ductile column; A z is the cross-sectional area of the support; I z is the inertia moment of the support.
According to the relationship between force, displacement, and stiffness, the value of the yield strength can be obtained by Formula (5).
F 1 y = K 1 1 y = K 1 n V s c y m K s c 1
where 1 y is the overall lateral displacement of the frame when a single CFST ductile column yields; V s c y is the yielding shear of a single CFST ductile column; n is the number of CFST ductile columns; m is the height ratio of the CFST ductile column to the frame; and m = h / H ; H is the height of the frame.
From reference [18], V s c y can be calculated according to Formula (6).
V s c y = 1.15 M y h 2 + 2.6 50 a b N k a
where k a is the elastic half-column stiffness of the CFST ductile column; a b is the stiffness reduction coefficient of the CFST ductile column after entering the strengthened stage; M y is the bending moment corresponding to the yielding of the CFST ductile column; N is the axial force borne by a single CFST ductile column.

2.1.2. Yield Stage of Frame Columns at Both Ends

As shown in Section 2.1.1, when the energy-dissipating columns of the frame structure with CFST dampers yield, the overall stiffness of the structure can be calculated by Formula (7).
K 2 = K s c z 2 + 2 K c 1
where K s c z 2 is the post-yield stiffness of n CFST ductile columns when they are connected in series with the supports at both ends, as shown in Formula (8).
K s c z 2 = K z 1 × n K s c 2 K z 1 + 2 n K s c 2
K s c 2 = a b K s c 1
F 2 y = F 1 y + K 2 2 y 1 y
where 2 y is the overall lateral displacement corresponding to the frame when the frame columns at both ends yield.
2 y = V c y K c 1
where V c y is the shear of a single column corresponding to the yielding of the frame columns at both ends.

2.1.3. Yield Stage of Rigid Support at Both Ends of Energy-Dissipating Columns

As shown in Section 2.1.2, when the frame columns at both ends yield, the overall stiffness of the structure can be calculated by Formula (12).
K 3 = K s c z 2 + 2 K c 2
where K c 2 is the post-yield stiffness of a single column of frame column, which refers to reference [17].
F 3 y = F 2 y + K 3 3 y 2 y
where 3 y is the overall displacement of the frame corresponding to the yielding of the supports at both ends of the energy-dissipating columns, which can be calculated by Formula (14).
3 y = n V s c y K s c 1 + V z n V s c y K s c 2
where V z is the shear corresponding to the support at both ends of the energy-dissipating columns when yielding, which refers to reference [17].
From the working principle of the CFST dampers mentioned above, it can be seen that the relevant parameters of the CFST column, such as height h , outer diameter D , wall thickness t of the steel pipe, slenderness ratio λ , and the number of CFST columns m , are the main design parameters of the CFST dampers. In order to effectively maximize the advantages of the CFST damper, it is necessary to ensure that it has certain initial stiffness, and the yielding of the CFST column must occur before the yielding of the reinforced concrete column. By adjusting the relevant parameters of the CFST column in the CFST dampers, such as height h , outer diameter D , wall thickness t of the steel pipe, slenderness ratio λ , and the number of CFST columns m , the stiffness of the first story of the masonry structure with RC frames can be easily adjusted to make it more reasonable.

3. Seismic Performance of the Frame with CFST Dampers

Numerical analysis of the seismic performance of the frame with CFST dampers (GJ-1) is compared with that of the energy-dissipated low-rise concrete shear wall with CFST short columns (GJ-2) and the ordinary low-rise concrete shear wall (GJ-3).

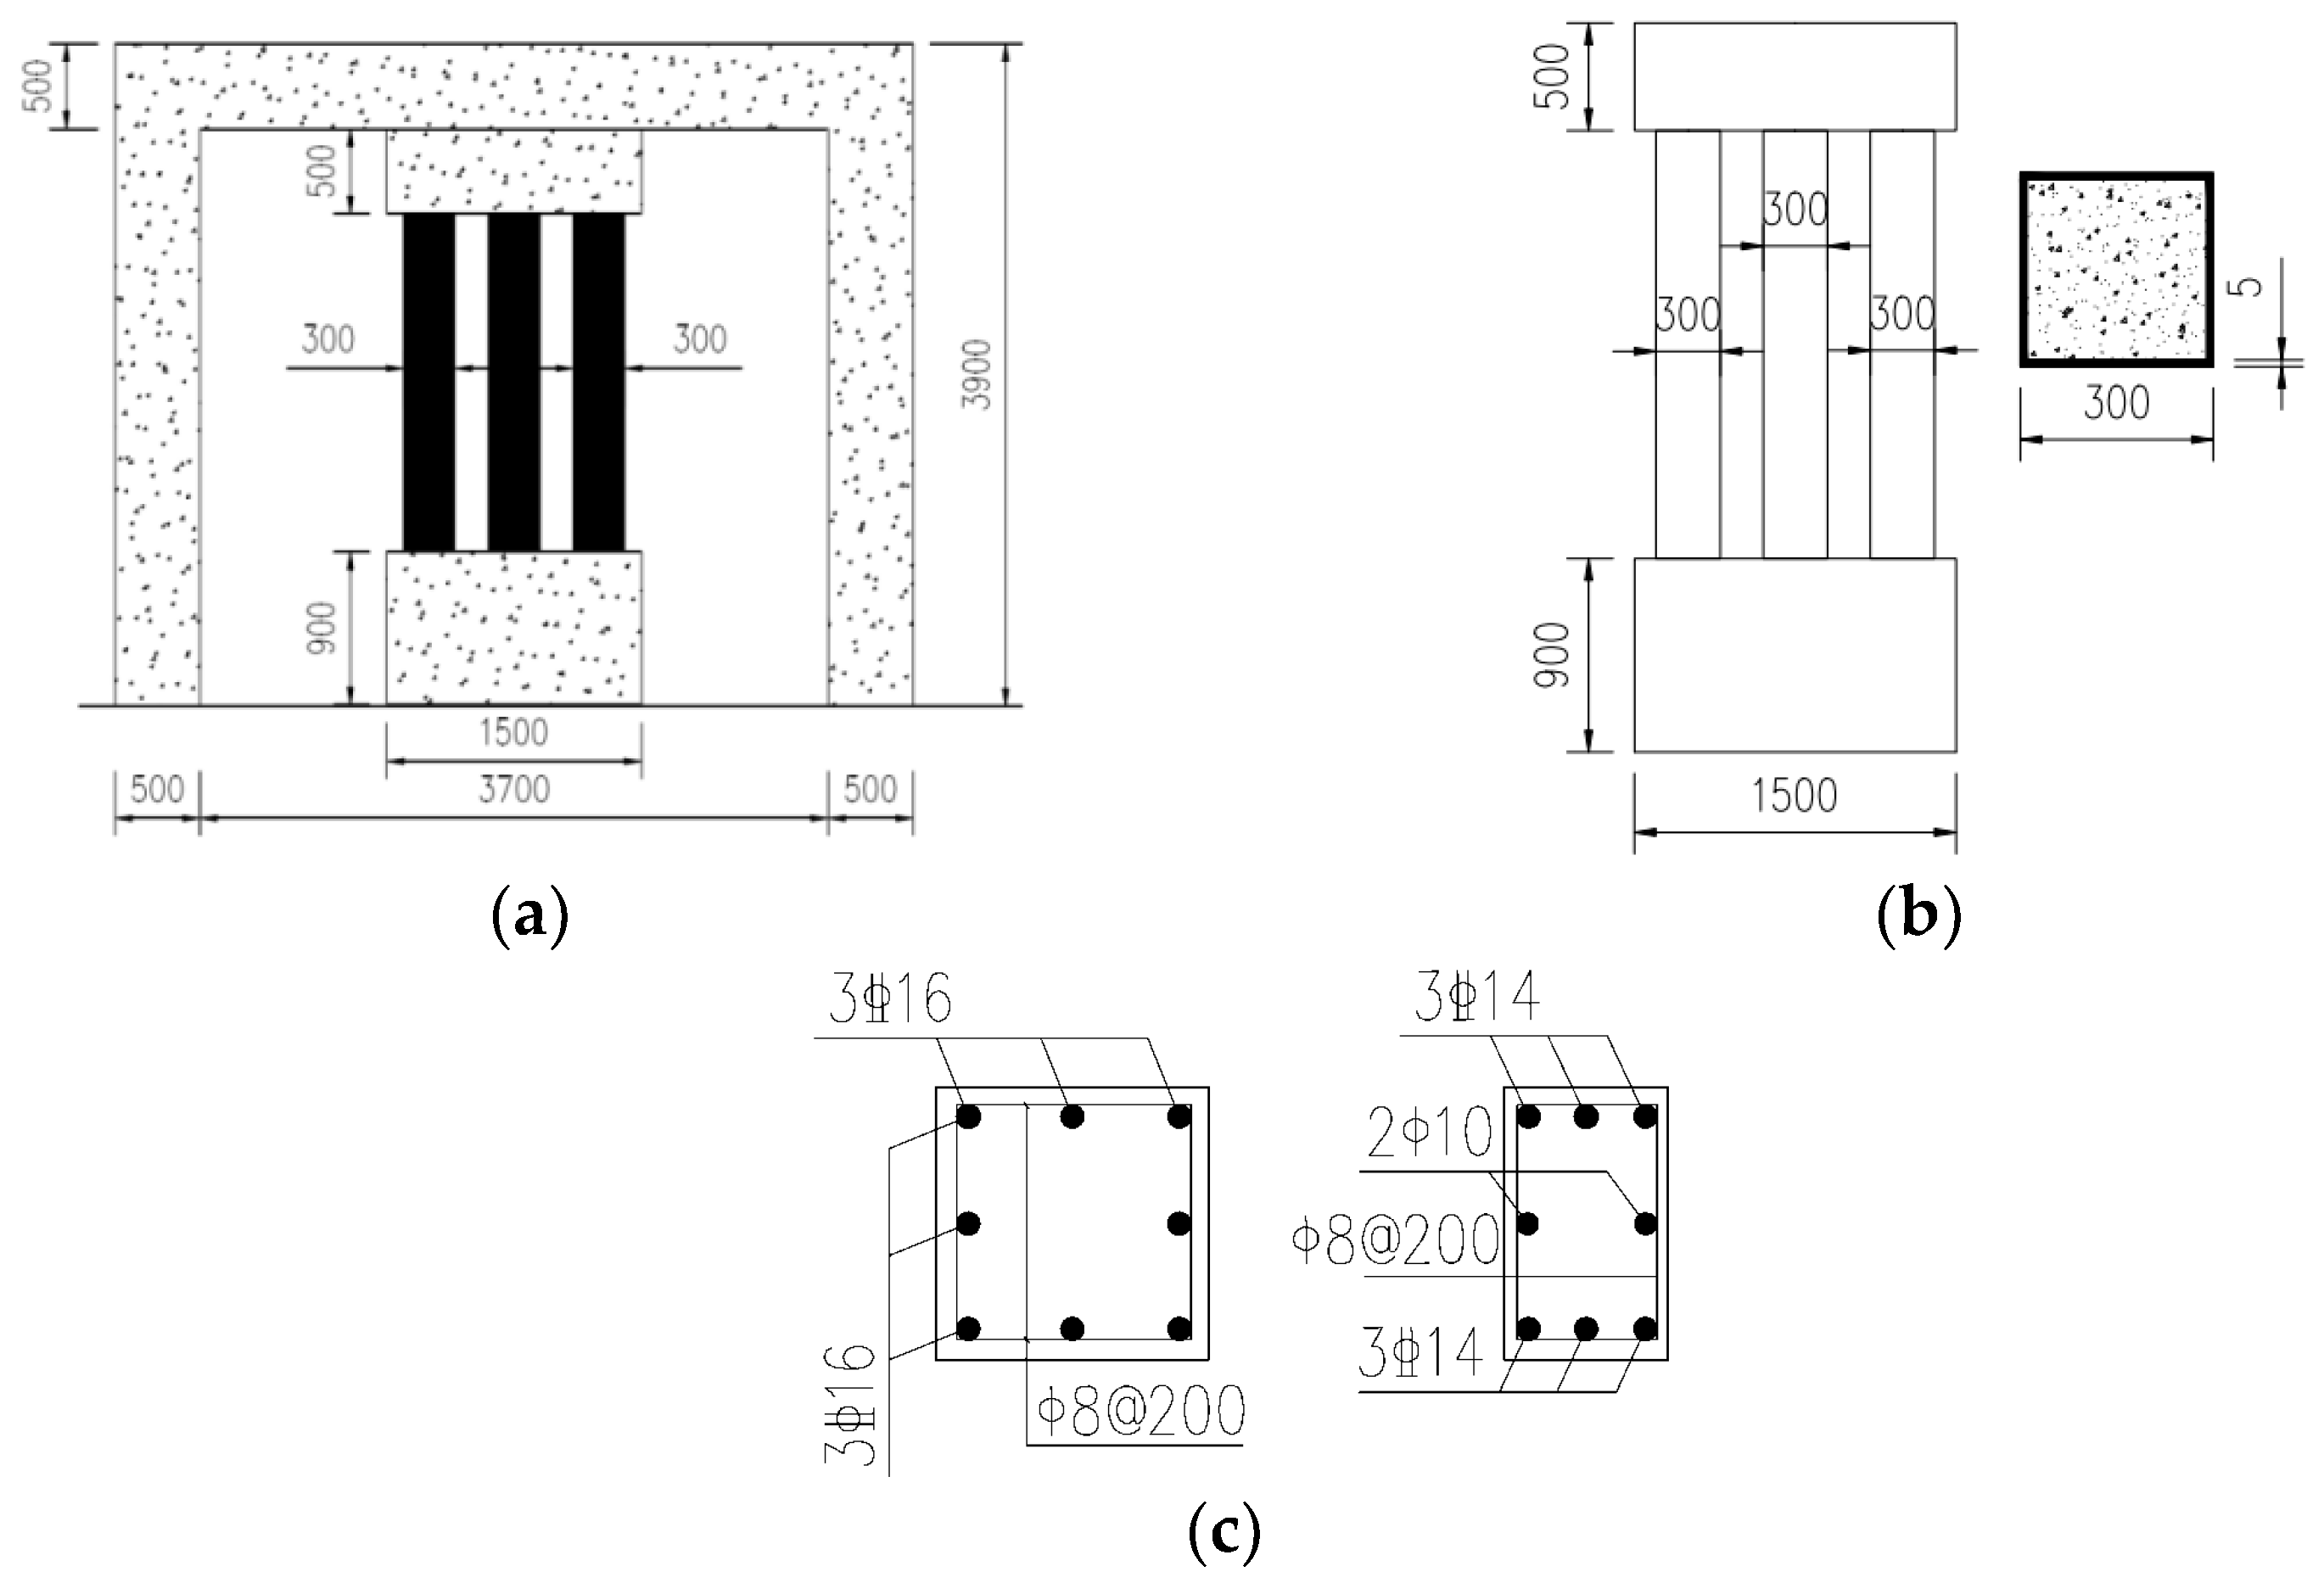
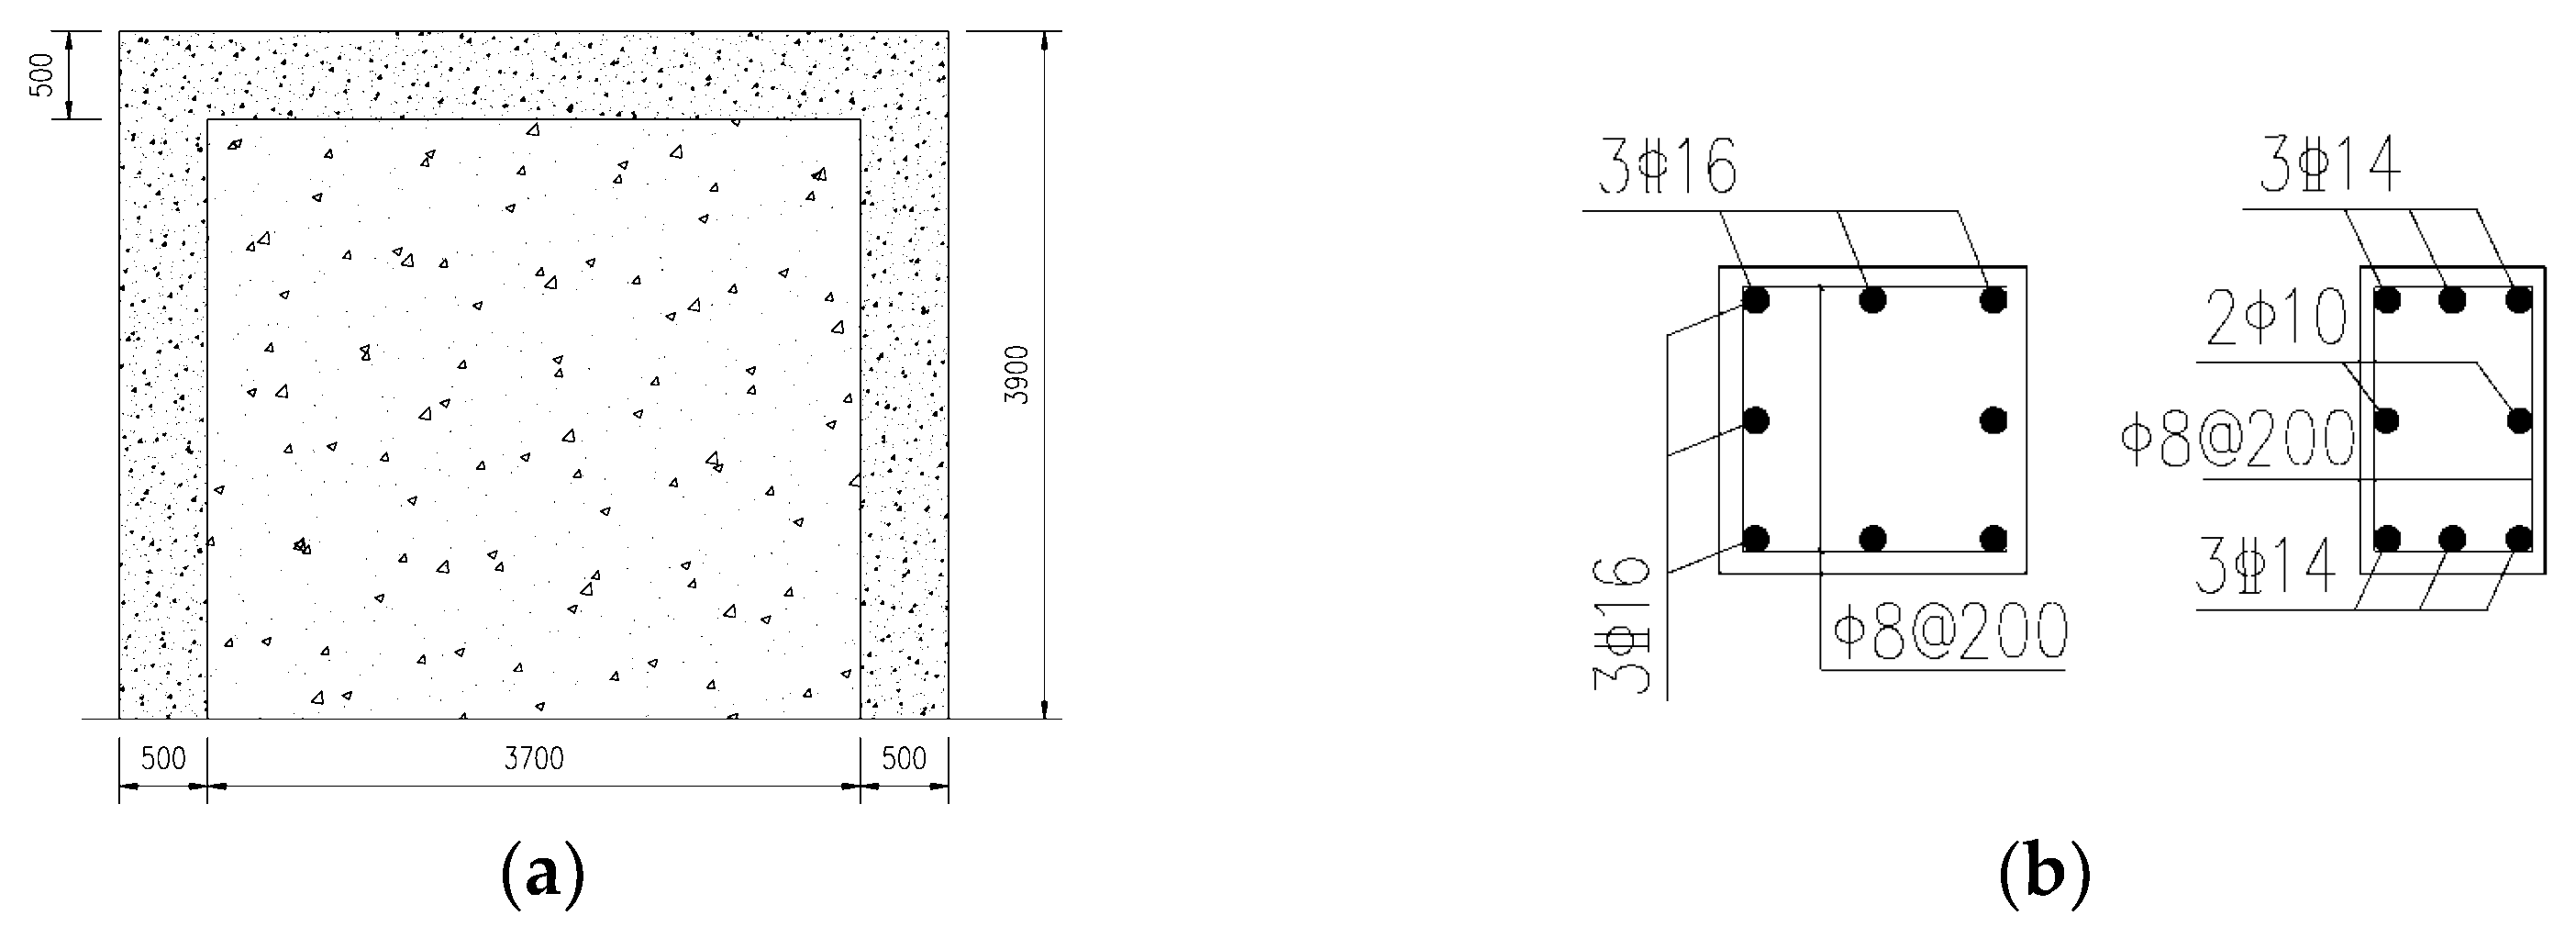
3.1. Design of Three Component Models GJ-1, GJ-2 and GJ-3

The structural design of the model is carried out according to the Code for Seismic Design of Buildings (GB50011-2010).
The column height of the CFST dampers is 2000 mm, and the length of the stirrup densified area at the beam end and column end of the frame is 500 mm. The spacing of stirrups in the densified area is 100 mm, which is half of the spacing of stirrups in the non-densified area. The reinforcement at the column is 8 Φ 16 through and 6 Φ 14 reinforcement is adopted for the beam. The relevant dimensions of model components GJ-1, GJ-2, and GJ-3 are shown in Figure 2, Figure 3 and Figure 4, respectively. The concrete grade is C35, and the reinforcement grade is HRB400.
The related design of GJ-1 is illustrated in Figure 2.
The relevant design of GJ-2 [12] is shown in Figure 3.
The relevant design of GJ-3 is illustrated in Figure 4.

3.2. Failure Processes and Failure Modes of Three Components GJ-1, GJ-2 and GJ-3

3.2.1. Establishment of Finite Element Model

In this study, the ABAQUS finite element analysis software was adopted using the low-cycle reversed loading system, and the calculation time and accuracy were considered. The three-dimensional solid linear reduced integral element C3D8R was used for the concrete and steel plate, the space two-node linear truss element T3D2 was used for reinforcement, and the fully integrated quadrilateral shell element S4 was used for sleeve. The reinforcement was simulated by the truss element, and embedded into the concrete solid element by an embedded command, without considering the slip between the reinforcement and concrete. The damaged plastic model was used to simulate the constituents of concrete materials. The uniaxial stress–strain relationship specified in C.2 of Appendix C of “Code for Design of Concrete Structures” (GB50010-2010) was adopted for concrete.
No specific damage definition formula is given in ABAQUS software. In this paper, uniaxial damage evolution equation derived from the stress–strain curve recommended by the Code was adopted, and the damage factor input into ABAQUS was obtained based on the principle of Sidiroff energy equivalence.
The stress–strain curve of the reinforcement adopted a trilinear model, considering the properties of the elastic stage, the yield stage, and the strengthened stage.

3.2.2. Loading Method

The method of force–displacement hybrid control loading was adopted in this paper, as shown in Figure 5. Before the yield of the model, the force control and load in stages were used, in which each level of horizontal force reciprocates once; after the yield of the model, the horizontal displacement was used to control the loading, and the displacement of each stage reciprocates twice. The model was considered damaged when the horizontal bearing capacity dropped below 85% of the maximum value.

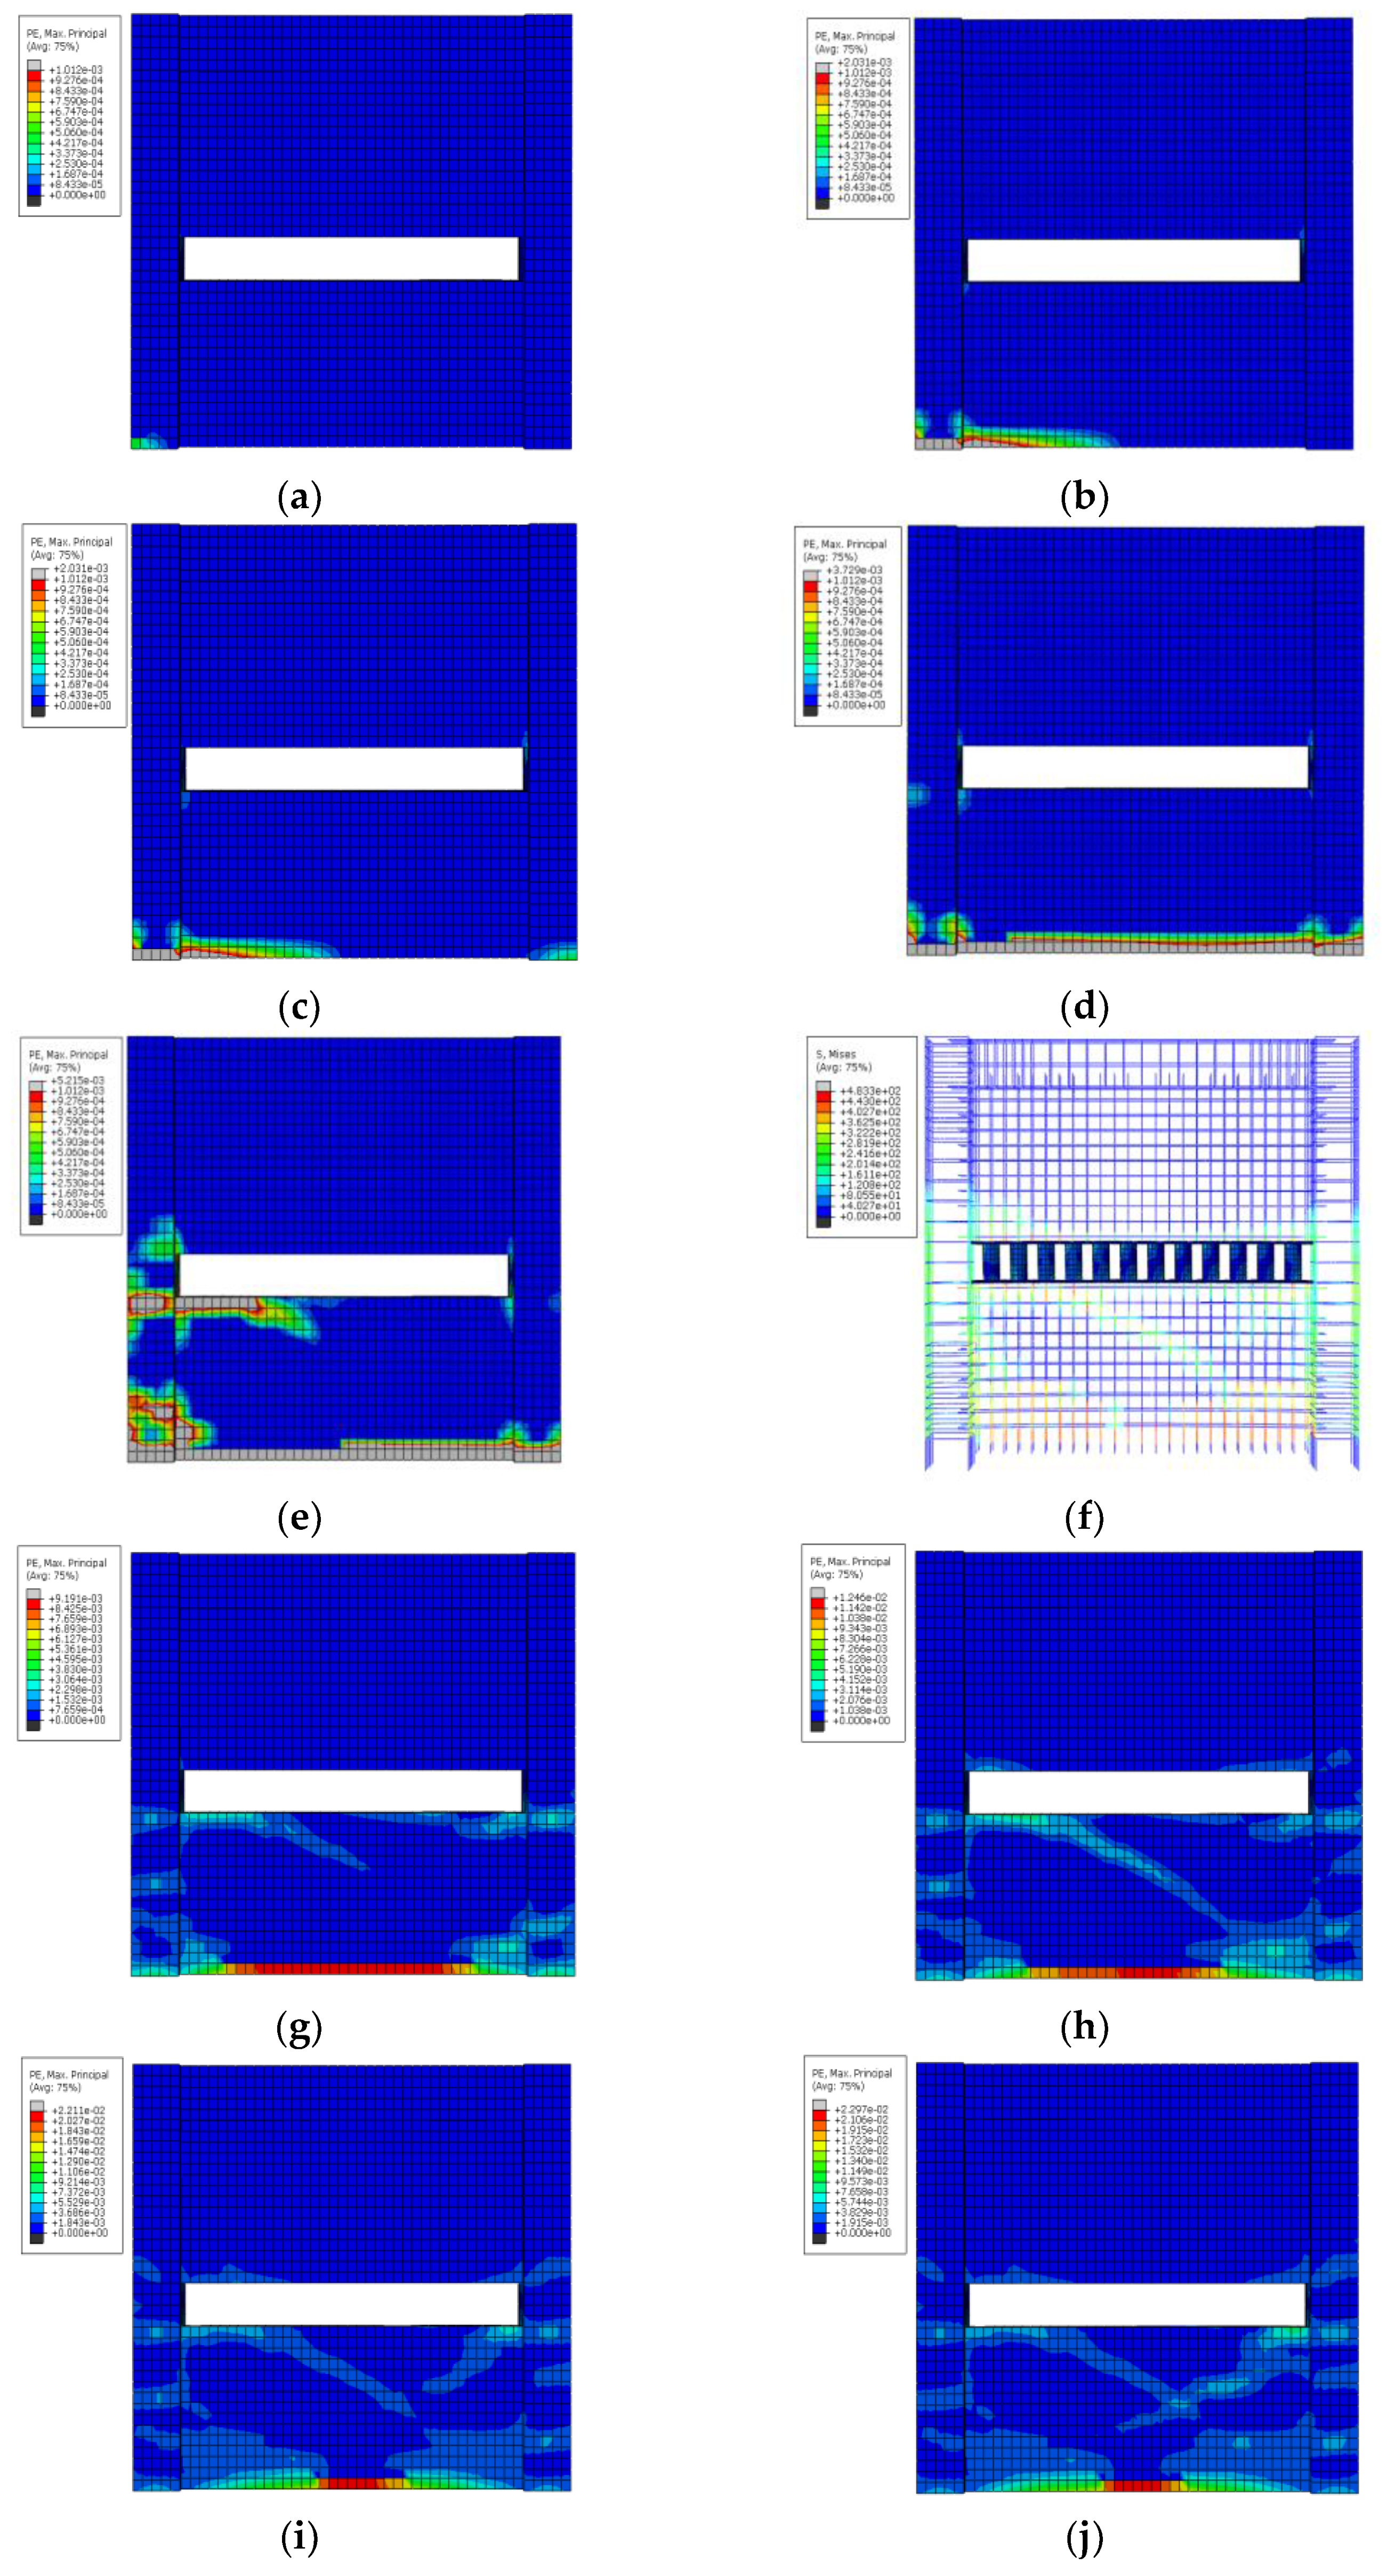
3.2.3. Simulation Analysis of GJ-1

With the change in load, the failure process of the energy dissipation device can be divided into five stages:
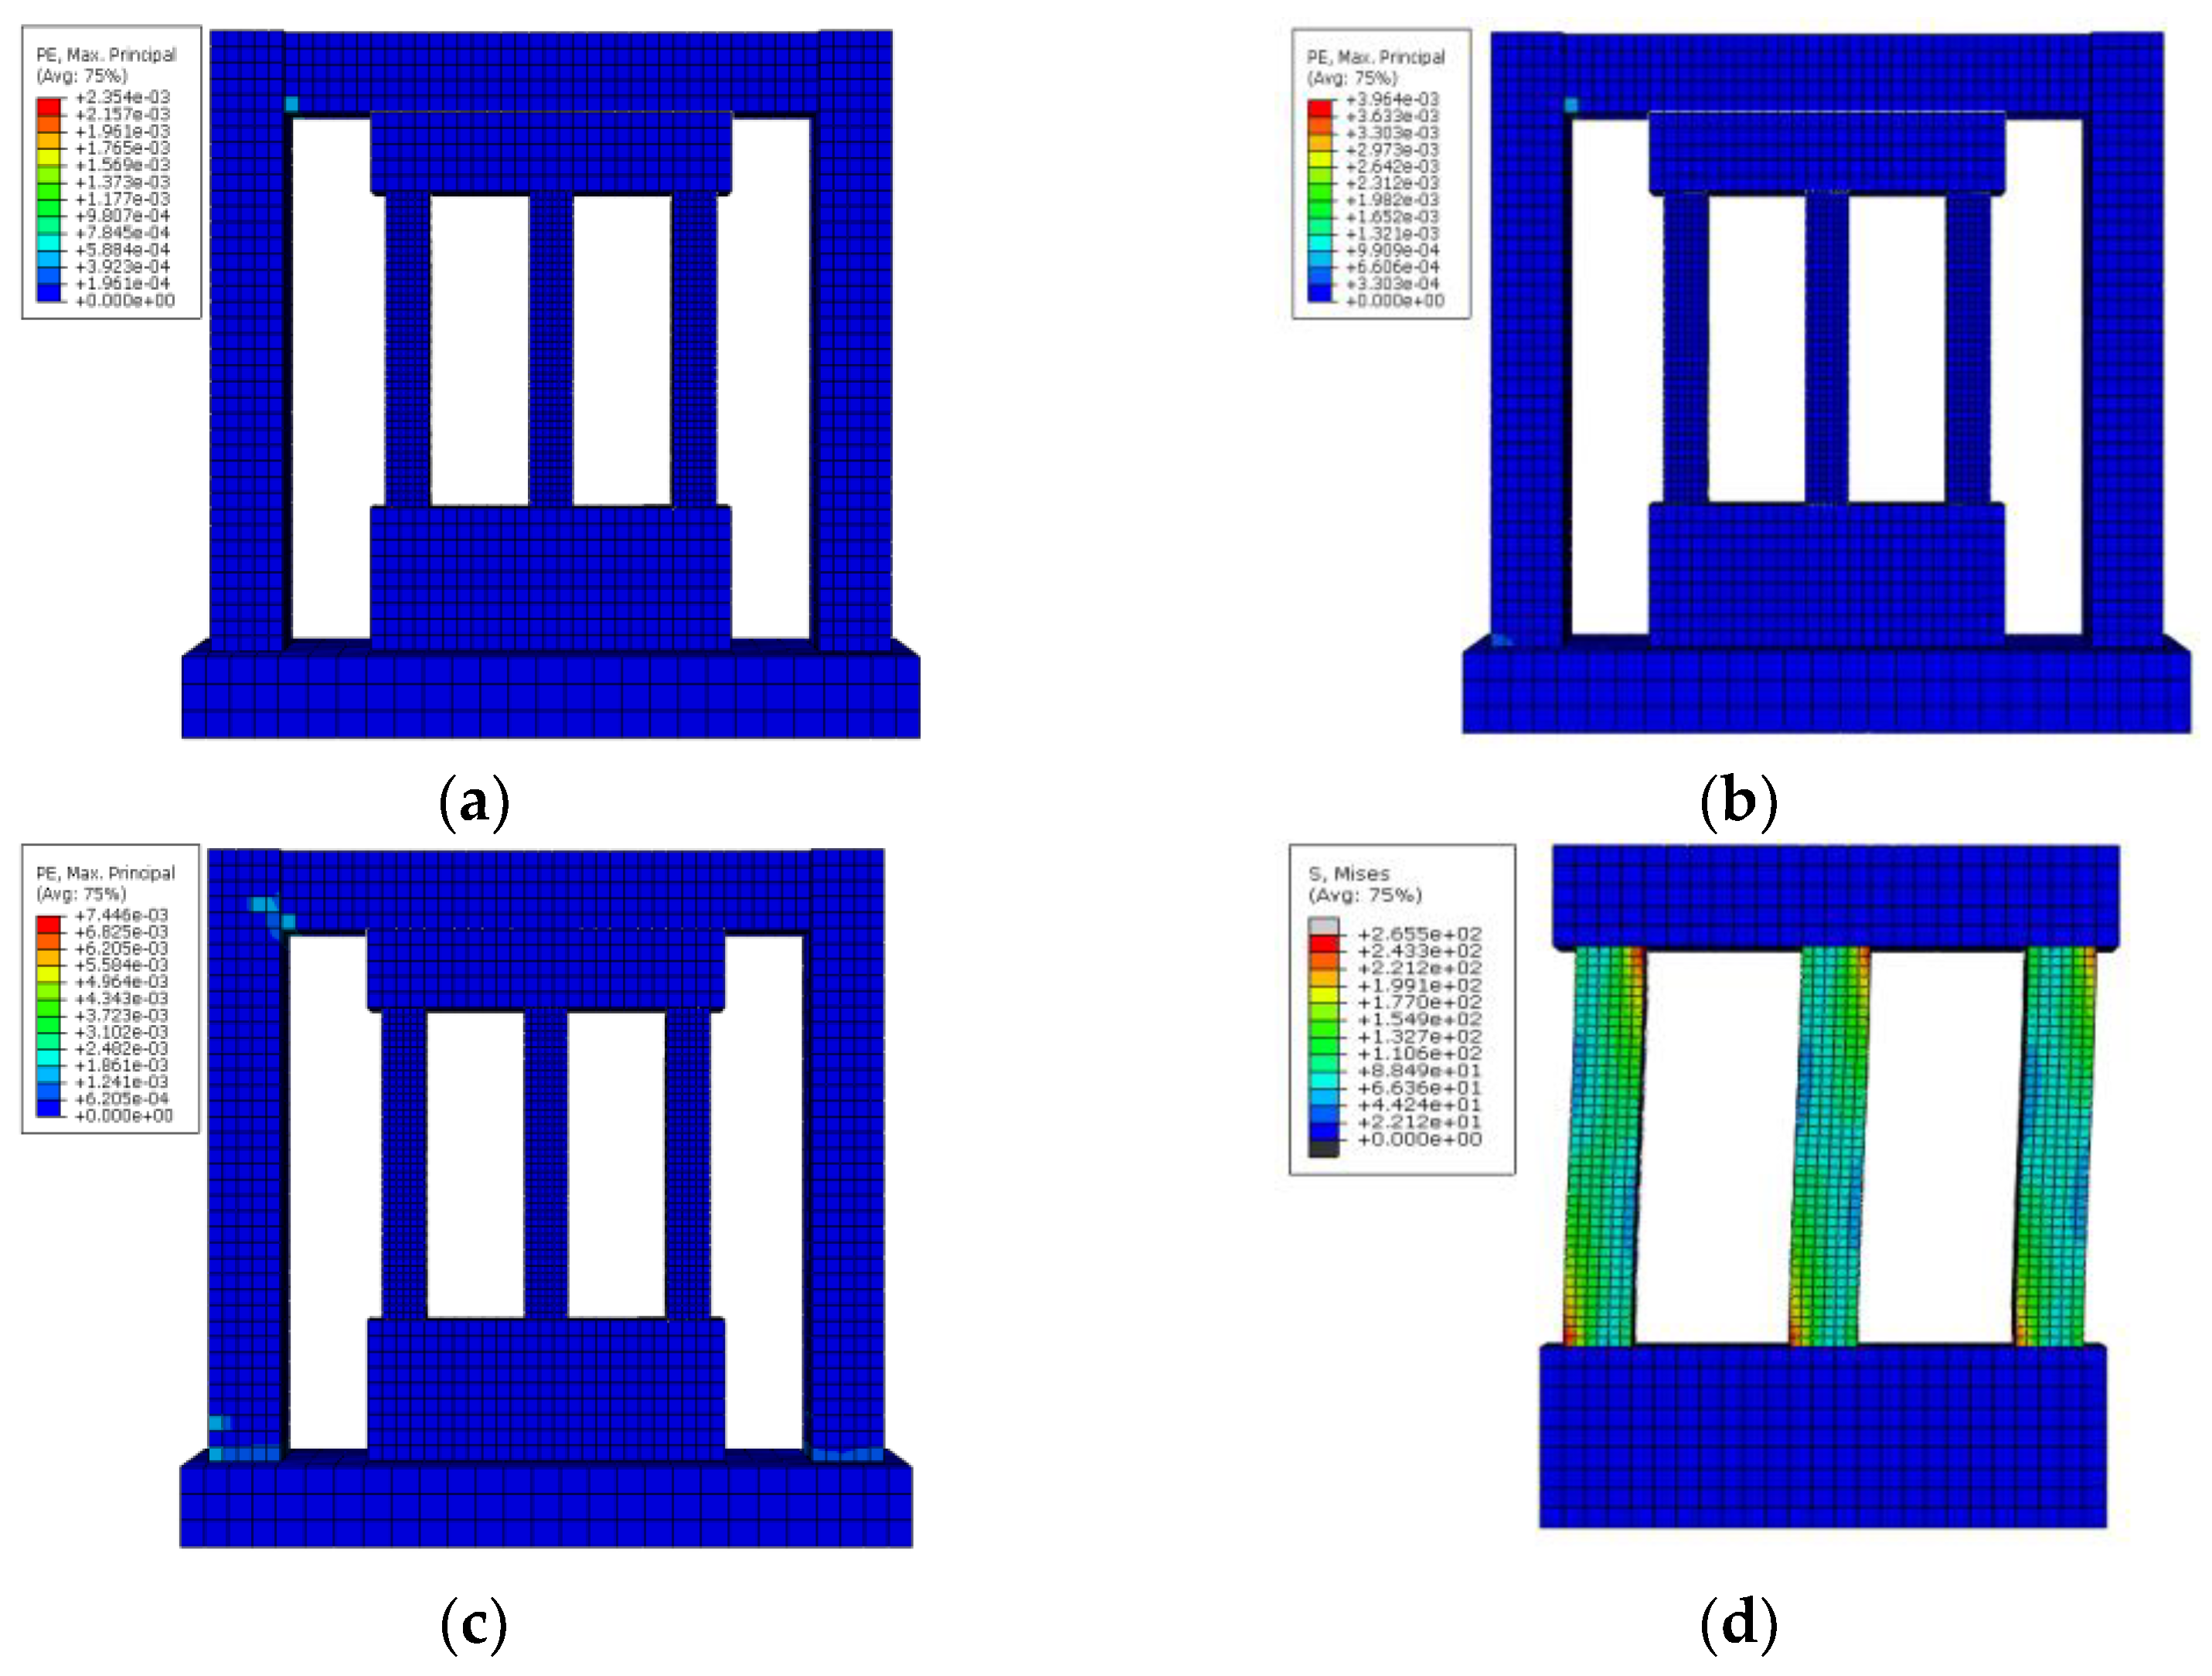
  • The crack occurrence stage: From the beginning of loading to the loading time at 1.41 s, the first plastic strain element appeared in the concrete at the left end beam node. From the numerical point of view, the plastic strain is minimal, indicating that the concrete begins to crack. With the further increase in the load when the loading time reached 1.54 s, the first plastic strain element appeared in the concrete at the left frame column, and the left frame column began to crack (as shown in Figure 6a,b).
  • The crack development stage: With the further load increase, the microcracks on the frame began to develop. According to Figure 6c, the cracks at the frame column’s two feet developed horizontally, and the cracks at the left beam–column joint began to develop diagonally.
  • The beginning of the yield stage: New cracks continued appearing with the further development and extension of the above cracks. The CFST ductile columns began to play a role in energy dissipation. The three energy-dissipating columns began to enter the yield state, and the horizontal cracks at the bottom of the two frame columns further developed. The cracks appeared in both beam–column joints and began to develop diagonally, as shown in Figure 6d.
  • The yield stage: With the further increase in cyclic loading, the CFST ductile columns further yielded. The main load-bearing bars at the bottom of the frame column began to yield, and the beam–column joints also yielded. The whole model reached the maximum horizontal bearing capacity, and cracks appeared at both ends of CFST columns. When the model reached the maximum horizontal load, the horizontal displacement of the loading point reached about 39.31 mm.
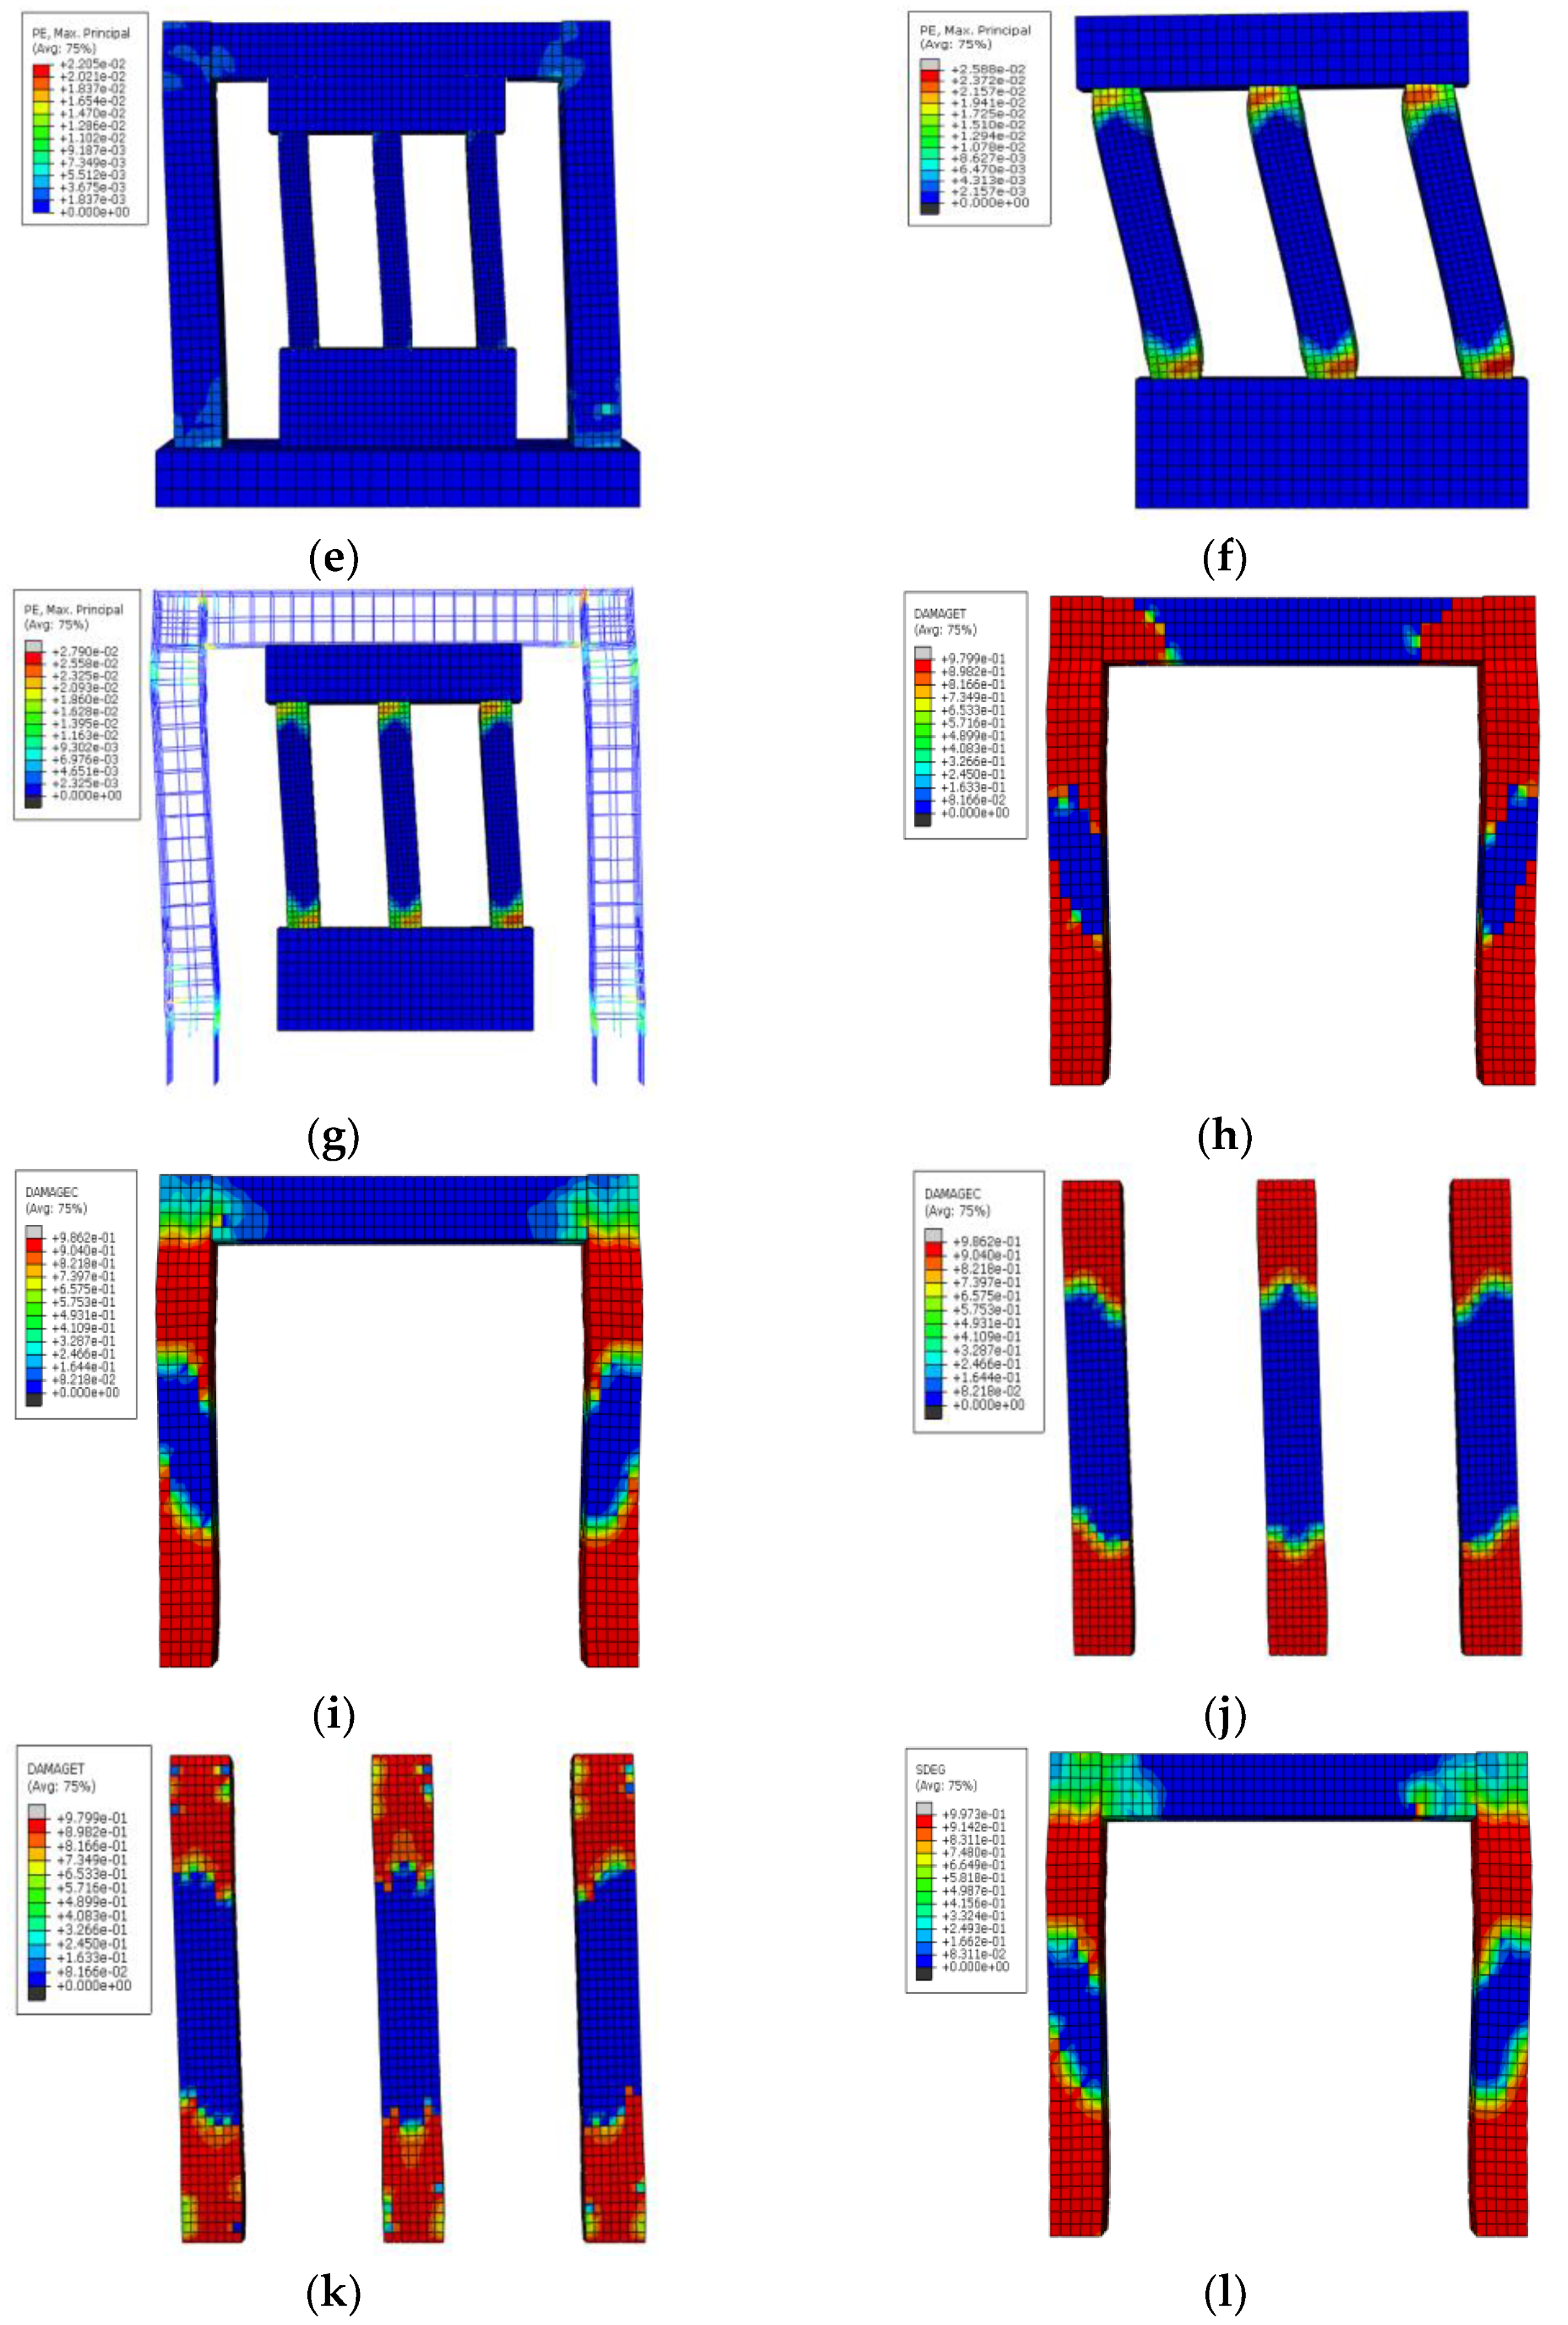
  • The failure stage: After both ends of CFST ductile columns reached the total yield, the cracks further increased with the increase in the cyclic loading. The ends of CFST ductile columns had dense cracks, and both ends of the frame column and CFST ductile columns were bulging and damaged severely. From SEDG, DAMAGEC, and DAMAGET in ABAQUS SOFTWARE, the apparent stiffness degradation of reinforced concrete frame columns developed from both ends to the middle. Due to the low-reversed cyclic loading, the frame mainly bears horizontal force. Moreover, the nodes mainly transmit the stress of the reinforced concrete frame beam at both ends. The stiffness degradation has an apparent trend of developing from both ends to the middle. The stiffness degradation is slight (Figure 6l). Figure 6h,i shows that the compression damage at both ends of the frame column was severe. The concrete in the compression zone was crushed. During the simulation test, the stirrups at the bottom of the frame column did not yield. The longitudinal bars entered the yield stage. It can be seen from Figure 6j,k that most of the concrete compression zones inside the CFST ductile columns were damaged under compression, and the bearing capacity was lost.

3.2.4. Simulation Analysis of GJ-2

The failure process of energy-dissipated low-rise concrete shear wall with CFST short columns can also be divided into five stages:
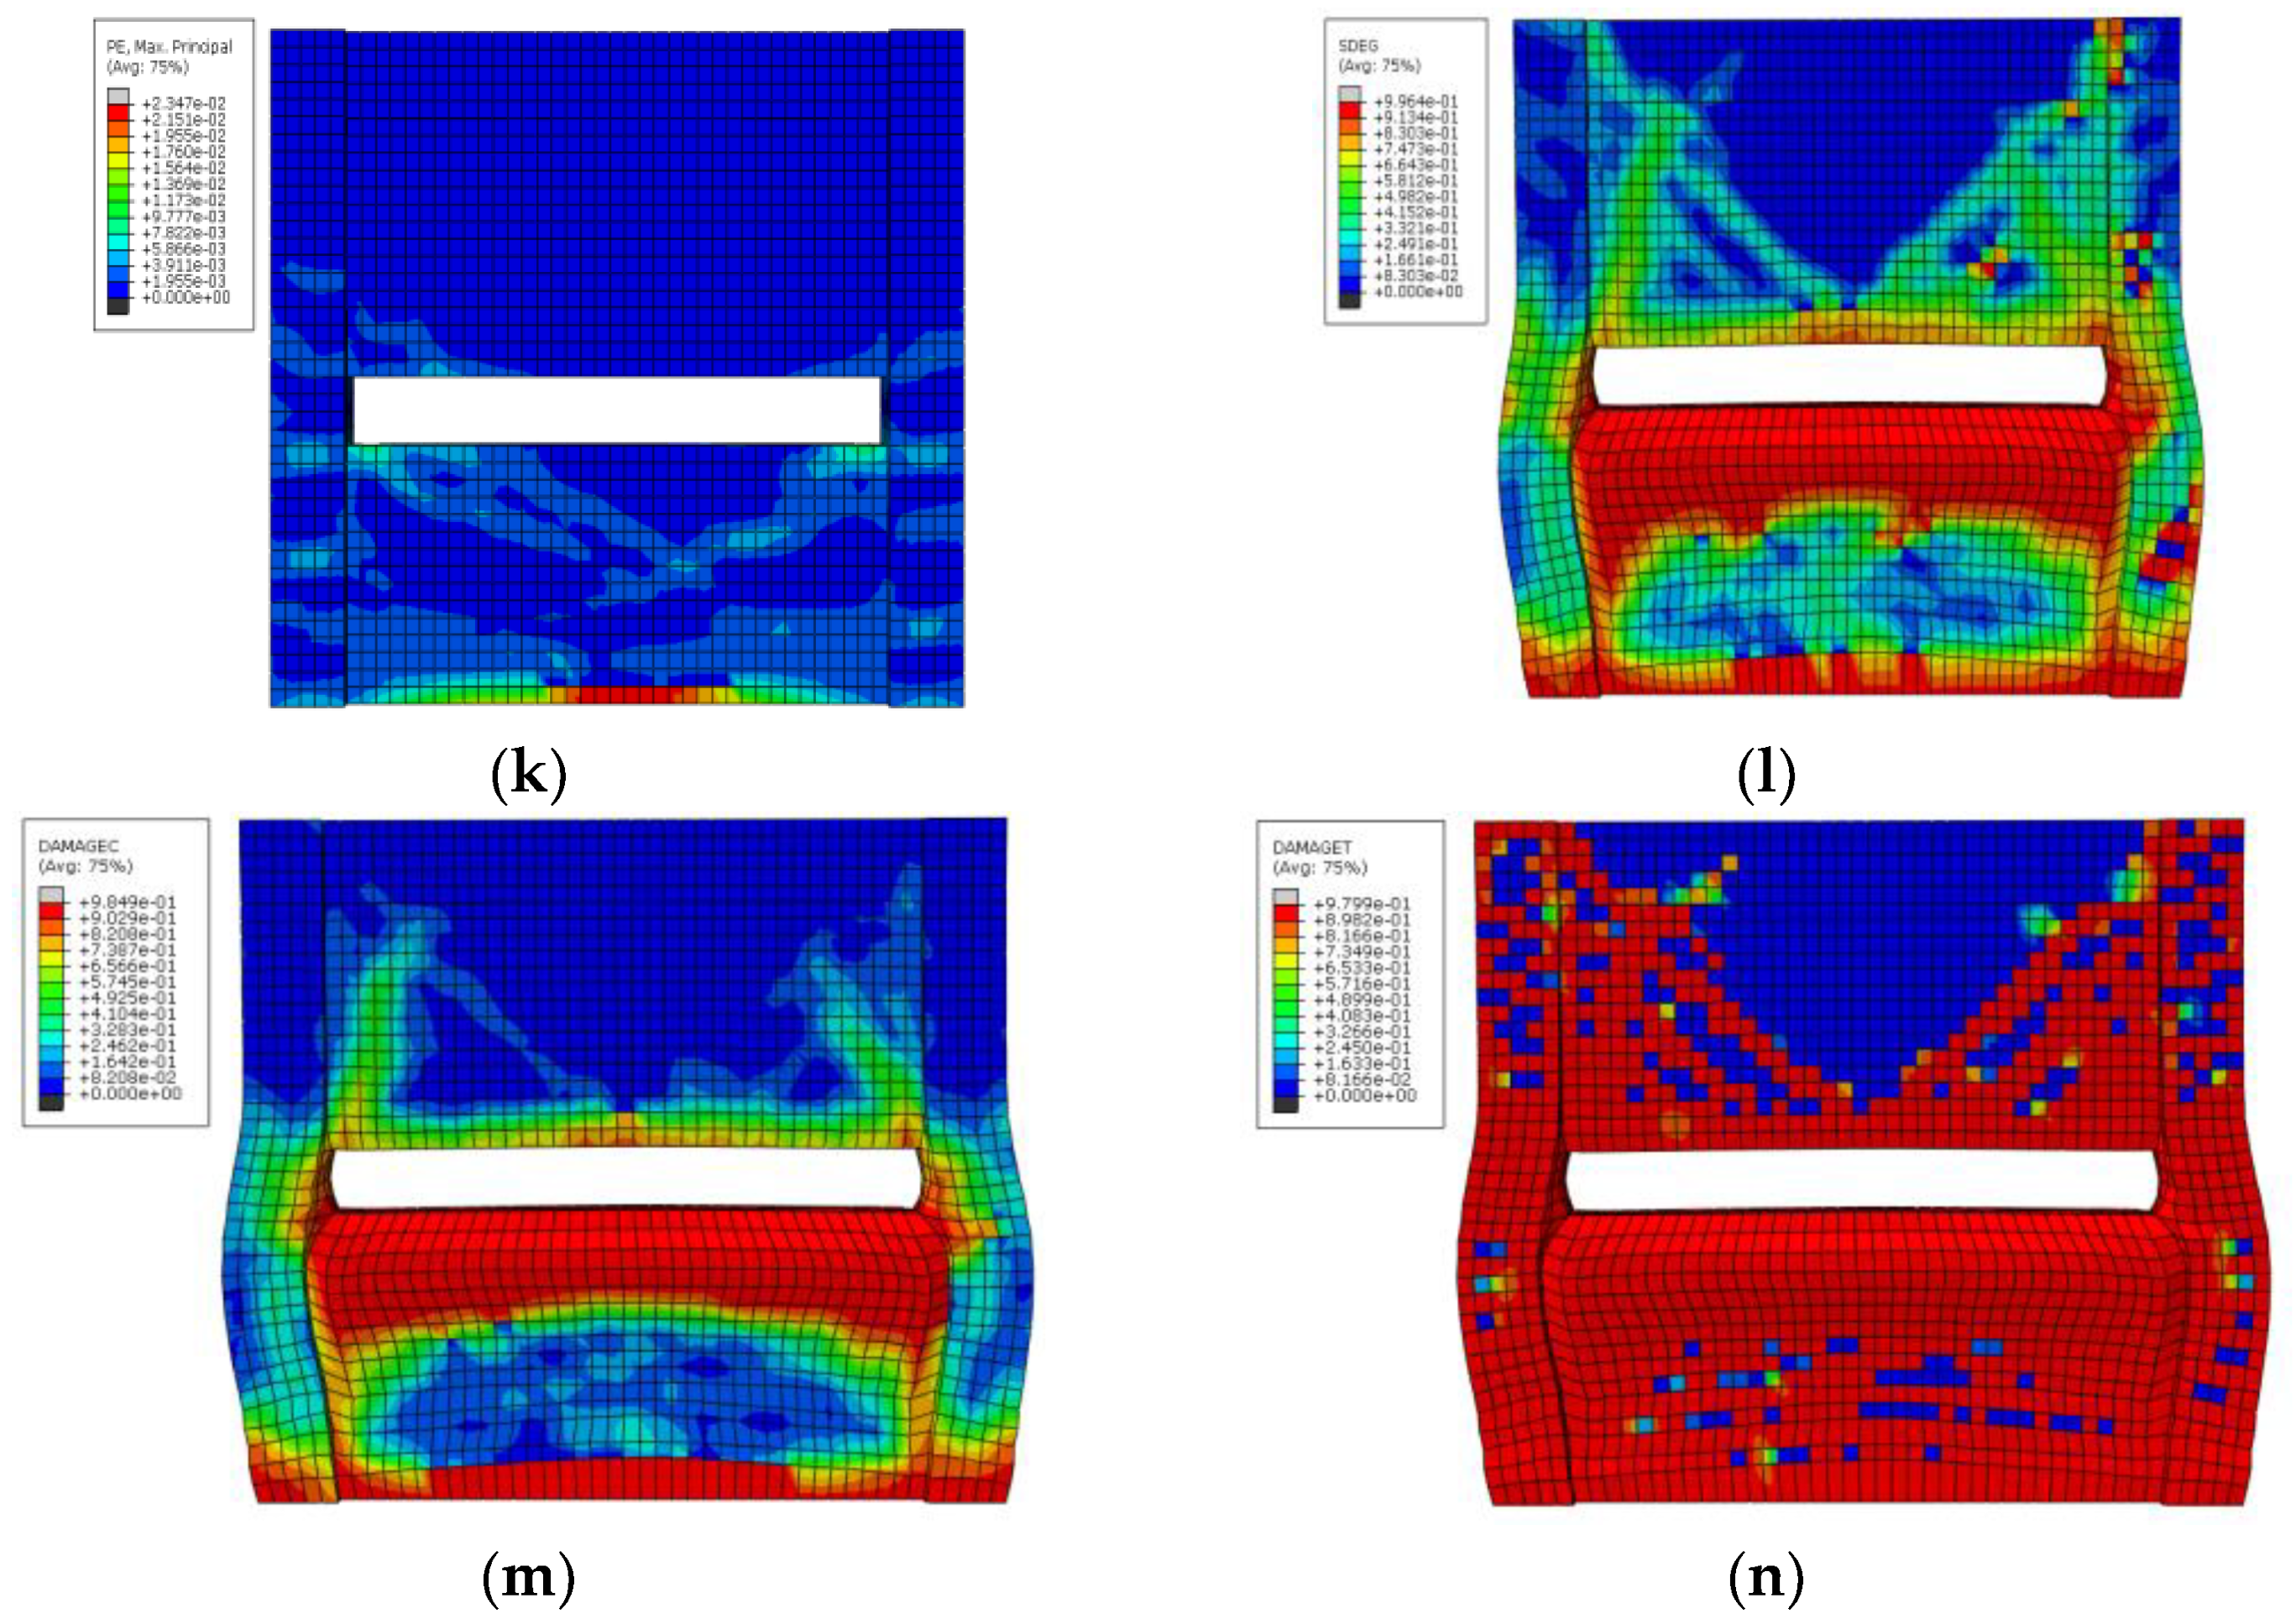
  • The crack occurrence stage: From the beginning of loading to the loading time at 1.76 s, the first plastic strain element appeared in the concrete at the left column foot. It can be seen from Figure 7a that the plastic strain value is minimal, indicating that the concrete cracking is not severe at this time and it is in a normal working state with cracks.
  • The crack development stage: With the further increase in low-reversed cyclic loading, when the loading time reached 2.75 s, the micro-cracks at the bottom of the left column began to develop horizontally to the right. At the same time, the first plastic strain element appeared at the height of the cut at the left end of the energy-dissipated low-rise concrete shear wall with CFST short columns (Figure 7b). When the loading time reached 4.56 s, cracks began to appear at the bottom of the right column and at the height of the cut (Figure 7c). With the further increase in displacement, the cracks at the bottom of the shear wall developed horizontally and basically connected in the left and right directions (Figure 7d).
  • The beginning of the yield stage: The cracks mentioned above further developed, and new cracks continued appearing. The short CFST column at the cut position in the wall began to yield, and the lower half of the shear wall began to have cracks that developed diagonally from left to right (Figure 7e), and the main load-bearing bar of the shear wall began to yield.
  • The yield stage: With the increase in displacement, the short CFST column in the wall yielded further, and the main load-bearing bars of the columns on both sides also yielded (Figure 7f). The cracks at the upper left corner of the lower half of the shear wall started to develop further diagonally to the right and downward, and finally connected to the compression zone at the lower right corner, which is referred to as the right oblique cracks (Figure 7g,h). With the negative unloading and reloading, the cracks in the upper left to the lower right direction of the wall in the lower half began to narrow and shorten. On the contrary, cracks appeared from the upper right corner to the lower left corner and finally penetrated the compression zone at the lower left corner, referred to as the left oblique cracks (Figure 7i,j), showing obvious “X” shaped cross cracks. When negative unloading and reloading again, the second right oblique crack appeared in the wall’s lower half, and the direction was parallel to the first right oblique crack (Figure 7k). The concrete began to bulge and finally reached the maximum horizontal bearing capacity of the model. At this time, the horizontal loading displacement was 17.014 mm.
  • The failure stage: After yielding of the main load-bearing bars of the CFST short columns, and the frame columns on both sides and the lower half of the shear wall, the cracks further increased with the increase in the reciprocal load. The cracks in the lower part of the shear wall were dense, and the concrete was basically crushed in the later stage. The bottom of the frame columns and the lower half of the share wall bulged, and the model was damaged severely. From SEDG, DAMAGEC, and DAMAGET in ABAQUS software, it can be clearly seen that the stiffness degradation of the whole model develops from the bottom to the top, from the surrounding to the middle. In addition, the stiffness degradation phenomenon was severe (Figure 7l). It can be seen from Figure 7m,n that the concrete at the connection between the lower part of the shear wall and the CFST short columns was almost completely damaged under compression, and the bearing capacity was basically lost. The upper part of the shear wall presents apparent “V” shaped tensile failure cracks.

3.2.5. Simulation Analysis of GJ-3

The failure process of ordinary low-rise concrete shear wall can also be divided into five stages:
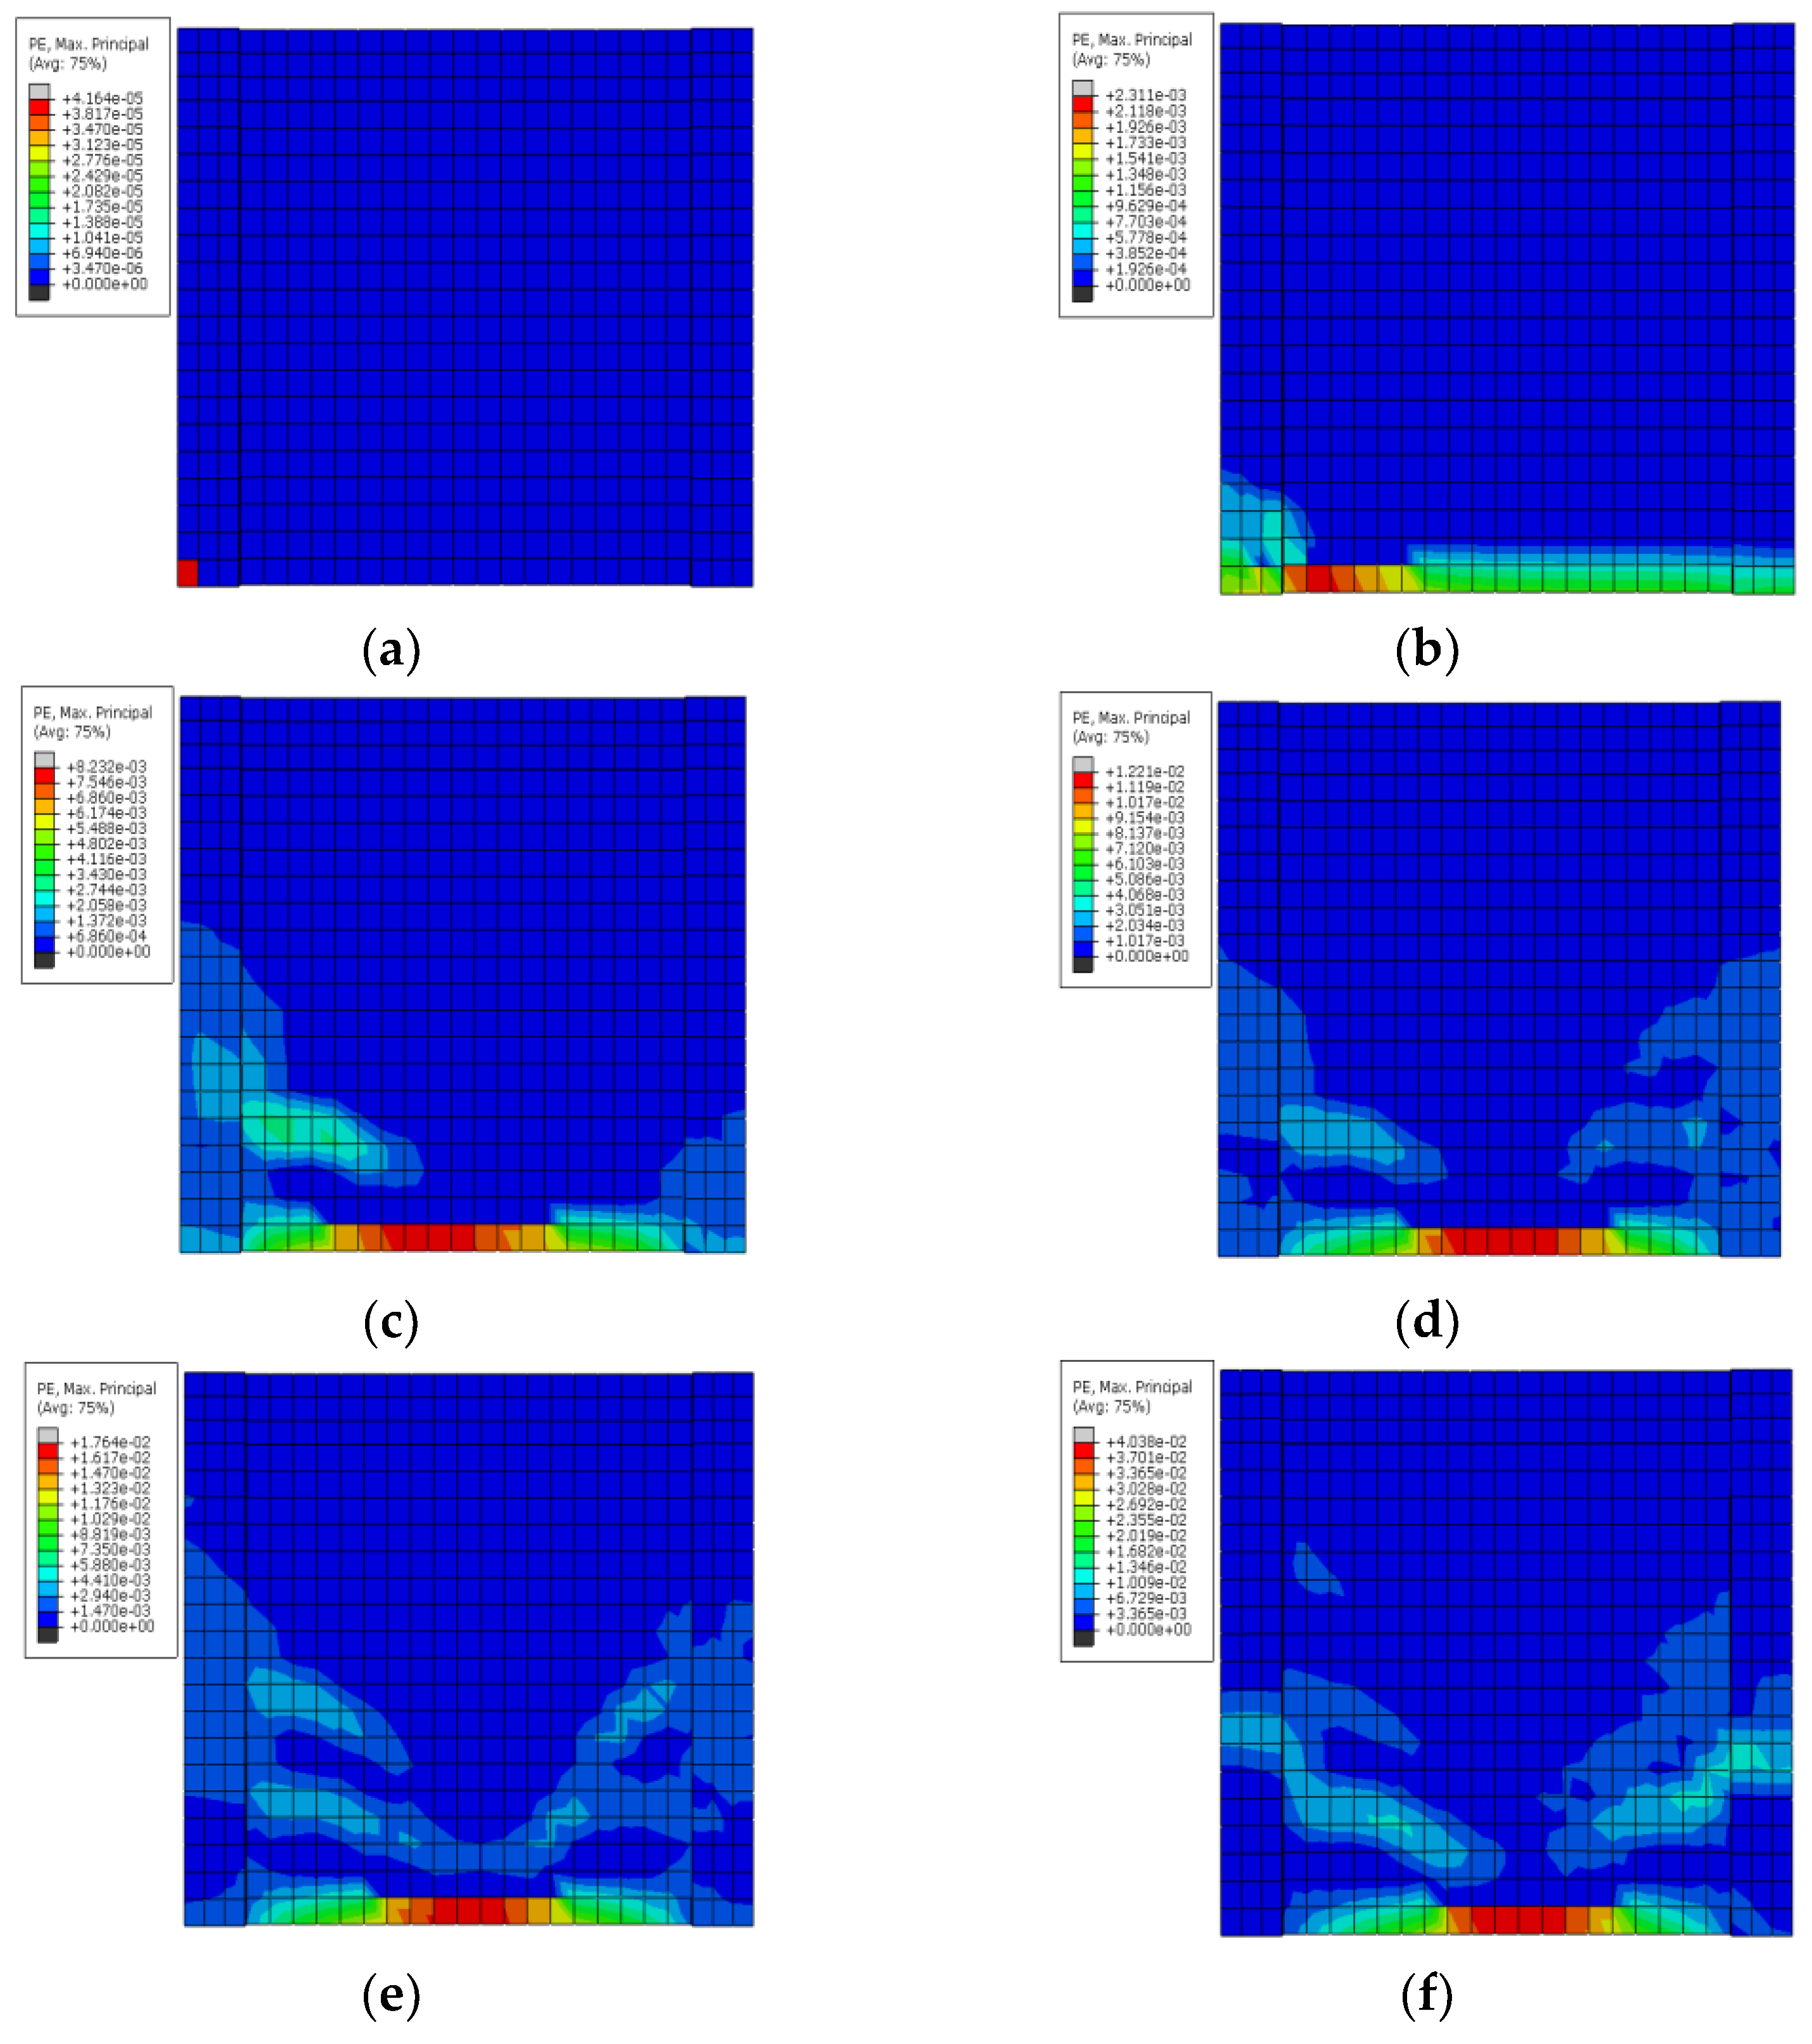
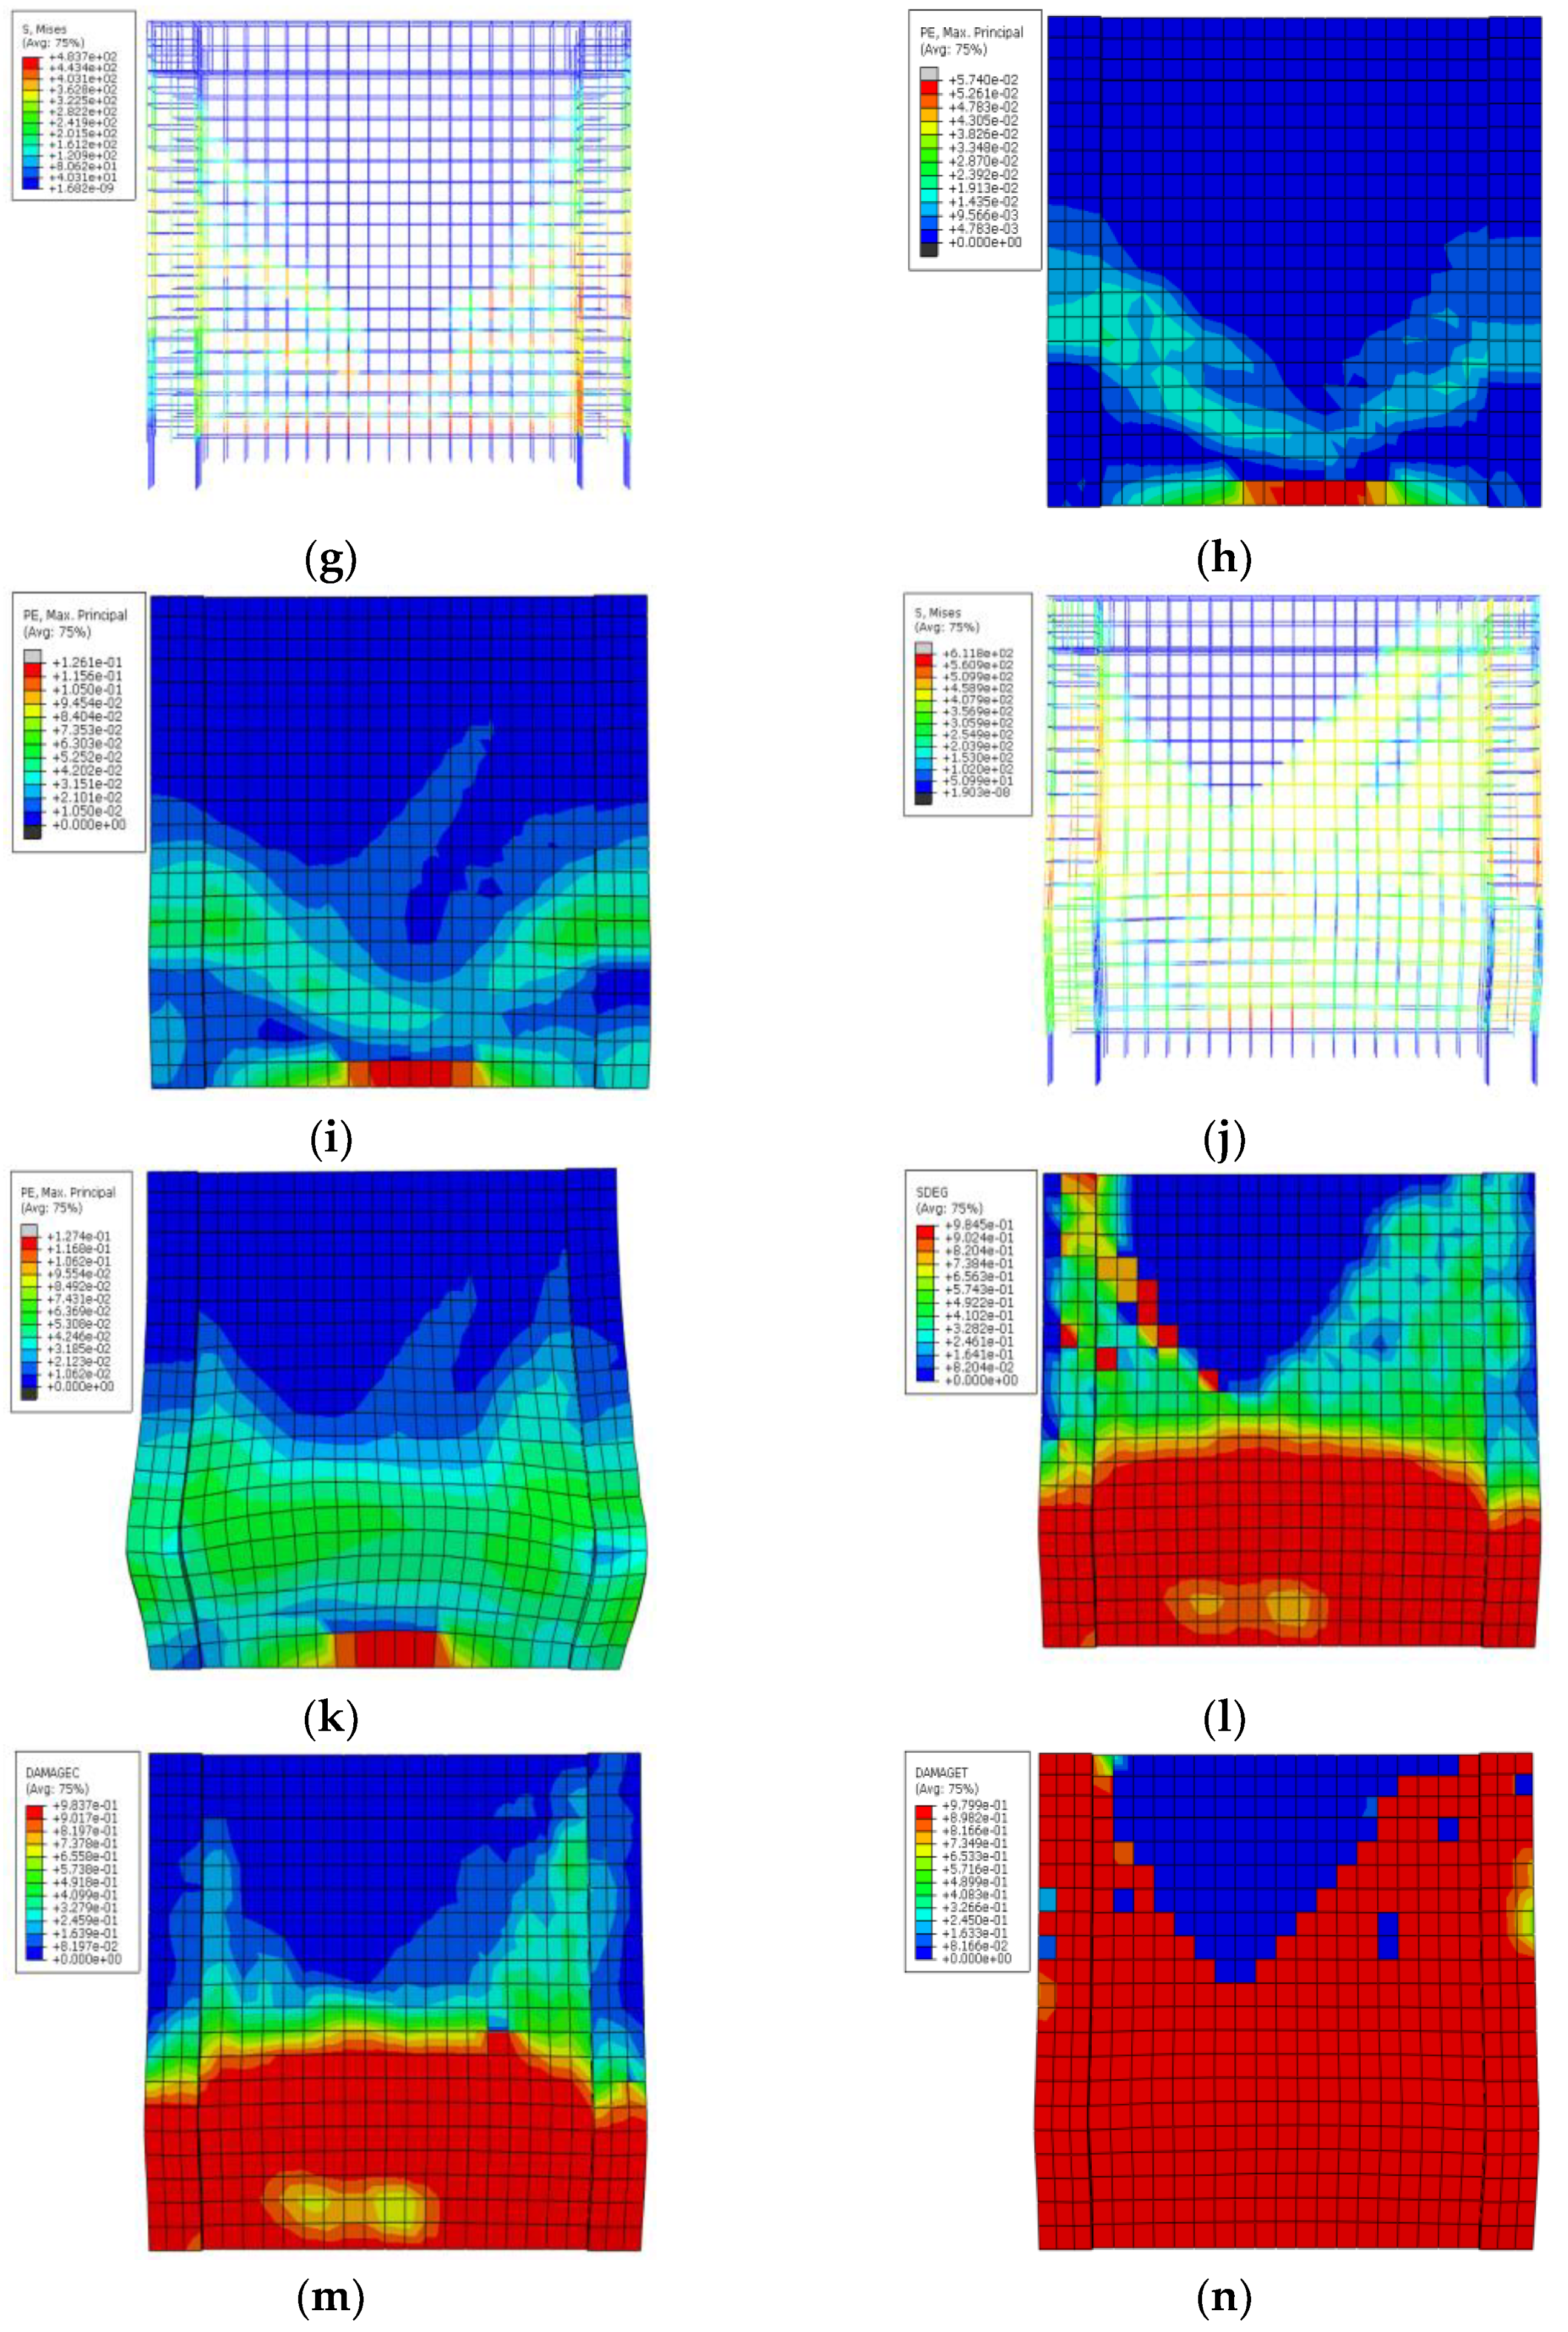
  • The crack occurrence stage: From the beginning to the loading time at 1.39 s, the first plastic strain element appeared in the concrete at the bottom of the left frame column. It can be seen from Figure 8a that the maximum plastic strain value is 10−5 orders of magnitude, indicating that the concrete is in normal working condition with cracks at this time, and the concrete cracking is not severe.
  • The crack development stage: During the first loading cycle, with the further increase in the load, when the loading time reached 2.28 s, the micro-cracks on the bottom of the left frame column began to develop horizontally to the right. At the same time, the bottom of the left frame column began to develop upward compressive failure cracks (Figure 8b). With the further increase in the displacement, the horizontal cracks at the bottom of the shear wall are basically connected in the left and right directions.
  • The beginning of the yield stage: When the loading time reached 15.56 s, with the further development of the above cracks, new cracks continued appearing. Cracks developed diagonally to the right and downward at the left side of the shear wall with a height of about 1000 mm (Figure 8c). With the unloading and then reloading, the cracks developed diagonally to the left and down on the right side of the shear wall (Figure 8d). At this time, the main load-bearing reinforcement of the shear wall began to yield.
  • The yield stage: Repeated loading and unloading made the shear wall appear to have obvious “V” cracks. When the loading time reached 45.36 s, the second right oblique crack appeared at the height of 1800 mm at the left end of the shear wall, with the direction basically parallel to the first one (Figure 8e). When the loading time reached 49.34 s, the frame columns on both sides began to show obvious horizontal through cracks at the height of about 1500 mm (Figure 8f). This shows that the frame column began to suffer compression failure at this time. From Figure 8g, it can be seen that the main load-bearing bars of the steel mesh reinforcement basically yielded, and the concrete at the bottom of the whole model began to bulge. Finally, the model reached the maximum horizontal bearing capacity, and the horizontal loading displacement was 100 mm.
  • The failure stage: With the increase in load, cracks further increased. The concrete of shear walls and columns was basically destroyed under compression (Figure 8h), and the horizontal bearing capacity of the whole model began to decline. In the later stage, cracks in the middle of the shear wall even spread diagonally to the upper right (Figure 8i), indicating that the concrete at the lower part of the wall has basically been crushed. Moreover, the reinforcement skeleton in the wall also mostly yielded (Figure 8j,k). At this time, the bulge in the lower part of the whole model is very obvious, and the concrete damage is severe. From SEDG, DAMAGEC, and DAMAGET in ABAQUS software, it can be clearly seen that the stiffness degradation of the whole model develops from the bottom to the top, from the surrounding to the middle. The process is similar to that of GJ-2. The stiffness degradation was severe (Figure 8l), showing an obvious “V” shape. It can be seen from Figure 8m,n that the lower part of the whole wall was compressed and completely destroyed, while the upper part was partially compressed and destroyed. The tensile failure ratio of the whole wall reached 80%, and the tensile failure part showed an obvious “V” shape.

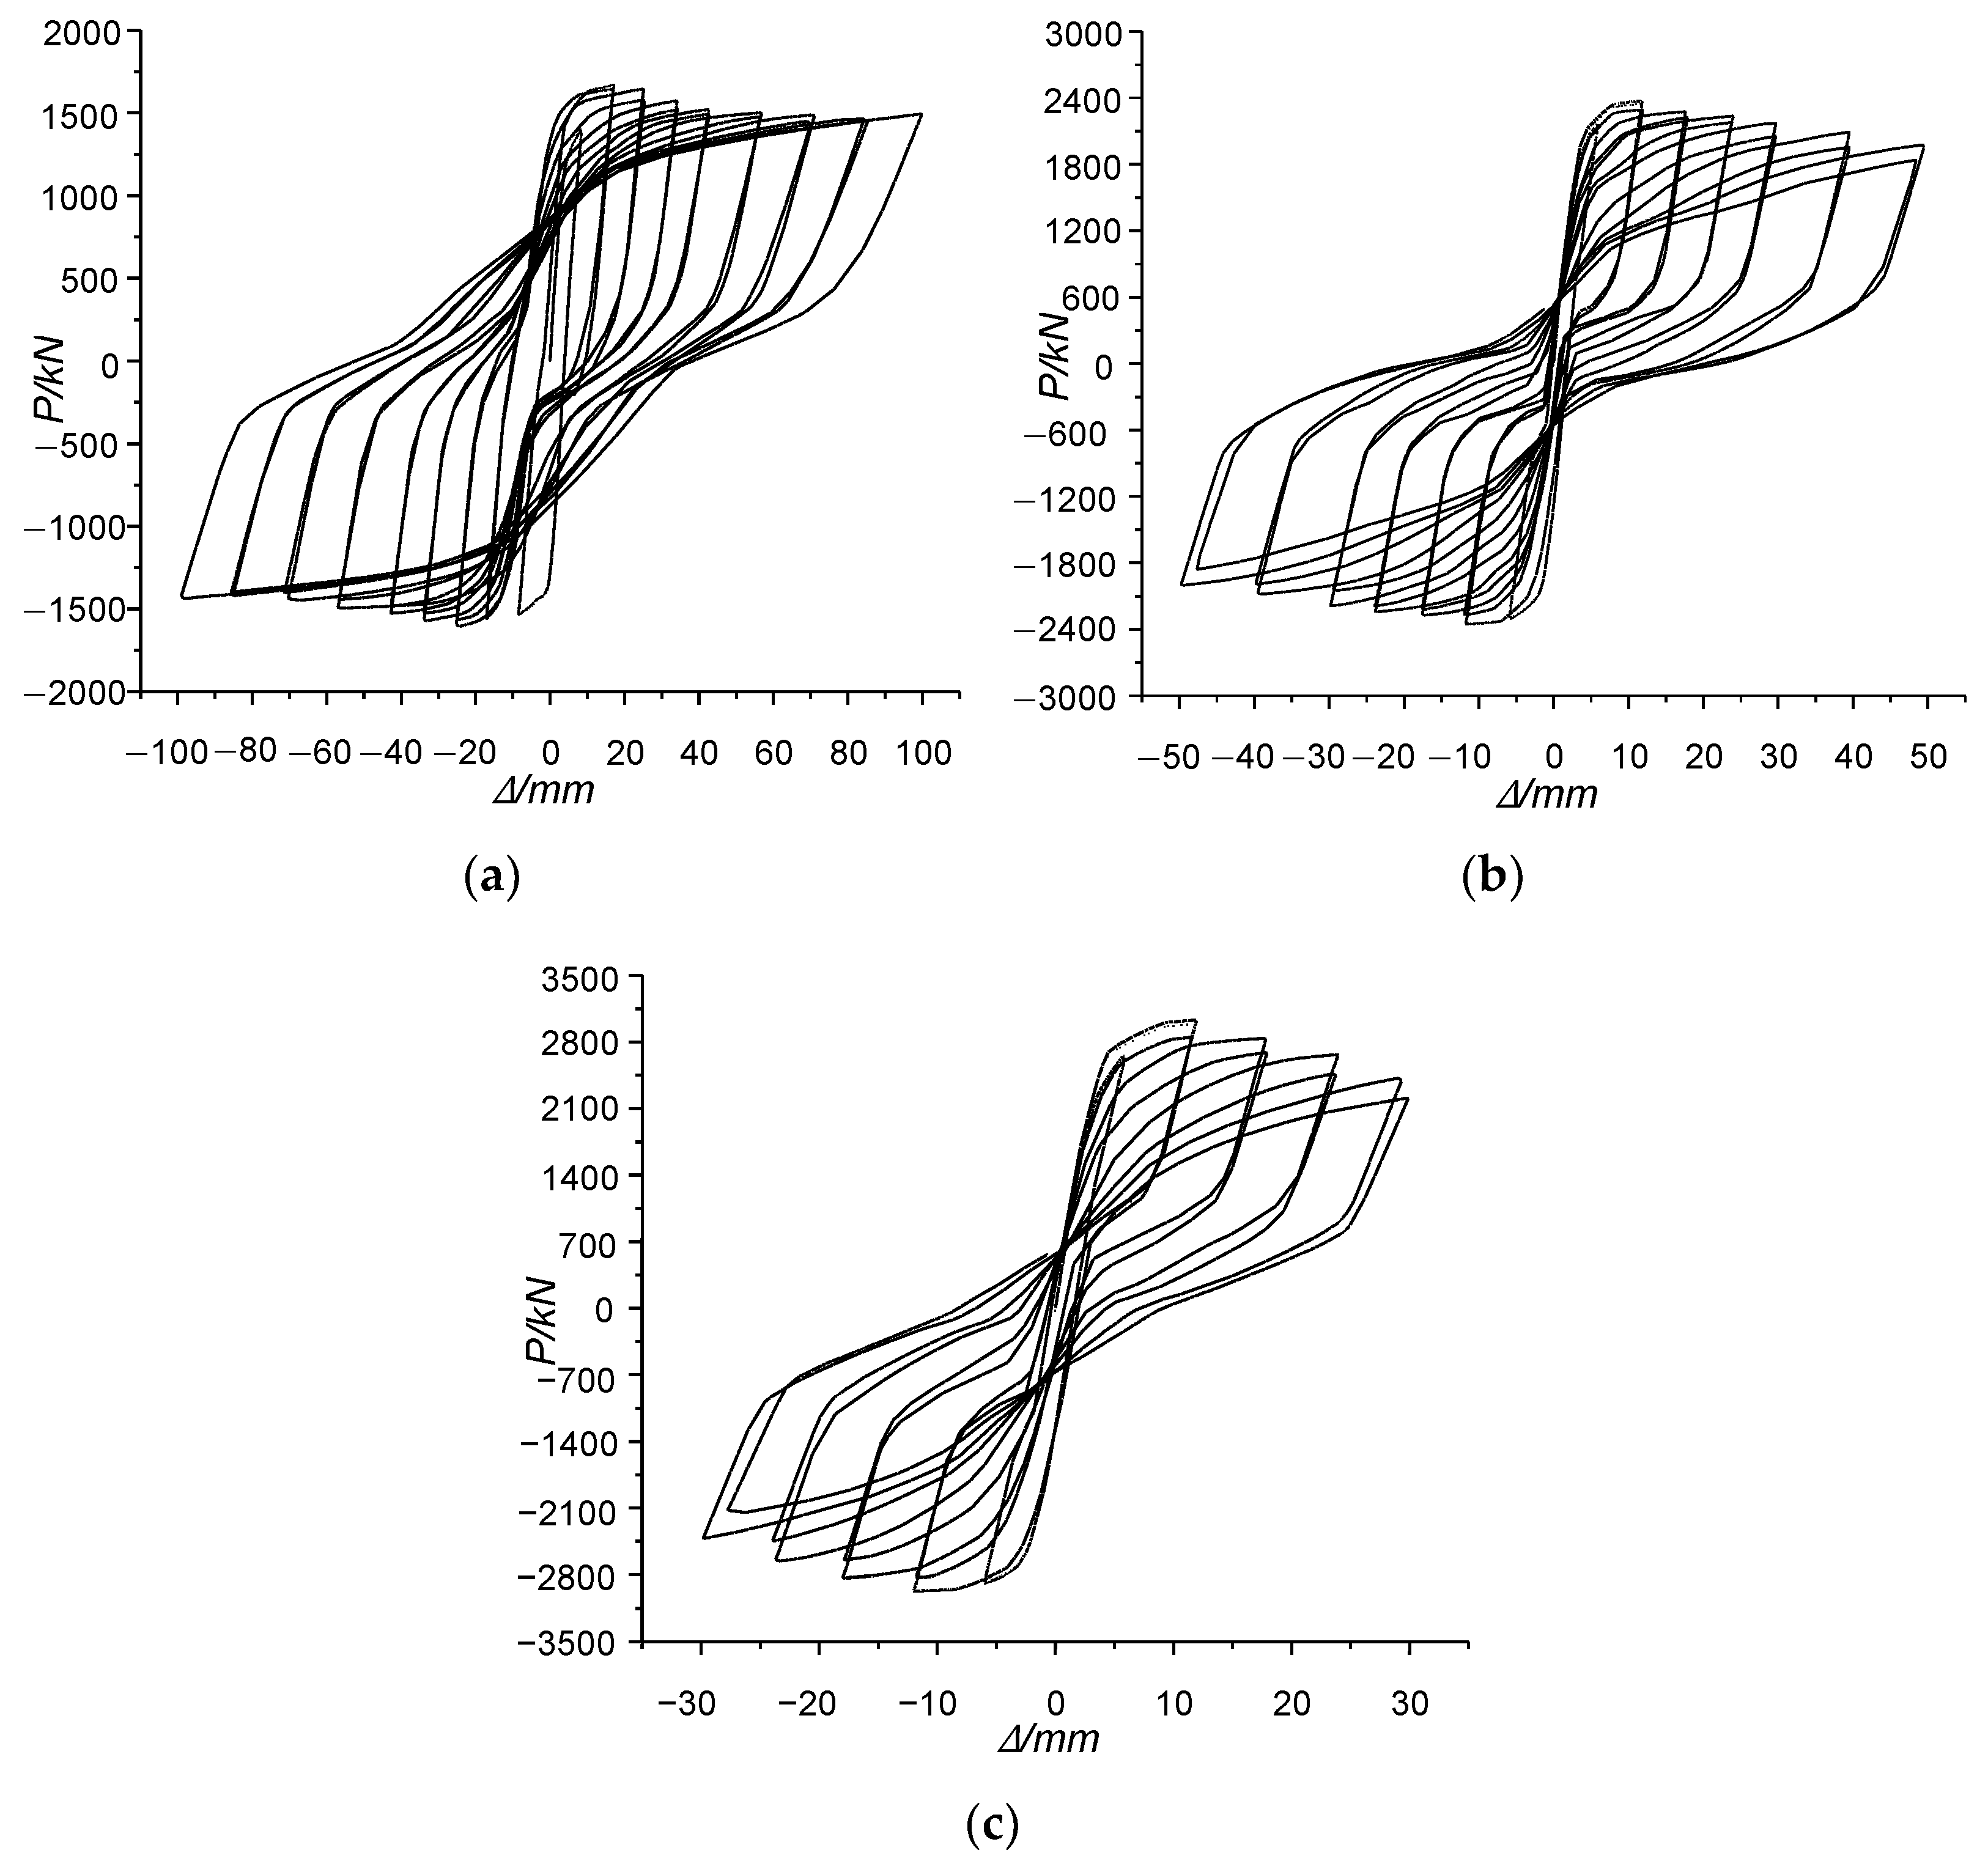
3.3. Hysteretic Loops Analysis of Three Components GJ-1,GJ-2 and GJ-3

The hysteretic response is a concentrated reflection of the seismic performance of reinforced concrete members. The hysteretic loops of the three models GJ-1, GJ-2, and GJ-3 are shown in Figure 9, and is the horizontal displacement at the loading point. All the hysteresis loops are limited by two curves having one inflection point [21] and are characterized by cyclic softening phenomena [22]. The limiting state criterion in the simulation test records the time when the bearing capacity of the specimen drops to 85% of the peak bearing capacity (unless otherwise specified, the criterion is followed in the following).
From Figure 9a, it can be seen that the hysteretic loop of GJ-1 with CFST dampers has complete ascending and descending segments, where the descending segment is very stable and the middle of the curve is slightly pinched. Under the action of horizontal loading, the hysteretic loop area of the component is large, indicating that the component has excellent ductility. The slope of the hysteretic loop of concrete before cracking is basically unchanged. At this time, the residual strain is small, and the hysteretic loop is generally in the shape of a sharp shuttle. When the applied displacement reaches 2.483 mm, the component cracks with a cracking load of 492.406 kN. After cracking, the slope of the curve becomes smaller. When the applied displacement reaches about 17.01 mm, the load-carrying capacity of the component reaches the peak value of 1669.477 kN, and then the slope of the hysteretic loop decreases significantly. With the increase in the applied displacement, the slope decreases more rapidly. Through analysis, it is known that the concrete damage of the frame columns at both ends becomes more serious with the increase in the applied displacement after reaching the ultimate load, which is called the stiffness degradation of the component under repeated load. After the peak load is reached, the load-carrying capacity of the second load decreases by less than 2% when the same level load is applied. In general, it has superior energy dissipation capacity and excellent seismic performance. However, the residual deformation of the whole frame gradually increases in the late loading period, indicating that the structure has large damage.
From Figure 9b, the main characteristics of the hysteretic loop of GJ-2 are as follows. It has complete ascending and descending segments, where the descending segment is relatively stable, the middle of the curve is pinched seriously at the initial stage of loading, and the hysteretic loop becomes full after the loading displacement reaches 25 mm at the later stage. By comparing the GJ-1 hysteretic loop, it can be seen that the hysteretic loops of the two components are generally similar, but the main differences are as follows. The cracking load of GJ-2 is higher than that of GJ-1. When the applied displacement reaches 1.358 mm, the cracking load is 657.354 kN. The peak load of GJ-2 is also higher than that of GJ-1. When the displacement reaches 11.844 mm, the peak load is 2374.418 KN. When loading at the same level, the reduction in load-carrying capacity at the second loading is larger than that of GJ-1, and the difference is greater than 2%. At the later stage of displacement loading, when the load-carrying capacity is still greater than 85% of the peak bearing capacity, the hysteretic loop is generally in the shape of a shuttle. When the ultimate displacement is 39.509 mm, the corresponding load-carrying capacity is 1981.434 KN, less than 85% of the maximum load-carrying capacity. In general, the member at this stage still has seismic performance to a certain extent, but its energy dissipation capacity and ductility are ordinary.
Compared with the hysteretic loops of GJ-1 and GJ-2, it can be seen from Figure 9c that the characteristic of the hysteretic loop of GJ-3 is that the load-carrying capacity decreases rapidly after reaching the peak value of 3030.285 KN. When the displacement reaches 23.30 mm, the load-carrying capacity is 2502.154 KN, which is less than 85% of the peak load-carrying capacity, and the component has been damaged. This indicates that GJ-3 has a higher horizontal load-carrying capacity than the previous two components, but its ductility is poor.
From Figure 9a–c, it can be seen that the hysteretic loop of the frame structure with CFST dampers has the best solidity, with the smallest pinch and the best energy dissipation capacity. The load-carrying capacity of the GJ-3 skeleton curve decreases slightly and tends to be stable in the later period, and the comprehensive seismic performance is relatively stable. Its nonlinear displacement is large and its ductility is excellent.
The cracking load, yield load, peak load, failure load, and yield strength ratio of the three members are shown in Table 1, where P c is the horizontal load when the component cracks; P y is the horizontal load when the component yields; P u is the horizontal load when the component reaches the peak value; P is the horizontal load when the component is damaged; μ 1 is the yield strength ratio, which is the ratio of yield load to peak load.
By analyzing Table 1, it can be concluded that:
  • There is little difference between the positive and negative loading data sizes of the models.
  • From GJ-1 to GJ-3, the yield load and peak load of the three components show a certain increasing trend. In terms of yield load, component GJ-3 is the largest, and component GJ-1 is the smallest, at about 47.3% of GJ-3. In terms of peak load, GJ-1 and GJ-2 are, respectively, 55.1% and 81.7% of GJ-3. It can be seen from the analysis that GJ-1 adds three CFST ductile columns to the pure frame, but it cannot increase its own lateral stiffness. GJ-2 cuts the middle of the wall to a certain height, reducing the lateral stiffness of the wall, and making the columns on both sides become relatively weak at the height of the cut.
  • Among the three members, GJ-1 has the smallest yield ratio and GJ-3 has the largest yield ratio. Although GJ-1 has a smaller peak load-carrying capacity, it has a higher plastic deformation capacity and can dissipate more energy during an earthquake. The yield strength ratios of GJ-2 and GJ-3 are basically the same and the value is quite large. They have obvious brittle characteristics when they are damaged. The advantages and disadvantages of GJ-2 and GJ-3 cannot be seen from the yield strength ratio alone.
  • The yield strength ratio of GJ-3 is much larger in the negative direction than in the positive direction. After analysis, it is believed that although the wall has some brittle failure before the negative direction yield, it is not serious, and can still have a certain degree of yield load-carrying capacity, but the wall shows obvious brittle failure after yielding, leading to a certain decline in the load-carrying capacity.

3.4. Displacement Ductility Factor of Three Components GJ-1,GJ-2 and GJ-3

The displacement and ductility factor of three components are shown in Table 2, where c is the crack displacement; y is the yield displacement; u is the peak load-carrying capacity displacement; is the ultimate displacement (the displacement corresponding to the frame failure); μ 2 = / y is the ductility factor of the specimen.
By analyzing Table 2, it can be concluded that:
  • From the perspective of the model itself, the difference between the positive and negative loading data of each indicator is small, but the difference between the same indicator of different models is large.
  • The crack displacement of GJ-1 is about 2~3 times that of GJ-2 and GJ-3, indicating that the stiffness of GJ-1 is significantly less than that of GJ-2 and GJ-3 in the early stage of loading.
  • In terms of yield displacement, the positive and negative data of GJ-2 and GJ-3 are roughly the same, which are about 73.6% of GJ-1. The stiffness values before yield of GJ-2 and GJ-3 are almost the same and much larger than GJ-1.
  • From the peak load-carrying capacity displacement to the ultimate displacement, it can be seen that the nonlinear displacement of GJ-1 is significantly increased compared with GJ-2 and GJ-3: GJ-1 is 116.8% higher than GJ-2, GJ-1 is 194.1% higher than GJ-3, and GJ-2 is 35.9% higher than GJ-3 under positive loading. Under negative loading, GJ-1 is 113.9% higher than GJ-2, GJ-1 is 185.3% higher than GJ-3, and GJ-2 is 33.3% higher than GJ-3.
  • In terms of displacement ductility factor, the factor of GJ-1 is obviously larger than that of GJ-2 and GJ-3, and more than 10. It can be seen from the comparison of the three components that the displacement ductility factor of GJ-1 is higher than that of GJ-2 by 56.7% and higher than that of GJ-3 by 113.9%. The displacement ductility factor of GJ-2 is higher than that of GJ-3 by 36.5%.
  • From the perspective of / u , the ratio of the three components is GJ-1:GJ-2:GJ-3 = 2.07:1.24:1, which shows that GJ-1 still has excellent load-carrying capacity after reaching the maximum peak load-carrying capacity. When reaching the maximum load-carrying capacity, the frame shows obvious plasticity, and the load-carrying capacity decreases gently, while GJ-2 and GJ-3 show obvious brittleness, which has a negative impact on earthquake resistance.
To sum up, the displacement ductility factor of the frame with CFST dampers is significantly greater than that of the energy-dissipated low-rise concrete shear wall with CFST short columns and the ordinary low-rise concrete shear wall. The frame with CFST dampers has good ductility and late load-carrying capacity. After the frame has reached the maximum load-carrying capacity, it can still maintain good stiffness and load-carrying capacity. In addition, it can maintain the overall working performance of the frame in the round-trip action and has good energy dissipation capacity.

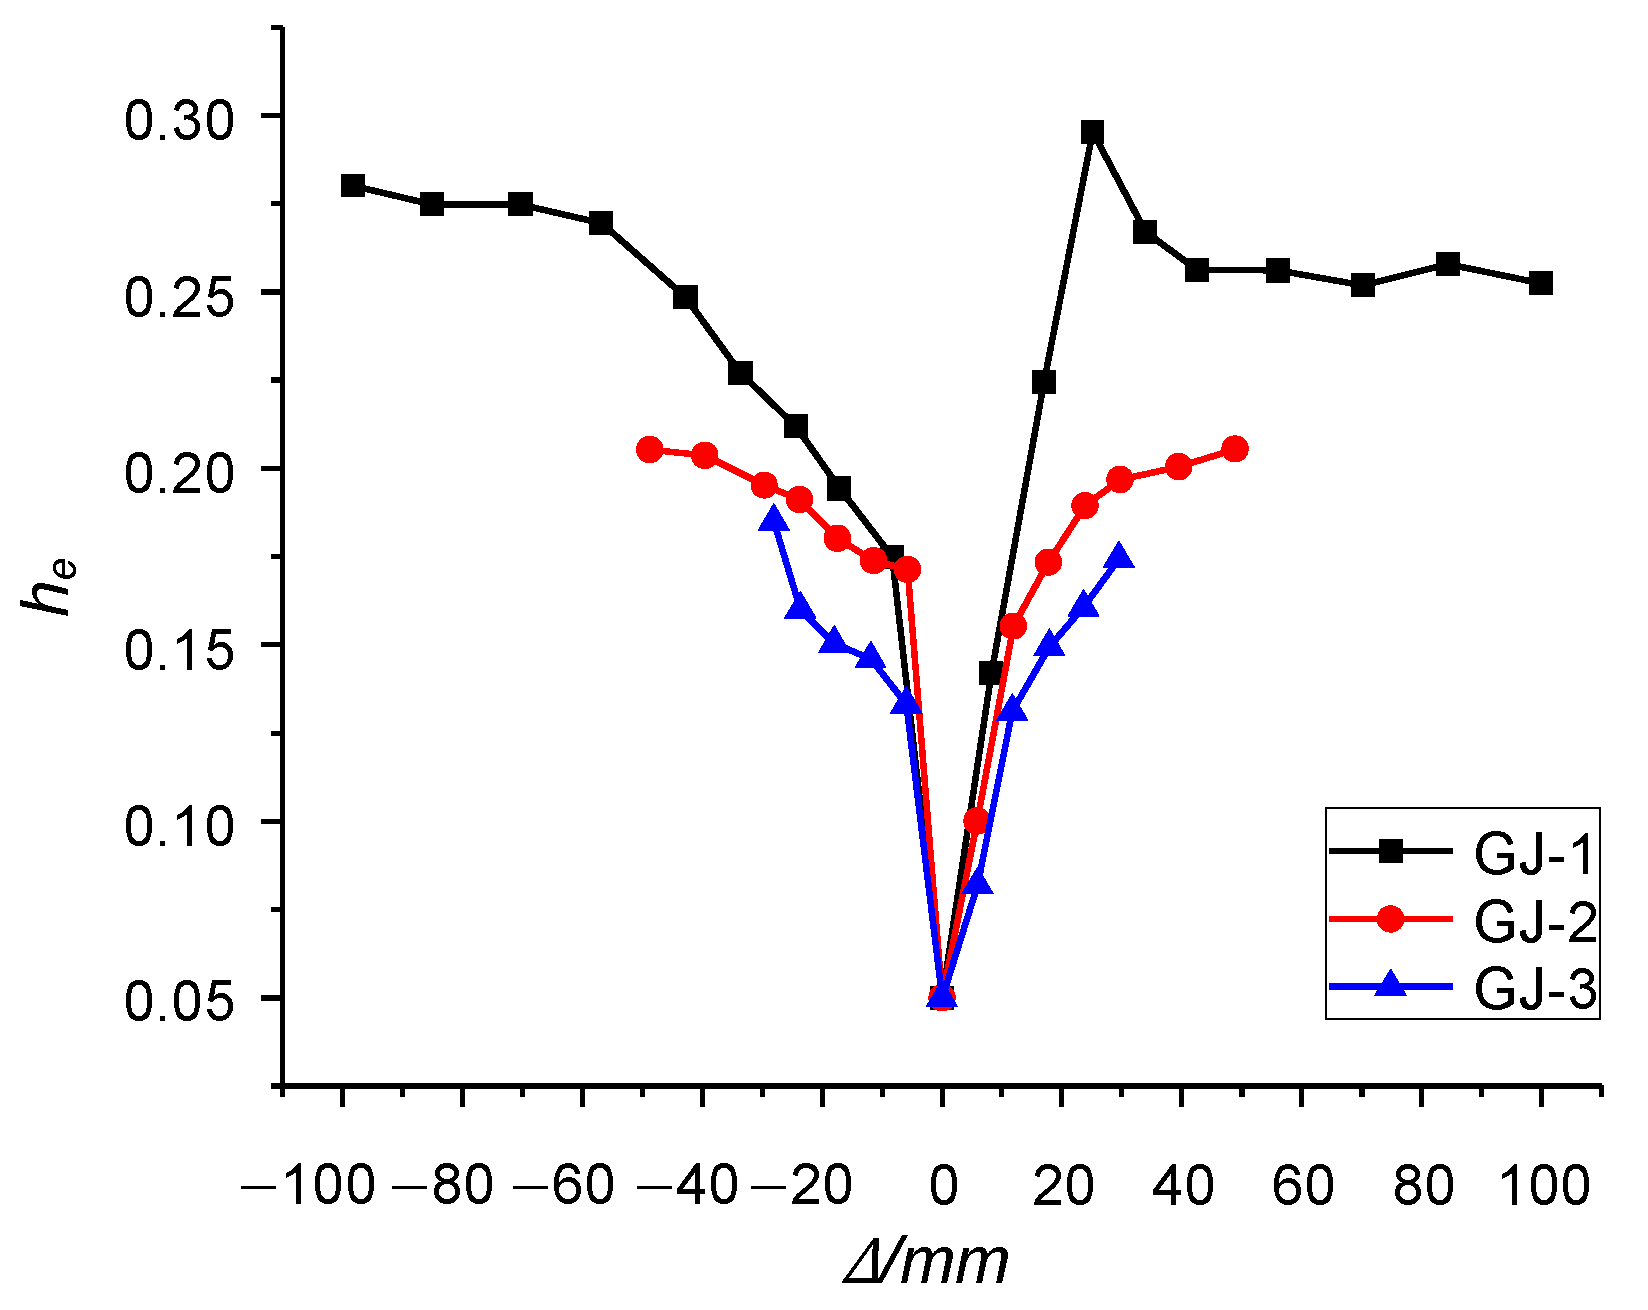
3.5. Equivalent Viscous Damping Coefficient of Three Components GJ-1,GJ-2, and GJ-3

The energy dissipation capacity is determined by the area enclosed by the P curve; that is, the larger the area enclosed by the hysteretic loop, the stronger the energy dissipation capacity of the structure. It is usually measured by the equivalent viscous damping coefficient h e , which can be calculated by Formula (15).
h e = 1 2 π × S ( ABC + ACD ) S ( OBE + ODF )
where S ( ABC + ACD ) is the area enclosed by the hysteretic curve in Figure 10; S ( OBE + ODF ) is the sum of the areas of the triangle OBE and ODF in Figure 10.
The variation in the equivalent viscous damping coefficient h e with the displacement at the top of three components is shown in Figure 11. When GJ-1 is loaded in the positive direction, it tends to increase with the increase in loading displacement. When the loading displacement reaches 23.135 mm, it reaches the peak value. At this time, the load-carrying capacity is almost the same as the peak value, then it starts to decline, and finally tends to be stable. When GJ-1 is loaded in the negative direction, it shows an upward trend. The slope is relatively large at the beginning and almost the same as that of the negative direction. With the increase in displacement, the damage to concrete increases and the slope becomes smaller, then finally becomes stable. The positive and negative loading conditions of GJ-2 are roughly the same. They all rise rapidly at the beginning. When the component reaches the peak load-carrying capacity, the growth rate starts to decrease, and finally tends to be stable. The curve shows an upward trend generally. The positive and negative loading of GJ-3 is slightly different. Both rise rapidly at the beginning. When the component reaches the peak load-carrying capacity under positive loading, the growth rate starts to decrease, and the curve generally shows an upward trend. However, in the final stage of negative loading, the slope of growth becomes even larger. The equivalent viscous damping coefficient h e of GJ-1 in the three members is significantly greater than that of GJ-2 and GJ-3. At the beginning of loading, the growth slope of GJ-1 is the fastest under positive loading. When loading in the negative direction, the growth slopes of the three are roughly the same. However, the equivalent viscous damping coefficient of GJ-1 can still maintain a large slope and continue to grow after the members reach their respective peak load-carrying capacity. In addition, both the growth slope and the numerical value are obviously larger than those of GJ-2 and GJ-3. It can be determined that GJ-1 has the best energy dissipation capacity, GJ-2 takes second place, and GJ-3 is the worst among the three.

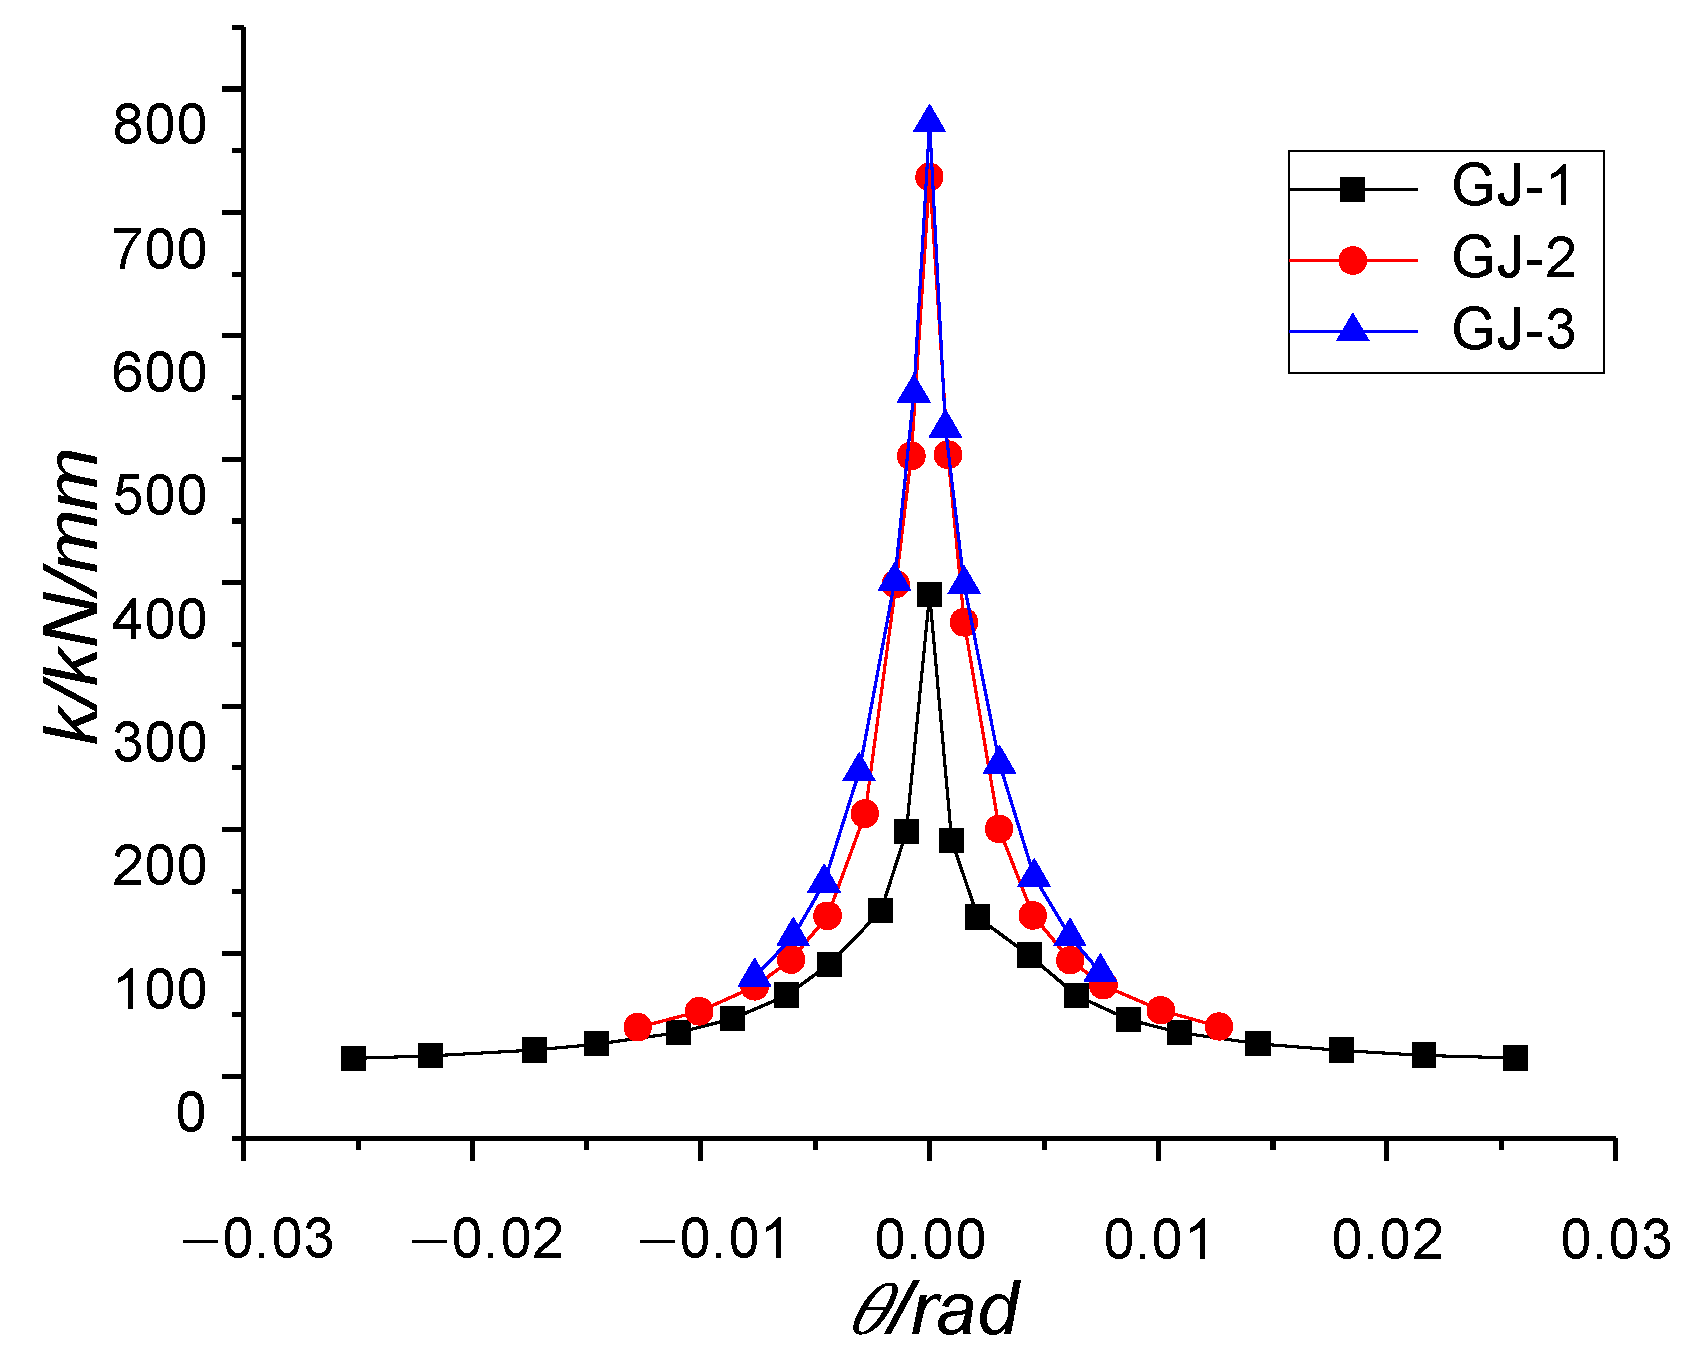
3.6. Stiffness Degradation Analysis of Three Components GJ-1, GJ-2 and GJ-3

It can be obtained from the analysis of model results that the stiffness K of the three types of components varies with the turn angle θ in a certain way, and the entire attenuation process of the components can be roughly divided into three stages:
  • Stiffness rapidly dropping stage: From the beginning of the first concrete plastic strain element to all the concrete on a certain line shows obvious plastic strain (corresponding to the development process from micro-cracks to visible cracks in the test).
  • Stiffness falling at medium speed stage: From the occurrence of obvious plastic strain at the main stress part of the component to the obvious yield of the entire component.
  • Stiffness slowly decreasing stage: From the obvious yield of the component to the maximum nonlinear deformation of the component.
The K θ curves of the three types of components are shown in Figure 12, where the stiffness K is equal to the horizontal force P divided by the loading displacement at the corresponding time, and θ = / H ( H is the height of the component). GJ-1 has an obvious stiffness rapidly dropping stage, stiffness falling at medium speed stage, and stiffness slowly decreasing stage. The three stages correspond to the three stages of cracking, yielding, and failure, respectively. The first stage is short, while the third stage is relatively long, indicating that GJ-1 has good ductility. GJ-2 is similar to GJ-1. It also has three obvious stages, but the third stage is relatively short. This indicates that GJ-2 still has some deformation capacity after reaching the peak load-carrying capacity, but it is not excellent. It can be seen that GJ-3 has only two stages, but does not have the stiffness slowly decreasing stage. Because GJ-3 is an ordinary low-rise concrete shear wall with poor ductility, the load-carrying capacity of the member quickly drops to 85% after reaching the peak value. At this time, the component is damaged. It shows obvious brittleness in the whole failure process, so it does not have the third stage.
The initial stiffness of GJ-1 is the smallest among the three members, which is about half of that of GJ-3. The stiffness degradation rates of GJ-2 and GJ-3 are roughly the same at the initial stage of loading and both are greater than that of GJ-1. In the final failure stage, the stiffness of the three members is almost the same, but the corresponding value of the turn angle θ is quite different. It can be concluded that GJ-1 has much more ductility than GJ-2 and GJ-3, and its energy-dissipating capacity is better than the latter two. The stiffness of GJ-1 decreases slowly after reaching the peak load-carrying capacity, which is beneficial for the structure’s absorbance of energy during earthquakes.

3.7. Energy-Dissipating Capacity Analysis of Three Components GJ-1, GJ-2, and GJ-3

The cumulative dissipated energy of the three components under the loading of each cycle is shown in Figure 13. To compare the differences of each model in the same loading process, the ordinate is the cumulative energy value of the loading cycle, which can be expressed as Σ i = 1 n E i , where n is the number of cycles.
It can be seen from Figure 13 that before failure, the energy dissipation and cumulative energy dissipation of each cyclic loading of the model grow with the increase in displacement, and the growth rate is gradually accelerating. For the first 10 cycles, the energy-dissipating capacities of GJ-2 and GJ-3 are almost the same but less than that of GJ-1. However, in the subsequent cycle loading, due to GJ-2 having more ductility than GJ-3, the maximum loading displacement is greater than that of GJ-3. Therefore, GJ-2 dissipates more energy than GJ-3. Compared with GJ-2, GJ-1 is superior to GJ-2 in energy dissipation throughout the loading process. When the loading displacement is relatively small, the energy dissipation capacity of the three components has little difference. When the loading displacement continues to increase, the cumulative energy dissipation growth rate of GJ-1 is significantly greater than that of GJ-2 and GJ-3.

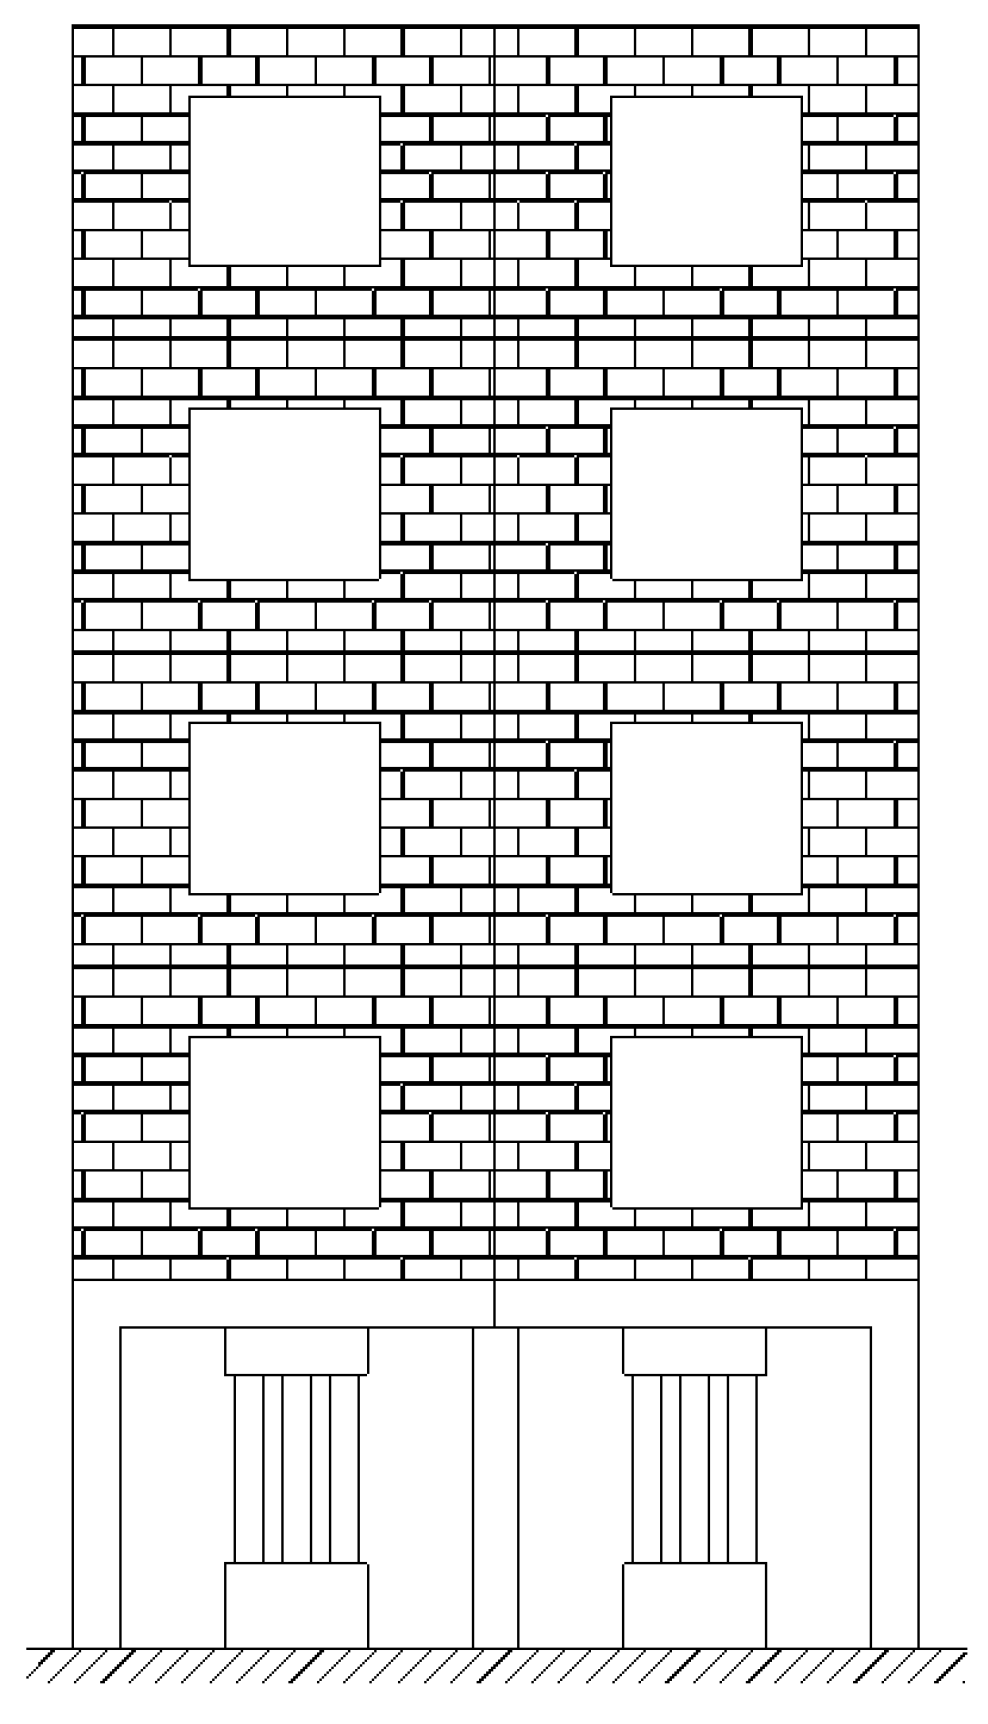
4. Seismic Performance of a Masonry Structure with RC Frames on the First Story with CFST Dampers

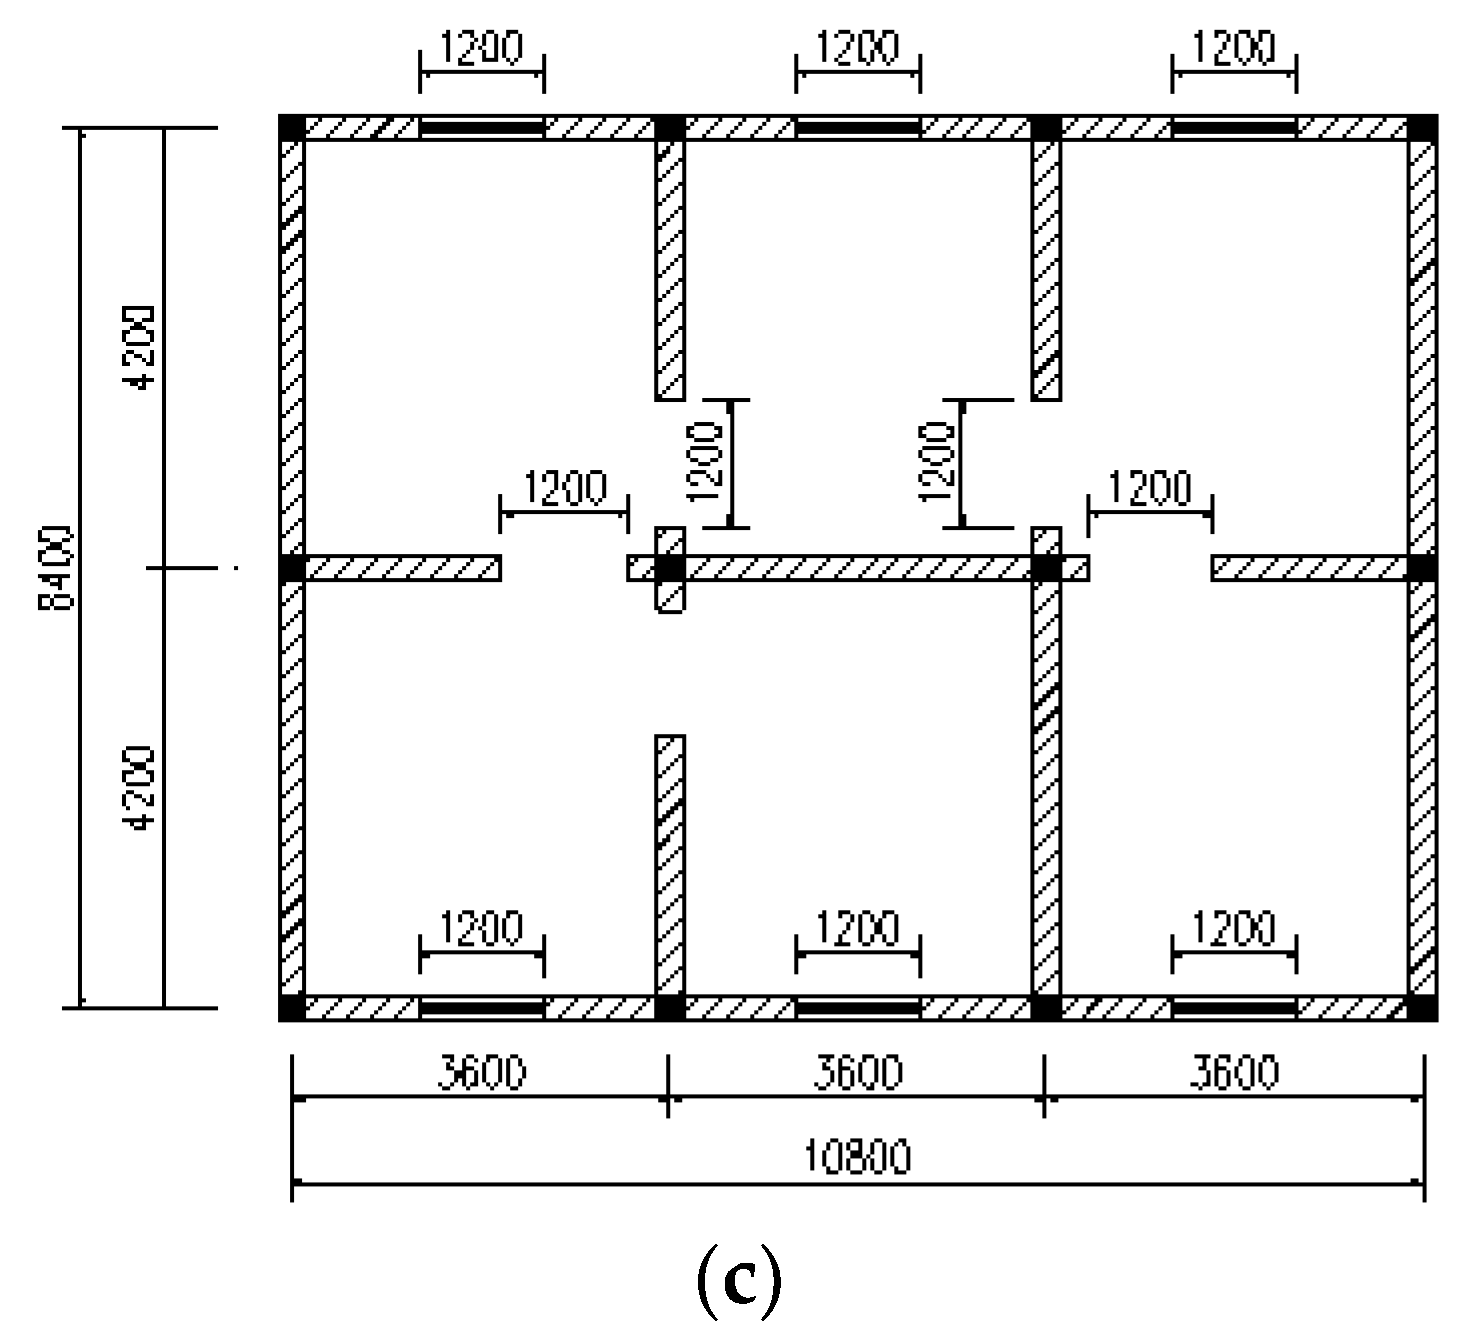
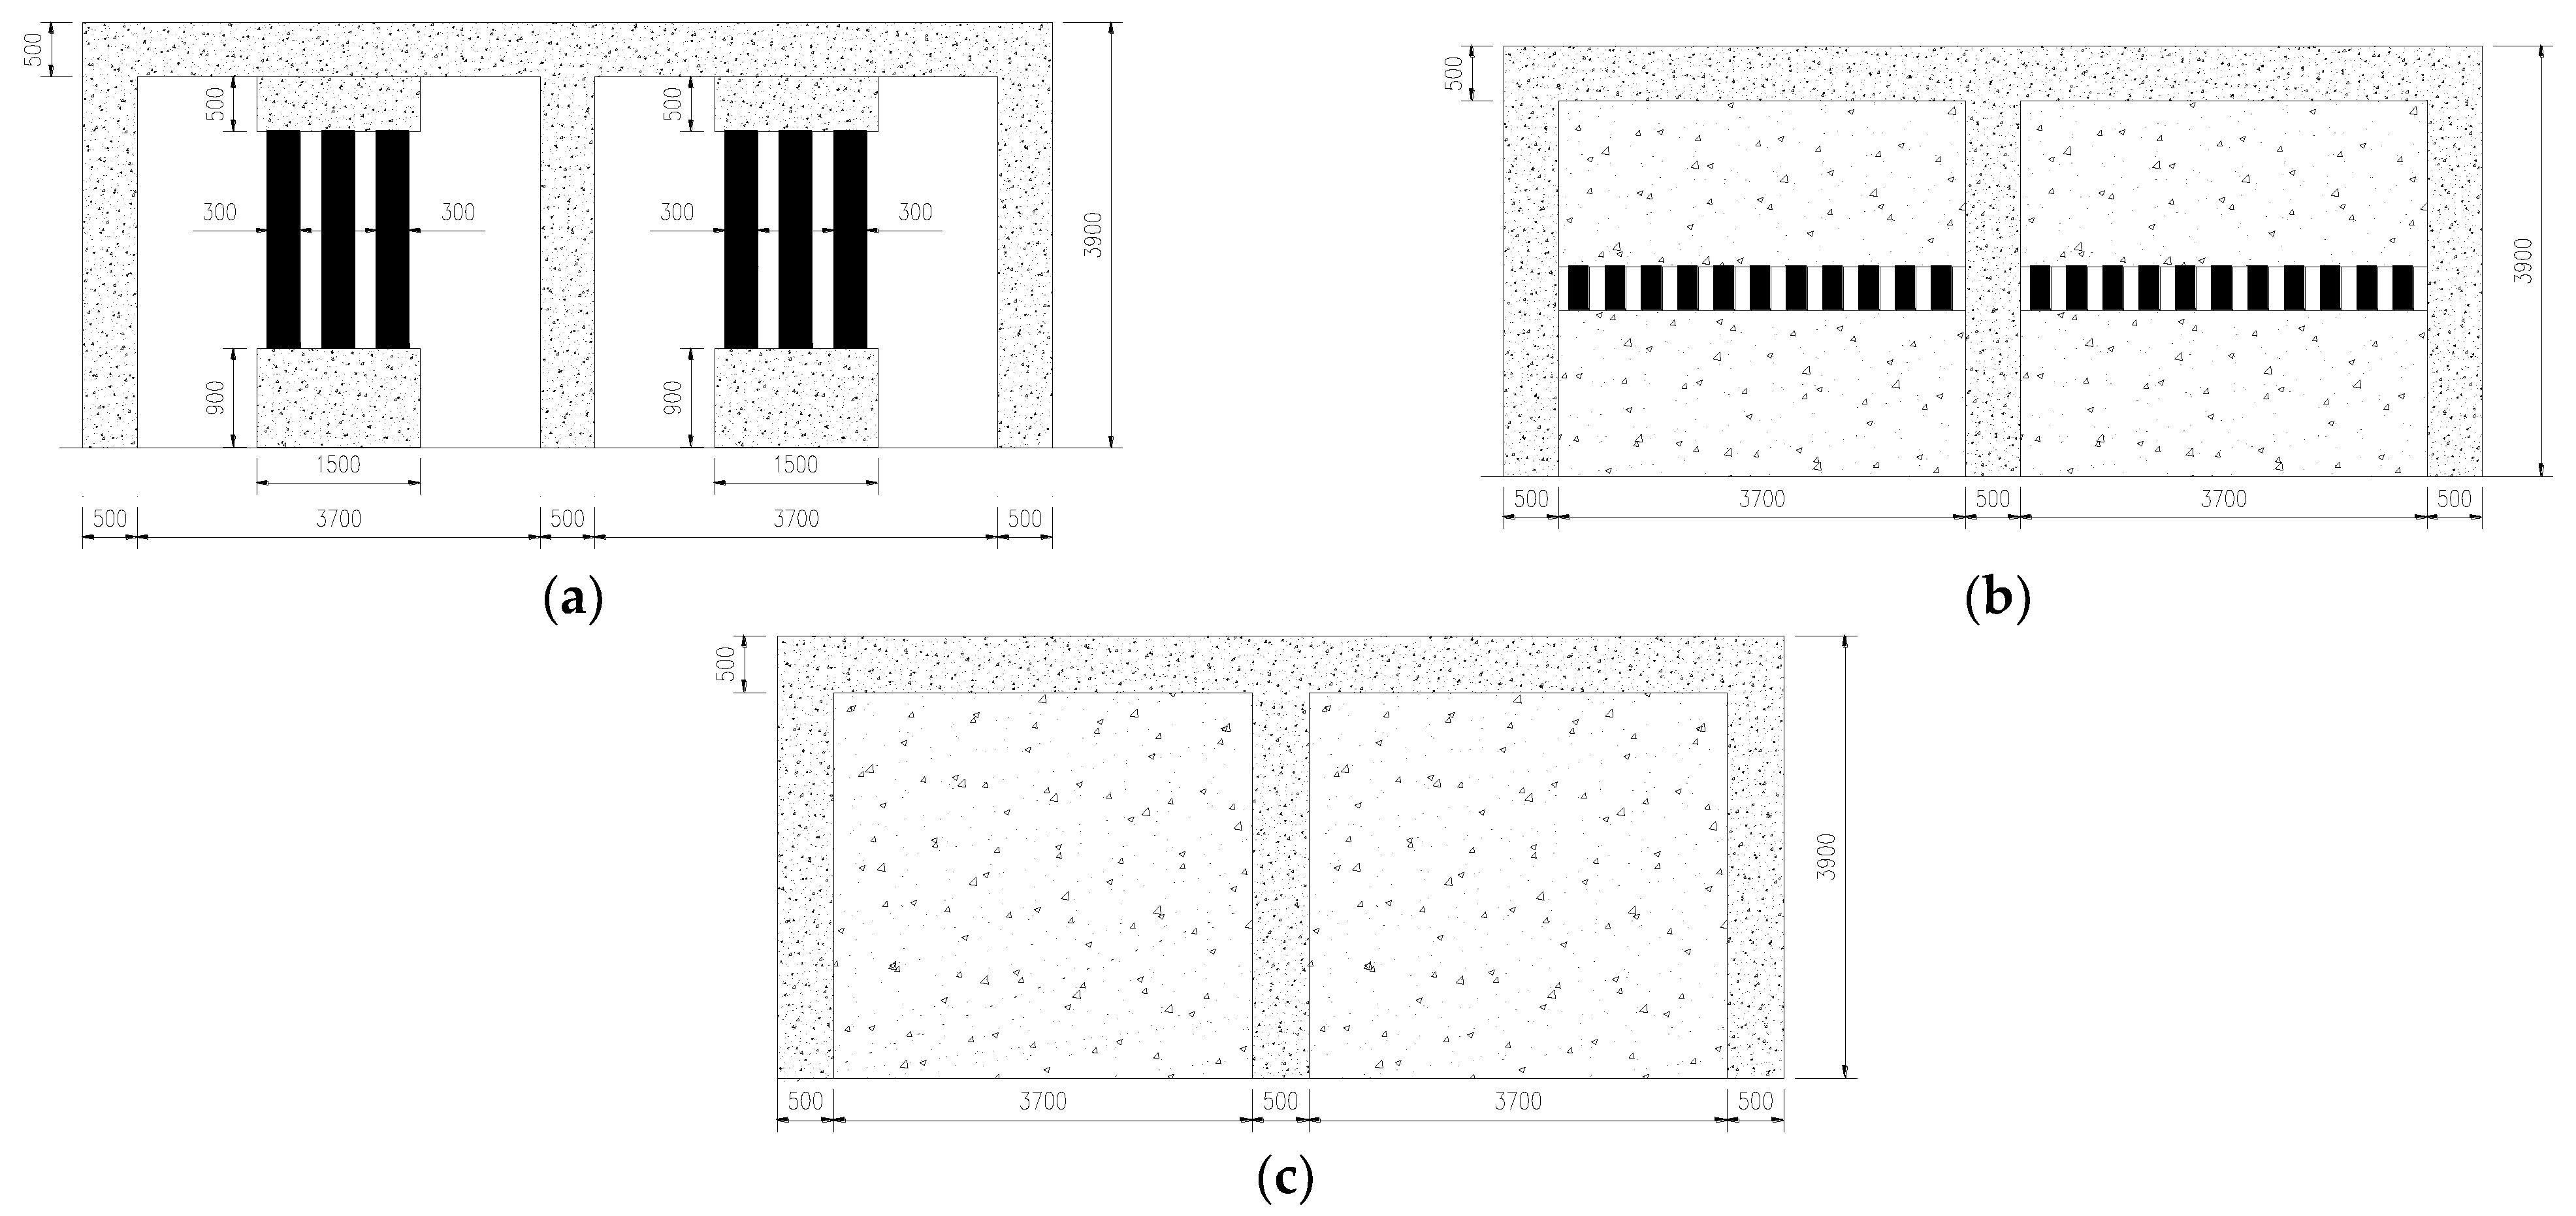
4.1. Design Information of Three Masonry Structures JG-1, JG-2, and JG-3

The masonry structure with RC frames on the first story with CFST dampers is illustrated in Figure 14. According to the Code for Design of Concrete Structures (GB 50010-2010), the masonry structure with RC frames on the first story with CFST dampers (JG-1), the masonry structure with an energy-dissipated low-rise concrete shear wall with CFST short columns (JG-2), and the masonry structure with an ordinary low-rise concrete shear wall (JG-3) were designed. Using the finite element numerical analysis method, the seismic response of JG-1 was compared with JG-2 and JG-3 to verify that the masonry structure with RC frames on the first story with CFST dampers (JG-1) has better seismic performance. The structural plane layouts of JG-1, JG-2, and JG-3 are illustrated in Figure 15, and the elevation layouts of the first story of the three structures are illustrated in Figure 16.
The building model of a masonry structure with RC frames on the first story has five stories, and the seismic fortification category is Class C. The story height of the bottom frame structure is 4.2 m, and the height of each story of the second to the fifth stories is 3.3 m. The height of the parapet wall is 0.5 m, and the total height of the building is 17.4 m. The seismic fortification intensity is Intensity 8, and is in the second Design Seismic Group and the Site-ClassⅡ. The characteristic period of the site is Tg = 0.40 s. The concrete strength grade of the bottom frame column and beam, ring beam, and constructional column in the upper masonry structure and floor slab is C30, C25, and C30, respectively. The masonry strength grade is MU10, and the mortar strength grade is M5. The grade of load-bearing reinforcement of the bottom frame beam and column is HRB400, and the stirrup is HPB300. The section of the frame column, frame beam, constructional column and ring beam is 400 mm × 400 mm, 250 mm × 500 mm, 240 mm × 190 mm, and 240 mm × 180 mm, respectively. The thickness of the transition floor slab, roof slab, and other floors is 120, 120, and 100 mm, respectively. The thickness of the masonry wall is 190 mm. The standard value of the permanent load of the floor and roof is 4.0 and 6.0 KN/m2, respectively. The standard value of the variable load of the floor and roof is 2.0 and 0.5 KN/m2, respectively (the roof is a non-accessible roof). Modal analysis of the three structures JG-1, JG-2, and JG-3 is shown in Table 3. The three waves (El-Centro wave, Taft wave, and TJYY wave) were selected as the input seismic waves with an amplitude modulation of 400 cm/s2. The Fourier spectrum of three waves are illustrated in Figure 17.

4.2. Result Analysis of Three Structures JG-1, JG-2, and JG-3

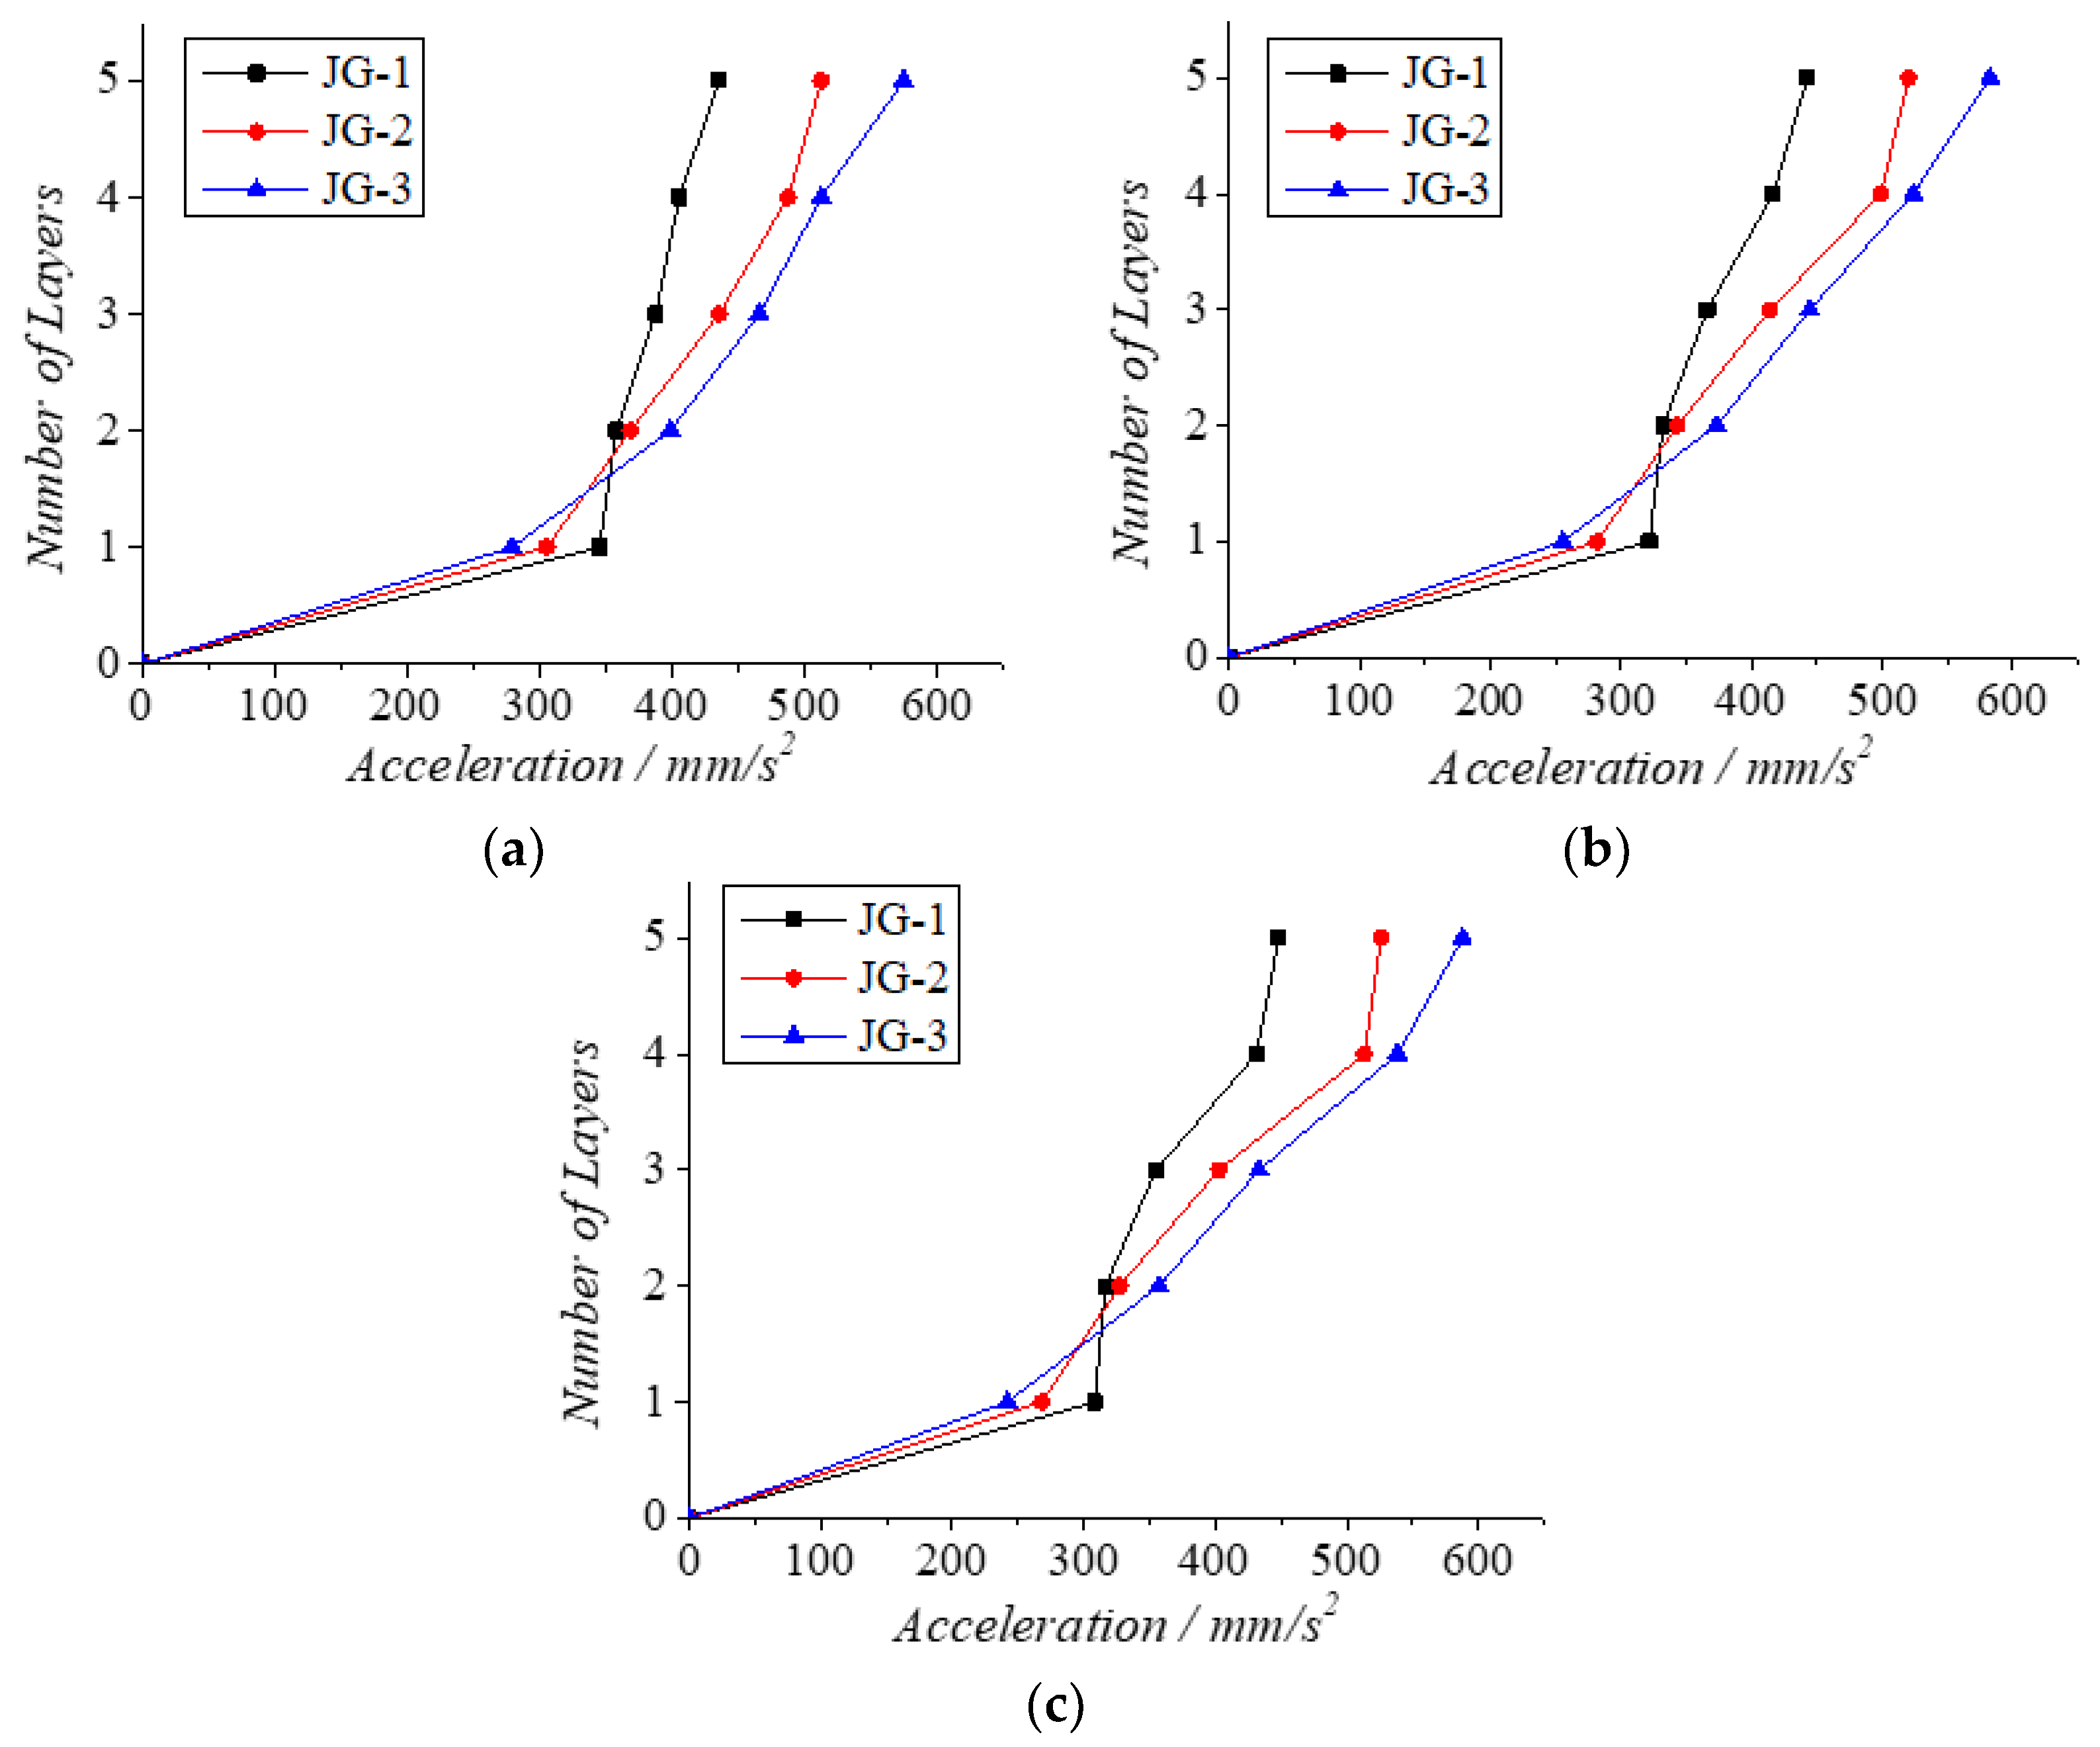
4.2.1. Acceleration of Three Structures JG-1, JG-2, and JG-3

It can be seen from Figure 18 that for the first story, the maximum acceleration of JG-1 is greater than that of JG-2 and JG-3, but the difference is not significant, with an increase of 14% and 25%, respectively. For the upper masonry layer, the maximum acceleration of JG-1 is less than that of JG-2 and JG-3, and the difference increases with the increase in the number of floors. Compared with JG-2 and JG-3, the maximum acceleration of the top floor of JG-1 is reduced by 17% and 32%, respectively. It can be concluded that the upper masonry is protected in JG-1, and the seismic response is reduced, thus providing an excellent energy-dissipating effect.

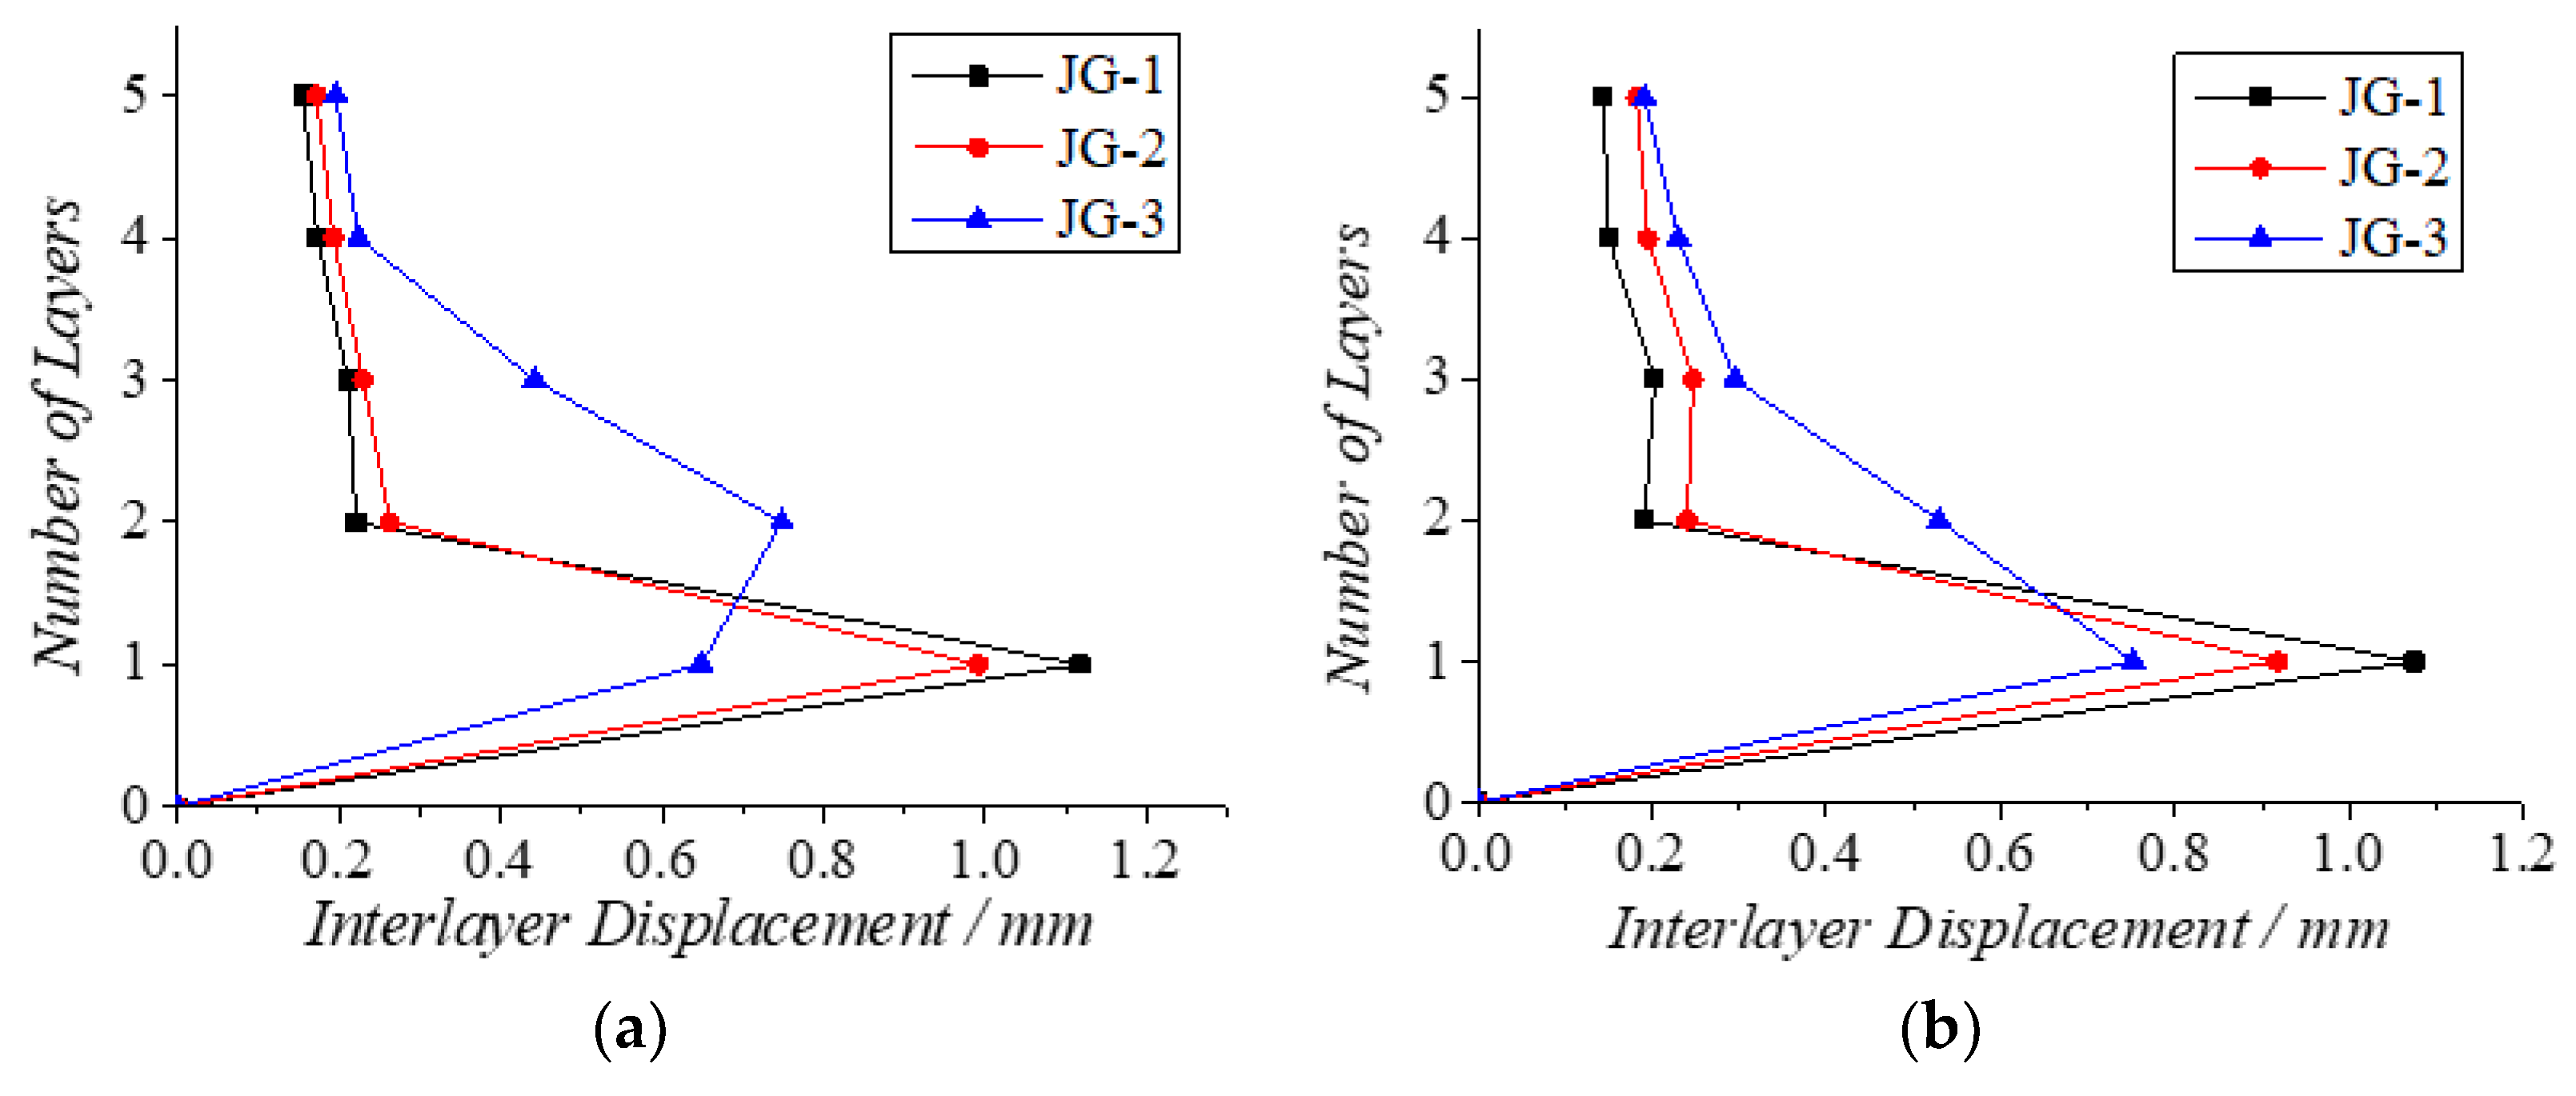
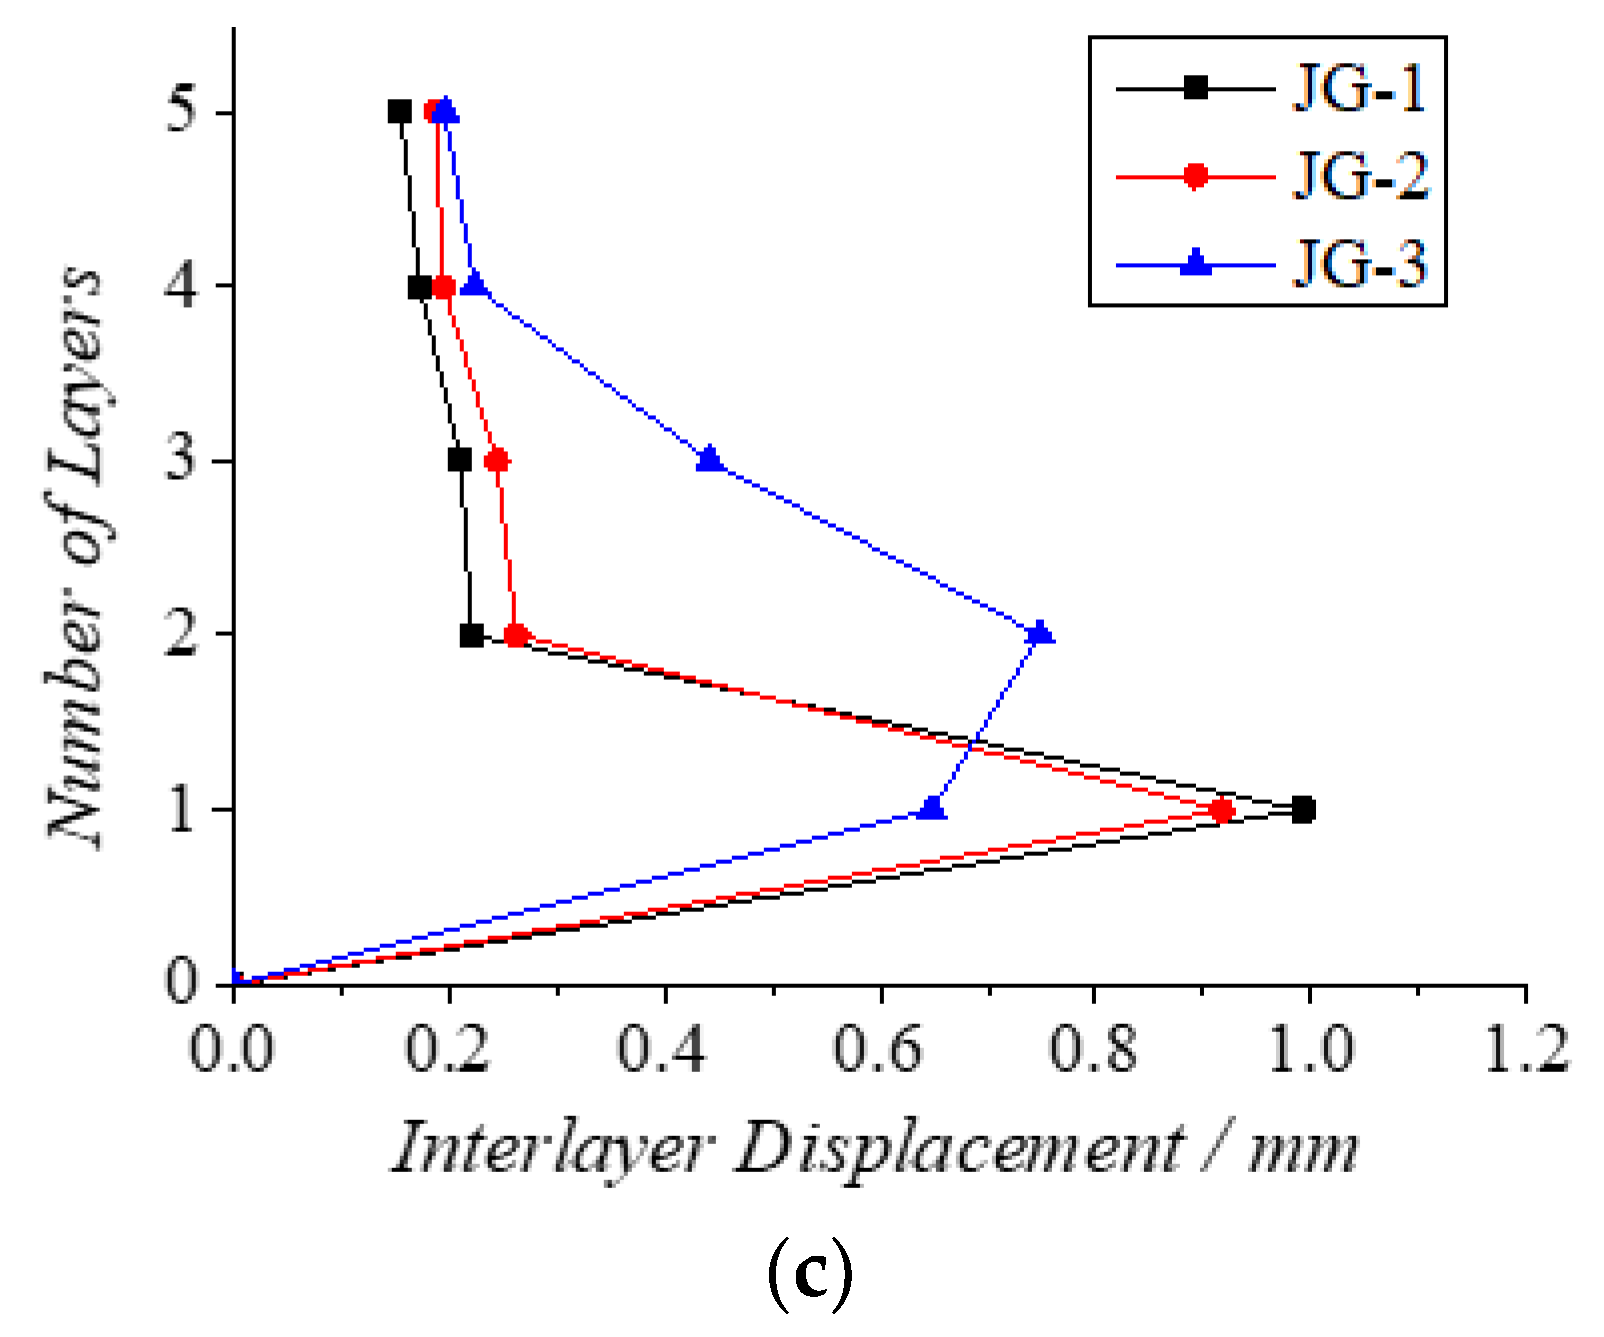
4.2.2. Interlayer Displacement of Three Structures JG-1, JG-2, and JG-3

It can be seen from Figure 19 that due to the large lateral stiffness of the upper masonry structure, the interlayer displacement of JG-1 and JG-2 is greater on the first story than that of the upper layers. Under the action of the EL-Centro wave and TJYY wave, the maximum interlayer displacement of JG-3 appears on the second story, which is due to the large stiffness of the frame structure with a shear wall on the first story, resulting in the large interlayer displacement of the upper part of the structure.
Compared with JG-2 and JG-3, JG-1 has a large interlayer displacement on the first story, but the interlayer displacement on the second story is significantly reduced, and the interlayer displacement of the upper masonry of JG-1 is smaller than that of JG-2 and JG-3.
The displacement of JG-1 on the first story is slightly larger under the earthquake action, but the response of the upper masonry structure is relatively light. The displacement of JG-2 on the first story is slightly smaller than that of JG-1 (and can be ignored), but the interlayer displacement of the upper masonry structure is larger than that of JG-1. Due to the large stiffness of JG-3 on the first story, the displacement response on the first story is reduced, but the interlayer displacement of the upper masonry structure is increased. Considering the interlayer displacement of each story, JG-1 has the least damage and the best anti-seismic efficiency.

4.2.3. Maximum Layer Displacement of Three Structures JG-1, JG-2, and JG-3

The maximum layer displacement of the three structures under the action of three seismic waves is shown in Figure 20.
For the first story, the maximum layer displacement of JG-1 is greater than that of JG-2 and JG-3. For the upper masonry layer, the maximum layer displacement of JG-1 is less than that of JG-2 and JG-3, and the reduced value increases with the increase in the number of floors. It can be concluded that the slight seismic response of the upper part of JG-1 is attributed to the protection of the CFST damper. The CFST dampers reduces the seismic response and has a good damping effect.
Compared with JG-2 and JG-3, the elastic stiffness and ultimate bearing capacity of JG-1 do not decrease much, but its deformation and energy dissipation capacity are both greatly improved, and its seismic performance is significantly improved. It can make full use of the excellent hysteretic performance of the CFST ductile column, dissipating seismic energy and protecting the upper masonry structure from damage to a certain extent, while the first story does not have excessive displacement.

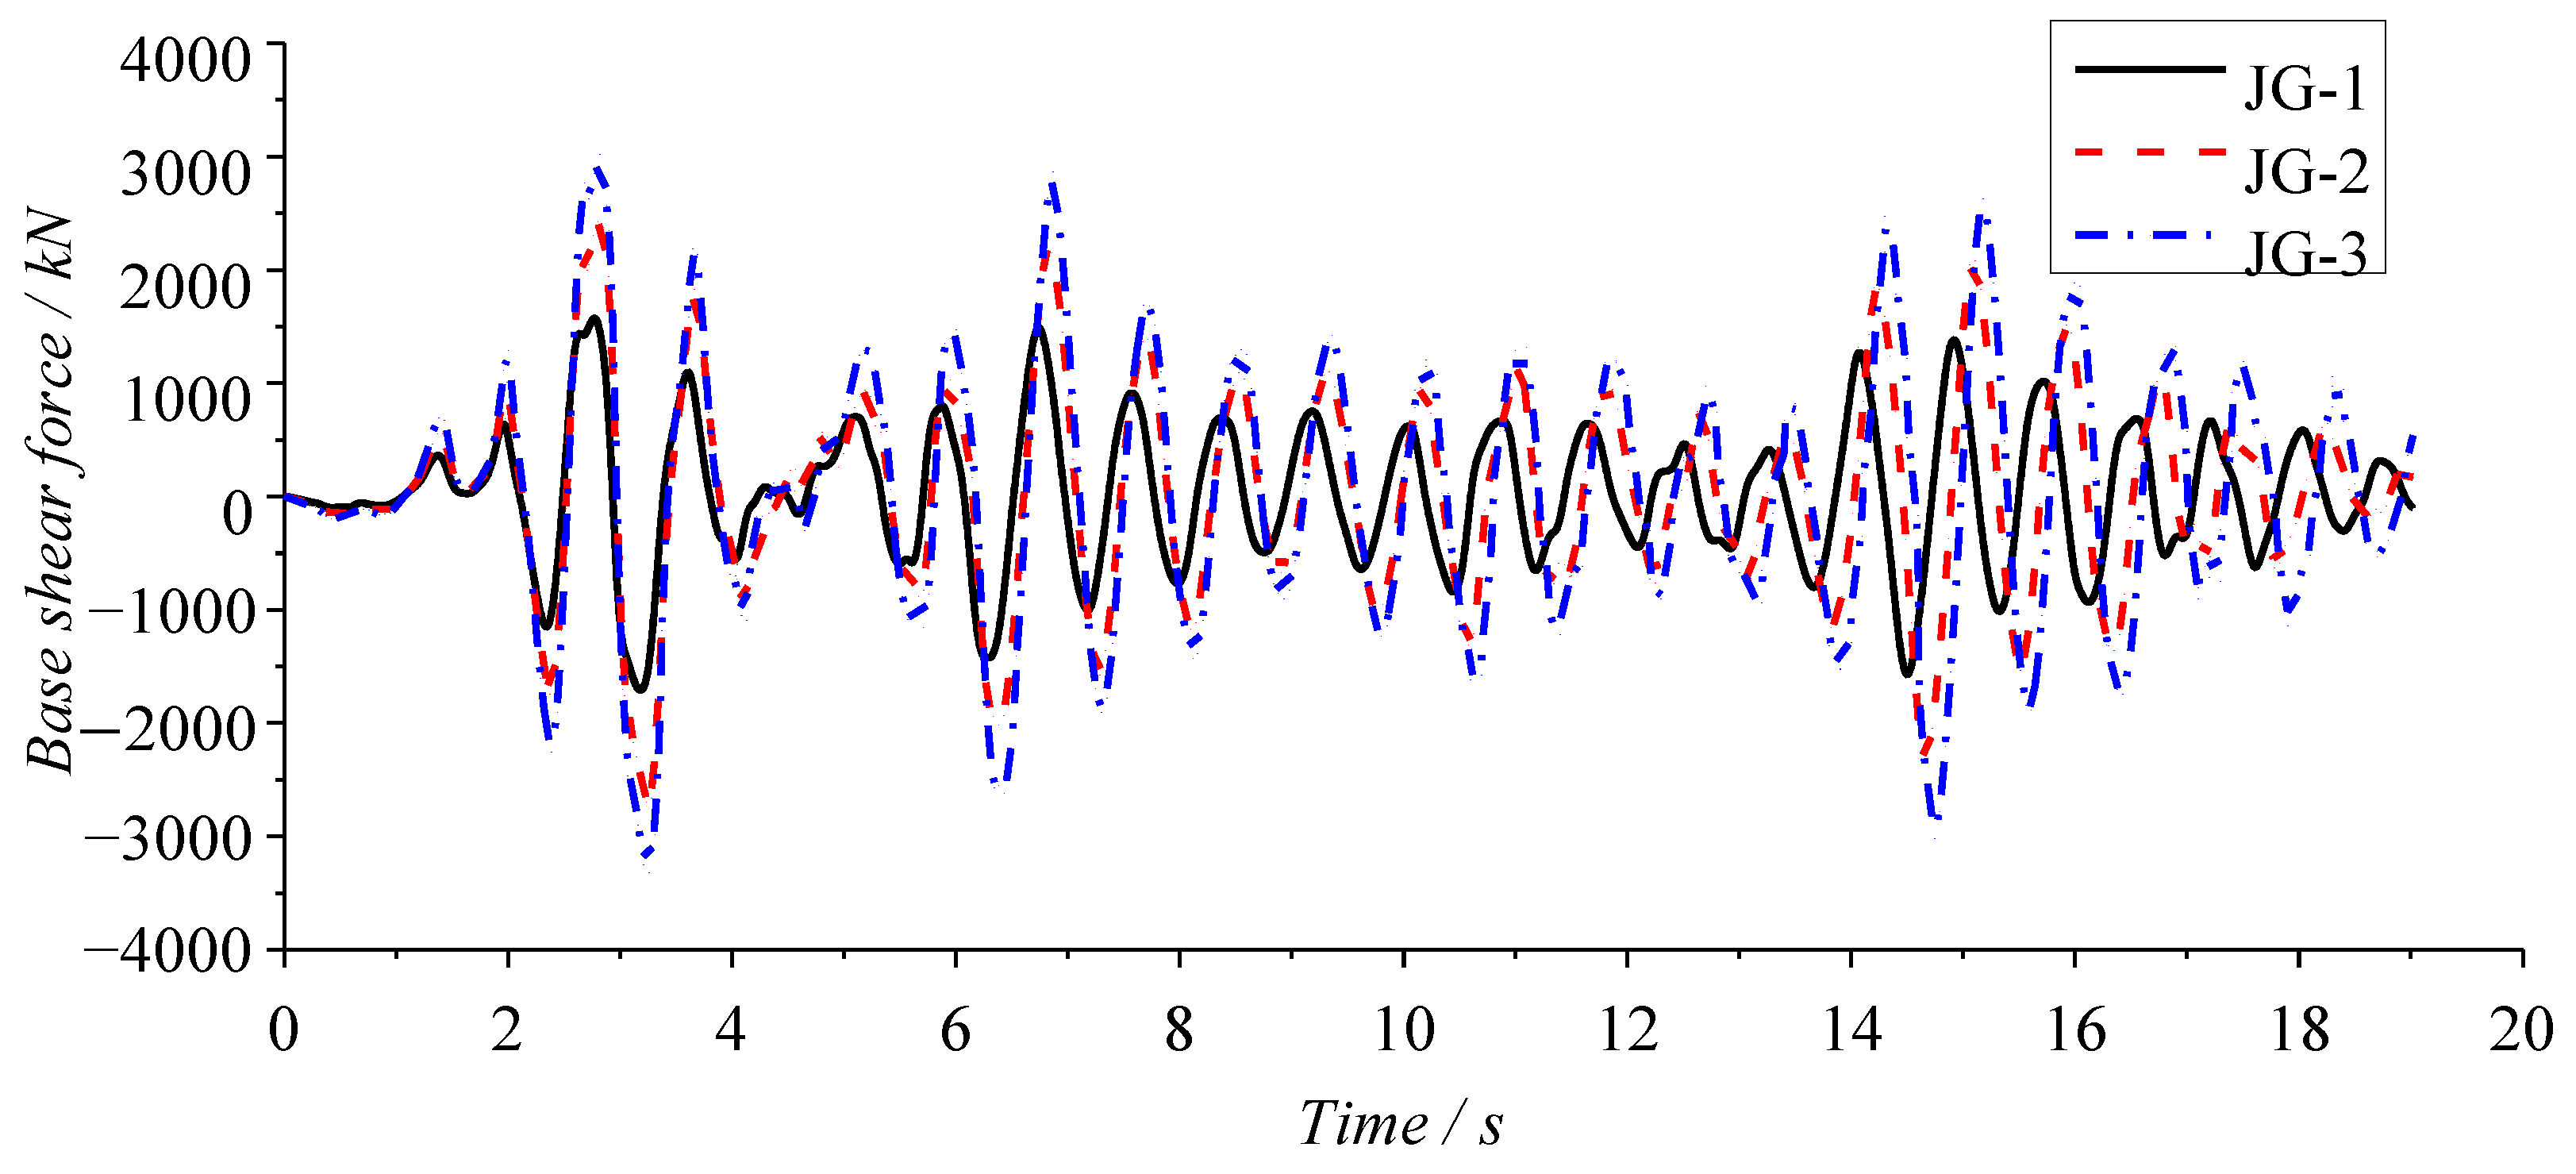
4.2.4. Base Shear Analysis of Three Structures JG-1, JG-2, and JG-3

The comparison of base shear time-history curves of three structures under the seismic action of the EL-Centro wave is illustrated in Figure 21.
It can be seen from Figure 21 that the amplitudes of the time-history curves of the base shear of the three structures are quite different. Compared with JG-2 and JG-3, the maximum value of the base shear of JG-1 decreases by 36.3% and 48.2%, respectively. The reason for this is that the base shear force of the structure is related to the ductility of the first story. As the JG-1 is equipped with CFST dampers, the first story plays a role in seismic isolation when the structure is under the action of earthquake, which reduces the seismic response of the upper masonry.
It can be seen from Table 4 that when the whole structure of JG-1 is in the elastic stage, most of the base shear force is borne by the CFST dampers, i.e., about 78%. The energy dissipation device is fully utilized to dissipate energy, thus protecting the frame structure of the first story. With the further increase in seismic action, the energy dissipation device yields when the structure enters the plastic deformation stage and cannot bear more base shear. At this time, part of the shear is borne by the frame column, but the base shear ratio borne by the CFST dampers is about 58%, and the effect is still good.
Compared with JG-2 and JG-3, the energy dissipation device in JG-1 bears most of the seismic action, reduces the seismic response of the upper masonry, and has good seismic performance in general.

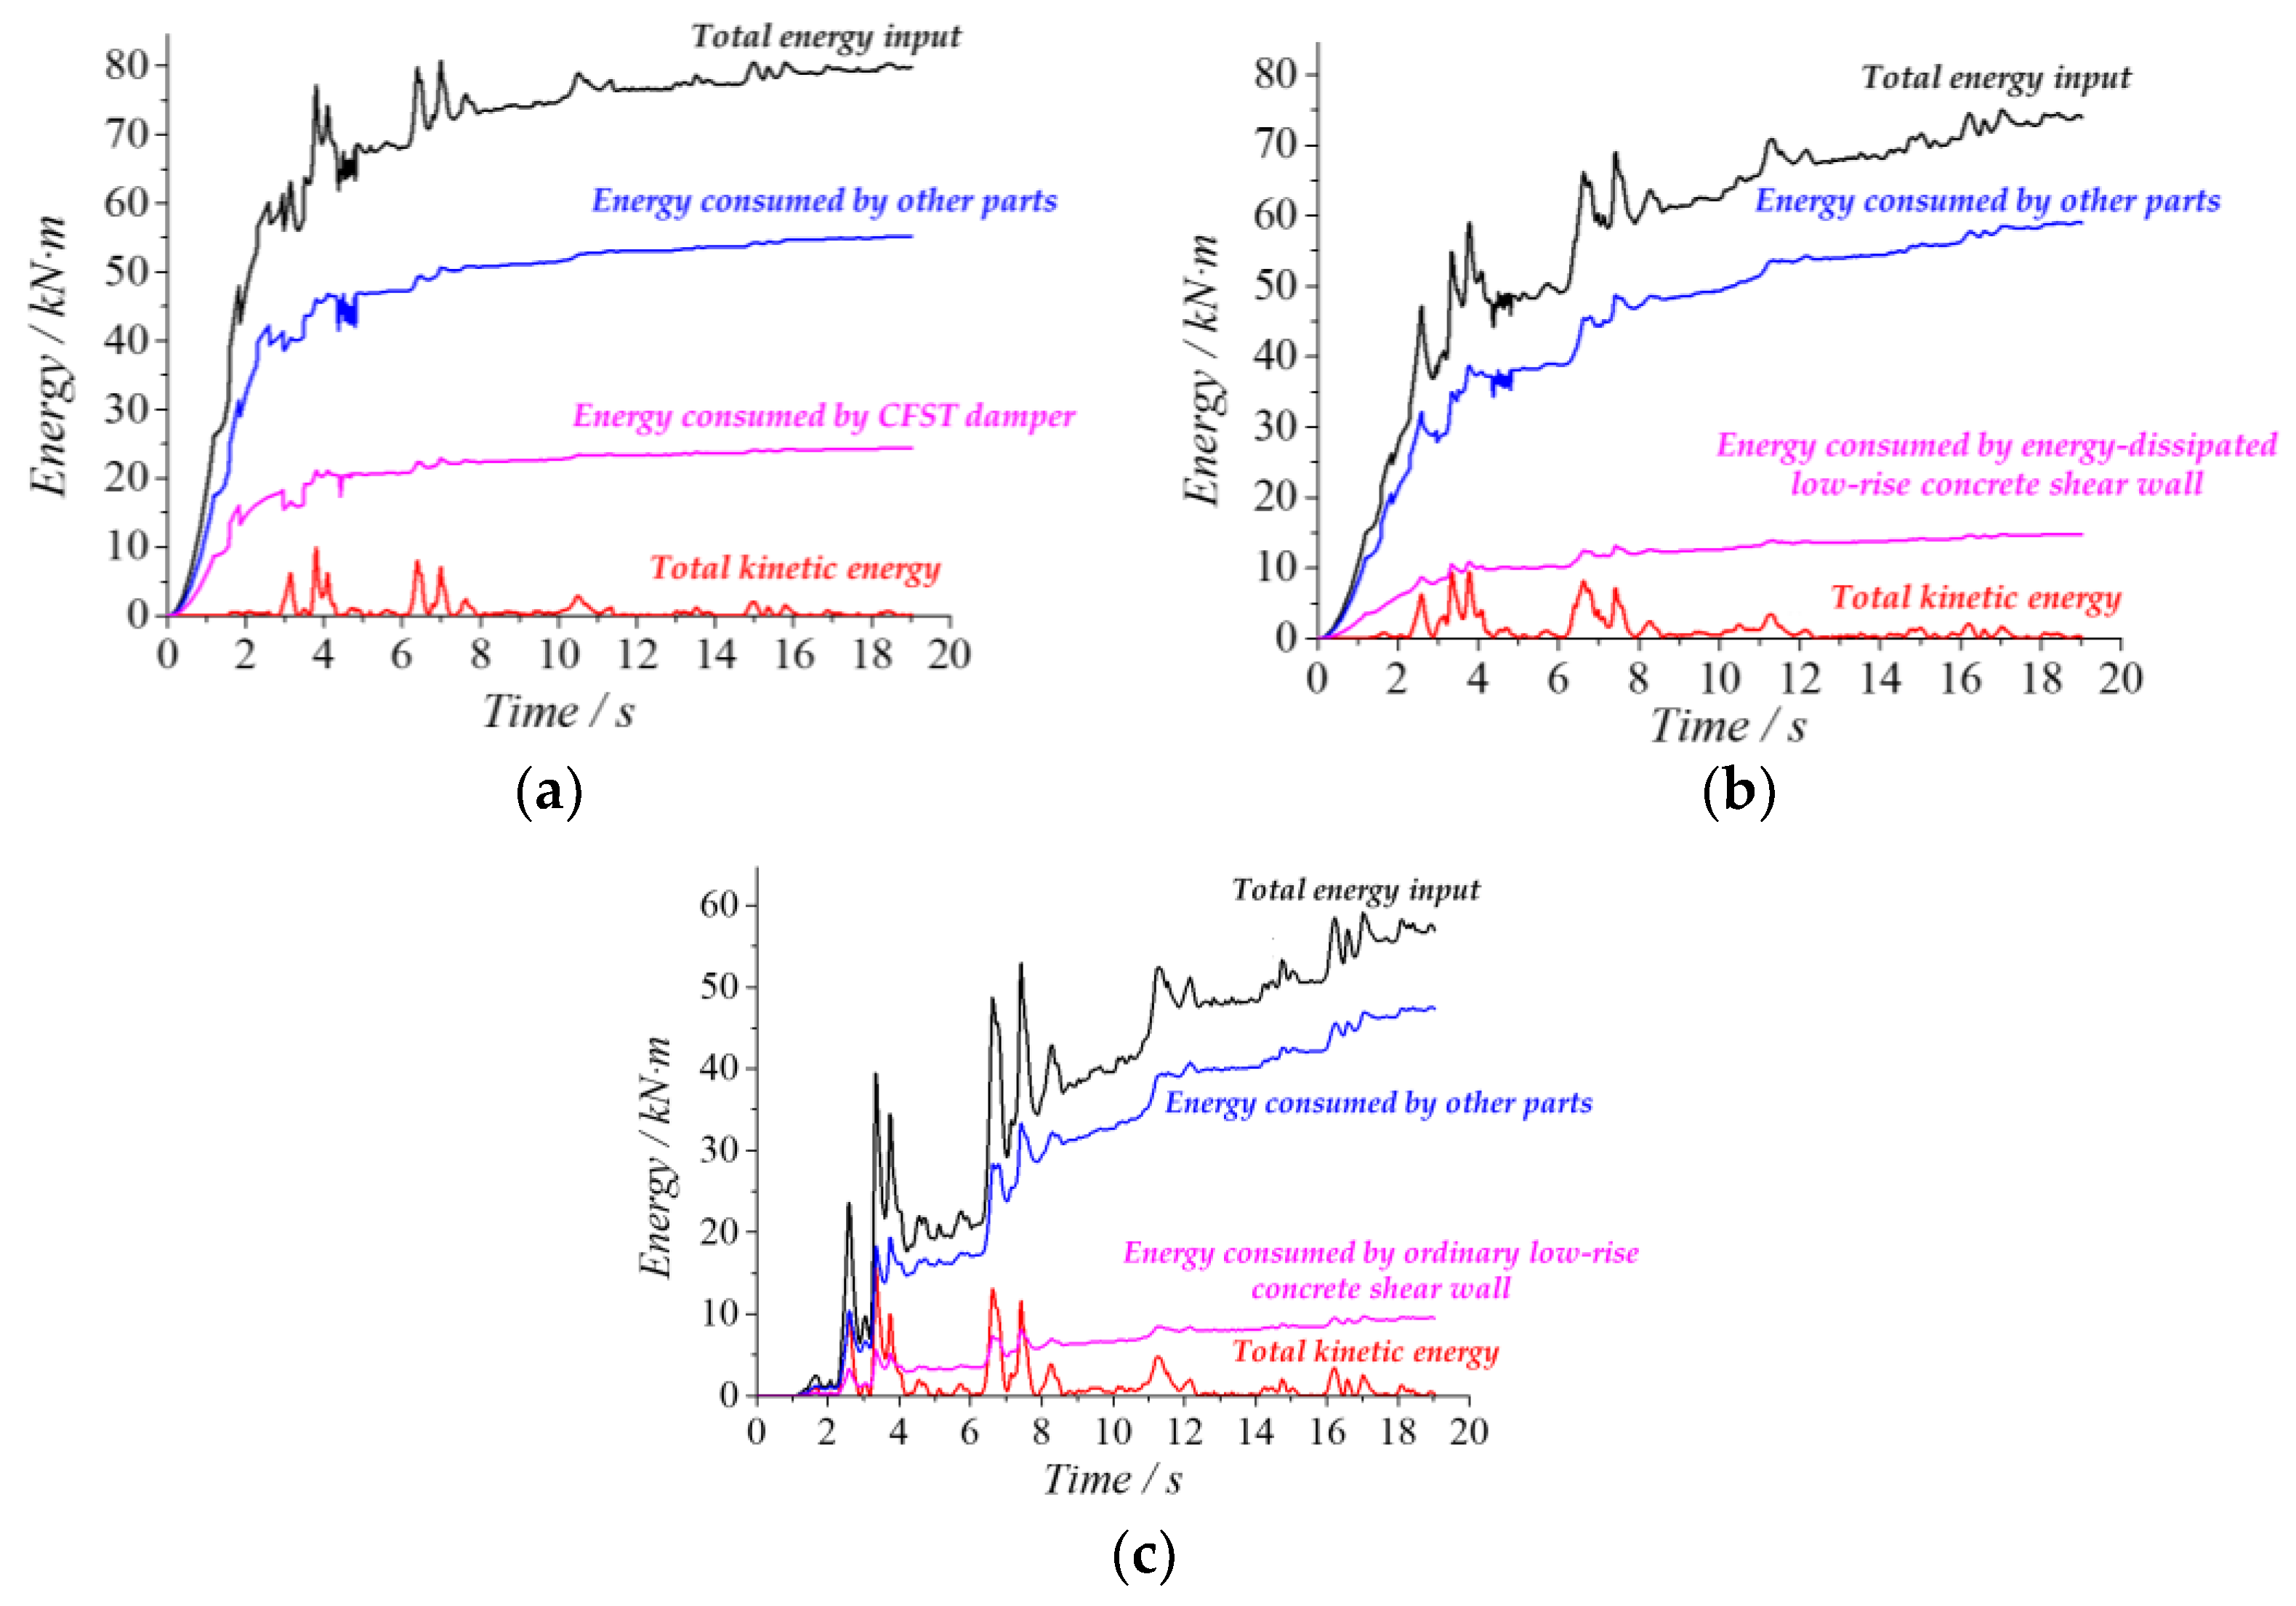
4.2.5. Energy Dissipation Capacity Analysis of Three Structures JG-1, JG-2, and JG-3

Investigating the seismic energy input and dissipation of structures under the action of seismic waves is conducive to understanding the energy dissipation and damping effect of CFST ductile columns in masonry structures with RC frames on the first story.
The nonlinear dynamic response equation of the structure under earthquake action is as follows:
M x + C x + F s = M x g
Left multiplication of both sides of Equation (16) yields:
d x T = d x / d t T d t = x T d t
The following energy balance equation can be obtained after integrating the time in the whole duration t 0 of the earthquake:
1 2 x T M x + 0 t 0 x T C x d t + 0 t 0 x T F s d t = 0 t 0 x T M x g d t
For Equation (17), the first part on the left is the kinetic energy E K during the earthquake; the second part represents the energy E C dissipated by the damping of the structure itself and the energy E D dissipated by the energy dissipation device; and the third part is the accumulated plastic deformation energy stored by the structural frame and the energy dissipation device and the elastic deformation energy during the earthquake. The right side of the above equation is the total energy E I of the seismic wave input to the structure during the entire seismic action time. Seismic energy input and dissipation can be expressed as:
E I = E K + E S + E H + E C + E D
where E I is the total seismic energy input to the structure; E K is the kinetic energy of the structure; E S is the elastic deformation energy of the structure; E H is the hysteretic energy dissipation of the structure; E C is the damping energy dissipation of the structure itself; E D is the energy dissipated by the energy dissipation device.
As can be seen from Figure 22, the energy time-history curves of the three structures first increase and then tend to be stable with the increase in time. From the numerical point of view, the energy dissipated by the CFST dampers in JG-1 is about 1/4 of the total input energy. The energy dissipation device yields earlier than the frame column, which takes the lead in dissipating the earthquake energy and plays an excellent role in energy dissipation. Compared with the other two structures, the energy dissipation capacity of the masonry structure with RC frames on the first story with CFST dampers is significantly increased by 1.25~1.5 times. The CFST dampers can dissipate more seismic energy, thus protecting the main structure from serious damage and improving the seismic performance of the building.

5. Conclusions

In this paper, a structural scheme of placing CFST dampers at appropriate positions on the first story of a masonry structure with RC frames on the first story, instead of ordinary concrete shear walls, was proposed. This scheme can increase the energy dissipation effect of the structure and easily adjust the stiffness of the first story of the structure. In addition, it can also effectively solve the problem of the lack of ductility and energy dissipation capacity of the first story of a masonry structure with RC frames shear walls in an earthquake.
  • Compared with an energy-dissipated low-rise concrete shear wall with CFST short columns and an ordinary low-rise concrete shear wall, the hysteretic loop of the frame with CFST dampers has better solidity, the pinch phenomenon is smaller, the energy dissipation capacity is stronger, and the seismic performance is excellent.
  • When the frame with CFST dampers reaches the peak load-carrying capacity, the load drops most slowly, and the seismic performance is more stable. The deformation and failure modes of multiple single columns in the frame with CFST dampers are basically consistent and have excellent cooperative working performance.
  • The masonry structure with RC frames on the first story with CFST dampers has good seismic performance. The amplification effect of the deformation angle allows the CFST dampers to play a significant role in energy dissipation whereas the main structure still undergoes a small deformation. The CFST dampers can effectively share the seismic effect and protect the structural components well.
  • The energy dissipation device of CFST dampers yields earlier than the frame column, fully enabling the good hysteretic performance of the energy dissipation device to dissipate seismic energy, to protect the main structure from serious damage. At the same time, the first story does not have excessive displacement and takes the lead in dissipating seismic energy during the earthquake, playing a good role in energy dissipation.
  • Compared with the other two forms of structures, the energy dissipation capacity of the masonry structure with RC frames on the first story with CFST dampers is significantly increased by 1.25~1.5 times. The energy dissipation device can dissipate more seismic energy to protect the main structure from serious damage and improve the seismic performance of the building.
  • The damping effect of CFST dampers applied in a masonry structure with RC frames on the first story needs to be further verified by a shaking table test to improve the seismic design method.

Author Contributions

Conceptualization, Y.Y.; methodology, Y.Y.; software, F.L. and F.W.; validation, Y.Y., F.L. and F.W.; formal analysis, Y.Y. and F.L.; writing—original draft preparation, F.L. and F.W.; writing—review and editing, Y.Y. and F.L.; visualization, Y.Y. and F.W.; project administration, Y.Y.; funding acquisition, Y.Y. All authors have read and agreed to the published version of the manuscript.

Funding

This research received no external funding.

Institutional Review Board Statement

Not applicable.

Informed Consent Statement

Not applicable.

Data Availability Statement

Not applicable.

Conflicts of Interest

The authors declare no conflict of interest.

References

  1. Feng, L. Theoretical Study and Finite Element Analysis of Shear Capacity of SRC Low-Rise Shear Wall. Master’s Thesis, Chang’an University, Xi’an, China, 2019. [Google Scholar]
  2. Deng, M.; Liu, J.; Zhang, Y.; Liu, H.; Jing, W. Investigation on the seismic behavior or steel-plate and high ductile concrate composite low-rise share walls. Eng. Mech. 2021, 38, 40–49. [Google Scholar] [CrossRef]
  3. Zhou, T.; Zhao, D. Investigation and analysis on the damage of masonry buildings in the urban area of Mianzhu during “5·12” Earthquake. J. Xi’an Univ. Archit. Technol. (Nat. Sci. Ed.) 2008, 40, 613–618. [Google Scholar] [CrossRef]
  4. Li, Y.; Han, J.; Liu, L.; Zheng, N.; Wang, L.; Liu, J. Investigation and analysis of masonry building damage caused by the5·12Wenchuan earthquake‚Sichuan Province. J. Xi’an Univ. Archit. Technol. (Nat. Sci. Ed.) 2009, 41, 606–611. [Google Scholar] [CrossRef]
  5. Yang, Y.; Chen, X.; Huang, W. Infulencial factors on seismic resistant behavior of masonry building with RC frame wall in two bottom stories. J. Vib. Shock 2005, 24, 111–113, 143. [Google Scholar] [CrossRef]
  6. Zhao, Q.H.; Astaneh-Asl, A. Cyclic behavior of traditional and innovative composite shear walls. J. Struct. Eng. 2004, 130, 271–284. [Google Scholar] [CrossRef]
  7. Ajrab, J.J.; Pekcan, G.; Mander, J.B. Rocking wall-frame structures with supplemental tendon systems. J. Struct. Eng. 2004, 130, 895–903. [Google Scholar] [CrossRef]
  8. Maruta, M.; Kanda, T.; Nagai, S.; Yamamoto, Y. New High-rise RC Structure Using Pre-cast ECC Coupling Beam. Concr. J. 2005, 43, 18–26. [Google Scholar] [CrossRef] [PubMed]
  9. Xia, Z.M.; Naaman, A.E. Behavior and modeling of infill fiber-reinforced concrete damper element for steel-concrete shear wall. Aci Struct. J. 2002, 99, 727–739. [Google Scholar]
  10. Vaiana, N.; Capuano, R.; Rosati, L. Evaluation of path-dependent work and internal energy change for hysteretic mechanical systems. Mech. Syst. Signal Process. 2023, 186, 109862. [Google Scholar] [CrossRef]
  11. Soong, T.T.; Reinhorn, A.M. An overview of active and hybrid structural control research in the U.S. Struct. Des. Tall Build. 1993, 2, 193–209. [Google Scholar] [CrossRef]
  12. Giannuzzi, D.; Ballarini, R.; Huckelbridge, A.; Pollino, M.; Valente, M. Braced Ductile Shear Panel: New Seismic-Resistant Framing System. J. Struct. Eng. 2014, 140, 04013050. [Google Scholar] [CrossRef]
  13. Tang, X.; Liu, L.; Zhou, Z.; Yang, L. Experimental study on seismic behavior of slitted masonry in-filled reinforced concrete frame structure. J. Build. Struct. 2012, 33, 84–93. [Google Scholar] [CrossRef]
  14. Dai, H.; Guan, G.; Zhang, Y. Studies on the Behavior of Reinforced Concrete Slit Shear Walls. J. Sout Heast Univ. 1997, 27, 41–46. [Google Scholar]
  15. Pan, C.; Weng, D. Seismic analysis and design of damping controlled coupled shear wall with vertical dampers in coupling beams. J. Build. Struct. 2012, 33, 39–46, 93. [Google Scholar] [CrossRef]
  16. Li, A.; Cao, Z.; Ding, D. Analysis of Ultimate Carrying Capacity of Reinforced Concrete Low-Rise Shear Walls with Control Devices. J. Southeast Univ. 1994, 24, 70–74. [Google Scholar]
  17. Li, H.; Xu, Q.; Wu, B. Energy dissipated low-rise concrete shear wall with tube filled with concrete. J. Harbin Univ. C.E.&Archit. 2000, 33, 18–23. [Google Scholar]
  18. Yang, W.; Li, Z.; Ma, H. Seismic behavior of frame with RC damper and lock-up braces. J. Build. Struct. 2008, 38, 65–67. [Google Scholar]
  19. Zhong, S.; Zhang, W.; Tong, Y.; Wu, X.; Liang, J. The Research of Seismic Behaviors for Concrete-Filled Steel Tubular(CFST) Structures. Prog. Steel Build. Struct. 2002, 4, 3–15. [Google Scholar]
  20. Shen, J.; Zhou, X.; Gao, X. Seismic Engineering; China Architecture and Building Press: Beijing, China, 2004. [Google Scholar]
  21. Vaiana, N.; Rosati, L. Classification and unified phenomenological modeling of complex uniaxial rate-independent hysteretic responses. Mech. Syst. Signal Process. 2023, 182, 109539. [Google Scholar] [CrossRef]
  22. Capuano, R.; Vaiana, N.; Pellecchia, D.; Rosati, L. A Solution Algorithm for a Modified Bouc-Wen Model Capable of Simulating Cyclic Softening and Pinching Phenomena. IFAC Pap. Online 2022, 55, 319–324. [Google Scholar] [CrossRef]
Figure 1. The working principle of CFST damper.
Applsci 13 02408 g001
Figure 2. The related design diagrams of GJ-1 (unit: mm). (a) Frame structure with CFST damper; (b) CFST damper; (c) reinforcement drawing of frame beam and column.
Applsci 13 02408 g002
Figure 3. The related design diagrams of GJ-2. (a) Energy-dissipated low-rise concrete shear wall with CFST short columns; (b) reinforcement diagram of the beam and column of the shear wall.
Applsci 13 02408 g003
Figure 4. The related design diagrams of GJ-3. (a) Ordinary reinforced concrete shear wall; (b) reinforcement diagram of the beam and column of the shear wall.
Applsci 13 02408 g004
Figure 5. The loading processes.
Applsci 13 02408 g005
Figure 6. Failure process and failure form of GJ-1. (a) The first concrete plastic strain element at the beam end; (b) the first concrete plastic strain element of column foot; (c) development stage of beam and column cracks; (d) the beginning of the yield stage of energy dissipation device; (e) the crack development stage at the end of beam and column at the yield stage; (f) the yield stage of energy dissipation device; (g) stress cloud chart of reinforcement at the yield of frame column end; (h) cloud chart of frame tension failure; (i) cloud chart of frame compression failure; (j) cloud chart of concrete compression failure inside steel pipe; (k) cloud chart of concrete tension failure inside steel pipe; (l) cloud chart of frame stiffness degradation.
Applsci 13 02408 g006aApplsci 13 02408 g006b
Figure 7. Failure process and failure form of GJ-2. (a) The first concrete plastic strain element at the left frame column foot; (b) crack development of left column foot; (c) the first concrete plastic strain element at the right frame column foot; (d) crack penetrated the wall and column; (e) the lower half of the wall begins to show oblique cracks; (f) yield of stressed bars of wall and columns; (g) development of the first right oblique crack of the lower half of the wall; (h) the first right oblique crack of the lower half of the wall penetrates; (i) development of the first left oblique crack of the lower half of the wall; (j) the first left oblique crack of the lower half of the wall penetrates; (k) development of the second right oblique crack of the lower half of the wall; (l) cloud chart of stiffness degradation of GJ-2; (m) cloud chart of compression failure of GJ-2; (n) cloud chart of tension failure of GJ-2.
Applsci 13 02408 g007aApplsci 13 02408 g007b
Figure 8. Failure process and failure form of GJ-3. (a) The first concrete plastic strain element at the left column foot; (b) crack development at the bottom of the wall and columns; (c) the first right oblique crack of the shear wall; (d) the first left oblique crack of the shear wall; (e) the second right oblique crack of the shear wall; (f) penetrated cracks appear in the frame column; (g) yield of main stressed bars; (h) crack penetrated the wall and column; (i) the shear wall has cracks developing to the upper right; (j) the corresponding cloud chart of the reinforcement when the cracks occur at the upper right; (k) the lower part of the wall is bulging; (l) cloud chart of stiffness degradation of wall and columns; (m) cloud chart of compression failure of GJ-3; (n) cloud chart of tension failure of GJ-3.
Applsci 13 02408 g008aApplsci 13 02408 g008b
Figure 9. Hysteretic loops. (a) GJ-1; (b) GJ-2; (c) GJ-3.
Applsci 13 02408 g009
Figure 10. Calculation diagram of equivalent viscous damping coefficient h e .
Applsci 13 02408 g010
Figure 11. Equivalent viscous damping coefficient.
Applsci 13 02408 g011
Figure 12. The K θ curves of three components.
Applsci 13 02408 g012
Figure 13. Comparison of energy dissipation.
Applsci 13 02408 g013
Figure 14. Masonry structure with RC frames on the first story with CFST dampers.
Applsci 13 02408 g014
Figure 15. Structure plane layouts. (a) JG-1 plane layout of CFST dampers on the first story; (b) JG-2 and JG-3 plane layouts of shear wall on the first story; (c) plane layout of the second to fifth floors of three structures.
Applsci 13 02408 g015aApplsci 13 02408 g015b
Figure 16. Elevation layouts of the first story. (a) JG-1; (b) JG-2; (c) JG-3.
Applsci 13 02408 g016
Figure 17. The Fourier spectrum of three waves. (a) EL Centro wave; (b) Taft wave; (c) TJYY wave.
Applsci 13 02408 g017
Figure 18. Maximum absolute acceleration response of each floor. (a) Under the action of EL-Centro wave; (b) under the action of Taft wave; (c) under the action of TJYY wave.
Applsci 13 02408 g018
Figure 19. The interlayer displacement. (a) Interlayer displacement under the action of EL-Centro wave; (b) interlayer displacement under the action of Taft wave; (c) interlayer displacement under the action of TJYY wave.
Applsci 13 02408 g019aApplsci 13 02408 g019b
Figure 20. The maximum layer displacement. (a) Maximum layer displacement under the action of EL-Centro wave; (b) maximum layer displacement under the action of Taft wave; (c) maximum layer displacement under the action of TJYY wave.
Applsci 13 02408 g020
Figure 21. Comparison of base shear time-history curves of three structures.
Applsci 13 02408 g021
Figure 22. Energy distribution of three structures under EL-Centro wave. (a) Energy distribution of JG-1; (b) energy distribution of JG-2; (c) energy distribution of JG-3.
Applsci 13 02408 g022
Table 1. Cracking load, yield load, peak load, failure load, and yield strength ratio of three components (unit: KN).
NumberPositive LoadingNegative Loading
P c P y P u P Δ μ 1 P c P y P u P Δ μ 1
GJ-1492.41255.81669.51451.90.752463.51201.51605.11419.30.748
GJ-2657.52167.22474.41981.40.876624.82035.82343.91985.20.868
GJ-3816.82657.13030.22461.30.877828.32701.42962.42408.40.912
Table 2. Displacements and ductile factor of three components.
NumberPositive LoadingNegative Loading
Δ c Δ y Δ u Δ Δ μ 2 Δ c Δ y Δ u Δ Δ μ 2
GJ-12.9338.14717.01485.65910.5142.5107.92517.38385.08810.736
GJ-21.4485.88811.84439.5096.7101.2595.77011.01939.7736.893
GJ-31.0515.92411.97629.1224.9151.3545.98511.98829.8294.984
Table 3. Modal analysis of the three structures JG-1, JG-2, and JG-3.
ModeJG-1JG-2JG-3
Frequency/HzPeriod/sFrequency/HzPeriod/sFrequency/HzPeriod/s
11.7480.5721.9050.5252.3570.424
21.8160.5512.1670.4512.6480.377
32.2570.4432.6710.3743.5480.282
Table 4. The contrast of base shear force.
Peak Acceleration
cm/s2
Structure Code NameShear Force at Other Parts
Vw/kN
Column Shear
Vc/kN
Total Shear V/kNVw/V
50JG-1−148.377−40.880−189.2570.784
JG-2−247.899−37.370−285.2690.869
JG-3−293.540−34.805−328.3450.894
200JG-1345.5674192.670538.2670.642
JG-2559.755135.593695.3480.805
JG-3712.230152.127864.3570.824
400JG-11013.246707.03561720.2820.589
JG-22014.211685.8042700.0150.746
JG-32549.618770.1973319.8150.768
Disclaimer/Publisher’s Note: The statements, opinions and data contained in all publications are solely those of the individual author(s) and contributor(s) and not of MDPI and/or the editor(s). MDPI and/or the editor(s) disclaim responsibility for any injury to people or property resulting from any ideas, methods, instructions or products referred to in the content.

