Abstract
The aim of this work was to investigate the physicochemical characteristics of dried tomato pomace and the viscoelastic behavior of suspensions obtained by the rehydration of dry, grinded tomato pomace and sieved with a particle size < 120 µm. Investigated systems comprised of three different dry tomato pomace powder (TP) concentrations (15, 20 and 25%) heat-treated at two temperatures (60 °C and 95 °C) corresponding to the “cold-break” and “hot-break”, during 30 min. The dynamic rheological properties and color parameters of the suspensions formulated were evaluated. The water activity, water absorption index, water retention capacity, pectin content and color parameters assessed revealed good properties of the dry tomato pomace powder (TP) to develop new products. Tomato pomace suspensions with different concentrations processed at different temperatures caused significant changes in rheological behavior. The viscoelastic properties of the TP suspension showed a much stiffer structure at 25% TP, processed at 90 °C. Instrumental color parameters a* and b* increased, while lightness (L*) decreased with concentration and temperature increase. These results could be useful to select the adequate concentration of TP to achieve a desired consistency of the product during processing with positive effects on quality parameters of the finite product.
1. Introduction
Tomato (Lycopersicum esculentum) has its origin in South America and has been cultivated on the European continent for hundreds of years. Tomatoes are known to be a good source of antioxidants that include mainly lycopene [1,2], but also carotenoids such as β-carotene, a precursor of vitamin A [3], vitamins such as ascorbic acid (vitamin C) [4] and phenolic compounds such as flavonoids [5,6]. Due to their high nutrient content and unique sensory properties, tomatoes are consumed fresh, cooked and in processed form such as puree, paste, ketchup, sauce, canned tomato and tomato juice [5,7].
Regular consumption of tomatoes and tomato products increases antioxidant defenses and reduces the risk of oxidative stress, mainly due to their lycopene content [8], reduces the level of cholesterol and triglycerides in the blood [1,2] and prevents the spread of several types of cancer cells [9,10] that may cause cancers of the prostate, skin, lung, colon, breast and urinary bladder [11].
The industrial processing of tomatoes produces a large amount of tomato pomace. It has been estimated that the total production of tomato pomace in the world is approximately 5.4–9.0 × 10⁶ tons annually [12,13]. Tomato pomace is generally composed of 56–65.3% skin, a part of the pulp and 38.5–44% seeds [14,15,16]. The amount of tomato pomace being produced as a result of the industrial processing of tomatoes varies, and depends on several factors related to the raw material, the technological process, the finished product, etc. An estimated amount of tomato pomace of 1.5% up to 5% [14,17,18] of the initial weight of tomatoes after industrial processing has been reported. This by-product is a rich source of lycopene (7.36–17.21%) [19,20,21] and other biologically active compounds [22], fiber (16–78.56%) [23,24], protein (11.02–24.67%) [25,26] and lipids (3.22–23.44%) [17,27]. In addition, the fatty acid profile is similar to that of unprocessed tomatoes [28]. The peel contains the highest amount of lycopene and fiber, while lipids and proteins are concentrated in the seeds [12]. Thus, tomato pomace is a valuable source of nutrients, and can be used as a raw material for developing functional products. The valorization of tomato pomace also has a positive impact on the environment by reducing the waste from the industrial processing of tomatoes.
Due to the seasonal character of tomato pomace, the valorization opportunities are limited. The high water content of tomato pomace, about 80–90% [29,30,31] requires drying to obtain safety production with an extended shelf life. By grinding, the tomato pomace powder is obtained which can be used as a raw material in different concentrations to formulate new value-added products, characterized by high dietary fiber content [31,32].
An essential process for obtaining tomato products such as juice, puree or pasta is the process of preheating, also known as “breaking”. During this process the protopectin contained in tomatoes is transformed into pectin, leading to a uniform consistency of tomato products. Two forms of this process are used industrially, as “cold-break”, when the heating applied after crushing is performed at temperatures of 60–70 °C and “hot-break”, when the heating is carried out at 85–100 °C and which inactivates the enzymes that normally act on the pectin after crushing [33]. Heat treatment can cause changes in color, chemical, rheological and functional properties. Therefore, the appropriate processing temperature must be selected to attain the desired attributes of the finite product. Furthermore, knowledge of the effect of temperature and concentration on the flow properties of fluid foods could be very useful to understand unit operations such as evaporation and concentration where simultaneous heat and mass transfer takes place [34]. A study conducted by Belovič et al. [31] reported the structural and rheological properties of reconstituted lyophilized tomato pomace. However, the physico-chemical composition of dried tomato pomace and the influence of its concentration and the treatment temperature of tomato pomace suspension on the structural and rheological properties have not yet been investigated.
The objective of this study was to investigate the influence of concentration and treatment temperature on the color, physico-chemical and rheological properties of tomato pomace suspensions obtained by the rehydration of dry and grinded tomato pomace with a particle size < 120 µm, in relation to the physical–chemical characteristics of tomato pomace powder.
2. Materials and Methods
2.1. Sample Preparation
Tomato pomace was obtained from the industrial processing of tomato products, the Colibri F1 variety and was dried in a cabinet dryer at 40 °C until the moisture content reached a constant value. Dried tomato pomace with a moisture content of 6% was ground in a domestic grinder (Bosch, Stuttgart, Germany) and sieved through a Retsch Vibratory Sieve Shaker AS 200 basic (Retsch, Haan, Germany). The tomato pomace powders (TP) with a particle size < 120 µm and proximate composition consisting of moisture 6%, protein 20.36%, fat 0.35% and ash 8.97% were used in this study. Tomato pomace suspension was obtained by the rehydration of TP using distilled water in order to obtain three different concentrations, 15%, 20% and 25%. These chosen concentrations have a similar consistency with tomato juice (15%), tomato sauce (20%) and tomato paste (25%). Before heating, the samples were rested for 12 h at an ambient temperature for complete hydration. Tomato pomace suspension samples were treated in closed tubes for 30 min at two different temperatures (60 °C and 95 °C) which correspond to a pretreatment called “cold-break” and “hot-break”, respectively [32], that can be applied for tomato by-products processing.
The analyses of the suspensions (total soluble solid content, titratable acidity, pH, water activity, pectin soluble in water, hydration properties, color and rheological properties) formulated with 15, 20 and 25% TP were performed before heat treatment, at an ambient temperature of 20 °C (MT1, MT2 and MT3) and after heat treatment at 60 °C (CT1, CT2 and CT3) and 95 °C (HT1, HT2 and HT3), respectively.
2.2. Physico-Chemical Analysis of the Tomato Pomace Powder
2.2.1. Total Soluble Solid Content
Total soluble solid (TSS) content, expressed as °Brix, was measured with the Abbé Refractometer (Bellingham & Stanley, Tunbridge Wells, UK) through the refractive index at an ambient temperature (20 ± 1 °C), in triplicate, by placing a drop of sample on to the glass prism. Prior to the measurement, the refractometer was calibrated with distilled water and the samples were diluted 1:10.
2.2.2. Titratable Acidity
The titratable acidity was measured according to the method 942.15 of the Association of Official Analytical Chemists (AOAC), in triplicate. The titratable acidity was determined by titrating 10 mL of tomato pomace powder solution (diluted with 10 mL of distilled water and boiled to evaporate the CO2) with 0.1 N sodium hydroxide, using phenolphthalein as an indicator. During titration, as tomato are colored fruits, the pH was measured up to 8.03 to decide the end point of the titration. The titratable acidity was expressed as a percent of citric acid [35] by using Equation (1):
where VNaOH is the titratable volume of the solution, CNaOH represents the concentration of NaOH solution and Vsample is the titratable volume of the sample.
2.2.3. pH Value
pH value of samples was measured by using a HQ30d pH-meter (Hach Company, Ames, IA, USA). The commercial buffer solutions at pH 6.8 and 4.0 were used to calibrate pH meter. pH measurements were performed at an ambient temperature (20 ± 1 °C) at least in triplicates for each sample formulated.
2.2.4. Water Activity
Water activity (aw) was determined with Water Activity Meter AquaLab Lite (Decagon Devices, Inc., Pullman, WA, USA), at an ambient temperature (20 ± 1 °C), in triplicate.
2.2.5. Pectin Soluble in Water
Pectin soluble in water content was evaluated based on the precipitation of pectic acid by calcium chloride and the gravimetric determination of calcium pectate. For analysis, 7 g tomato powder was used. The sample was mixed with 150 mL of distilled and the level of the liquid in the glass was marked. The content of the beaker was boiled for one h, from time to time filling the water brought up to the mark. After boiling, the contents were transferred to a 250 mL volumetric flask. After cooling, it was brought up to the mark with distilled water. Then it was filtered through a dry filter until a transparent filtrate was obtained. This filtrate was used to determine pectic substances. An amount of 25 mL of the filtrate was passed into a beaker and 100 mL of 0.1 N NaOH was added. It was left to rest for 30 min, then 50 mL CH3COOH 0.1 N was added. After 5 min, 50 mL of CaCl2 was incorporated and after 60 min of resting, the content was boiled for 5 min and filtered. The precipitate on the filter was washed with distilled water until the wash water no longer gave a white precipitate with AgNO3. After washing, the paper with precipitate was dried to 100 °C, cooled and weighed.
The pectin content was calculated by using Equation (2):
where G is the mass of calcium pectate precipitate (g); V, the volume of the volumetric flask to which the liquid was brought after boiling for hydrolysis (mL); M is the weight of the sample (g); V1 is the volume of filtrate taken for analysis (mL) and 0.92 is the percentage of pectin from calcium pectate, knowing that calcium pectate contains 8 % calcium.
2.3. Hydration Properties of the Tomato Pomace Powder
Two grams of TP were hydrated (dispersed) in 30 mL of distilled water at room temperature, in a closed centrifuge tube. Then, the samples were heated in a water bath at 60 °C and 95 °C during 60 min, and centrifuged after cooling at 3000× g for 15 min. The supernatant was decanted and the sample was weighed. The non-heated samples were used as a control. The water absorption index (WAI) was measured in triplicate and the value was determined based on Equation (3), where mh is the weight of hydrated TP (g) and mp is the weight of TP (g).
Water retention capacity (WRC) was measured based on the method reported by Sowbhagya et al. [36]. Tomato pomace powder (1 g) was hydrated in 30 mL distilled water at room temperature for 18 h and centrifuged at 3000× g for 20 min. The weight of the resulting residue was recorded both before and after drying (i.e., fresh and dry weight, respectively) at 105 °C to a constant weight. WRC was calculated by using the Equation (4) where mf is the weight of the fresh residue (g) and md is the weight of the dry residue (g).
2.4. Color Evaluation
The color values of tomato pomace powder and of the formulated tomato pomace powder suspensions were measured using a Konica Minolta Chroma Meter CR-400 (Tokyo, Japan). The measurements, according to the CIE Lab system, in terms of L* (lightness), a* (saturation index in green/red), b* (saturation index in blue/yellow), C* (metric chroma) and ΔE (color difference) were performed in triplicate and the average value was reported.
2.5. Rheological Measurements
Rheological measurements were performed using the 40 mm parallel plate geometry of a Haake MARS dynamic rheometer (Thermo Scientific, Karlsruhe, Germany) equipped with a Peltier temperature controller. After placing the sample to the measurement space, the samples were rested for 90 s and the gap was kept at 1 mm. A solvent trap to the exposed edge of sample in order to eliminate drying during tests was applied. The rheological properties of TP in suspension system, without added hydrocolloids, with three different concentrations of 15%, 20% and 25% TP were determined before (20 °C) and after heat treatment at two different breaking temperatures (60 °C and 95 °C), at least in triplicate.
2.5.1. Dynamic Oscillatory Measurements
The dynamic oscillatory regime with the frequency sweeps and temperature sweeps tests was applied in order to avoid the destruction of the structure. The frequency sweeps were performed in the frequency range of 0.1 to 10 Hz, at 25 °C and a constant strain of 1 Pa, within the linear viscoelastic region, previously determined using a strain sweep test. The elastic modulus (G′), viscous modulus (G″) and complex viscosity (η*) were recorded as function of frequency for the TP suspension studied. The experimental results, in terms of elastic modulus (G′) and viscous modulus (G″) obtained with frequency variation were fitted to the power law model using the Equations (5) and (6) where n′ and n″ are the flow behavior index and K′ and K″ were the consistency indices.
The temperature sweep tests were conducted from 25 to 100 °C at a heating rate of 7.5 ± 0.1 °C/min (600 s), at a frequency of 1 Hz and a constant strain of 0.01%. The complex viscosity (η*) was recorded as a function of temperature in two stages: first, in a heating stage from 25 °C to 100 °C and then, in a cooling stage from 100 °C to 25 °C.
2.5.2. Yield Stress of Tomato Pomace Suspension Measurements
The deformation–stress relationship measurements were made after a waiting period of 5 min using a logarithmical stress-controlled (CS) ramp in a shear stress range between 0.5 and 100 Pa within 600 s in order to determine the yield stress. The transition from elastic behavior to flow was indicated by the intersection of the linear segments in a log–log plot of deformation versus stress values, and was considered as the yield stress value [31].
2.6. Data Analysis
Data, presented as mean ± standard deviation (SD), were statistically analyzed using XLSTAT for Excel 2022 version (Addinsoft, New York, NY, USA) software. One way analysis of variance (ANOVA) with post-hoc multiple comparisons was carried out by applying the Tukey test to estimate the significance of differences between means at a p-value of less than 0.05. Principal Component Analysis based on Pearson’s correlations was performed.
3. Results and Discussion
3.1. Tomato Pomace Powder Characterization
Water activity (aw) is an important parameter for product stability and quality. Dry tomato pomace powder (TP) presented low values (0.32 ± 0.01) indicating a good preservability. So, the TP can be kept for a long time without altering.
The results obtained for water absorption index (WAI) (3.28 ± 0.17%) and water retention capacity (WRC) (4.59 ± 0.46%) showed that the TP can absorb and retain water, suggesting that the powder can be used to obtain functional solutions with the necessary industrial parameters. Similar results were reported by Belović et al. [7].
Tomato pomace powder presented a high pectin content (22.96 ± 1.45%), the results showing that it is adequate for use in the manufacturing of products that require a specific texture. TP can be used as a thickening agent, but also as a stabilizer and water retention agent. Thus, it can be used in the formulation or development of new products with desired technological characteristics.
The color parameters values obtained for TP showed a lightness of 51.40 ± 0.19, while the value of a* (18.89 ± 0.15) indicated chromaticity on a red (+) axis and the value of b* (26.22 ± 0.11) indicated chromaticity on a yellow (+) axis. The chroma C* values (32.32 ± 0.18) were related to raised concentration of lycopene, the carotenoid which imparts red to yellowish color to the TP.
3.2. Physico-Chemical Properties of Tomato Pomace Suspensions
The results of the physico-chemical properties for the tomato pomace suspension samples are shown in Table 1. The results were compared in relation to concentration and temperature. The pH value of the tomato pomace suspensions did not show significant changes after 30 min of both heat treatments, varying from 4.20 to 4.23 in all analyzed samples. The lowest pH value was obtained for the sample HT3 (with 25% TP, treated at 95 °C) (4.20) and for the sample CT3 (with 25% TP, treated at 60 °C) (4.20). The highest value was obtained for the sample MT1 (with 15% TP, at 20 °C) (4.23) and for the sample HT1 (with 15% TP, treated at 95 °C) (4.23). From the Table 1 it can be noticed that the greater the concentration was, the lower the pH was. After heat treatment at 60 °C and 95 °C, a decrease in pH for the samples with 25% TP was observed. The fluctuations of pH might have been due to the variations in titratable acidity or temperature and different concentration of the tomato pomace suspension, and the decline of acidity could possibly be attributed to the increased activity of citric acid [33]. Large pH values were observed for samples treated at a temperature of 95 °C, being significantly different (p < 0.05) compared to untreated samples or to those treated at 95 °C. The heat treatment at 60 °C did not significantly change the acidity.

Table 1.
The physicochemical characteristics of tomato pomace suspension.
The total soluble solid (TSS) content of tomato pomace suspension was lower than in products such as juice, paste or ketchup. The increase in the tomato pomace concentration in the suspension determined the increase in TSS content (Table 1). There were no significant changes (p > 0.05) in the TSS content of the samples due to the thermal treatment. Total soluble solid content in the samples formulated was related to the TP concentrations to evaluate the amount of soluble compound extracted from TP at different temperatures. Significant differences (p < 0.05) were found between samples in function of concentration and treatment (Table 1). The increase in TP concentration led to an increase in TSS value, with a similar trend being obtained for both temperatures. These results suggest that tomato cells were completely disintegrated during grinding and, when water was added, soluble cell content such as sugars, acids and salts was dissolved, showing similar TSS values regardless of the heat treatment applied.
The results for the color parameters of the formulated tomato pomace suspensions are shown in Table 2. Concentration of the samples did not significantly affect color. Color parameters for the heated samples at 60 °C and 95 °C as the similarity with cold-break and hot-break production processes were compared to samples at 20 °C as the analogy with room temperature processing. The most marked differences in color were observed in brightness after heat treatment at 95 °C. The color differences ΔE between the unheated (M) and heated samples (C and H) were considered small (2 > ΔE > 1), with only HT1 and HT2 presenting moderate color differences (>2).
Table 2.
Color parameters for samples with different concentrations before and after heat treatment.
3.3. Dynamic Rheological Properties of Tomato Pomace Powder Suspension
3.3.1. Effect of Concentration and Temperature on Dynamic Rheological Properties
The rheological properties of tomato products have largely been investigated in various studies. These properties are essential for a better understanding of the behavior of the product during processing, as well as for the storage and consumption of the product. By applying oscillatory tests with a small deformation amplitude, within the linear viscoelastic region, a characterization of the undisputed material structure can be achieved. It is known that tomato products are defined as pseudoplastic fluids or can be classified as weak gels that have their own compositional characteristics, with an influence on different rheological behaviors [31]. The particle properties that influence the rheology of the tomato pomace suspension include the concentration, size distribution, shape, type and surface properties, deformability and interparticle forces [31,37]. The formulated tomato pomace suspensions with different concentrations showed differences in rheological behavior when frequency sweep tests (0.1 to 10 Hz) were applied (Figure 1). So, their dynamic rheological properties were evaluated and those concentrations could be used adequately in the product development with desired functionality.
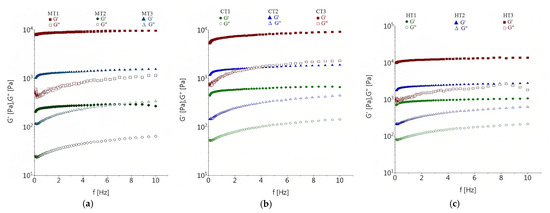
Figure 1.
Elastic (G′) and viscous modulus (G″) variations with frequency for suspension with tomato pomace powder (TP) concentration of 15 % (a), 20 % (b) and 25 % (c) treated at 20 °C (MT1, MT2, MT3), 60 °C (CT1, CT2, CT3) and 95 °C (HT1, HT2, HT3), respectively.
The evaluated parameters, elastic modulus (G′) and viscous modulus (G″) showed an evident frequency dependency, suggesting an overall mobility of the suspension inside the system. The suspensions exhibited predominantly solid-like behavior (G′ < G″) in the studied frequency range, with G″ lower than G′ by less than 10-fold [38]. As it can be seen in Figure 1c, the 25% TP concentration resulted in the maximum mechanical rigidity in the system, a behavior characteristic of a solid-like material such as a network. This can probably be related to the higher amounts of insoluble fibers which could possibly improve the suspension rigidity.
To evaluate the frequency dependence of G′ and G″ moduli, experimental data were fitted to a power law model (Equations (5) and (6)) by means of non-linear regression analysis. The results showed that the dynamic rheological moduli represented the experimental data well. The determination coefficient (R2) had high values for all samples studied (Table 3) which could be explained by the homogeneity of the samples. The consistency indices K′ and K″ from the model varied in a large range (Table 3), reflecting the magnitude of suspension viscosity in terms of consistency. The consistency increased with the increase in TP concentration in suspensions. An increase in consistency indices with particle concentration has been reported in several studies on the rheology of tomato-derived suspensions [39,40]. The flow behavior indices n′ and n″ ranging between 0.068 and 0.272 showed that n″ values were much higher than that of n′ values (Table 3), indicating a pseudoplastic behavior (n < 1). The rheological behavior of the studied suspensions can be described as that of weak gels and can be attributed to the presence of high molecular weight materials such as pectin. Similar findings that concluded that this behavior corresponded to that of weak gels were reported for tomato paste, ketchup and sauce [41]. Significant differences (p < 0.05) were noticed among samples with different TP concentrations and also among the samples with the same concentration treated at different temperatures. The increase in TP concentration in the suspension system significantly increased (p < 0.05) the consistency and the flow behavior indices, n′ and n″ in all tested suspensions except the samples at 25% TP concentration treated at 20 °C and 95 °C. As it can be observed from Table 3, for the same TP concentration in suspension, the values of K′ and K″ increased as the temperature treatment was raised, the highest value being registered at 95 °C. For the same concentration, compared with the sample at 20 °C, the n′ and n″ indices increased significantly at 60 °C and then, at 95 °C decreased. Among all samples treated at 95 °C, HT3 with the 25% TP concentration was influenced to the greatest measure. Flow behavior indices decreased, while consistency increased for HT3. An increase in elastic and viscous modulus was observed with the increase in treatment temperature, indicating a rise in consistency coefficients at the hot break temperature. These results confirmed the observation reported by Ibarz et al. [42] who affirmed that temperature had a large effect on the consistency coefficient. At the same time, the samples with 25% TP concentration treated at hot break temperature showed a declining trend with temperature for n′ and n″ compared to the samples with 20% TP, which indicated that this suspension tended to have a higher plasticity at a higher temperature. Similar results were reported by Sharoba et al. [43] which showed that an increase in temperature decreased the flow behavior index of some commercial ketchup.
Table 3.
Power law models parameters for the suspension formulated with 15, 20 and 25% TP at 20 °C (MT1, MT2, MT3) and treated at 60 °C (CT1, CT2, CT3) and 95 °C (HT1, HT2, HT3) breaking temperature.
At a low temperature of breaking (65 °C), the consistency indices and flow behavior indices increased by increasing the TP concentration from 15 to 25%, indicating a strongly aggregated gel of the suspension [44].
The changes in structure induced by processing can also be monitored by the study of complex viscosity (η*) of TP suspension. The relationships between η* and frequency of samples investigated are plotted in Figure 2. It is evident that the η* of all the tested samples decreased with the increasing frequency with complex viscosity direct dependency of the TP concentration.
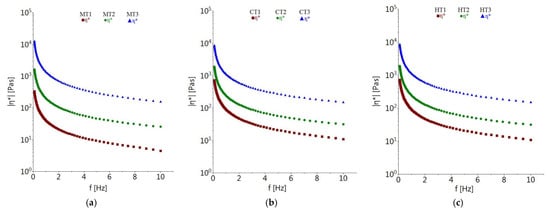
Figure 2.
Complex viscosity (η*) variations with frequency for suspension with 15, 20 and 25% tomato pomace powder at 20 °C (MT1, MT2 and MT3) (a); thermal-treated at 60 °C (CT1, CT2 and CT3) (b) and thermal-treated at 95 °C (HT1, HT2 and HT3) (c).
Suspension with TP at a level of 25% had the highest consistency. The highest value for η* was observed for the HT3 sample which could be explained by its high soluble solids content. A similar finding was reported by Rydzak et al. [45] who affirmed that the content of soluble substances is an important factor that affects the rheological properties of juice, including viscosity.
The increase in η* with temperature increase can result from mainly molecular movements and interfacial film formation [46]. The presence of rigid particles in the suspension led to the increase in inner deformation during oscillatory experiments [47].
The complex viscosity η* increased with both TP concentration and heating temperature. This behavior could be due to the presence of simple sugars and disaccharides, which at a higher concentration have much higher viscosity value. The main substances responsible for creating the viscosity are pectins that mainly contain esterified 1,4-link α-D-galactosyluronic residues [48].
3.3.2. Effect of Non-Isothermal Heating on Tomato Pomace Powder Suspension
Industrial tomato processing is usually released by hot break (85–95 °C) or cold break (60–70 °C). The evolution of complex viscosity (η*) during non-isothermal heating (20–95 °C) and subsequent cooling is shown in Figure 3, offering an insight into the thermal stability of suspension samples studied. With an increase in heating, the η* of each formulated TP suspension followed a different pattern, with the temperature rise at a constant frequency of 1 Hz inducing additional particle thermal motion. This was evidenced with the suspension with 25% TP (T3) which was slightly stiffer than the 20% TP (T2) and 15% TP (T1) suspensions. The stiff effect observed could be related to the thermally induced thickening effects and/or to the presence of pectin [44], a phenomenon quantified by the high value of the complex viscosity. The high concentration of TP and the fact that TP particles have a large specific surface area, exhibiting large bonding affinity to polysaccharides from the suspension, lead to a high value of the complex viscosity. Similarly, Yoo and Rao [40] reported that due to the larger surface area of smaller particles, as compared to bigger particles, the interaction forces can increase, determining a raise in viscosity. On the other hand, when large particles form aggregates, occupying more space in the sample than the aggregates of small particles, this leads to a larger volume effectively taken in by these large particles which can also determine an increase in flow resistance [49,50]. Belović et al. [31] showed that tomato particles in tomato pomace powder ketchup system have a larger specific surface area then particles in fresh tomato pomace ketchup and consequently a larger bonding affinity to polysaccharides. This interconnectivity of particles in tomato pomace powder ketchup system results in a higher value of the complex viscosity relative to fresh tomato pomace ketchup.
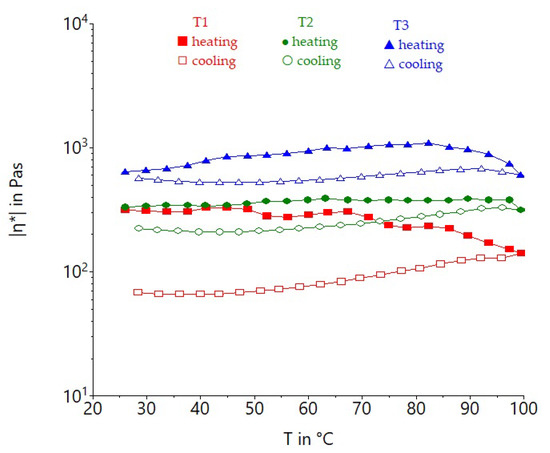
Figure 3.
The change of complex viscosity (η*) during heating and cooling of suspensions containing 15% (T1), 20% (T2) and 25% (T3) tomato pomace powder.
The suspension with 20% TP (T2) was thermally stable during heating from 25 to 95 °C, showing a constant value of the complex viscosity with temperature increase, but was softer than T3. The suspension with 15% TP (T1) became more stiffer during cooling than during heating, showing a similar rheological behavior as complex viscosity with the T2 when the cooling temperature decreased under 50 °C. This fact could be due to the increased TP particles’ affinity to form non-covalent bonds [51]. For all studied suspensions, complex viscosity was higher during cooling relative to heating due to the breaking of particle–polysaccharide bonds which induced a stiffening of the suspensions due to the raised mobility of the particles when the temperature increased. This is in accordance with the results reported by Belović et al. [31]. The higher complex viscosity of the suspension with 25% TP when compared to 15 and 20% TP suspensions suggests its potential applications as a bakery filling.
Yield stress values obtained for the suspension with 15% (T1), 20% (T2) and 25% (T3) of tomato pomace powder indicated that the transition from elastic behavior to flow was influenced by TP concentration and treatment temperature (Figure 4). Tomato pomace, containing a high amount of fiber, such as cellulose and pectic substances [7], influences the yield stress. The results showed that by increasing the particle concentration, the yield stress was increased. These findings are in accordance with those reported in several studies [49,52]. Apart from the amount of suspended particles, particle deformability can also affect the rheology of suspensions. A higher yield stress has been reported for less deformable particles [37,53]. A higher value of yield stress obtained for samples treated at 95 °C could be explained by a larger bonding ability to polysaccharides which can longer sustain the original structure of sample [54]. During heat treatment, pectic substances were released from the tomato pomace particles and this process is noticeable at a higher temperature. As a consequence of thermal processing, a higher amount of pectic acid was reported after heating at 100 °C which could be due to the increase in the more water-soluble pectins [55]. The soluble pectin increases interparticle interaction, binding liquid and particles phases, acting as a stabilizer in suspensions [56]. The soluble pectin might act as a type of glue in between the insoluble particles, thereby creating a network similar to the behavior of pectin in the middle lamella of cell clusters [57].
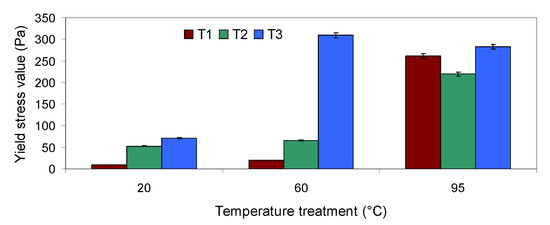
Figure 4.
Yield stress value of suspensions containing 15% (T1), 20% (T2) and 25% (T3) tomato pomace powder.
The high yield stress value and the previously described rheological properties of TP suspension highlighted that the developed product type ketchup (with 20% TP) or pasta (with 25% TP) could be packed in tubes, as opposed to sauce product (with 15% TP) which could be packed only in jars.
3.4. Relationships between Evaluated Parameters
Data obtained for determined parameters were subjected to multivariate statistical analysis. The correlation matrix among the physical, chemical and rheological parameters of the nine samples (Table 4) showed that many interactions among these parameters were significant at p < 0.01 level. Among those associations with correlation coefficients above 0.80, some were more expected than others. The high correlation between the soluble solid content and consistency index K′ (r = 0.883) and K″ (r = 0.910), pH and acidity (r = −0.802) were presumed. The color parameter a* was also highly correlated with flow behavior index n′ (r = 0.657) and n″ (r = 0.701). The consistency index K′ was significantly correlated with b* (r = −0.719) and C* (r = −0.669) color parameters of the suspension. Acidity showed a moderate negative correlation with lightness (r = −0.580), and pH with consistency index K″ (r = −0.567), whereas between consistency index K′ (r = −0.495) and pH, a weak negative correlation was found.
Table 4.
Correlation matrix with Pearson’s correlations coefficients among the evaluated parameters.
The application of principal component analysis (PCA) allowed a general overview of the data and suspensions evaluated. The PCA projection for the physical, chemical and rheological parameters of the nine suspensions on the first two principal components (Figure 5) showed that the first and second principal components accounted for 51.86% and 29.14% of the variability of the data, respectively. Consistency index K′ and K″, soluble solid content and acidity were heavily weighted on the PC1. The small angles between K″ and soluble solid content reflected the highly significant correlation coefficient (Table 4). Flow behavior index n′ and n″ were heavily weighted on the PC2.
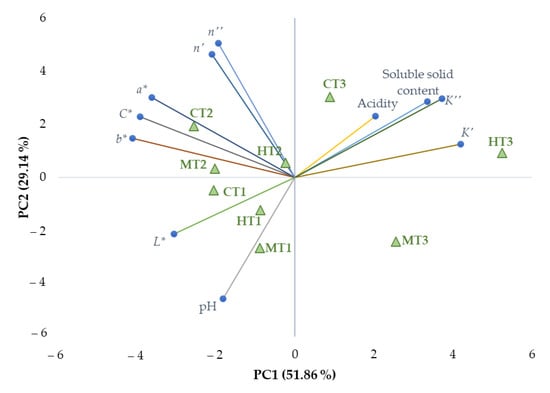
Figure 5.
Principal Component Analysis bi-plot: blue bullets represent variables; green triangles represent tomato pomace powder suspension samples with 15, 20 and 25% tomato pomace at 20 °C (MT1, MT2 and MT3); thermal-treated at 60 °C (CT1, CT2 and CT3) and thermal-treated at 95 °C (HT1, HT2 and HT3).
Regarding the place of the samples in the PC space, all the suspensions with 25% tomato pomace powder clustered on the right part of the graph, while those with 15 and 20% clustered on the opposite side. As a group, the suspensions with 25% tomato pomace powder (CT3, MT3 and HT3) possessed greater consistency index compared to the other samples (Table 3). HT3 was positioned in opposition with HT1 and HT2, presenting a somewhat higher consistency index. The MT1 suspension occupied a unique position in the PC space characterized by a high pH value and low acidity (Table 1). The place occupied by the CT2 suspension corresponded to the highest value of color parameter a* from all of the suspensions (Table 2). Concluding, the studied suspensions can be clustered together by those physical, chemical and rheological parameters.
4. Conclusions
Tomato pomace powder has a number of advantages such as a high pectin content, good water absorption, water retention capacity and good preservability due to low water activity (aw). Tomato pomace suspensions with different concentrations (15, 20 and 25%) could be used as the base for the formulation of tomato pomace-based products with different consistencies, such as juice, sauce and paste. The particle concentration and heat treatment represent the dominant factors in controlling the rheology of the suspension-based tomato pomace. The increase in the particle amount in the suspension determined a raise in storage modulus and yield stress, suggesting the strength and stiffness of created network. Moreover, the heating temperature impacted the rheological characteristics of the formulated suspensions, highlighting that tomato pomace pectin represents an essential factor in the development of new products. When principal component analysis was applied on the combined physical, chemical and rheological data, clustering of the nine suspensions according to the particle amount in the suspension and heating temperature was seen in the PC space. Moreover, the relationships among the evaluated parameters highlighted significant interactions with high correlation coefficients. These results can be indicators for choosing the best concentrations and processing temperatures according to the desired type of product or can be helpful for designing containers for the commercialization of products and technological equipment.
Author Contributions
Conceptualization, V.B., M.U.-I. and S.M.; methodology, V.B., M.U.-I. and S.M.; software, V.B., M.U.-I. and S.M.; validation, V.B., M.U.-I. and S.M.; formal analysis, V.B., M.U.-I. and S.M.; investigation, V.B., M.U.-I. and S.M.; resources, V.B., M.U.-I. and S.M.; data curation, V.B., M.U.-I. and S.M.; writing—original draft preparation, V.B., M.U.-I. and S.M.; writing—review and editing, V.B., M.U.-I. and S.M.; visualization, V.B., M.U.-I. and S.M.; supervision, V.B., M.U.-I. and S.M.; project administration, V.B., M.U.-I. and S.M.; funding acquisition, S.M. All authors have read and agreed to the published version of the manuscript.
Funding
This work was funded by the Ministry of Research, Innovation and Digitalization within Program 1—Development of national research and development system, Subprogram 1.2—Institutional Performance—RDI excellence funding projects, under contract no. 10PFE/2021.
Institutional Review Board Statement
Not applicable.
Informed Consent Statement
Not applicable.
Data Availability Statement
No new data were created or analyzed in this study. Data sharing is not applicable to this article.
Acknowledgments
This work was supported by the Ministry of Research, Innovation and Digitalization within Program 1—Development of national research and development system, Subprogram 1.2—Institutional Performance—RDI excellence funding projects, under contract no. 10PFE/2021. This work was supported by Romania National Council for Higher Education Funding, CNFIS, project number CNFIS-FDI-2022-0259.
Conflicts of Interest
The authors declare no conflict of interest.
References
- Blum, A.; Monir, M.; Wirsansky, I.; Ben-Arzi, S. The beneficial effects of tomatoes. Eur. J. Intern. Med. 2005, 16, 402–404. [Google Scholar] [CrossRef]
- Salehi, B.; Sharifi-Rad, R.; Sharopov, F.; Namiesnik, J.; Roointan, A.; Kamle, M.; Kumar, P.; Martins, N.; Sharifi-Rad, J. Beneficial effects and potential risks of tomato consumption for human health: An overview. Nutrition 2019, 62, 201–208. [Google Scholar] [CrossRef] [PubMed]
- Kumar, K.P.S.; Paswan, S.; Srivastava, S. Tomato—A natural medicine and its health benefits. J. Pharmacogn. Phytochem. 2012, 1, 33–43. [Google Scholar]
- Duma, M.; Alsina, I.; Dubova, L.; Erdberga, I. Chemical composition of tomatoes depending on the stage of ripening. Chem. Technol. 2015, 66, 24–28. [Google Scholar] [CrossRef]
- Pinela, J.; Barros, L.; Carvalho, A.M.; Ferreira, I.C.F.R. Nutritional composition and antioxidant activity of four tomato (Lycopersicon esculentum L.) farmer’varieties in Northeastern Portugal homegardens. Food Chem. Toxicol. 2012, 50, 829–834. [Google Scholar] [CrossRef] [PubMed]
- Bergougnoux, V. The history of tomato: From domestication to biopharming. Biotechnol. Adv. 2014, 32, 170–189. [Google Scholar] [CrossRef] [PubMed]
- Torbica, A.; Belović, M.; Mastilović, J.; Kevrešan, Ž.; Pestorić, M.; Škrobot, D.; Hadnađev, T.D. Nutritional, rheological, and sensory evaluation of tomato ketchup with increased content of natural fibres made from fresh tomato pomace. Food Bioprod. Process. 2016, 98, 299–309. [Google Scholar] [CrossRef]
- Pourahmadi, Z.; Mahboob, S.; Saedisomeolia, A.; Reykandeh, M.T. The effect of tomato juice consumption on antioxidant status in overweight and obese females. Women Health 2015, 55, 795–804. [Google Scholar] [CrossRef]
- Atanasova, V.K.; Gatseva, P.D. Natural Beverages and Their Role as Functional Foods. In Natural Beverages; Elsevier: Amsterdam, The Netherlands, 2019; pp. 37–71. [Google Scholar]
- Giovannucci, E. Tomatoes, tomato-based products, lycopene, and cancer: Review of the epidemiologic literature. J. Natl. Cancer Inst. 1999, 91, 317–331. [Google Scholar] [CrossRef]
- Islam, J.; Kabir, Y. Effects and mechanisms of antioxidant-rich functional beverages on disease prevention. In Functional and Medicinal Beverages; Elsevier: Amsterdam, The Netherlands, 2019; pp. 157–198. [Google Scholar]
- Lu, Z.; Wang, J.; Gao, R.; Ye, F.; Zhao, G. Sustainable valorisation of tomato pomace: A comprehensive review. Trends Food Sci. Technol. 2019, 86, 172–187. [Google Scholar] [CrossRef]
- Lu, S.; Chen, S.; Li, H.; Paengkoum, S.; Taethaisong, N.; Meethip, W.; Surakhunthod, J.; Sinpru, B.; Sroichak, T.; Archa, P.; et al. Sustainable Valorization of Tomato Pomace (Lycopersicon esculentum) in Animal Nutrition: A Review. Animals 2022, 12, 3294. [Google Scholar] [CrossRef] [PubMed]
- Silva, Y.P.A.; Borba, B.C.; Pereira, V.A.; Reis, M.G.; Caliari, M.; Brooks, M.S.-L.; Ferreira, T.A.P.C. Characterization of tomato processing by-product for use as a potential functional food ingredient: Nutritional composition, antioxidant activity and bioactive compounds. Int. J. Food Sci. Nutr. 2019, 70, 150–160. [Google Scholar] [CrossRef] [PubMed]
- Kaur, D.; Sogi, D.S.; Garg, S.K.; Bawa, A.S. Flotation-cum-sedimentation system for skin and seed separation from tomato pomace. J. Food Eng. 2005, 71, 341–344. [Google Scholar] [CrossRef]
- Corrêa-Filho, L.C.; Lourenço, S.C.; Duarte, D.F.; Moldão-Martins, M.; Alves, V.D. Microencapsulation of tomato (Solanum lycopersicum L.) pomace ethanolic extract by spray drying: Optimization of process conditions. Appl. Sci. 2019, 9, 612. [Google Scholar] [CrossRef]
- Knoblich, M.; Anderson, B.; Latshaw, D. Analyses of tomato peel and seed byproducts and their use as a source of carotenoids. J. Sci. Food Agric. 2005, 85, 1166–1170. [Google Scholar] [CrossRef]
- Del Valle, M.; Cámara, M.; Torija, M. Chemical characterization of tomato pomace. J. Sci. Food Agric. 2006, 86, 1232–1236. [Google Scholar] [CrossRef]
- Ho, K.K.H.Y.; Ferruzzi, M.G.; Liceaga, A.M.; San Martín-González, M.F. Microwave-assisted extraction of lycopene in tomato peels: Effect of extraction conditions on all-trans and cis-isomer yields. LWT—Food Sci. Technol. 2015, 62, 160–168. [Google Scholar] [CrossRef]
- Kehili, M.; Kammlott, M.; Choura, S.; Zammel, A.; Zetzl, C.; Smirnova, I.; Allouche, N.; Sayadi, S. Supercritical CO2 extraction and antioxidant activity of lycopene and β-carotene-enriched oleoresin from tomato (Lycopersicum esculentum L.) peels by-product of a Tunisian industry. Food Bioprod. Process. 2017, 102, 340–349. [Google Scholar] [CrossRef]
- Shao, D.; Atungulu, G.G.; Pan, Z.; Yue, T.; Zhang, A.; Chen, X. Separation methods and chemical and nutritional characteristics of tomato pomace. Trans. ASABE 2013, 56, 261–268. [Google Scholar] [CrossRef]
- Oleszek, M.; Kowalska, I.; Bertuzzi, T.; Oleszek, W. Phytochemicals Derived from Agricultural Residues and Their Valuable Properties and Applications. Molecules 2023, 28, 342. [Google Scholar] [CrossRef]
- Fuentes, E.; Carle, R.; Astudillo, L.; Guzmán, L.; Gutiérrez, M.; Carrasco, G.; Palomo, I. Antioxidant and antiplatelet activities in extracts from green and fully ripe tomato fruits (Solanum lycopersicum) and pomace from industrial tomato processing. Evid.-Based Complement. Altern. Med. 2013, 2013, 867578. [Google Scholar] [CrossRef] [PubMed]
- Elbadrawy, E.; Sello, A. Evaluation of nutritional value and antioxidant activity of tomato peel extracts. Arab. J. Chem. 2016, 9, S1010–S1018. [Google Scholar] [CrossRef]
- Wang, Q.; Xiong, Z.; Li, G.; Zhao, X.; Wu, H.; Ren, Y. Tomato peel powder as fat replacement in low-fat sausages: Formulations with mechanically crushed powder exhibit higher stability than those with airflow ultra-micro crushed powder. Eur. J. Lipid Sci. Technol. 2016, 118, 175–184. [Google Scholar] [CrossRef]
- Savadkoohi, S.; Farahnaky, A. Dynamic rheological and thermal study of the heat-induced gelation of tomato-seed proteins. J. Food Eng. 2012, 113, 479–485. [Google Scholar] [CrossRef]
- Giuffrè, A.M.; Capocasale, M. Physicochemical composition of tomato seed oil for an edible use: The effect of cultivar. Int. Food Res. J. 2016, 23, 583–591. [Google Scholar]
- Kalogeropoulos, N.; Chiou, A.; Pyriochou, V.; Peristeraki, A.; Karathanos, V.T. Bioactive phytochemicals in industrial tomatoes and their processing byproducts. LWT—Food Sci. Technol. 2012, 49, 213–216. [Google Scholar] [CrossRef]
- Akanbi, C.T.; Adeyemi, R.S.; Ojo, A. Drying characteristics and sorption isotherm of tomato slices. J. Food Eng. 2006, 73, 157–163. [Google Scholar] [CrossRef]
- Bhat, M.A.; Hafiza, A. Physico-chemical characteristics of cookies prepared with tomato pomace powder. J. Food Process. Technol. 2016, 7, 543. [Google Scholar]
- Belović, M.; Torbica, A.; Lijaković, I.P.; Tomić, J.; Lončarević, I.; Petrović, J. Tomato pomace powder as a raw material for ketchup production. Food Biosci. 2018, 26, 193–199. [Google Scholar] [CrossRef]
- Belović, M.; Pajić-Lijaković, I.; Torbica, A.; Mastilović, J.; Pećinar, I. The influence of concentration and temperature on the viscoelastic properties of tomato pomace dispersions. Food Hydrocoll. 2016, 61, 617–624. [Google Scholar] [CrossRef]
- Gould, W.A. Tomato Production, Processing and Technology; Elsevier: Amsterdam, The Netherlands, 2013; ISBN 184569614X. [Google Scholar]
- Altan, A.; Maskan, M. Rheological behavior of pomegranate (Punica granatum L.) juice and concentrate. J. Texture Stud. 2005, 36, 68–77. [Google Scholar] [CrossRef]
- Hassen, Y.; Gebre, H.; Haile, A. Effects of Pre-Heating and concentration temperatures on Physico-Chemical quality of semi concentrated tomato (Solanum lycopersicum) paste. J. Food Process. Technol 2019, 10, 1000795. [Google Scholar]
- Sowbhagya, H.B.; Suma, P.F.; Mahadevamma, S.; Tharanathan, R.N. Spent residue from cumin—A potential source of dietary fiber. Food Chem. 2007, 104, 1220–1225. [Google Scholar] [CrossRef]
- Moelants, K.R.N.; Cardinaels, R.; Van Buggenhout, S.; Van Loey, A.M.; Moldenaers, P.; Hendrickx, M.E. A review on the relationships between processing, food structure, and rheological properties of plant-tissue-based food suspensions. Compr. Rev. Food Sci. Food Saf. 2014, 13, 241–260. [Google Scholar] [CrossRef] [PubMed]
- Lapasin, R.; Pricl, S. Rheology of Industrial Polysaccharides: Theory and Applications; Springer Science & Business Media: Berlin/Heidelberg, Germany, 2012; ISBN 9781461521853. [Google Scholar]
- Barbana, C.; El-Omri, A. Viscometric behavior of reconstituted tomato concentrate. Food Bioprocess Technol. 2012, 5, 209–215. [Google Scholar] [CrossRef]
- Yoo, B.; Rao, M.A. Effect of unimodal particle size and pulp content on rheological properties of tomato puree. J. Texture Stud. 1994, 25, 421–436. [Google Scholar] [CrossRef]
- Koocheki, A.; Ghandi, A.; Razavi, S.M.A.; Mortazavi, S.A.; Vasiljevic, T. The rheological properties of ketchup as a function of different hydrocolloids and temperature. Int. J. Food Sci. Technol. 2009, 44, 596–602. [Google Scholar] [CrossRef]
- Ibarz, A.; Garvin, A.; Costa, J. Rheological behaviour of sloe (Prunus spinosa) fruit juices. J. Food Eng. 1996, 27, 423–430. [Google Scholar] [CrossRef]
- Sharoba, A.M.; Senge, B.; El-Mansy, H.A.; Bahlol, H.; Blochwitz, R. Chemical, sensory and rheological properties of some commercial German and Egyptian tomato ketchups. Eur. Food Res. Technol. 2005, 220, 142–151. [Google Scholar] [CrossRef]
- Bayod, E.; Willers, E.P.; Tornberg, E. Rheological and structural characterization of tomato paste and its influence on the quality of ketchup. LWT—Food Sci. Technol. 2008, 41, 1289–1300. [Google Scholar] [CrossRef]
- Rydzak, L.; Kobus, Z.; Nadulski, R.; Wilczyński, K.; Pecyna, A.; Santoro, F.; Sagan, A.; Starek-Wójcicka, A.; Krzywicka, M. Analysis of selected physicochemical properties of commercial apple juices. Processes 2020, 8, 1457. [Google Scholar] [CrossRef]
- Maskan, M.; Göǧüş, F. Effect of sugar on the rheological properties of sunflower oil–water emulsions. J. Food Eng. 2000, 43, 173–177. [Google Scholar] [CrossRef]
- Gleissle, W.; Hochstein, B. Validity of the Cox–Merz rule for concentrated suspensions. J. Rheol. 2003, 47, 897–910. [Google Scholar] [CrossRef]
- Rao, M.A.; Cooley, H.J. Rheological behavior of tomato pastes in steady and dynamic shear. J. Texture Stud. 1992, 23, 415–425. [Google Scholar] [CrossRef]
- Moelants, K.; Cardinaels, R.; Jolie, R.P.; Verrijssen, T.A.J.; Van Buggenhout, S.; Van Loey, A.M.; Moldenaers, P.; Hendrickx, M.E. Rheology of concentrated tomato-derived suspensions: Effects of particle characteristics. Food Bioprocess Technol. 2014, 7, 248–264. [Google Scholar] [CrossRef]
- Quemada, D. Rheological modelling of complex fluids. I. The concept of effective volume fraction revisited. Eur. Phys. J.—Appl. Phys. 1998, 1, 119–127. [Google Scholar] [CrossRef]
- Moelants, K.; Jolie, R.P.; Palmers, S.K.J.; Cardinaels, R.; Christiaens, S.; Van Buggenhout, S.; Van Loey, A.M.; Moldenaers, P.; Hendrickx, M.E. The effects of process-induced pectin changes on the viscosity of carrot and tomato sera. Food Bioprocess Technol. 2013, 6, 2870–2883. [Google Scholar] [CrossRef]
- Day, L.; Xu, M.; Øiseth, S.K.; Lundin, L.; Hemar, Y. Dynamic rheological properties of plant cell-wall particle dispersions. Colloids Surf. B Biointerfaces 2010, 81, 461–467. [Google Scholar] [CrossRef]
- Schijvens, E.; Van Vliet, T.; Van Dijk, C. Effect of processing conditions on the composition and rheological properties of applesauce. J. Texture Stud. 1998, 29, 123–143. [Google Scholar] [CrossRef]
- Fei, X.; Jones, O.G.; Reuhs, B.L.; Campanella, O.H. Soluble pectin acts as a particle stabilizer of tomato suspensions: The impact on tomato products rheological characterization. LWT 2021, 139, 110508. [Google Scholar] [CrossRef]
- Cámara Hurtado, M.; Greve, L.C.; Labavitch, J.M. Changes in cell wall pectins accompanying tomato (Lycopersicon esculentum Mill.) paste manufacture. J. Agric. Food Chem. 2002, 50, 273–278. [Google Scholar] [CrossRef] [PubMed]
- Beresovsky, N.; Kopelman, I.J.; Mizrahi, S. The role of pulp interparticle interaction in determining tomato juice viscosity. J. Food Process. Preserv. 1995, 19, 133–146. [Google Scholar] [CrossRef]
- Tornberg, E. Influence of fibers and particle size distribution on food rheology. In Advances in Food Rheology and Its Applications; Elsevier: Amsterdam, The Netherlands, 2017; pp. 177–208. [Google Scholar]


Disclaimer/Publisher’s Note: The statements, opinions and data contained in all publications are solely those of the individual author(s) and contributor(s) and not of MDPI and/or the editor(s). MDPI and/or the editor(s) disclaim responsibility for any injury to people or property resulting from any ideas, methods, instructions or products referred to in the content. |
© 2023 by the authors. Licensee MDPI, Basel, Switzerland. This article is an open access article distributed under the terms and conditions of the Creative Commons Attribution (CC BY) license (https://creativecommons.org/licenses/by/4.0/).