Article

Experimental Study of the Formation and Evolution of Gas Jets in Supersonic Combustion Chambers

Science and Technology on Scramjet Laboratory, National University of Defense Technology, Changsha 410073, China
*
Author to whom correspondence should be addressed.
Appl. Sci. 2023, 13(4), 2202; https://doi.org/10.3390/app13042202
Submission received: 30 December 2022 / Revised: 31 January 2023 / Accepted: 7 February 2023 / Published: 8 February 2023
(This article belongs to the Section Aerospace Science and Engineering)

Abstract

:
A simple and efficient flow field visualization method (based on shadow imaging) was applied in a direct-connect test to explore the influence of the momentum flux ratio and the jet angle on the formation and evolution of nitrogen jets in supersonic combustion chambers. The test setup adopts a rectangular flow passage to simulate a flight condition with Mach number of 6 and altitude of 25 km. The experimental results showed that (a) the flow field visualization method adopted in this paper can clearly register the formation and evolution of the shock wave structure in the flow field and the windward shear vortex on the jet surface. (b) The evolution process of the windward shear vortex is significantly affected by the jet angle. In particular, the stretching position of the windward shear vortex changed when the jet angle was obtuse. (c) The bow shocks showed local distortion due to the periodic generation of large-scale shear vortexes. (d) Under the working conditions of the test, the largest instability of the flow field was found for a jet angle of 120°. This work provides, on one hand, the experimental basis for clarifying the formation and evolution mechanism of transverse gas jets, and on the other, valuable data that can be used to validate numerical simulations.

1. Introduction

Aspirated hypersonic vehicles have a broad application prospect and represent a technological revolution in the aerospace industry [1,2,3]. The scramjet is the core device of this kind of vehicle, the fuel and air combustion efficiency the being key factor determining its performance [4,5]. The transverse jet is widely used in scramjet engines as a simple fuel injection solution [6,7]. The typical transverse jet flow field structure is shown in Figure 1 [8]. A difficult and still open problem of this kind of scramjets is achieving a rapid mixing and stable combustion of fuel and supersonic air within the limited space and time range [9,10,11,12]. To approach this issue, the mixing process must be studied in detail, because it is a necessary condition for stable combustion [13,14].
With the development of power systems, there are nowadays many types of transverse jets, such as the pure gas–liquid fuel jet (liquid scramjet), gas–liquid concomitant fuel jet (liquid scramjet) and gas–solid fuel jet (solid-powder scramjet) [15,16]. In all these, the gas jet plays an important role. The flow field vortex structure generated by the gas jet, especially the windward shear vortex on the jet surface, plays an important role in the fuel mixing process. Current research on the formation and evolution of gas jets mainly focuses on numerical calculations [6,17,18]. Many scholars have carried out numerical simulations to illustrate the jet flow characteristics. For example, Sun et al. used a direct numerical simulation to study the transverse jet structure in a supersonic flow field and introduced the formation and evolution mechanism of various rotating vortex pairs in detail, including their influence on flow characteristics [19,20]. Schlieren and other related technologies based on trace particle imaging have been widely used in experiments. Ben-Yakar et al. used an experiment to show that a large-scale shear vortex structure is periodically generated at the shear layer formed between the jet and inflow near the nozzle [21,22]. The shear vortex evolution in the flow field has three main steps: formation, stretching, and tearing. Liang et al. used the Nano-based Planar Laser Scattering (NPLS) technique to observe the gas-phase jet wake [23]. Their experiment clearly showed the bow shock in the jet upstream, the turbulent boundary layer of the inlet flow, and the large-scale turbulent structure in the downstream area, including the K-H vortex and the high-turbulence wake structure. However, Liang et al. argued that the generation of shear vortexes is considerably random and not periodic. The transverse jet in supersonic flow fields has been studied based on many factors, such as jet fuel type, jet momentum flux ratio, jet nozzle parameters (number, shape), etc. [7,13,14,24]. Regardless of this, there are only a few experimental studies on the formation and evolution of gas jets, including the effects of the jet injection angle [25,26,27]. Moreover, the observation techniques used in current experiments have various shortcomings, such as a complex optical path and image interference. Schlieren usually requires a Z-type optical path, and the imaging quality of NPLS depends on the concentration and location of the tracer particles [23,28,29,30].
This work studied the formation and evolution of the transverse gas jet in supersonic airflows, especially the eddy structure, using an experimental setup with single round hole injection, and a simple flow field visualization technology (based on shadow imaging). The influence of the jet flux ratio and jet angle on the process was also investigated. The rest of the paper is organized as follows. Section 2 introduces the test system and flow field visualization method. In Section 3 the test results are analyzed and discussed. Section 4 presents the main conclusions and provides design guidelines for the engineering implementation of an injection structure in a scramjet combustion chamber. This work not only clarifies the formation and evolution of the transverse gas jet through experiments, but also provides valuable verification data for future numerical simulations.

2. Test and Observation Setup

2.1. Test System

2.1.1. Direct-Connect Tests

The ground direct connection test system of the National University of Defense Technology, shown in Figure 2, was used to perform the experiments. The setup includes an air heater, a rectangular supersonic flow channel (isolation section, test chamber, expansion section), a jet generator, and a measurement and control system. The three-component combustion heater (alcohol/oxygen/air) produced an oxygen mass fraction in the gas of about 0.23. The gas was accelerated to Ma 2.6 by a Laval nozzle at the end of the heater, which was used to simulate a supersonic mainstream at the entrance of the isolation section. The jet generator was used to provide a sonic nitrogen jet, and the diameter (d) of the jet outlet was 3 mm. Two windows were opened on lateral walls of the test chamber for observation. Various parameters such as pressure (air heater and jet generator) and mass flow rate (air heater) were measured during the test. The pressures at the air heater and jet generator were measured by high-pressure sensors (range 0~6 MPa, error ±0.5%). The mass flow rate of each component of the air heater was measured by turbine flowmeters with different ranges and an error of ±0.2%. The whole test process was controlled by a dedicated measurement and control system, which also increased the operational safety.
The test simulated a flight condition with Mach number of 6 and altitude of 25 km. Table 1 shows the simulated gas parameters of the incoming supersonic flow at the entrance of the isolation section.

2.1.2. Jet Generating Device

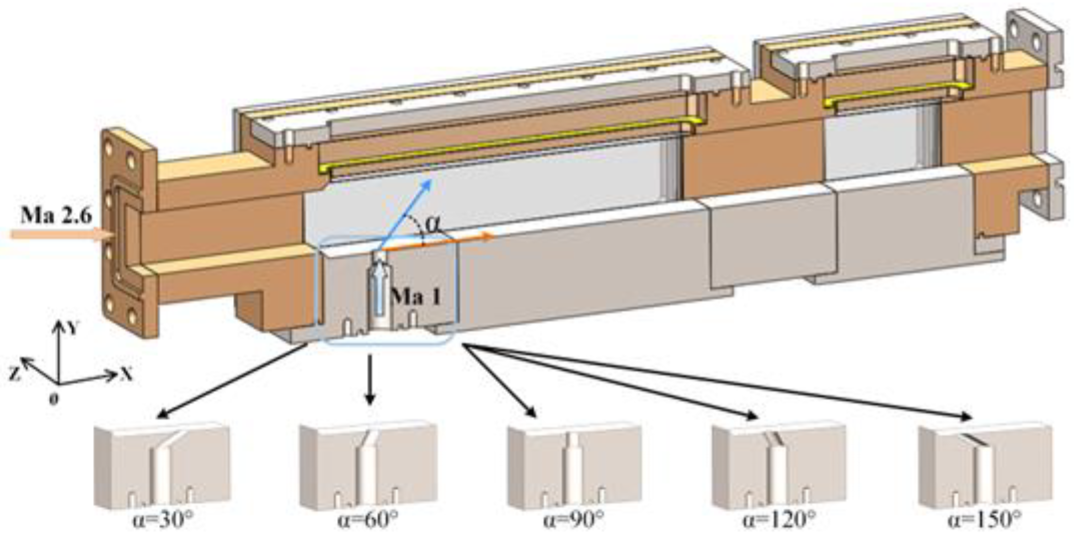
The modular jet generator shown in Figure 3 was designed to explore the influence of jet angle and momentum flux ratio on the formation and evolution of the nitrogen jet in a supersonic inlet flow. Different jet angles can be realized by replacing the jet generator. The jet angle α was defined between supersonic mainstream and jet velocity directions. Five different jet angles were tested and analyzed: 30°, 60°, 90°, 120°, and 150°. It should be emphasized that though the skew of the nozzle leads to uneven Mach number distribution at the nozzle outlet, this was ignored in the present analysis. The following Cartesian coordinate system was defined to facilitate the subsequent discussion. The positive X axis direction (streamwise direction) is the same as that of the mainstream velocity, the positive Y axis direction (longitudinal direction) is the same as that of the sonic jet velocity, and the positive Z axis direction (spanwise direction) is the same as the camera viewing direction.
The momentum flux ratio of the nitrogen jet is given by the following equation [31]:
J = ( ρ u 2 ) j ( ρ u 2 ) ,
where the subscript j denotes the jet outlet condition, and ∞ denotes the supersonic mainstream condition at the front of the bow shock.
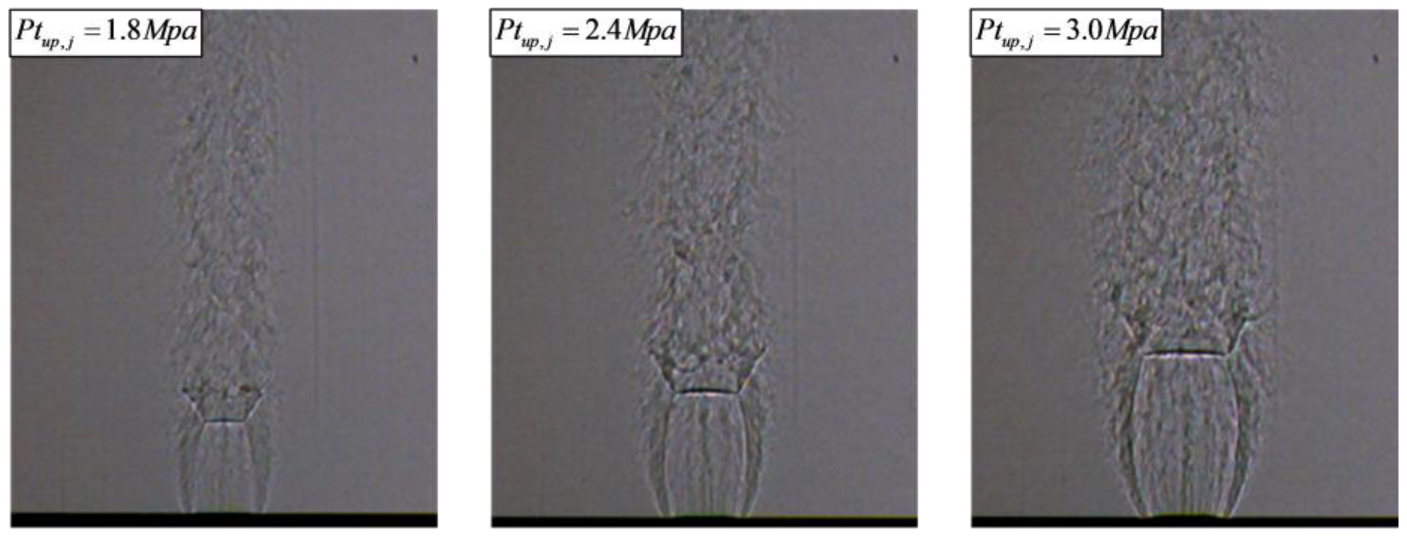
The momentum flux ratio of jet was controlled by changing the total pressure of jet ( P t j ). Three values of P t j of efflux were used during the experiment, namely, 1.8 , 2.4 , and 3.0   Mpa . Due to the flow loss caused by pipeline deformation and other factors, the total pressures at the jet outlet and upstream were not consistent. In this work, the total pressure at the outlet of the jet was determined by the position of the Mach disk, which was generated when the jet expanded in free space. The empirical formula for the Mach disc position and the jet total ( P t j ) and back ( P e b ) pressures was proposed by Ashkenaz and Sherman [32], namely:
y 1 d = 0.67 ( P t j P e b ) 0.5 ,
where y 1 is the height of the Mach disk.
The flow field observation technique (described in Section 2.2) was used to obtain the free expansion results of the efflux for the above-named three upstream total pressures, as shown in Figure 4. In addition, Formula (2) was used to obtain the total pressure at the jet outlet. Other parameters at the jet outlet were obtained using NASA thermodynamic calculation software [33], as shown in Table 2. The numerical results showed that the momenta flux ratio of the jet was 0.49, 0.88, and 1.46, for pressures 1.8 , 2.4 , and 3.0   Mpa , respectively.
A total of 15 experimental tests were carried out to explore all the combinations of the five jet angles and three jet momentum flux ratios. The identification number and working conditions of all the tests are shown in Table 3.

2.2. Flow Field Visualization Technology

2.2.1. Proposed Setup

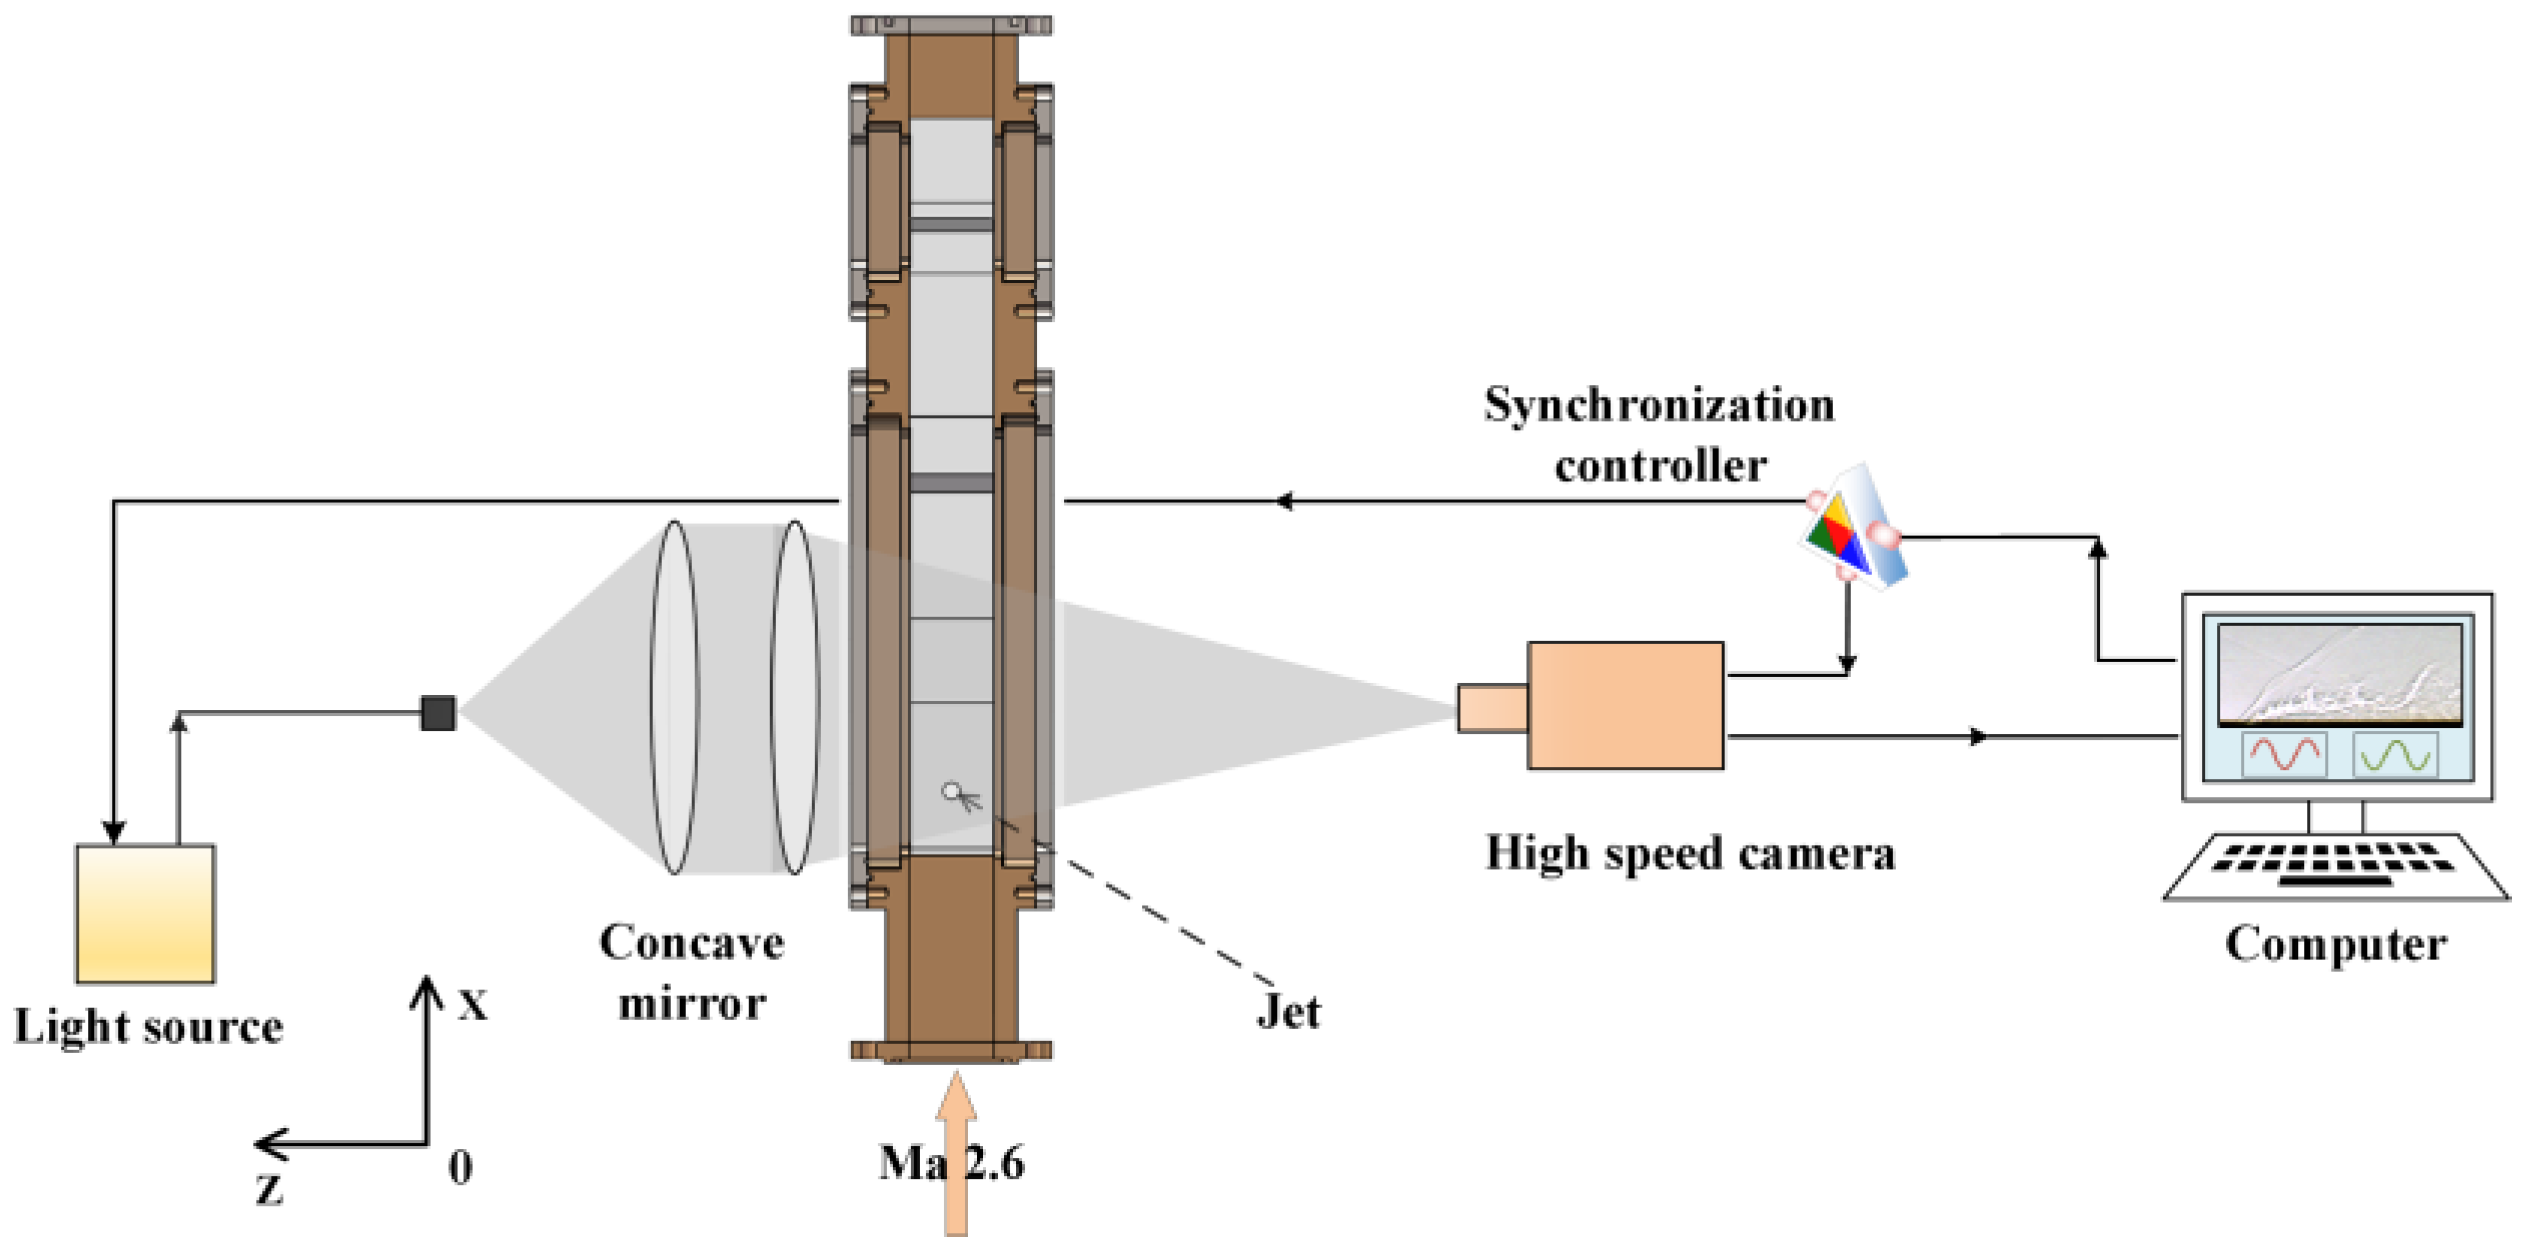
The adopted flow field observation device was based on shadow imaging, as shown in Figure 5, and is capable of dealing with the rapid changes in the supersonic flow field parameters. The device is composed of a continuous light source fed by optical fiber, a double convex lens system, a high-speed camera, a synchronous control device, and the main control computer. The aperture of the continuous light source was 260 mm, and the uniformity could reach 90%. The maximum acquisition frequency of the high-speed camera was 1 MHz, the minimum exposure time was 159 ns, and the sensor size was 1024 × 1024. The synchronous control device triggered the camera and light source with an accuracy of 10 ns, which permits imaging of the transient structure of the high-speed flow field. The stable operation time of the test system achieved during the experiment was 3.5 s, with a camera shooting time of 3 s.

2.2.2. Image Processing

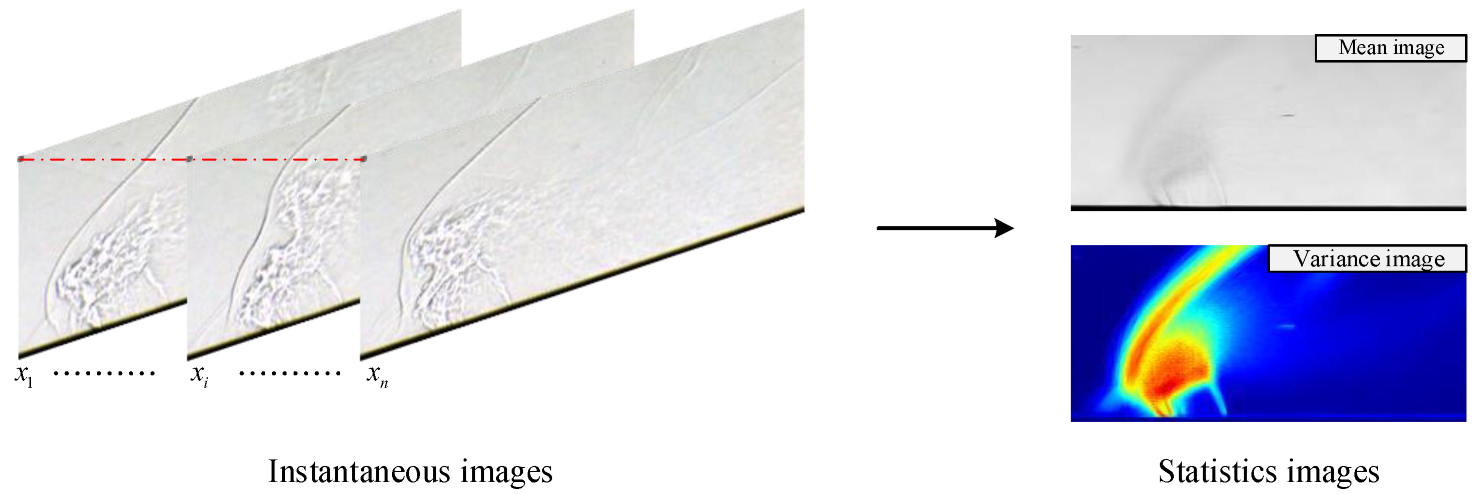
A sequence of 30,000 images (0.3 s) was acquired under a stable flow condition to perform a statistical analysis and derive the mean temporal characteristics of the flow field. In particular, the temporal mean and standard deviation of each pixel were calculated. The mean and standard deviation maps were calculated using Formulas (3) and (4). According to the statistical significance represented by the statistical feature number, the mean map can reflect the mean temporal characteristics of the flow field, while the standard deviation map can reflect the instability characteristics of the flow field [34]. The typical processing results are shown in Figure 6.
x ( m , n ) ¯ = 1 n i = 1 n x i , ( m , n ) ,
S ( m , n ) = i = 1 n ( x i , ( m , n ) x ( m , n ) ¯ ) 2 n 1 ,

3. Results

The instantaneous images obtained with the proposed imaging system were used to study the formation and evolution of a nitrogen jet in supersonic airflow. The present section describes and discusses the experimental results, and is organized as follows. Section 3.1 presents the typical instantaneous flow field diagram under various working conditions; this includes an analysis of the structural characteristics of the flow field under different jet angles and jet momentum flux ratios. Meanwhile, Section 3.2 describes the spatiotemporal characteristics of the flow field under typical working conditions, using the images’ time series. Finally, the temporal statistical characteristics of the flow field are discussed in Section 3.3.

3.1. Discussion on Instantaneous Flow Field Structure

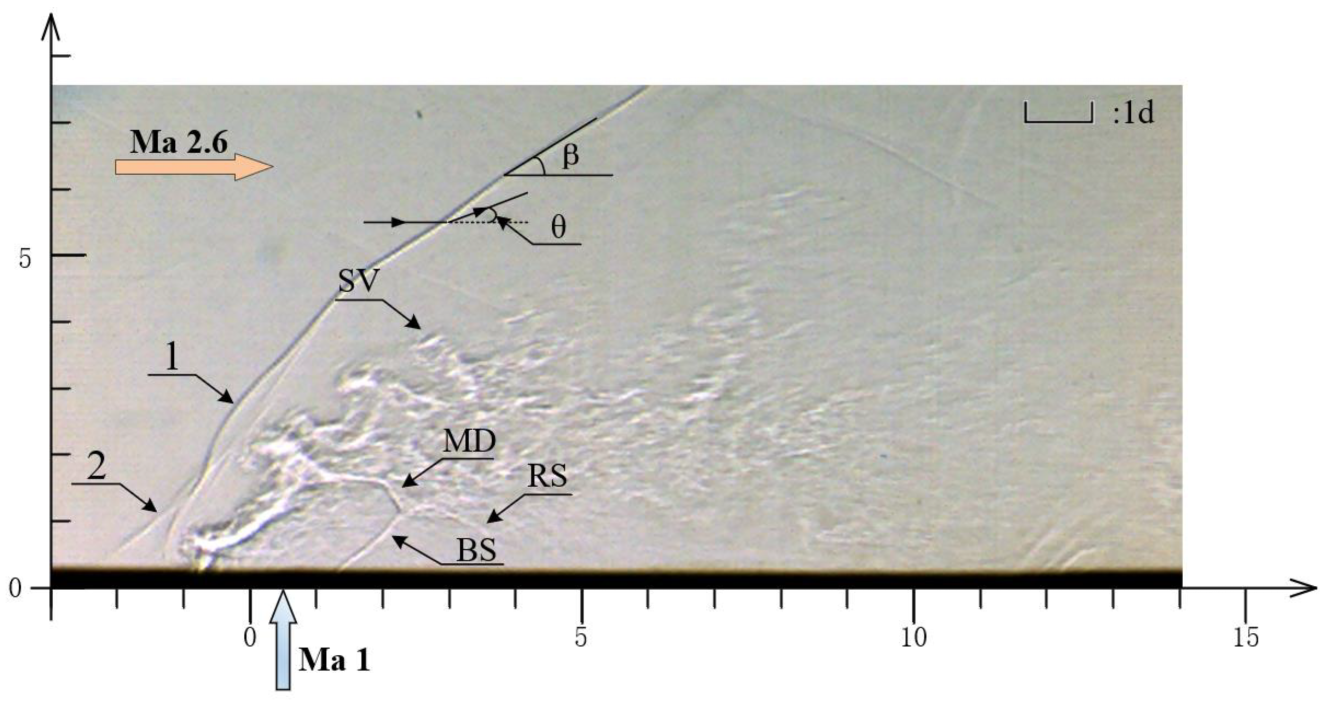
Figure 7 shows the instantaneous flow field structure captured during Test 06, evidencing a clear typical flow field structure that includes the following features: (a) Bow shock (labeled 1), which is formed in the upstream of the nozzle by the obstruction effect of the transverse jet on the mainstream. (b) Separation shock (labeled 2) is produced by the adverse pressure gradient along the wall, which causes the separation of the boundary layer. (c) Barrel-like shock wave (labeled BS) and Mach disk (labeled MD) at the outlet position, formed by the jet expansion and acceleration in the supersonic inlet flow. (d) The latter also produced a reflected shock wave (labeled RS) at the end of the barrel-like shock wave. (e) Shear vortex (labeled SV) on the windward shear layer of the jet, produced by the Kelvin–Helmholtz instability resulting from the velocity shear between the jet and the surrounding gas. In addition, the angle (β) of the bow shock and the deflection angle (θ) of the mainstream are also marked.
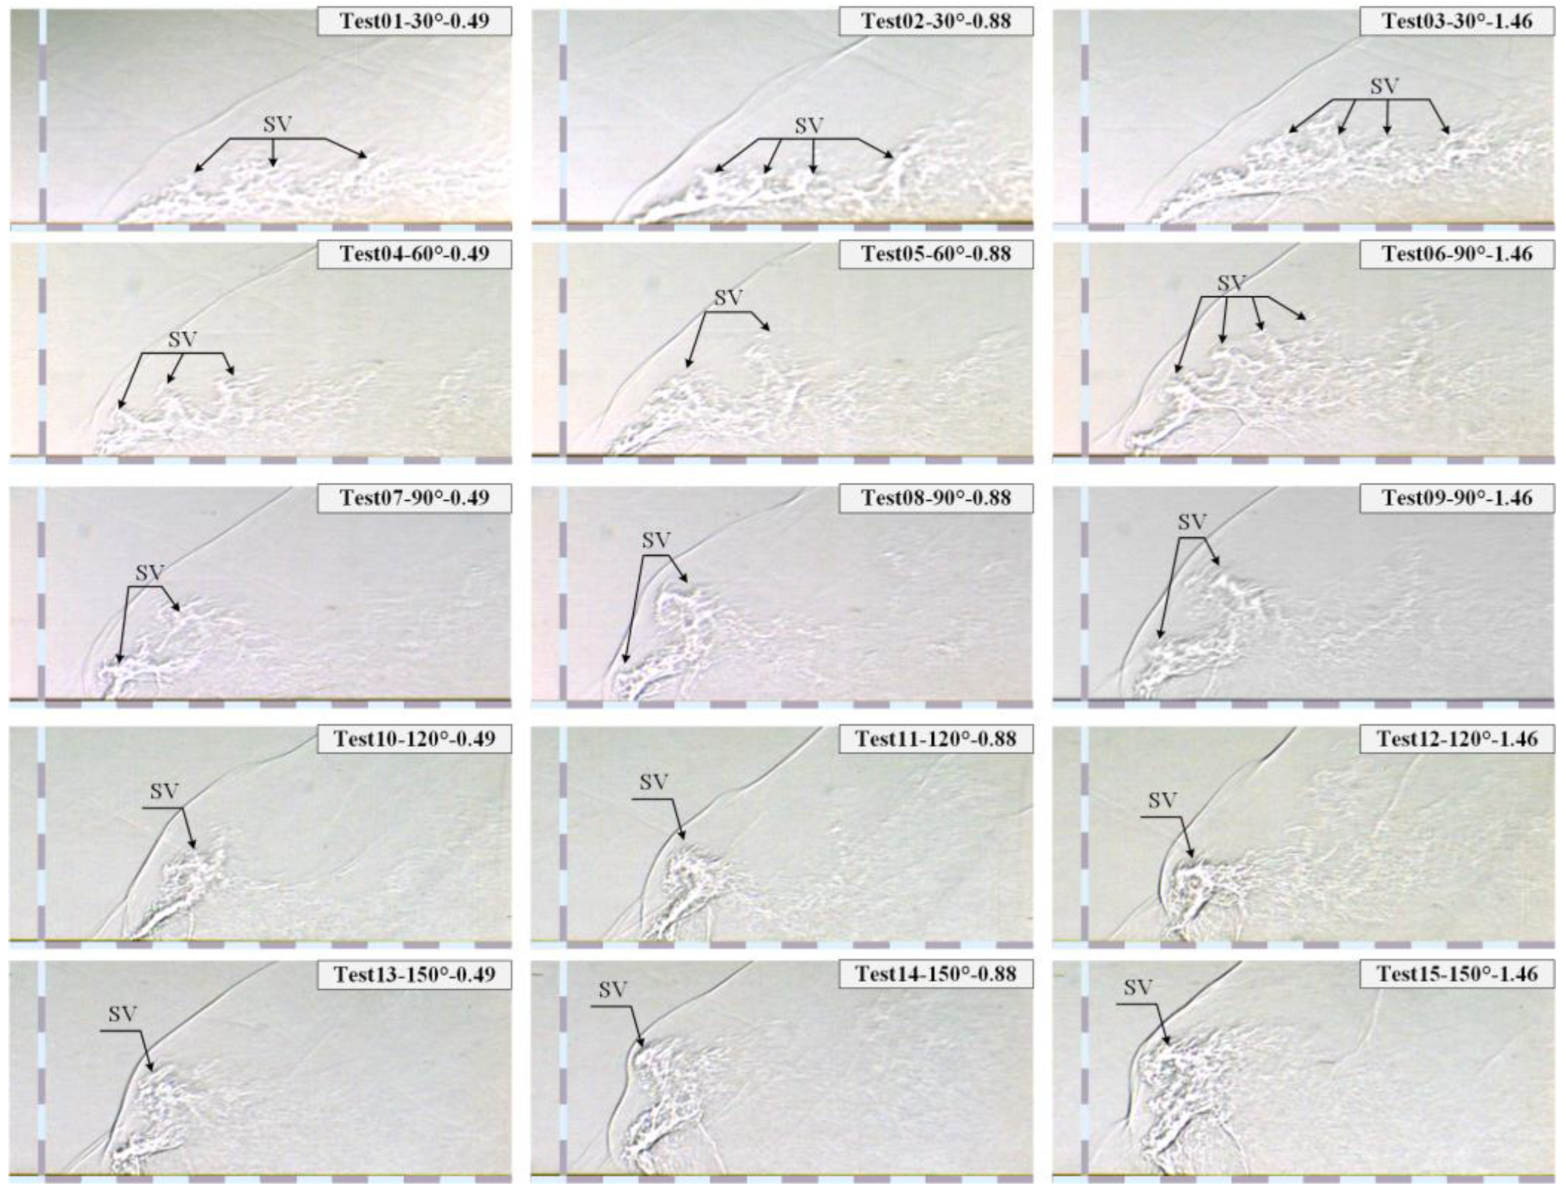
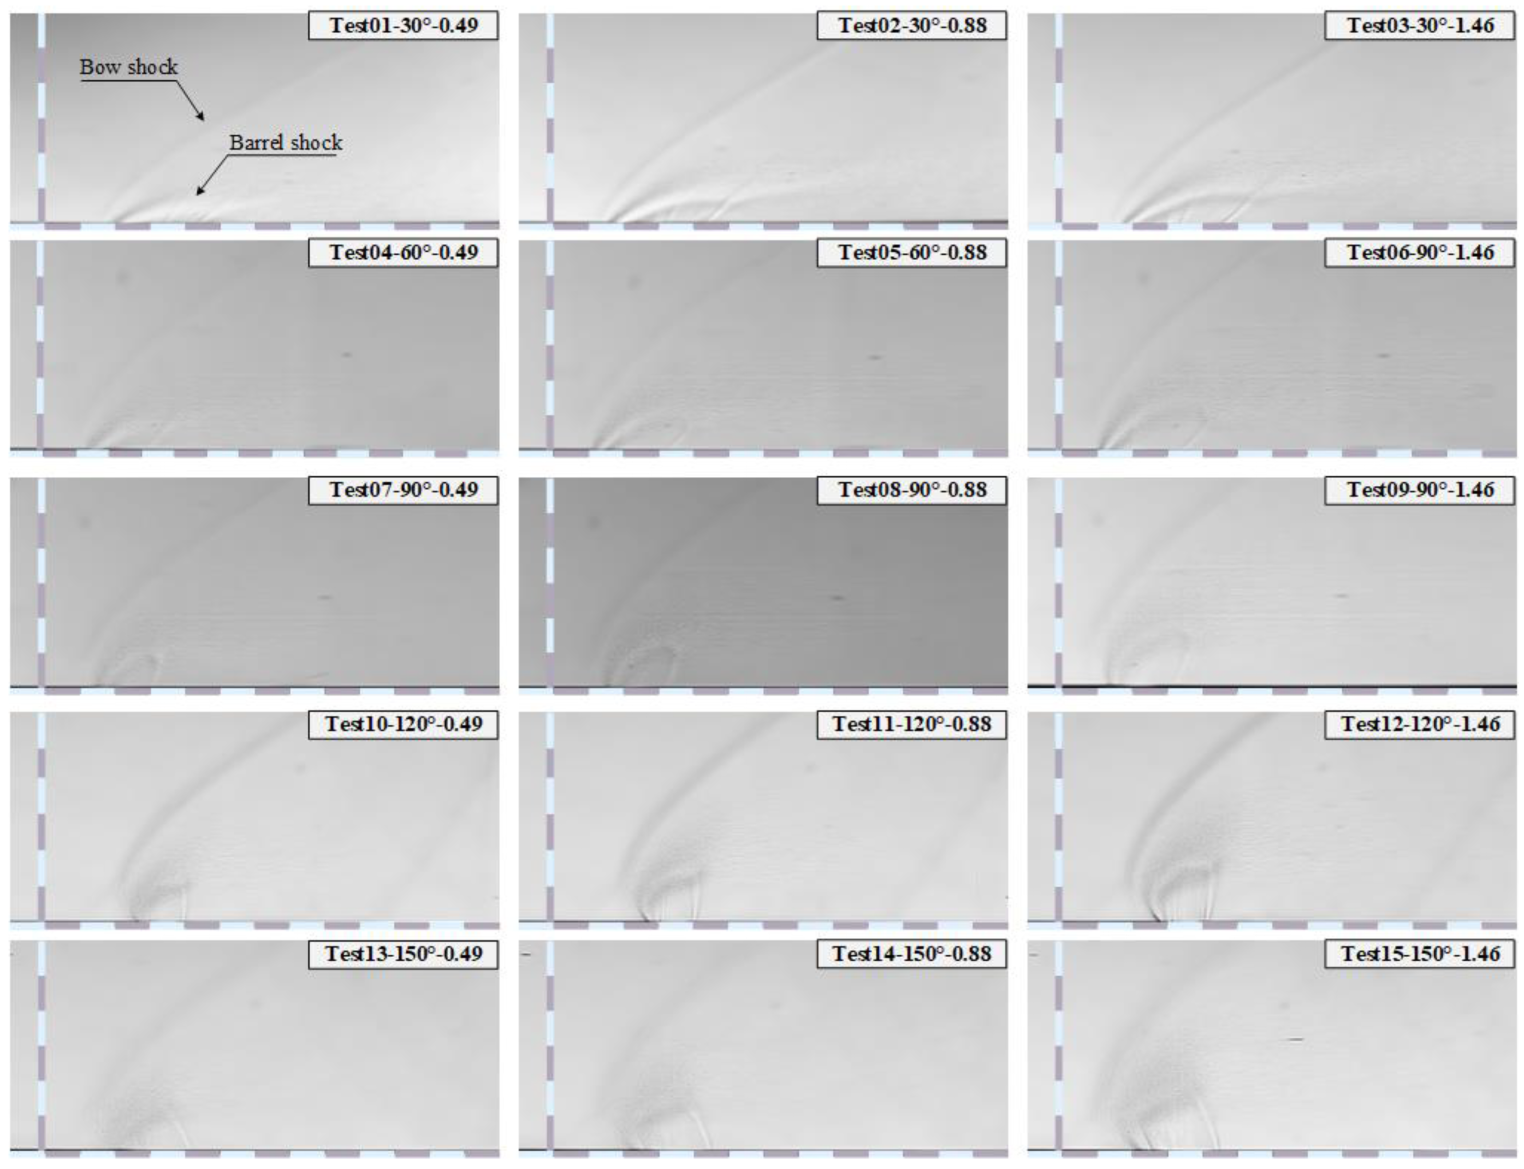
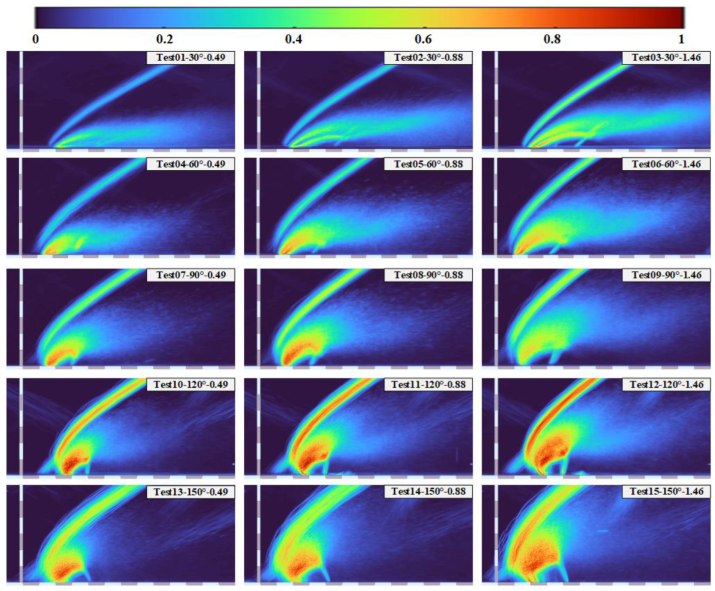
The influence of jet angle and jet momentum flux ratio on the flow field structure was qualitatively demonstrated by comparing the instantaneous flow structure diagram under various working conditions, see Figure 8. The images in each row of Figure 8 have the same jet angle, while each column presents the same jet momentum flux ratio. The legend gives information on the test ID, jet angle and jet momentum flux ratio. In addition, the scale grid in the images of Figure 8, and all the images in the rest of the paper, have a step size (given by the purple or grey rectangles) of d.
Compared with the momentum flux ratio, the jet angle had a greater influence on the windward shear vortexes in the flow field, such as scale, quantity, and spatial distribution. The shear vortices in the jet flow field with an acute angle were smaller, more numerous, and had a wider spatial distribution range of the flow direction compared with an obtuse angle. In addition, a shear vortex coherent structure was formed in the shear layer for the acute angle jet field. This originates from the intermittent collision between the high-speed mainstream and the relatively low speed of the jet boundary. It is concluded that the velocity difference between the jet flow and the local mainstream is the main factor affecting the size of the shear vortex. Moreover, the evolution of the windward shear vortex is mainly influenced by the compressibility effect of the shear layer. It can be inferred that, when an acute angle injection is adopted, the jet has little influence on the main flow obstruction, and the mainstream after the bow shock still maintains supersonic flow, which leads to longer spatial distance for shear vortex dissipation in the flow field.
By comparing the instantaneous flow field diagram of the images in each row of Figure 8, it can be seen that an increase of the jet momentum flux ratio improves the jet penetration depth, and also raises the lower edge of the jet wake. This effect favors fuel mixing and combustion. On one hand, it can increase the contact area between jet and main stream, improving mixing efficiency. On the other hand, the high temperature area can be located in the center of the flow passage, relaxing the requirements on the chamber wall thermal protection. By comparing the instantaneous flow field diagram of each column in Figure 8, it is evidenced that a change of the jet angle produces significant differences in the jet wakes. As the jet angle increased, the shear layer between the jet and the main stream decreased, as did the spatial distribution range of the shear vortex. In addition, with the increase of both jet angle and jet momentum flux ratio, the separation shock wave became more obvious, and the shape of the bow shock changed significantly. The smooth shape formed with an acute jet angle or a low emission flux ratio was transformed into a curved shape for obtuse jet angles or high emission flux ratios. The most evident reason for this change is that the influence range of the hear vortexes generated by the jet expanded, increasing the correlation between the shape of the bow shock and the vortexes on the jet surface.

3.2. Spatiotemporal Evolution of the Flow Field

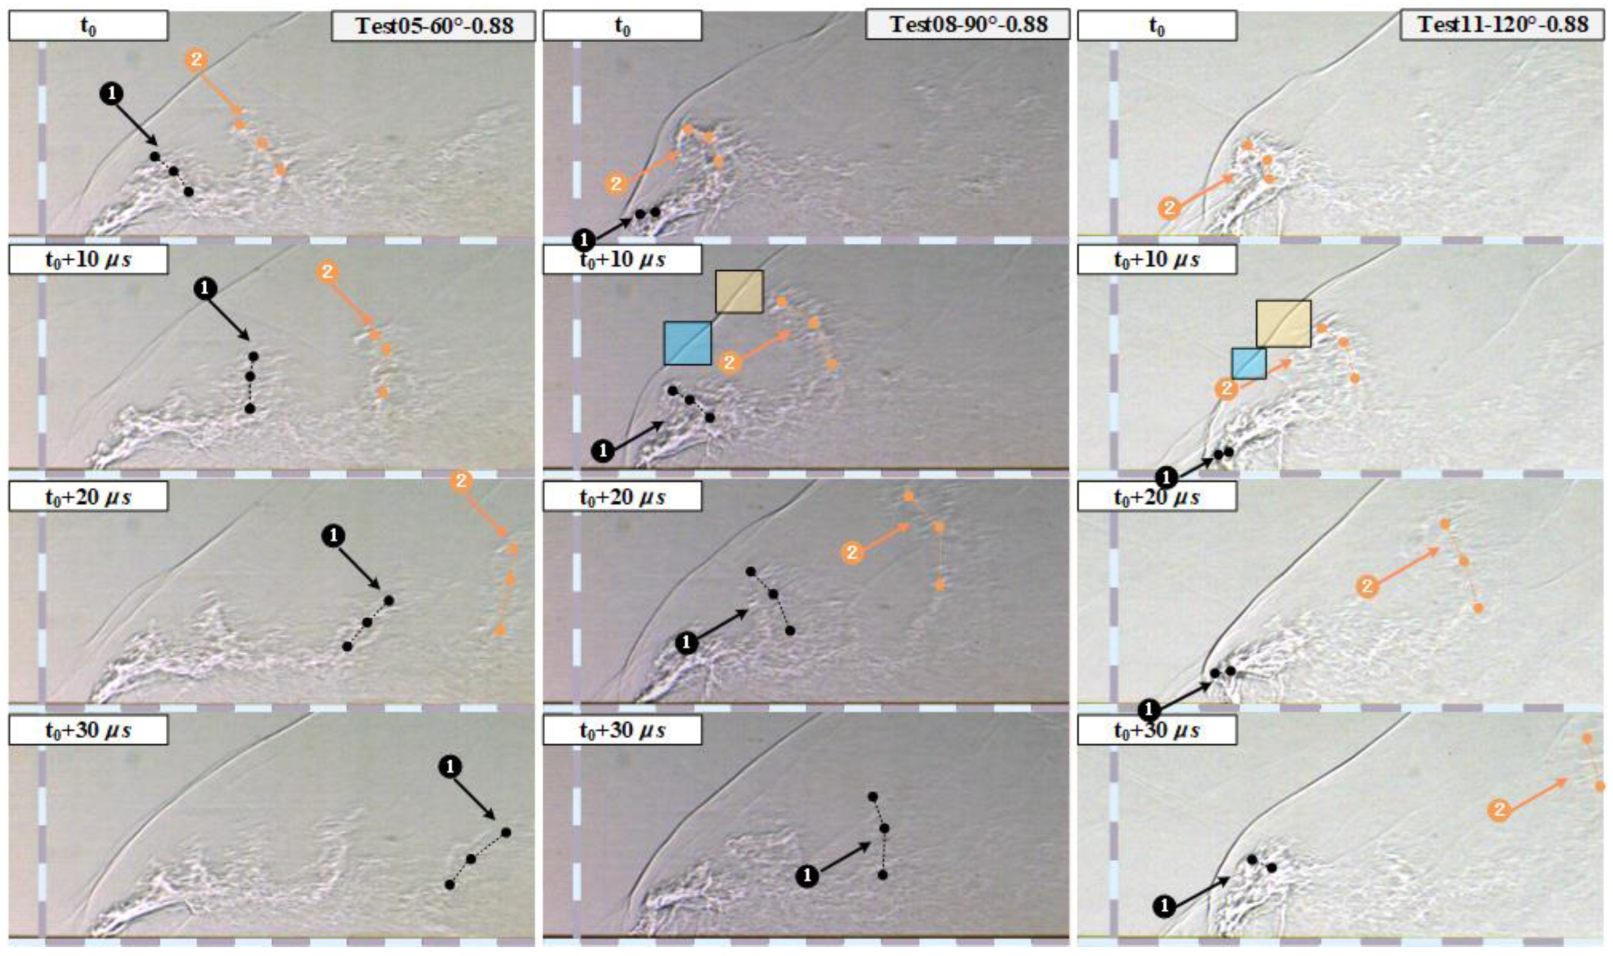
Based on the understanding of the instantaneous flow field structure, three typical test conditions are selected in this section to study the spatiotemporal evolution of the flow field, and the influence of the jet angle on the shear vortex. Figure 9 shows the evolution of the shear vortices under different working conditions. It should be emphasized that due to the complex turbulent structure and limited spatial accuracy of observation, the flow characteristics of individual vortices are not clear. Therefore, the area where vortex exist is used as the research object to discuss the spatiotemporal evolution of the flow field. Label ① or ② represents the area where the vortex exists, and for ease of description, it is called shear vortex ① or ②. The images in each column in the Figure 9 correspond to different time instants, separated by 10 μs, of the same test.
Under the conditions of Test 05, the shear vortex labeled ① and located above the barrel shock wave at time t0, developed into a bow-like shape. At the time t0 + 10 μs, the shear vortex ① further developed downstream. As the velocity of the main stream was higher than that of the shear layer, the part of the vortex that was closer to the main stream (see the red dot) stretched, changing the vortex shape from bow-like to straight line. At t0 + 20 μs, the shear vortex ① continuously stretched and was inclined downstream. At t0 + 30 μs, the vortex began to tear apart due to the velocity difference of each part. On the other hand, during Test 11, the bow-like shear vortex labeled ② kept its general shape when it developed downstream and uplifted, between t0 and t0 + 10 μs. At t0 + 30 μs, shear vortex ② separated from the shear layer and began to tear. However, its morphology did not tilt downstream within the image field of view. The shear vortex evolution found during Test 08 was in between those explained above for Test 05 and Test 11. The main difference occurred during the stretching stage of the vortex. The analysis shows that the stretching is caused by the velocity difference of the different sections of the shear vortex, which is produced by the variable velocity field of the main stream in that area.
In experiments reported by previous works, the intensity of the bow shock typically decreases along the longitudinal direction. This occurs because the velocity of the main stream after the bow shock is inversely proportional to the strength of the latter. Consequently, the velocity of the main stream after the bow shock increases monotonically along the longitudinal direction, and the shear vortex near the main stream is stretched and tilted downstream. This is also the formation and evolution process observed for shear vortex ① and ② in Test 05. However, it can be seen that the intensity (angle) of the bow shocks at the area, delimited by the blue square in Figure 9, was greater than that at the area given by the yellow square. This suggests that the strength of bow shock does not change monotonously along the longitudinal direction. As a consequence, the tensile position of the shear vortex is no longer only the portion closer to the main stream.
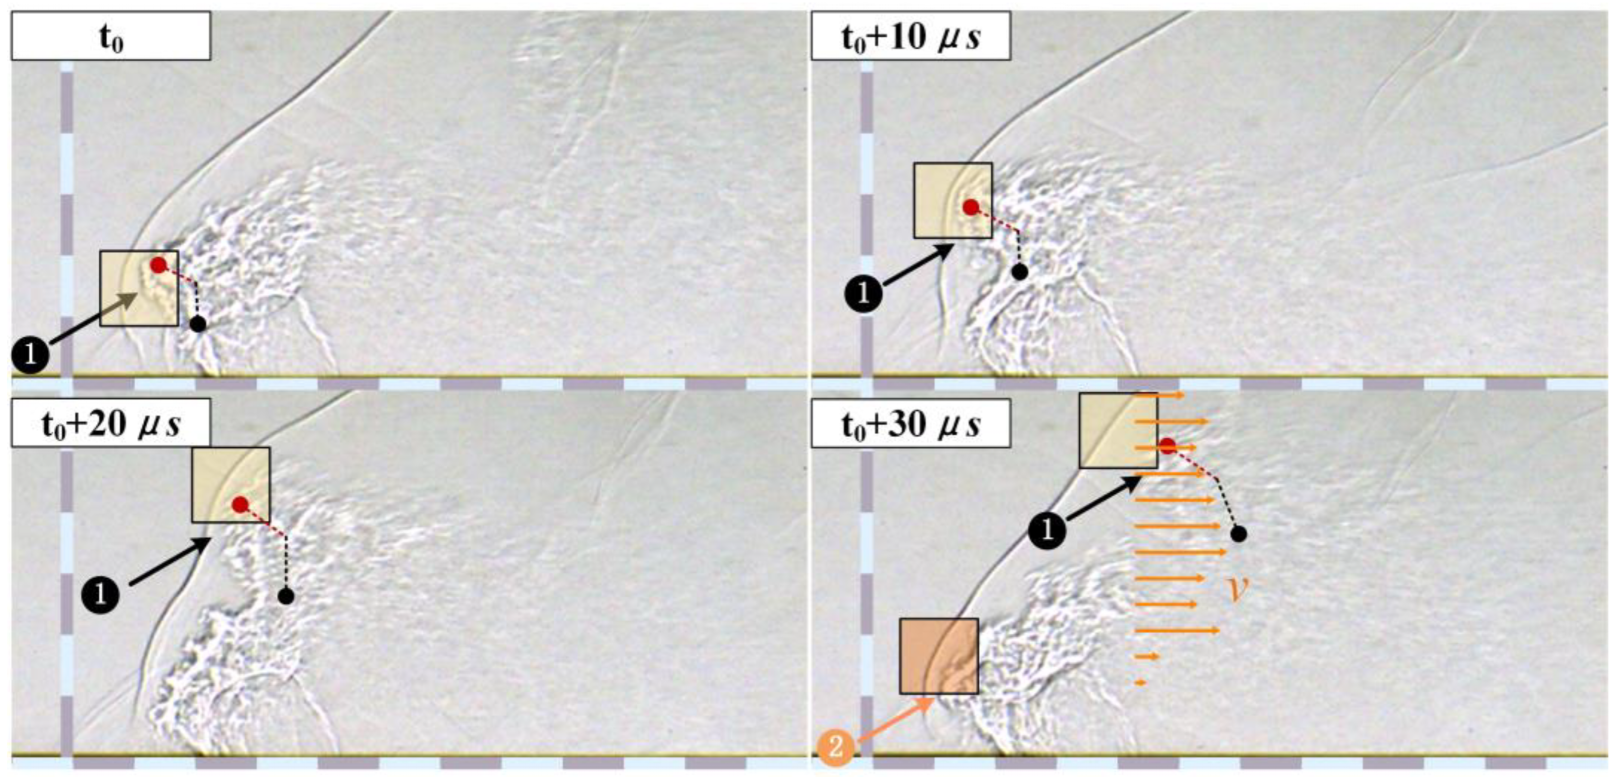
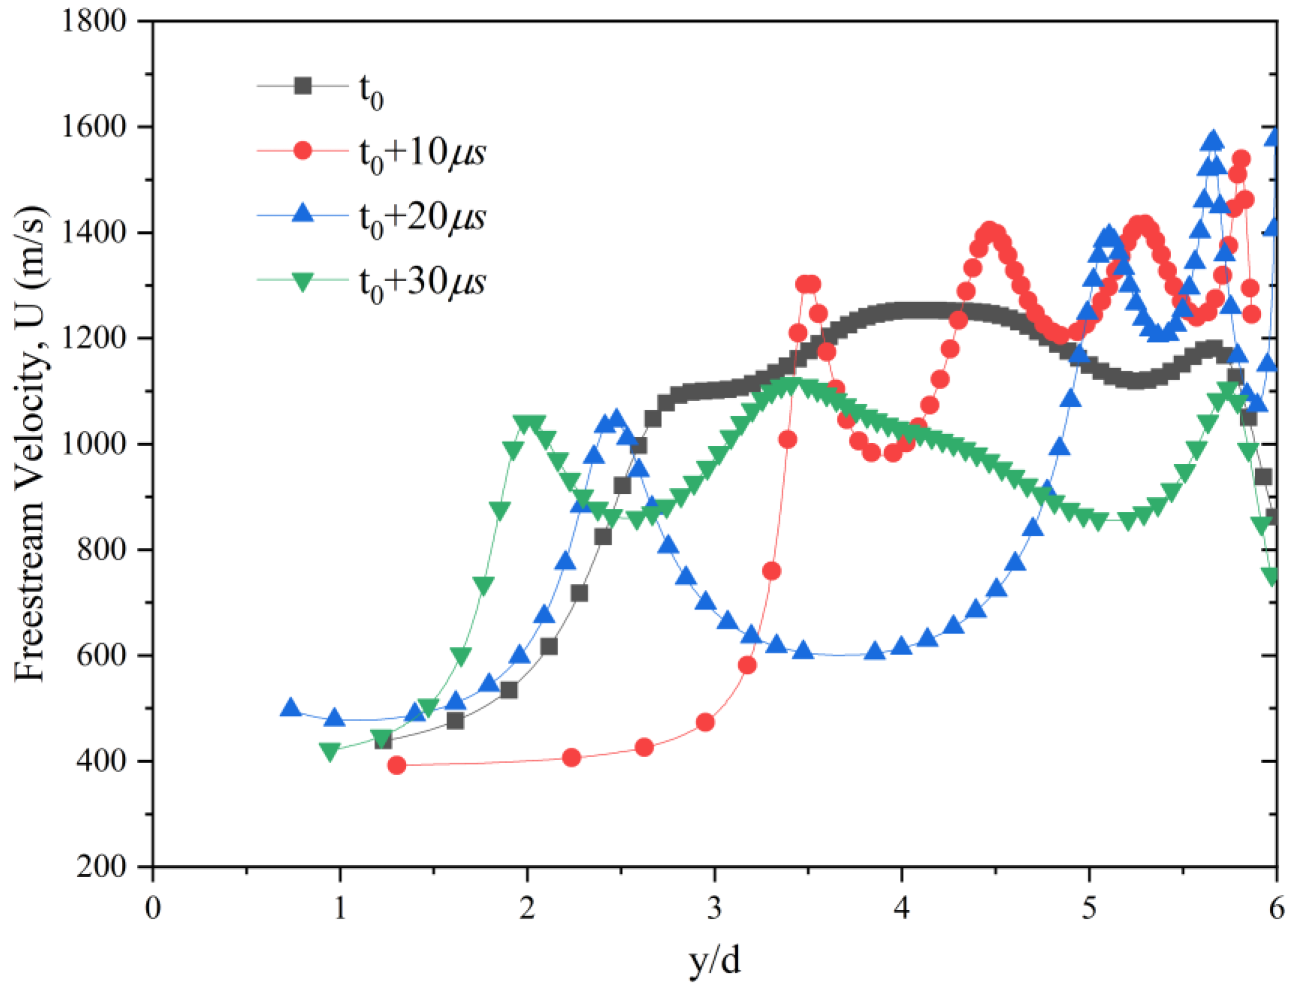
In order to further illustrate the change of the tensile position of the shear vortex, Figure 10 shows the typical spatiotemporal evolution of the flow field registered during Test 15. Meanwhile, using the position of the bow shock acquired in the test image, the mainstream velocity (U) along the longitudinal direction behind the bow shock at each time in Figure 10 was calculated, as shown in Figure 11. The complete evolution of shear vortex ① in the flow field can be observed. Multiple extreme values of the bow shock angle result in alternating changes of the mainstream velocity along the longitudinal direction, as represented by the orange line segments in the t0 + 30 μs image. The length of the segments indicates the magnitude of the mainstream velocity. This is also the same as the curve characteristic in Figure 11. As a result, the shear vortex was stretched not at the location closer to the mainstream (indicated by the red dot), but at the lower end of the shear vortex (indicated by a black dot). In addition, a new shear vortex ② can be observed at t0 + 30 μs.
Finally, by combining Figure 9 and Figure 10, it is found that the spatiotemporal evolution of the shear vortexes under all working conditions showed some similarities. In particular, the generation of periodicity and the formation of shear vortexes proceeded through three stages: development, stretching, and tearing. However, the stretching locations were different. In addition, when the jet angle was obtuse, the flow field structure (bow shock, barrel shock wave, and Mach disk) also exhibited fluctuations due to the action of the shear vortexes.

3.3. Statistical Properties of the Flow Field

Figure 12 shows the average flow field images obtained after image processing (as described in Section 2.2.2) for each test. Bow shock, generated by jet blocking, and barrel-shaped shock waves, generated by jet expansion, could be seen in all cases. The angle of bow of the shock wave increased gradually with the jet angle or jet momentum flux ratio. However, when the jet angle was greater than 90°, the change on the bow shock angle was no longer obvious. The initial position of the bow shock gradually rose, indicating that a further increase of the jet angle will mainly affect the range of the pre-jet separation area. On the other hand, for the barrel shock wave, the Mach disk was not obvious when the jet angle was obtuse. The analysis shows that the shear vortex generated by the windward position of the barrel shock wave caused shielding and fluctuation of the Mach disk.
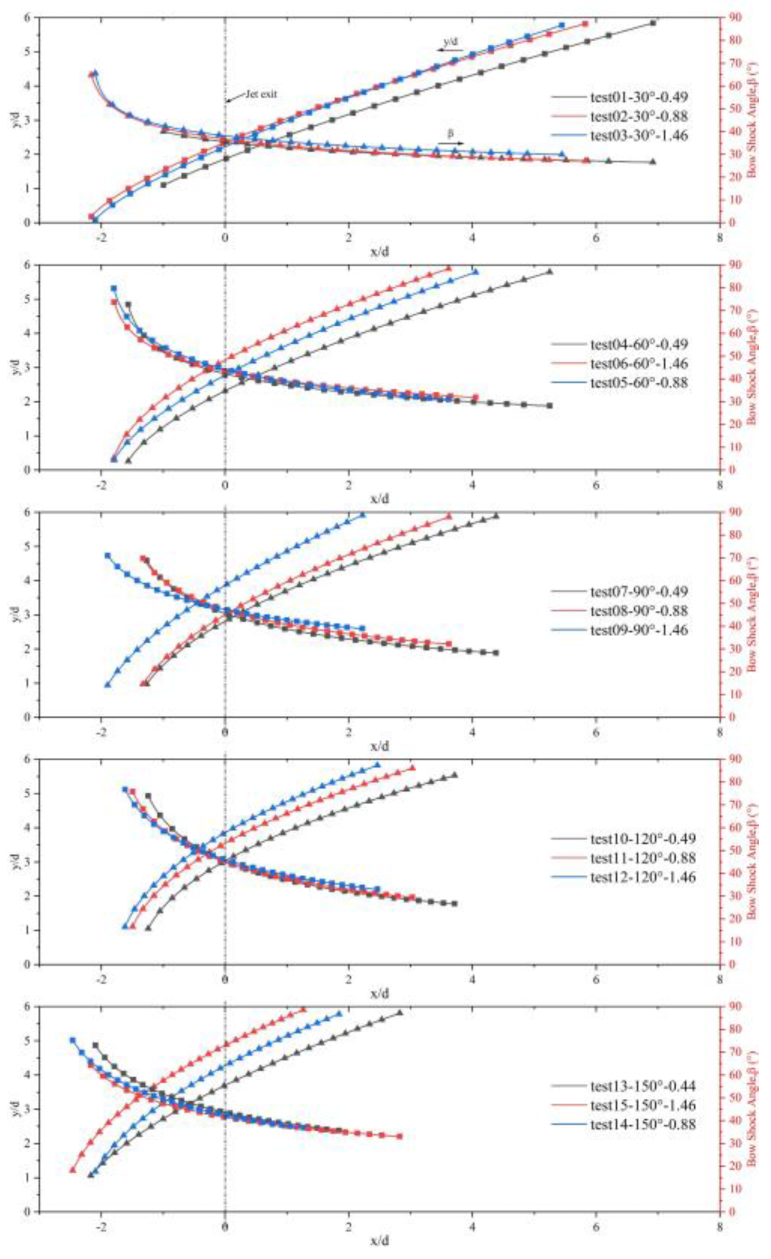
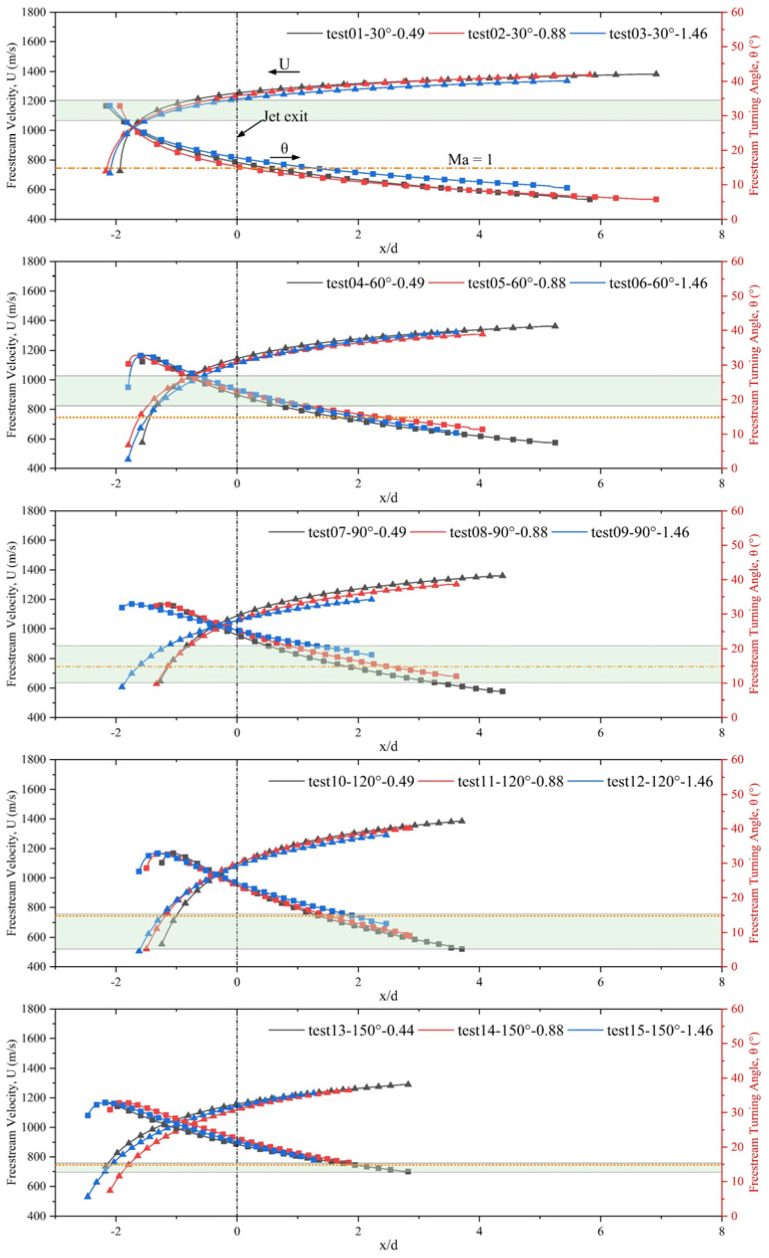
To quantitatively describe the changes of the flow field structural parameters under various working conditions, the position and angle (β) of the bow shock, as well as the mainstream velocity (U) and deflection angle (θ) behind the bow shock, were calculated from Figure 12. The results are shown in Figure 13 and Figure 14. This process uses the complete gas hypothesis. Figure 13 shows that, within the studied field of view (−3 d to 8 d), the bow shock in all tests had the maximum angle (70° to 80°) at the starting position, and monotonically decreased to about 30° along the flow direction. In Figure 14, the mainstream velocity behind the bow wave also shows a monotonous increase, from about 600 to 1700 m/s. However, the mainstream deflection angle after the bow shock showed different characteristics. Except for a jet angle of 30°, the mainstream deflection angle during all tests first increased and then decreased. This phenomenon indicates that, when the jet angle is between 30° and 60°, the bow shock destruction occurs due to the blocking effect of the jet on the main stream. This results in a rapid decrease in the main stream velocity and deflection angle.
In Figure 14, the orange dots and lines represent the velocity when Ma = 1. In addition, the green boxes represent the regions with y/d between 1 and 2 for the same jet angle and jet momentum ratio of 0.88. This region is considered as the region where the shear layer is located for each of the working conditions given in Figure 8. It can be seen that the shear layer was located in the supersonic mainstream when an acute jet angle was adopted. In this case, the development and evolution of the shear vortex also occurred in the supersonic region. The case of a 90° jet angle lies between the two. Since the vortex structure dissipates faster in the subsonic flow, it can be assumed that the shear vortex has a shorter flow direction range when an obtuse angle is adopted, which is also consistent with the abovementioned conclusion.
It is worth mentioning that the four parameters studied above changed considerably in the upstream region of the jet nozzle, while in the downstream region these changes were relatively slow. This phenomenon indicates that the parameters of the flow field upstream of the jet nozzle change more significantly. To optimize the jet flow field, more attention should be paid to the area in front of the jet nozzle.
The standard deviation, a statistic commonly used to reflect data fluctuation in statistics, was used to analyze the instability of the flow field. To compare and analyze each condition, all the standard deviation images were normalized, as shown in Figure 15. In addition, regions with standard deviations greater than 0.6 were defined as strong fluctuation regions.
The total number of pixels in the strong fluctuation region was used to quantify it. Figure 16 shows the normalized strong fluctuation region area for different jet angles and jet momentum flux ratios. The blue line represents the mean area for each group of three momentum flux ratios that share the same jet angle.
By comparing each line (same jet angle) and each column (same jet momentum flux ratio) in Figure 15, and combining with Figure 16, the following conclusions can be drawn. (a) When the jet angle was obtuse, the flow field fluctuated more violently and the fluctuation area was larger. (b) The fluctuation area was more sensitive to the jet angle. (c) For the same jet angle, the fluctuation area was positively correlated to the change of the jet momentum flux ratio. (d) For the same jet momentum flux ratio, the fluctuation area first increased and then decreased with the monotonic increase of the jet angle.
In particular, for the jet angle of 120°, the fluctuation area was the largest, and the bow shock showed violent fluctuations. According to this analysis, when the jet angle was 120°, the mainstream velocity after the bow shock was lower compared with 90° (see Figure 14), and the jet had a countercurrent velocity. Therefore, the jet stayed in the flow field for a longer time and the shear vortex had more time to move upward. At the same time, the longitudinal momentum of the jet was only reduced by about 13%, and the jet could be lifted upward with a larger longitudinal momentum. As a result, the shear vortex had a wider distribution range in longitudinal space, which also led to the largest fluctuation area when the jet angle was 120°.
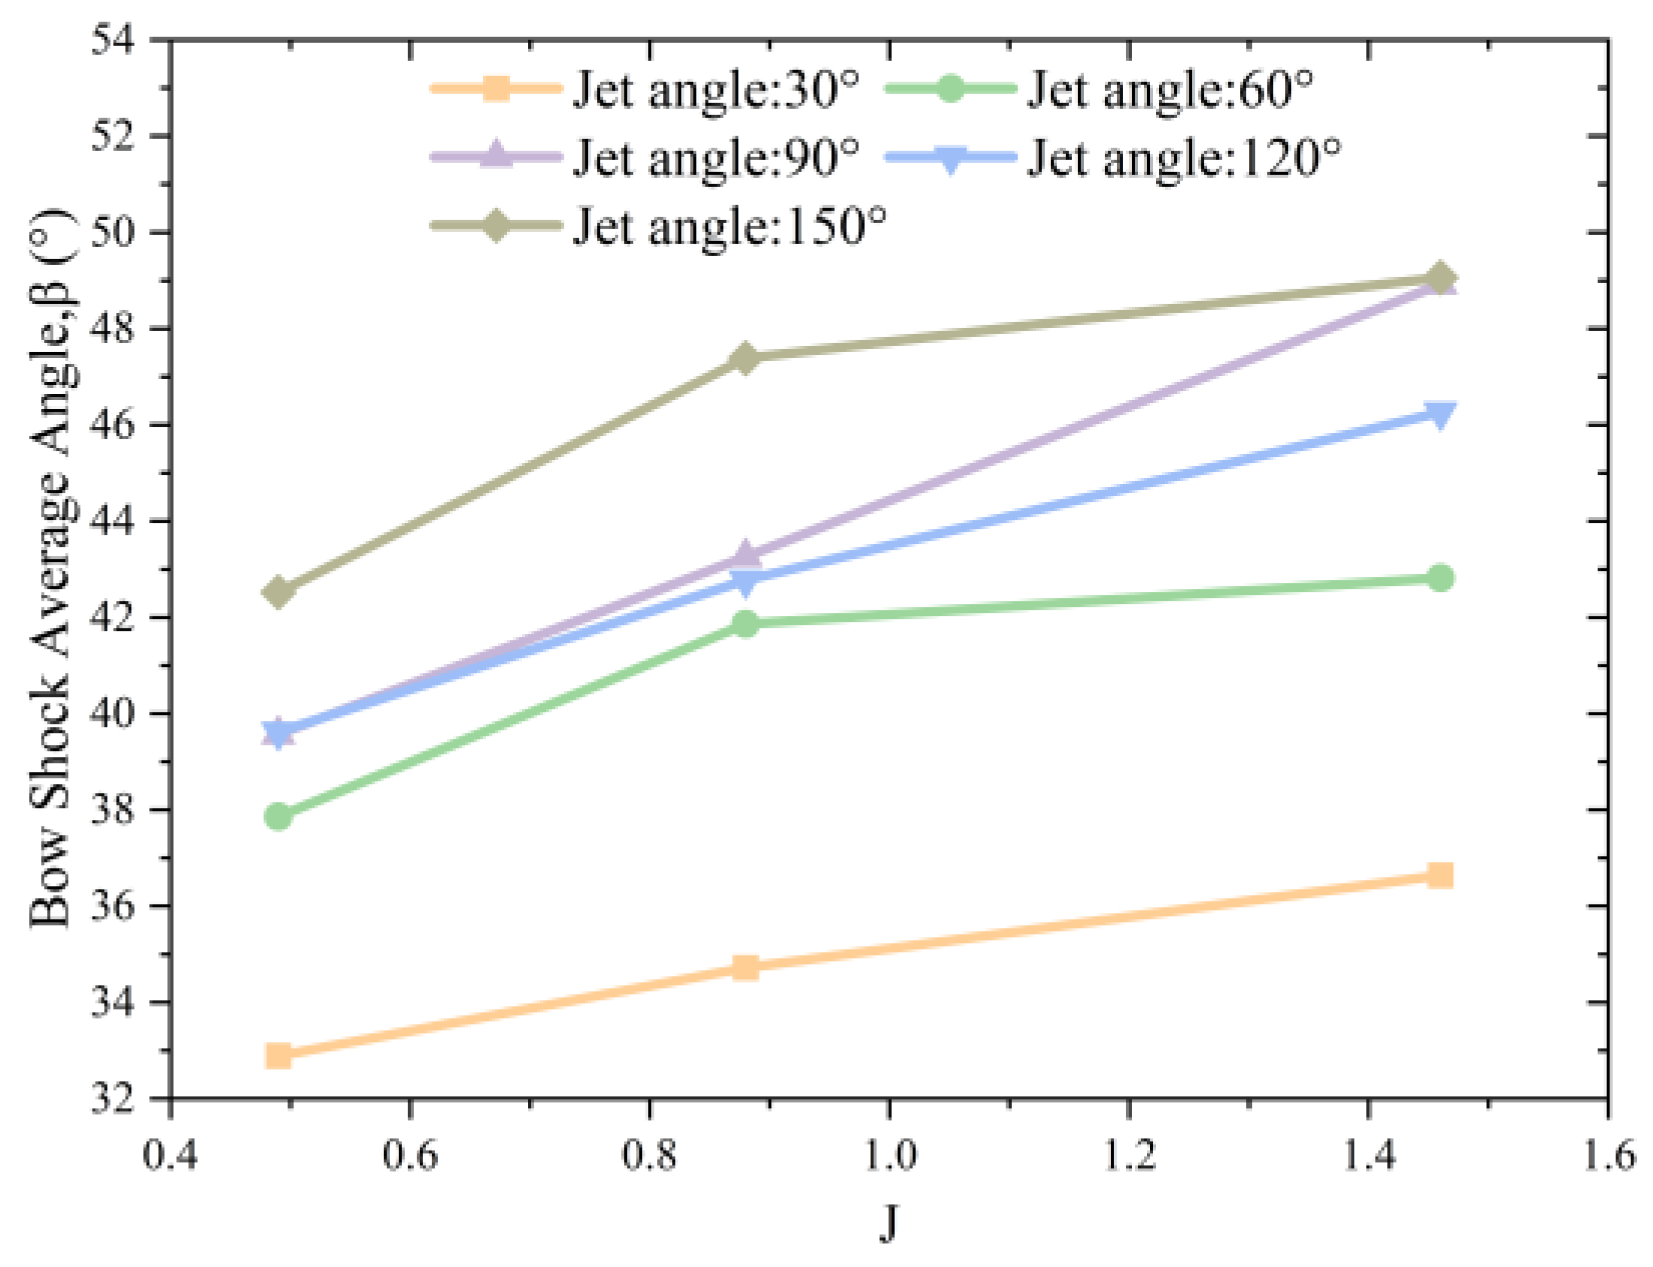
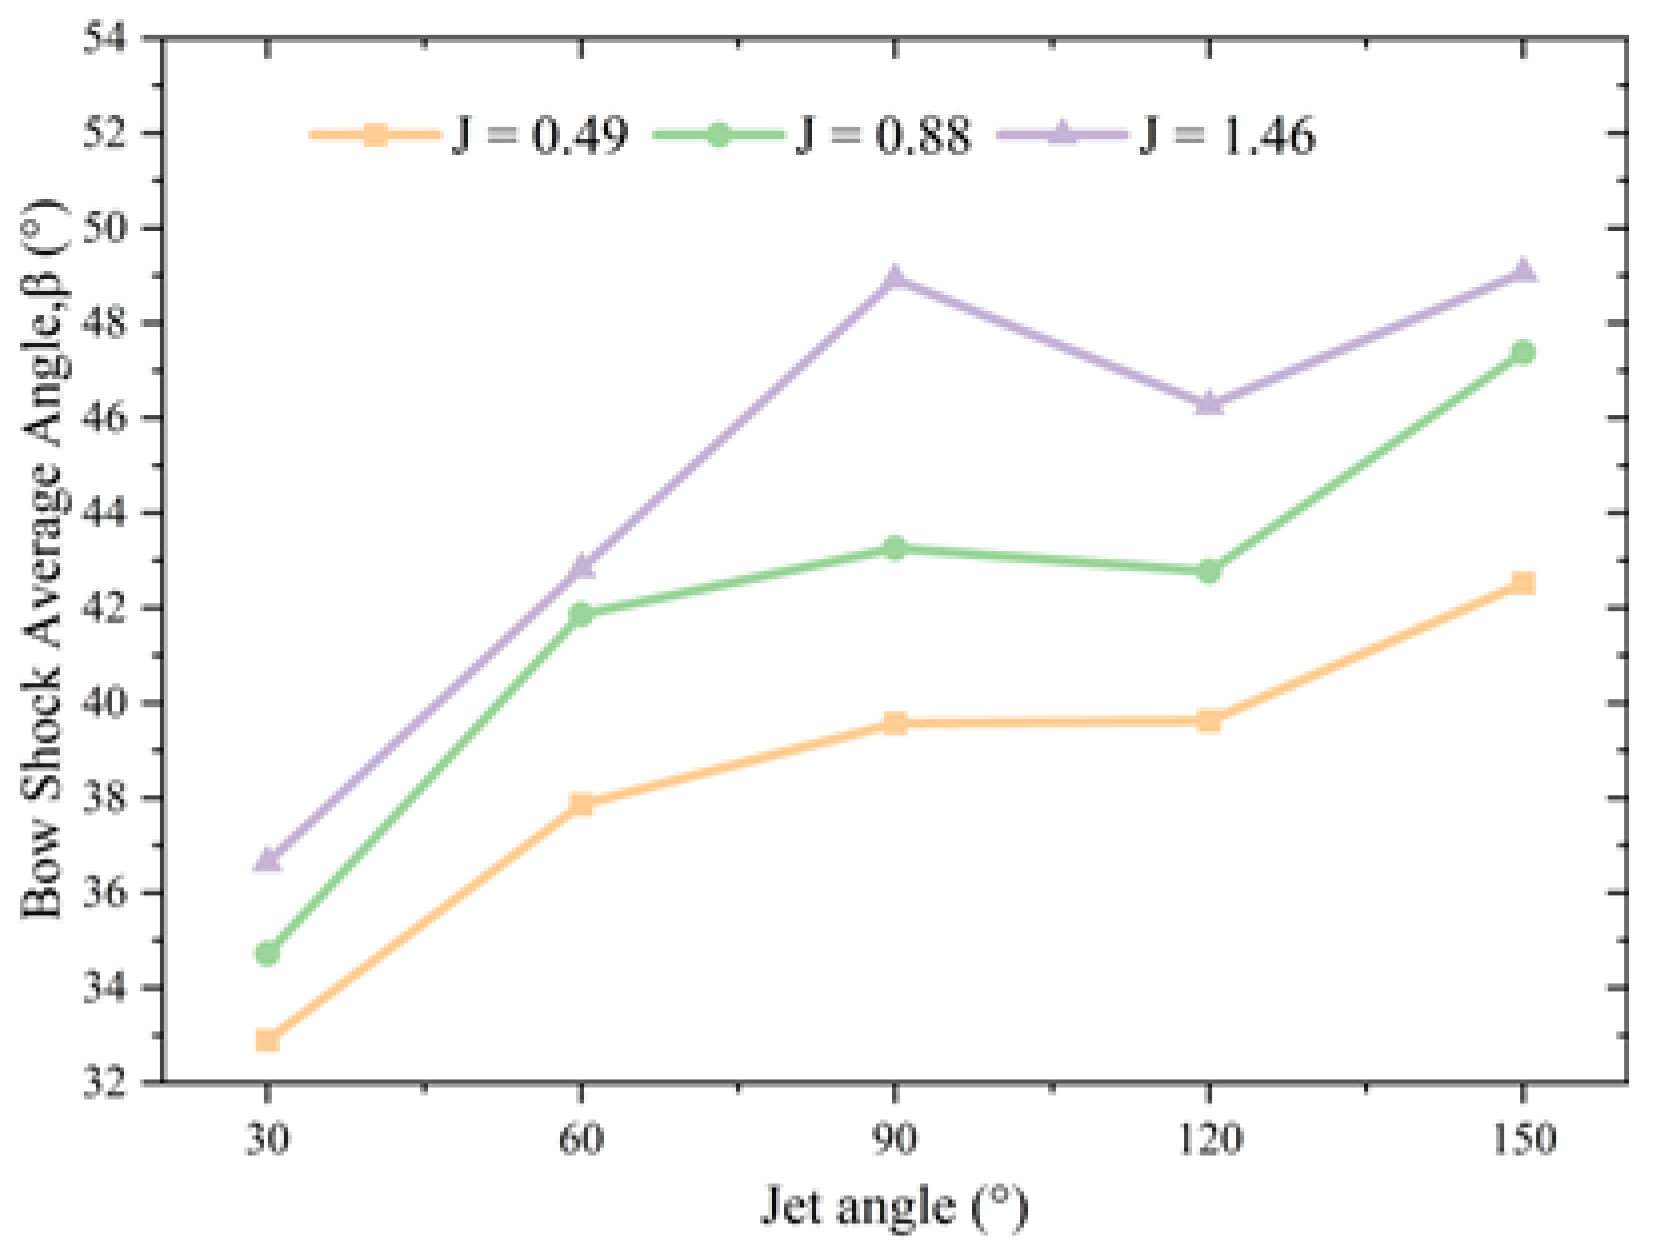
The influence of the momentum flux ratio and jet angle on the main flow was quantitatively analyzed in this work. Considering that bow shock is the most direct manifestation of the jet’s influence on the mainstream, an average bow shock angle was defined. This is the average angle of the bow shock obtained from Figure 12. Figure 17 and Figure 18 show the curves such as an average bow shock angle for different momentum flux ratios and jet angles, respectively. It can be seen that the average angle was positively correlated with the change of the momentum flux ratio of the jet (Figure 17). On the other hand, the angle did not change monotonously with the increase of the jet angle (Figure 18). In particular, the average bow shock angle decreased when the jet angle increased from 90° to 120°. This reduction was stronger for a jet momentum flux ratio of 1.46. This indicates that when the jet angle is 120° the total pressure loss caused by the supersonic mainstream may be smaller. Figure 17 also shows that the average bow shock angle changed more when the jet angle increased from 30° to 60°, indicating that there is an angle within the range of the jet angle used that makes the flow field structure more sensitive to it.

4. Conclusions

In this work, a simple and efficient flow field visualization method was used to explore the formation and evolution of a nitrogen jet near the nozzle in a supersonic flow under the influence of two factors (momentum flux ratio and jet angle). The experiments were carried out to simulate a flight condition with Mach number of 6 and altitude of 25 km. Fifteen different tests were carried out and analyzed under different jet conditions. The jet momentum flux ratio used was 0.49, 0.88, and 1.46, while the jet angle was varied between 30°, 60°, 90°, 120°, and 150°. By analyzing the instantaneous structure, spatiotemporal evolution, and statistical properties of the flow field, the following conclusions on the effect of the abovementioned factors over the formation and evolution of the jet are drawn:
(1)
The jet angle had a greater influence on the flow field shear vortex than the momentum flux ratio. When an acute jet angle was used, the number of shear vortexes increased, the flow direction spatial range widened, and the vortexes shrunk, mainly due to the gas compressibility.
(2)
For all the tests run, the shear vortexes were periodic and their evolution had three distinctive stages, namely, formation, stretching, and tearing. However, the tensile positions were different. When the jet angle was obtuse, the structure of the flow field (bow shock, barrel shock wave, and Mach disk) showed fluctuations due to the periodic generation of shear vortexes.
(3)
When the jet angle was 120°, the fluctuation area of the flow field strength was the largest, and the bow shock also showed violent fluctuations. In between 30° and 60°, there existed a certain jet angle that made the flow field structure more sensitive to it.
The instantaneous image of the flow field obtained in this paper can clarify the formation and evolution of the transverse gas jet, and provide verification data for numerical simulations. Among the tested working conditions, and based on the area of the strong fluctuation region and the average bow shock angle of the flow field, a jet angle of 120° is recommended. However, this conclusion is only considered from the perspective of flow field mixing. There are other factors, such as the working performance of the scramjet engine, flow loss, combustion heat release, etc., that should be further considered. Based on the research presented here, an experimental study of transverse jet mixing combustion in supercomputational velocity flow field is planned. This is to further study jet injection parameters and reach an efficient jet mixing combustion in a supersonic flow environment.

Author Contributions

Writing—original draft preparation, Y.D.; writing—review and editing, L.M.; visualization, C.L. and L.Z.; supervision, P.Y.; project administration, Z.X.; funding acquisition, Y.F. All authors have read and agreed to the published version of the manuscript.

Funding

This research was funded by the National Natural Science Foundation of China (Grant No. 12272409).

Institutional Review Board Statement

Not applicable.

Informed Consent Statement

Informed consent was obtained from all subjects involved in the study.

Data Availability Statement

The study did not report any data.

Acknowledgments

This work has been financially supported by the National Natural Science Foundation of China.

Conflicts of Interest

The authors declare no conflict of interest.

Nomenclature

M Mach number α jet angle
J Momentum flux ratio d jet diameter
P t Total pressure U / u Velocity
p Static pressure①/②the vortex exists area
T t Total temperature β the angle of the bow shock
T Temperature θ the deflection angle of the mainstream
ρ DensitySubscript
X Streamwise direction
Y transverse direction j Jet
Z Spanwise direction Mainstream
x ¯ Mean ( m , n ) Pixel coordinates
S standard deviation e b pressure of environment
y 1 the height of the Mach disk

References

  1. Le, V.T.; Ha, N.S.; Goo, N.S. Advanced Sandwich Structures for Thermal Protection Systems in Hypersonic Vehicles: A Review. Compos. Part B Eng. 2021, 226, 109301. [Google Scholar] [CrossRef]
  2. Ihme, M.; Chung, W.T.; Mishra, A.A. Combustion Machine Learning: Principles, Progress and Prospects. Prog. Energy Combust. Sci. 2022, 91, 101010. [Google Scholar] [CrossRef]
  3. Luo, S.; Feng, Y.; Song, J.; Xu, D.; Xia, K. Progress and Challenges in Exploration of Powder Fueled Ramjets. Appl. Therm. Eng. 2022, 213, 118776. [Google Scholar] [CrossRef]
  4. Choubey, G.; Devarajan, Y.; Huang, W.; Yan, L.; Babazadeh, H.; Pandey, K.M. Hydrogen Fuel in Scramjet Engines—A Brief Review. Int. J. Hydrogen Energy 2020, 45, 16799–16815. [Google Scholar] [CrossRef]
  5. Ren, Z.; Wang, B.; Xiang, G.; Zhao, D.; Zheng, L. Supersonic Spray Combustion Subject to Scramjets: Progress and Challenges. Prog. Aerosp. Sci. 2019, 105, 40–59. [Google Scholar] [CrossRef]
  6. Yan, L.; Huang, W.; Li, H.; Zhang, T. Numerical Investigation and Optimization on Mixing Enhancement Factors in Supersonic Jet-to-Crossflow Flow Fields. Acta Astronautica 2016, 127, 321–325. [Google Scholar] [CrossRef]
  7. Huang, W. Mixing Enhancement Strategies and Their Mechanisms in Supersonic Flows: A Brief Review. Acta Astronautica 2018, 145, 492–500. [Google Scholar] [CrossRef]
  8. Li, C.; Ma, L.; Xia, Z.; Chen, B.; Feng, Y.; Duan, Y. Numerical Investigation on Mixing Process of a Sonic Fuel Jet into a Supersonic Crossflow. Int. J. Hydrogen Energy 2022, 47, 37025–37039. [Google Scholar] [CrossRef]
  9. Zhang, J.; Wang, Z.; Liu, C.; Sun, M.; Wang, H. Computational Realization of Turbulent Combustion in a Scramjet Combustor Stabilized by a Lobed Strut. Int. J. Hydrog. Energy 2022, 48, 4073–4086. [Google Scholar] [CrossRef]
  10. Sheng, H.; Ji, Y.; Huang, X.; Zhao, Z.; Hu, W.; Chen, J.; Liu, H. A Free Radical Relay Combustion Approach to Scramjet Ignition at a Low Mach Number. Energy 2022, 247, 123539. [Google Scholar] [CrossRef]
  11. Nair, P.P.; Narayanan, V.; Suryan, A. Combustion Efficiency Improvement for Scramjet Combustor with Strut Based Flame Stabilizer Using Passive Techniques. Int. J. Hydrogen Energy 2021, 46, 40054–40072. [Google Scholar] [CrossRef]
  12. Dou, S.; Yang, Q.; Jin, Y.; Xu, X. Study on Fuel Equivalence Ratio Range for Supersonic Premixed Combustion Mode to Establish in a Scramjet. Acta Astronaut. 2022, 199, 37–48. [Google Scholar] [CrossRef]
  13. Karagozian, A.R. Transverse Jets and Their Control. Prog. Energy. Combust. Sci. 2010, 36, 531–553. [Google Scholar] [CrossRef]
  14. Mahesh, K. The Interaction of Jets with Crossflow. Annu. Rev. Fluid Mech. 2013, 45, 379–407. [Google Scholar] [CrossRef]
  15. Das, N.; Pandey, K.M.; Sharma, K.K. A Brief Review on the Recent Advancement in the Field of Jet Engine—Scramjet Engine. Mater. Today Proc. 2021, 45, 6857–6863. [Google Scholar] [CrossRef]
  16. Liu, Y.; Sun, M.; Liang, C.; Yu, J.; Li, G. Flowfield Structures of Pylon-Aided Fuel Injection into a Supersonic Crossflow. Acta Astronaut. 2019, 162, 306–313. [Google Scholar] [CrossRef]
  17. Liang, C.; Sun, M.; Liu, Y.; Li, G.; Yu, J. Numerical Study of Flow Structures and Mixing Characteristics of a Sonic Jet in Supersonic Crossflow. Acta Astronaut. 2020, 166, 78–88. [Google Scholar] [CrossRef]
  18. Zhou, W.; Xing, K.; Dou, S.; Yang, Q.; Xu, X. Experimental and Numerical Investigations on the Mixing Process of Supercritical Jet Injected into a Supersonic Crossflow. Aerospace 2022, 9, 613. [Google Scholar] [CrossRef]
  19. Sun, M.B.; Wang, H.B.; Chen, T.; Liang, J.H.; Liu, W.D.; Wang, Z.G. Parametric Study on Self-Sustained Oscillation Characteristics of Cavity Flameholders in Supersonic Flows. Proc. Inst. Mech. Eng. Part G J. Aerosp. Eng. 2011, 225, 597–618. [Google Scholar] [CrossRef]
  20. Sun, M.B.; Liang, J.H.; Wang, Z.G. Numerical Study on Self-Sustained Oscillation Characteristics of Cavity Flameholders in a Supersonic Flow. Proc. Inst. Mech. Eng. Part G J. Aerosp. Eng. 2008, 222, 95–102. [Google Scholar] [CrossRef]
  21. Ben-Yakar, A.; Hanson, R.K. Experimental Investigation of Flame-Holding Capability of Hydrogen Transverse Jet in Supersonic Cross-Flow. In Symposium (International) on Combustion; Elsevier: Amsterdam, The Netherlands, 1998; pp. 2173–2180. [Google Scholar]
  22. Ben-Yakar, A.; Kamel, M.; Morris, C.; Hanson, R. Experimental Investigation of H2 Transverse Jet Combustion in Hypervelocity Flows. In Proceedings of the Joint Propulsion Conference & Exhibit, Seattle, WA, USA, 6–9 July 1997. [Google Scholar]
  23. Liang, C.; Sun, M.; Wang, Q.; Liu, Y.; Yang, Y.; Sun, Y.; Li, G. Experimental Study of Parallel Injections with Different Distances into a Supersonic Crossflow. Acta Astronaut. 2020, 168, 242–248. [Google Scholar] [CrossRef]
  24. Huang, W. Transverse Jet in Supersonic Crossflows. Aerosp. Sci. Technol. 2016, 50, 183–195. [Google Scholar] [CrossRef]
  25. Aso, S.; Inoue, K.; Yamaguchi, K.; Tani, Y. A Study on Supersonic Mixing by Circular Nozzle with Various Injection Angles for Air Breathing Engine. Acta Astronaut. 2009, 65, 687–695. [Google Scholar] [CrossRef]
  26. Sharma, V.; Eswaran, V.; Chakraborty, D. Effect of Fuel-Jet Injection Angle Variation on the Overall Performance of a SCRAMJET Engine. Aerosp. Sci. Technol. 2020, 100, 105786. [Google Scholar] [CrossRef]
  27. Pu, C.; Guo, G.; Han, J.; Jiang, S. Effect of Jet Schemes of the Double-Nozzle Strut Injector on Mixing Efficiency of Air and Hydrogen for a Scramjet Combustor. Int. J. Hydrogen Energy 2022, 47, 22633–22649. [Google Scholar] [CrossRef]
  28. Paull, N. High Speed Imaging of Scramjet Flow in the X3 Expansion Tube. Honours Thesis, The University of Queensland, Brisbane, Australia, 2013. Available online: https://espace.library.uq.edu.au/view/UQ:375564 (accessed on 29 December 2022).
  29. Kouchi, T.; McDaniel, J.C.; Rockwell, R.D.; Goyne, C.P. Focusing-Schlieren Visualization in a Dual-Mode Scramjet. Exp. Fluids Exp. Methods Their Appl. Fluid Flow 2015, 56, 1–14. [Google Scholar] [CrossRef]
  30. Wang, D.; Xia, Z.; Zhao, Y.; Wang, B.; Zhao, Y. Imaging of the Space-Time Structure of a Vortex Generator in Supersonic Flow. Chin. J. Aeronaut. 2012, 25, 57–63. [Google Scholar] [CrossRef]
  31. Ben-Yakar, A.; Mungal, M.G.; Hanson, R.K. Time Evolution and Mixing Characteristics of Hydrogen and Ethylene Transverse Jets in Supersonic Crossflows. Phys. Fluids 2006, 18, 026101. [Google Scholar] [CrossRef] [Green Version]
  32. Ashkenas, H. The Structure and Utilization of Supersonic Free Jets in Low Density Wind Tunnels. In Rarefied Gas Dynamics; Academic Press: New York, NY, USA, 1966. [Google Scholar]
  33. Gordon, S.; Mcbride, B.J. Computer Program for Calculation of Complex Chemical Equilibrium Compositions and Applications. Part 1: Analysis. In NASA Reference Publications; National Aeronautics and Space Administration: Washington, DC, USA, 1994. [Google Scholar]
  34. Zhang, Z.; Awasthi, M.; McCreton, S.; Wills, A.O.; Moreau, D.J.; Doolan, C.J. Unsteady Interaction between Shear Layer Vortices and a Bow Shock During Supersonic Injection. In Proceedings of the AIAA AVIATION 2020 FORUM, Virtual Event, 15–19 June 2020. [Google Scholar]
Figure 1. Schematic diagram of a transverse jet inside the supersonic mainstream.
Applsci 13 02202 g001
Figure 2. Schematic of the direct-connect experimental setup.
Applsci 13 02202 g002
Figure 3. Diagram of the jet generator used in the experiment.
Applsci 13 02202 g003
Figure 4. Shadow diagram of the free expanding jet for three different jet upstream pressures; see the legends of each image.
Applsci 13 02202 g004
Figure 5. Setup developed to observe the flow field during the experiment.
Applsci 13 02202 g005
Figure 6. Schematic diagram of the image processing technique used to obtain the mean temporal characteristics of the flow field measured during the experiment.
Applsci 13 02202 g006
Figure 7. Transient flow field structure of Test 06.
Applsci 13 02202 g007
Figure 8. Instantaneous flow field diagrams for different working conditions (see the legends).
Applsci 13 02202 g008
Figure 9. The evolution of the shear vortices under different working conditions.
Applsci 13 02202 g009
Figure 10. Spatiotemporal evolution of the flow field during Test 15.
Applsci 13 02202 g010
Figure 11. The mainstream velocity (U) along the longitudinal direction behind the bow shock.
Applsci 13 02202 g011
Figure 12. Diagram of the average flow field for all the tests, see the legends.
Applsci 13 02202 g012
Figure 13. Position and angle of the bow shock.
Applsci 13 02202 g013
Figure 14. Velocity and deflection angle of the mainstream behind the bow shock.
Applsci 13 02202 g014
Figure 15. Diagram of flow field standard deviation (fluctuation).
Applsci 13 02202 g015
Figure 16. Area of the strong fluctuation regions for different jet angles and momentum flux ratios.
Applsci 13 02202 g016
Figure 17. Jet momentum flux ratio—average angle of the bow shock.
Applsci 13 02202 g017
Figure 18. Jet angle—average angle of the bow shock.
Applsci 13 02202 g018
Table 1. Supersonic crossflow conditions.
ParameterSymbolUnitValue
Mach number M /2.6
Velocity U m/s1445
Total temperature T t K1636
Static temperature T K820
Static pressure p MPa0.079
Density ρ kg / m 3 0.337
Table 2. Resulting jet exit flow properties at the sonic orifice.
ParameterSymbolUnitValues
Mach number M j 1
Stagnation pressure P t j MPa0.4750.8491.422
Velocity U j m/s322.3
Density ρ j kg / m 3 3.386.0510.13
Jet-to-freestream Momentum J 0.490.881.46
Table 3. Identification and conditions of the 15 tests carried out during the experiments.
IDα/°JIDα/°JIDα/°J
Test 0130°0.49Test 0230°0.88Test 03301.46
Test 0460°0.49Test 0560°0.88Test 0660°1.46
Test 0790°0.49Test 0890°0.88Test 0990°1.46
Test 10120°0.49Test 11120°0.88Test 12120°1.46
Test 13150°0.49Test 14150°0.88Test 15150°1.46
Disclaimer/Publisher’s Note: The statements, opinions and data contained in all publications are solely those of the individual author(s) and contributor(s) and not of MDPI and/or the editor(s). MDPI and/or the editor(s) disclaim responsibility for any injury to people or property resulting from any ideas, methods, instructions or products referred to in the content.