Abstract
The aim of the present study was to determine the level of association of the spatio-temporal gait parameters in subjects with and without plantar fasciopathy. The second objective was to analyze whether differences in spatio-temporal parameters between both groups exist. Seventy-four subjects divided in two groups participated in the study, one presenting subjects with plantar fasciopathy for more than three months (n = 31), and the other group comprising subjects without plantar fasciopathy (n = 43). The spatio-temporal parameters were measured using Optogait. Decreased step length (p < 0.001), increased contact phase (p < 0.001), increased double support (p < 0.001), increased load response (p < 0.001), increased pre-swing (p < 0.001), increased gait cycle (p = 0.002), decreased stride (p < 0.001), decreased speed (p < 0.001), decreased cadence (p < 0.001), decreased phase flatfoot (p = 0.001), and increased propulsion (p < 0.001) in subjects with PF showed statistically significant differences when compared with the control group.. Furthermore, the level of association between the spatio-temporal parameters was different when comparing the groups. These findings may help when assessing potential plantar fascia injuries, and they may serve as a tool that helps with clinical decision-making, or as a clinical measurement in a treatment and follow-up program.
1. Introduction
The common clinical presentation of plantar fasciopathy (PF) includes pain and discomfort normally in the inferior heel region; however, it can also be associated with the radiation of pain along the entire foot as well. Plantar fasciopathy is a clinical manifestation that is usually accentuated with the first steps in the morning, and with sudden acute painful episodes in daily life [1,2,3,4].
There are no high-quality epidemiological studies that are available on the prevalence of PF in the general population. In the US alone, heel pain is seen in 11–15% of provider visits requiring professional care [5]. The etiopathogenesis of plantar fasciopathy is mostly due to imbalances in the biomechanics of the subject, such as subtalar hyper pronation, medialized subtalar axes, and the flattening of the medial longitudinal arch [2], but another series of associated factors such as osteoarthritis, neurological involvement, direct microtrauma, and systemic conditioning factors can also promote its appearance [1].
During the human gait cycle, the length of the plantar aponeurosis suffers alterations [6]. A significant increase in the length of the plantar aponeurosis occurs in the middle phase of the gait cycle, while a shortening occurs in the Windlass mechanism, when the foot leaves the ground [7]. At the end of the final stance phase of the gait cycle, the foot tries to propel itself off the ground, increasing the dorsiflexion of the metatarsophalangeal joints [6], thus decreasing the traction branch of the plantar aponeurosis from its point of origin to its insertion point. Changes in the length and the traction of the plantar fascia produced during human locomotion increase its mechanical load and tension, and in the case of pathology, these can cause pain and discomfort [8]. With regard to the biomechanical research on gait analysis, Chen et al. presented a three-dimensional (3-D) foot model that was able to simulate the biomechanical behavior of the plantar fascia during the stance phase. They were able to demonstrate an increase in tension and peak stresses in the fascia during the stance phase, and in the phase from midstance to pre-swing. Based on these findings, a reduction in the force of the Achilles tendon and adjustments to the gait pattern, such as walking at a lower speed to reduce heel elevation height, or wearing rocker bottom shoes, may decrease the plantar fascia load [9].
Recent studies have shown interest in the biomechanics of human gait, reaching the conclusion that biomechanics should be considered as a risk factor for PF. Equally, plantar fascia disorders could lead to an alteration in the gait pattern and kinematic changes of the lower extremity, which may help to prevent PF [10,11].
It is difficult to fully understand the causes and prognosis of pain in PF patients, based only on a few biomechanical human gait parameters. Because of this, several studies have been carried out to identify not only the biomechanics, but also the parameters that can be measured, such as evaluating the geometry, phase, and time of gait with an intelligent gait analysis system [11]. In this regard, previous studies have suggested that minor changes in the angle (sagittal plane) of foot motion might lead to a higher magnitude of fascial strain, and they may lead to other injuries of the lower limbs [10,12]. Foot pronation could be a cause of plantar fascia tension when people walk, which facilitates the center of pressure shifting from the lateral to the medial side of the foot, thus inhibiting the sagittal movement of the foot and inducing the early tension of the plantar fascia [13]. In addition, previous research suggested that being overweight could add stress to the plantar fascia during walking [14]. Most of the plantar fascia research is carried out in subjects with unilateral plantar fasciopathy, or in studies that do not specify whether both feet are affected or not [9,12,13]. Only Seung et al. reported on this condition in subjects with bilateral plantar fasciopathy [11]. On the other hand, the assessment of the plantar fascia is mainly studied using sensors placed on specific points of the foot and ankle, which register the data through different analysis systems [9,12,15]. Seung et al. did not use these tools, but the gait assessment was measured using Zebris with data such as unilateral step length (41.13 cm and 41.40 cm), load response (18.1 cm and 17.05 cm), pre-swing (18.09 and 17.65 cm), swing (31.92 cm and 33.21 cm), and step time (0.34 s and 0.46 s) being reported [11]. On the other hand, the Optogait system is frequently used in the current literature, and its validity has been shown when compared to other gait assessment tools [16,17,18]. Its use in foot and ankle joint studies is limited. However, Requelo et al. used the Optogait system to study the protonated foot instead of the plantar fascia [19].
Only a few studies have researched changes in the spatio-temporal gait parameters in subjects suffering from PF [11,15]. Nowadays, the majority of the studies refer to healthy people when assessing gait [16,17]. In addition, the study of the spatiotemporal parameters of human gait can be studied with different measurements and technologies. On the one hand, there are measurements that analyze human gait with pressures sensors, for example Gait Rite, an instrumental treadmill, or the Tekscan Walkway System [18]. On the other hand, there are Vicon or Gait Real-time Analysis Interactive Lab (GRAIL) [19], optical sensors in anatomical references that report data on human gait movement and trajectory. In addition, there are also photoelectric sensors such as Optogait [20], which is a single layer pressure sensitive walkway measuring temporal and spatial parameters, and providing the easy identification of gait anomalies [20].
To shed light on the differences in spatio-temporal gait parameters between subjects with and without PF would be of great clinical interest since it may be useful in the detection of potential or existing PF, it may be used as an improvement indicator after receiving a treatment program, and it may be used in clinical settings to lead the re-education of the gait of people with PF. Our hypothesis is that the spatio-temporal gait parameters in subjects with PF are altered when compared to control subjects. These differences can be quantitatively measured, and thus, they serve as both a preventive and a diagnostic measurement when the treatment program and follow-up are carried out. Furthermore, we hypothesize that subjects with PF present a different relationship in spatio-temporal parameters than those with PF.
The aim of the present study was to determine the level of association of the spatio- temporal gait parameters present in both subjects suffering from PF, and subjects without PF. The secondary aim was to study differences in the spatio-temporal parameters between both groups.
2. Materials and Methods
2.1. Design
This was a cross-sectional, observational study, conducted according to the Declaration of Helsinki. Ethical approval was obtained by the Ethics committee of the University of Malaga (ref: 49-2022-H). The study has been reported following the recommendations of the STROBE statement for observational studies [21].
2.2. Participants
The clinic in the Faculty of Sciences at the University of Malaga, Malaga (Spain), where patients with different pathologies are seen, was used to carry out this study. The inclusion criteria for the injury group were participants older than 18 years of age suffering from bilateral plantar fasciopathy of 6 months evolution, with a low level of physical activity and without eventual asymmetries when evaluated. The plantar fascia is considered to be thickened when it is greater than 4.5 mm [22], showing a disorganization of the normal structure and a loss of the normal organized ligament architecture. Additionally, the diagnosis of plantar fasciopathy was based on the patient’s history (previously heel pain), the location of the pain (heel and rearfoot), clinical examination, ultrasound study, and passive dorsiflexion of the toes, which tightens the windlass mechanism and exacerbates the symptoms [23]. If this does not increase the symptoms, it is not a prognostic factor.
The control group were healthy subjects aged between 40 and 60 years old without any pathology at the time of the study.
The exclusion criteria for both groups were presenting any inflammatory or neurological disease which can alter balance, hearing and vision, or cognitive impairment, which might impact the ability to walk. A final convenience sample of 74 subjects participated in the study.
2.3. Training Phase
Prior to the study of the subjects’ spatio-temporal parameters, the participants walked in a predetermined program on a treadmill at a constant speed of 4 km per hour for 10 min to adapt to the environment and to obtain more reliable measurements. The participants stood on the treadmill and were asked to walk at a comfortable speed (4 km/h). Once the participants had become used to the environment, the measurements began. In addition, all the measurement tools used in the study were calibrated prior to performing the definitive tests.
2.4. Instrumentation
Weight was measured using the SECA 804, which is a precise portable electronic scale. The participants’ gaits were analyzed on a ProForm 500 ZLT motorized 2.0 CV treadmill with a 0% incline, using the predetermined treadmill program at a constant speed of 4 km per hour for 30 s. The Optogait © photoelectric cell system was used to collect the spatio-temporal gait parameters. Optogait © is composed of photoelectric cells sited along transmitting receiving bars of 1 m in length that can be extended to 100 m with a maximum distance of 6 m between them. The transmitting–receiving bars contain infrared LED diodes, which enable communication between the two bars. When a subject passes between the transmitting bar and the receiving bar, the system automatically calculates the spatio-temporal parameters by sensing interruptions in communication. This tool has optical sensors that operate at a frequency of 1000 Hz to detect the spatio-temporal parameters that are related to walking, running, and other movements. The software used was Optogait v.1.11.1.0. The intraclass correlation coefficients of this instrument were from 0.933 to 0.999, including all of its space–time variables [20].
2.5. Procedures
A researcher collected all the relevant data. Weight was measured using a precision portable electronic scale, which was calibrated before taking the SECA 804 measurements. All the measurement tools were calibrated by using the mean value of 3 analyses carried out prior to the trials. The BMIs of the subjects were calculated from their weight and height, by applying the following mathematical formula: (BMI = weight (kg)/height (m2)).
The participants’ gaits were analyzed on a ProForm 500 ZLT motorised 2.0 CV treadmill with a 0% incline using the predetermined treadmill program at a constant speed of 4 km per hour for 30 s according to the protocol [24]. One test per subject was performed after the adaptation period. Three sets of 10 gait cycles were analyzed to obtain the average results (Figure 1). The Optogait © photoelectric cell system was used to collect the spatio-temporal gait parameters, with the aforementioned calibration process being followed [25]. The bars of the Optogait © were positioned on each side of the treadmill ProForm 500 ZLT, in such a way that they did not produce any movement caused by the vibration when walking. The treadmill was placed on a flat level surface.
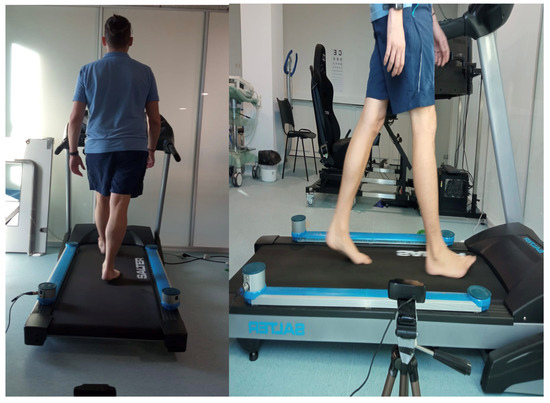
Figure 1.
Assessment of the gait cycle using Optogait ©.
The Optogait © system provided a comprehensive method of reliable measurement of the spatio-temporal gait parameters which was divided into two phases, contact and swing [24]. The spatio-temporal gait parameters are directly obtained from the system Optogait. This aspect has been added in the manuscript. The human gait cycle and step definition in the human gait is explained in Figure 2.
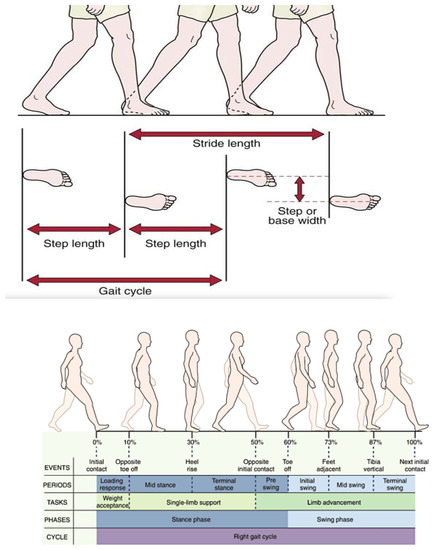
Figure 2.
The human gait cycle [27] and step definition (step length, step time, stride length, and cadence) [28]. The spatio-temporal gait parameters were initially double support, that is, both feet on the floor. Unipedal support begins when the opposite foot is lifted for the swing phase. During the unipedal support interval, the body’s entire weight is resting on that one extremity. Terminal double support was the third subdivision. It begins with floor contact by the other foot (contralateral initial contact) and continues until the original contact limb is lifted for swing (ipsilateral toe-off).
Step length was defined as the distance between the point of initial contact of the ipsilateral foot and the point of initial contact of the contralateral foot, with measurements in centimeters. Stride length was defined as the distance between the successive ground contact of the same foot, with measurements in centimeters. Speed was defined as the time needed for one foot to move from its initial contact point and to complete a step cycle, with measurements in seconds [20,26].
2.6. Statistical Analysis
The relationships between the independent (gait phases) and dependent variables (plantar fasciopathy) were analyzed using Rcomander statical analysis (version 4.2.1). The Kolmogorov Smirnov test was used to verify data distribution normality.
Comparisons between the affected group and the controls were calculated using independent sample t-tests. A p-value < 0.05 was considered as statistically significant. In addition, the Pearson or Spearman´s correlation test was used to study the relationship of the spatio-temporal gait parameters in people with plantar fasciopathy, and in the control group, based on normality distribution. A strong correlation was defined as values greater than 0.7; between 0.5 and 0.7, the correlation was considered moderate; between 0.3 and 0.5, it was considered a weak correlation. In addition to a linear multiple regression, scatter plots were carried out on the variables with the most significant results, and a logistic regression for the categorization of the results of both groups. A p-value < 0.05 was considered as statistically significant.
3. Results
The sample size of this study was composed of 74 subjects separated into two different population groups. One group comprised subjects with plantar fasciopathy with more than six months evolution (n = 31) and a mean age of 47.58 years (SD: 6.23). The control group comprised healthy subjects without any lower limb pathology at the time of the study (n = 43), and a mean age of 50.03 (SD: 7.69). The mean BMI was 23.76 kg/m2 (SD:4.16) for the injury group, and 26.31 kg/m2 (SD: 3.98) for the control group. The mean foot size for the whole group was 40.29 (SD: 3.3); the mean for the injury group was 40.04 (SD: 2.84, and for the control group, it was 40 (SD: 3.62) (Table 1).

Table 1.
Anthropometric characteristics of both sample groups.
The spatio-temporal gait parameters in people with plantar fasciopathy that had statistical significance (p < 0.001) when compared to the control group were step length, contact phase, double support, response to load, pre-swing, gait cycle, stride, speed, cadence, and propulsion phase (Table 2).
Table 2.
Values of the spatio-temporal gait parameters, and mean differences between groups.
The analysis of the correlation levels between the spatio-temporal parameters in both the injury group and the control group are shown in Table 1 and Figure 1. Swing phase, and response to load and step length in the injury group presented a strong positive correlation (1), with unipedal support, pre-swing, and the stride of the control group. The regression model coefficients are significant (p < 0.001), except for the acceleration variable (p 0.925). This indicates that the lesion is linearly related to the spatio-temporal parameters, with the exception of acceleration. The R-squared determination indicates a 0.6154 goodness of fit; consequently, the regression explains 61.54% of the injury variable variability, which is a moderately high value.
The most significant results when analyzing the relationships of the spatio-temporal parameters in both groups were shown using scatter plots (see Figure 3). Logistic regression is represented by a dashed line in the screen plots. This regression shows the categorization of the results obtained in both groups. With regard to cadence, and step and speed, the healthy subjects had a higher number of steps and speed when walking. Additionally, gait cycle, contact phase, and propulsion presented lower values than the healthy controls.
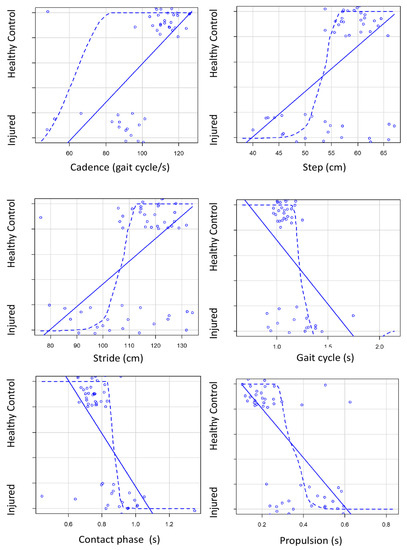
Figure 3.
Scatter plots on the variables with the most significant results. Constant line is the linear regression and spot line is the logistic regression of the variables.
4. Discussion
The aim of the present study was to determine the level of association of the spatio-temporal gait parameters in both subjects with and without plantar fasciopathy. The second objective was to analyze whether differences in the spatio-temporal gait parameters exist between groups.
The spatio-temporal gait parameters in people with bilateral plantar fasciopathy that had statistical significance when compared to the control group were: decreased step length (p < 0.001), increased contact phase (p < 0.001), increased double support (p < 0.001), increased response to load (p < 0.001), increased pre-swing (p < 0.001), increased gait cycle (p < 0.001), decreased stride (p < 0.001), decreased speed (p < 0.001), decreased cadence (p < 0.001), and increased propulsion phase (p < 0.001).
Gait analysis has been shown to be an objective tool for assessing PF and the changes obtained after a treatment program [29]; however, the effect that bilateral PF has on the gait has not been frequently reported in the literature [30]. Thus, increasing knowledge about gait parameters and the clinical usefulness that it has in patients with bilateral PF is of clinical importance. Our results showed a strong correlation (0.671) between step length (mean 52.1 s) and cadence (mean 83.30 gait cycle/s) in the injured group; however, this correlation did not exist (0.173) in the healthy group (58.85 s–110.81 gait cycle/s). Differences may be explained, since patients suffering from PF have a different step length which affects the normal cadence of the human gait, probably because they suffer from pain when they are walking. This fact is also true with the stride and the propulsive phase in the injured group. Both spatio-temporal gait parameters have a moderate and negative correlation between them (−0.506); when the stride increases, the propulsive phase decreases; however, this is not the case for the healthy group. Stride (mean 104.2 cm) also has a strong correlation (0.671) with cadence (mean 83.3 gait cycle/s) for patients with PF; however, this correlation does not exist (0.172) in the healthy group (117.7 cm–110.81 gait cycle/s). This may also be explained due to the absence of pain in healthy subjects during walking, which allows them to take longer strides in order to walk faster, thus producing a shorter propulsion phase. In addition, patients with PF have a longer propulsion phase than the control group; for the injured group, 0.45 s; and for the control group, 0.21 s. This condition is produced when the plantar fascia is altered, resulting in the windlass mechanism being activated with greater difficulty, and this produces a late lifting of the foot. Thus, our results may explain the posture and the motion adopted during walking that are shown in subjects with bilateral PF, which may also present similar symptoms to those suffering from low back pain, with a greater amplitude of activation in the paraspinal muscles [31]. Furthermore, the aforementioned adopted posture and motion may be explained by the decreased velocity of the transversus, with the counter-rotation between the thorax and the pelvis, and that it globally affects the mean erector spinae function [31]. These findings are in line with previous studies that have been carried out on patients with unilateral PF [29,32].
In each scatter plot, the difference of each variable between the two groups studied can be observed. It is observed that in the group of patients without pathology, all of the subjects have similar values, as in the distance, they perform in the cadence and the step, unlike the subjects with FP, who obtain results with a greater variability of data between them, which may be due to the influence of the degree of pain on the gait cycle.
Seung et al. [11] reported similar spatio-temporal gait parameters as for the use of both bilateral and unilateral PF: step length (41.13 cm and 41.40 cm), load response (18.1 cm and 17.05), pre-swing (18.09 and 17.65 cm), swing (31.92 cm and 33.21 cm), and step time (0.34 s and 0.46 s). These units of measurement are different to those found in this study; they reported using centimeters, whereas we used seconds and/or centimeters for the spatio-temporal parameters. Seung et al. used the Zebris system as a gait study tool, which allowed data on kinetic and kinematic gait parameters to be obtained through a pressure platform on the treadmill. This prioritized the baropodometric pressure data over the kinematic numeral and kinetic data. The difference with our study is that a scientifically validated human gait analysis was used [18] which provides a deeper and more complete understanding of all the spatio-temporal gait parameters (step length, contact phase, swing phase, unipedal support, double support, step time, load response, pre-swing, gait cycle, stride, speed, acceleration, cadence, phase flatfoot, and propulsion) and not just a few of them, as in the Zebris system. Additionally, they did not provide any information on how they diagnosed plantar fasciopathy in their subjects, nor the criteria that they followed to differentiate an injured planar fascia from a healthy one, nor did they correlate the data obtained from the healthy control group and the study subjects. Furthermore, our study had a larger population group.
Other studies show that PF negatively affects the static balance parameters measured with the TYMO® system, and the gait parameters measured with the G-Walk System [30]. Kelly et al. evaluated dynamic stability in runners with PF, runners with resolved PF, and healthy runners, showing that the contact phase values were shorter in the PF subjects when compared to the healthy control groups during the mid-contact phase. However, the contact phase during pre-swing was significantly greater in subjects with PF compared to subjects with resolved PF [31]. These results are in line with this study, and they are supported by Gefen et al. [32], who reported changes in the elastic properties of the healthy plantar fascia during the walking contact phase, which showed a rapid elongation of the fascia, with a strain rate of 0.9 +/− 0.1 s, before and immediately after midstance. In addition, a significantly slower elongation occurred (with a strain rate of 0.2 +/− 0.1 s) during pre-swing and toe-off. Therefore, the elastic, morphological, and histological affected properties of the plantar fascia, together with the parameters assessed during the human gait cycle, should be further studied.
Most of the plantar fascia research is carried out in subjects with unilateral plantar fasciopathy, or in studies that do not specify whether both feet are affected or not [9,12,13]. Those subjects that have plantar fasciopathy in only one foot are considered by us to be able to alter the data obtained in any of the aforementioned studies through compensation with the healthy contralateral limb. For this reason, we propose that the pathology being studied should be present bilaterally, as this gives a greater reliability to the results obtained. In spite of this, the results obtained by these studies are in line with ours and show that PF alters the spatio-temporal gait parameters, as expected [10,29].
Seung et al. [11] reported that subjects with bilateral PF showed a decreased gait step length, unipodal support, and antero-posterior position, along with increased lateral symmetry. For them, the full length of the foot is reduced as the intrinsic muscles are contracted to build the arch. The pronation associated with patients with plantar PF may explain this fact [29]. Pronator patients may have a longer support time in the mid- and forefoot, which generates larger general contact phases, and they may have a greater risk of PF, as found in our study. The differences may be explained, since patients who suffer from PF have a different step length that affects the normal cadence of the human gait, probably because they suffer from pain when they walk.
Additionally, Requelo et al. demonstrated that the pronator foot showed an increase in the stride time in seconds, and in gait cycle duration and gait cadence [13]. The literature regarding this idea indicates that 50% of patients with PF have pronated feet [13]. Furthermore, another study showed that in the gait analysis of these patients, the pronation component was up to four times greater than in the healthy control group [13].
The present study provides new evidence of alterations in the gait cycle recorded with the OptoGait optical sensor system in a group of subjects with plantar fasciopathy versus control subjects. These findings may have clinical implications, since differences between the groups may be used to detect a potential dysfunction, an injury, or an alteration in the tissue of plantar fascia, or a mechanical alteration during the gait cycle. Furthermore, the opposite may also be understood, with the gait alteration being responsible for potential PF; in both cases, the clinical approach should include gate re-education. Thus, the presented measurements may be used in injury prevention programs, and as an improvement indicator after a treatment program. Furthermore, the posture adopted during walking presented in subjects with bilateral PF may also be used to propose new active treatment programs, with the aim of using all or some of the parameters, such as modifying step length, contact phase, speed, cadence, and propulsion, among others, to specifically focus and to define the exercise.
Future studies should focus on postural evaluation, gait re-education, and proprioceptive treatment programs, to assess and to better understand the relationship between gait behavior and the presence of PF, as well as their clinical importance when assessing PF. Furthermore, in relation to chronic pain, studies that analyze psychological factors, such as kinesiophobia, self-efficacy, or pain catastrophizing, as well as lifestyle and intrinsic factors, would be of interest since the perpetuation of the plantar fascia is multifactorial.
This study has several strengths, including the similar demographic characteristics of the different groups, a careful screening for exclusion criteria, which was carried out by an expert in ultrasound imaging, and the proposal of the presented results as a potential measurement to assess potential dysfunction or alteration in the plantar fascia. However, the present study has some limitations that should be recognized. Firstly, the size of the sample is small, and further studies would be necessary to corroborate our findings. Secondly, the cross-sectional design of the study means that the results and the conclusions should be taken with caution. Thirdly, the assessment of the spatio-temporal parameters can be a limitation; therefore, extrapolation to other populations must be interpreted with care. Lastly, age differences between groups were presented, and the control group presented a higher BMI than those with PF.
5. Conclusions
Patients with bilateral plantar fasciopathy showed altered phases in the gait cycle when compared to people without plantar fasciopathy. Decreased step length, increased contact phase, increased double support, increased load response, increased pre-swing, increased gait cycle, decreased stride, decreased speed, decreased cadence, decreased flatfoot phase, and increased propulsion parameters may be useful in the detection of potential or existing PF, as well as being used as an improvement indicator after receiving a treatment program. Furthermore, these parameters may be used in clinical settings when re-educating the gaits of people with PF. These results may help when leading an active clinical approach in those with PF, and they may show specifically which parameters may play a key role in the prognosis of PF. Future longitudinal studies which assess not only gait parameters, but also the activity of the back muscles, as well as the elastic properties of the plantar fascia, would be needed.
Author Contributions
Conceptualization, D.A.-N. and J.P.-M.; methodology, D.A.-N. and J.P.-M.; validation, J.M.J.; formal analysis, P.C.-G. and S.N.-L.; investigation, D.A.-N.; resources, D.A.-N.; writing—original draft preparation, D.A.-N., P.C.-G., and S.N.-L. supervision, J.M.J., P.C.-G., and S.N.-L. All authors have read and agreed to the published version of the manuscript.
Funding
This study was partially supported by funds from PYC20 RE 046 UMA (Junta de Andalucía, And. Tech. RIS3) and PID2020-116898RB-I00 (MICINN—Plan Nacional de I+D+i).
Institutional Review Board Statement
This was a cross-sectional, observational study, conducted according to the Declaration of Helsinki. Ethical approval was obtained by the Ethics committee of University of Málaga (ref: 49-2022-H). The study has been reported following the recommendations of the STROBE statement for observational studies.
Informed Consent Statement
Informed consent was obtained from all subjects involved in the study. All participants were informed of the characteristics and objectives of the study. This work was accepted according to the Declaration of Helsinki.
Data Availability Statement
Not applicable.
Acknowledgments
The authors thank all the subjects who have participated in this study.
Conflicts of Interest
The authors declare no conflict of interest.
References
- Sean, C.; Gary, S.; Gregory, F.; Karl, T. Proximal Plantar Intrinsic Tendinopathy: Anatomical and Biomechanical Considerations in Plantar Heel Pain. J. Am. Podiatr. Med. Assoc. 2019, 109, 412–415. [Google Scholar] [CrossRef]
- Ryan, C.; Pedro, A.R.; Richard, E.A.V.E.; Joseph, H. Multi-Segment Foot Kinematics and Ground Reaction Forces during Gait of Individuals with Plantar Fasciitis. J. Biomech. 2014, 47, 2571–2577. [Google Scholar] [CrossRef]
- Seung Don, Y.; Hee Sang, K.; Jong Ha, L.; Dong Hwan, Y.; Dong Hwan, K.; Jinmann, C.; Seung Ah, L.; Yoo Jin, H.; Yun Soo, S.; Yong, K.; et al. Biomechanical Parameters in Plantar Fasciitis Measured by Gait Analysis System with Pressure Sensor. Ann. Rehabil. Med. 2017, 41, 979–989. [Google Scholar] [CrossRef]
- Wei-Yi, Y.; Yan-Hong, H.; Xue-Wei, C.; Jian-Ke, P.; Ling-Feng, Z.; Jiong-Tong, L.; Jun, L. Platelet-Rich Plasma as a Treatment for Plantar Fasciitis: A Meta-Analysis of Randomized Controlled Trials. Medicine 2017, 96, e8475. [Google Scholar] [CrossRef]
- Morgan, H.; Ivan, U.; Vwaire, O.; Mariam Salisu, O.; Joseph, B.; Stephen, G.; Lukas, F.; Laxmaiah, M.; Alan, D.K.; Rachel, J.K.; et al. Current Concepts of Minimally Invasive Treatment Options for Plantar Fasciitis: A Comprehensive Review. Curr. Pain Headache Rep. 2020, 24, 55. [Google Scholar] [CrossRef]
- Jacquelin, P. Gait Analysis: Normal and Pathological Function; SLACK: Thorofare, NJ, USA, 2010; ISBN 978-1-55642-766-4. [Google Scholar]
- Hicks, J.H. The Mechanics of the Foot. II. The Plantar Aponeurosis and the Arch. J. Anat. 1954, 88, 25–30. [Google Scholar] [PubMed]
- Christian, G.; Dorianne, S.; Bert, O.; van Laurens, K.; Erik, V.; Klaas, P.; Rienk, D.; Juha, M.H. Biomechanical Effects of Rocker Shoes on Plantar Aponeurosis Strain in Patients with Plantar Fasciitis and Healthy Controls. PLoS ONE 2019, 14, e0222388. [Google Scholar] [CrossRef]
- Chen, Y.N.; Chang, C.W.; Li, C.T.; Chang, C.H.; Lin, C.F. Finite Element Analysis of Plantar Fascia during Walking: A Quasi-Static Simulation. Foot Ankle Int. 2015, 36, 90–97. [Google Scholar] [CrossRef] [PubMed]
- Harutaichun, P.; Boonyong, S.; Pensri, P. Differences in Lower-Extremity Kinematics between the Male Military Personnel with and without Plantar Fasciitis. Phys. Ther. Sport 2021, 50, 130–137. [Google Scholar] [CrossRef] [PubMed]
- Caravaggi, P.; Pataky, T.; Günther, M.; Savage, R.; Crompton, R. Dynamics of Longitudinal Arch Support in Relation to Walking Speed: Contribution of the Plantar Aponeurosis. J. Anat. 2010, 217, 254–261. [Google Scholar] [CrossRef]
- Lee, S.Y.; Hertel, J.; Lee, S.C. Rearfoot Eversion Has Indirect Effects on Plantar Fascia Tension by Changing the Amount of Arch Collapse. Foot 2010, 20, 64–70. [Google Scholar] [CrossRef] [PubMed]
- Taunton, J.E.; Ryan, M.B.; Clement, D.B.; McKenzie, D.C.; Lloyd-Smith, D.R.; Zumbo, B.D. A Retrospective Case-Control Analysis of 2002 Running Injuries. Br. J. Sports Med. 2002, 36, 95–101. [Google Scholar] [CrossRef] [PubMed]
- Petraglia, F.; Ramazzina, I.; Costantino, C. Plantar Fasciitis in Athletes: Diagnostic and Treatment Strategies. A Systematic Review. Muscles Ligaments Tendons J. 2017, 7, 107–118. [Google Scholar] [CrossRef] [PubMed]
- Patrick, O.R.; Gabriele, P.; Ugo, D.C.; Kate, W.P.; Kerrigan, D.C. A Kinematic and Kinetic Comparison of Overground and Treadmill Walking in Healthy Subjects. Gait Posture 2007, 26, 17–24. [Google Scholar] [CrossRef]
- Patrick, O.R.; Jay, D.; Jason, F.; Ugo, D.C.; Robert, P.W.; Kerrigan, D.C. A Kinematics and Kinetic Comparison of Overground and Treadmill Running. Med. Sci. Sports Exerc. 2008, 40, 1093–1100. [Google Scholar] [CrossRef]
- von Elm, E.; Altman, D.G.; Egger, M.; Pocock, S.J.; Gøtzsche, P.C.; Vandenbroucke, J.P. The Strengthening the Reporting of Observational Studies in Epidemiology (STROBE) Statement: Guidelines for Reporting Observational Studies. Int. J. Surg. 2014, 12, 1495–1499. [Google Scholar] [CrossRef]
- Trojian, T.; Tucker, A.K. Plantar Fasciitis—American Family Physician. Drexel Univ. Coll. Med. 2019, 99, 744–750. [Google Scholar]
- Neufeld, S.K.; Cerrato, R. Plantar Fasciitis: Evaluation and Treatment. J. Am. Acad. Orthop. Surg. 2008, 16, 338–346. [Google Scholar] [CrossRef]
- Rosa, N. Manual de Uso. Signa Rev. Asoc. Española Semiótica 2022, 7, 335–346. [Google Scholar] [CrossRef]
- McNally, E.G.; Shetty, S. Plantar Fascia: Imaging Diagnosis and Guided Treatment. Semin. Musculoskelet. Radiol. 2010, 14, 334–343. [Google Scholar] [CrossRef]
- Neumann, D.A.; Kelly, E.R.; Kiefer, C.L.; Martens, K.; Grosz, C.M. Kinesiology of the Musculoskeletal System: Foundations for Rehabilitation; Mosby: Maryland Heights, MO, USA, 2016. [Google Scholar]
- Evaluación de La Marcha. Clave Musculoesquelético. Available online: https://musculoskeletalkey.com/assessment-of-gait/ (accessed on 26 November 2022).
- Brachman, A.; Sobota, G.; Marszałek, W.; Pawłowski, M.; Juras, G.; Bacik, B. Plantar Pressure Distribution and Spatiotemporal Gait Parameters after the Radial Shock Wave Therapy in Patients with Chronic Plantar Fasciitis. J. Biomech. 2020, 105, 109773. [Google Scholar] [CrossRef] [PubMed]
- Wearing, S.C.; Smeathers, J.E.; Sullivan, P.M.; Yates, B.; Urry, S.R.; Dubois, P. Plantar Fasciitis: Are Pain and Fascial Thickness Associated with Arch Shape and Loading? Phys. Ther. 2007, 87, 1002–1008. [Google Scholar] [CrossRef] [PubMed]
- Chang, R.; van Emmerik, R.; Hamill, J. Chronic Plantar Fasciitis Reduces Rearfoot to Medial-Forefoot Anti-Phase Coordination. Clin. Biomech. 2021, 88, 105439. [Google Scholar] [CrossRef]
- Wearing, S.C.; Smeathers, J.E.; Urry, S.R. The Effect of Plantar Fasciitis on Vertical Foot-Ground Reaction Force. Clin. Orthop. Relat. Res. 2003, 409, 175–185. [Google Scholar] [CrossRef] [PubMed]
- Dudoniene, V.; Balnytė, M.; Kuisma, R. Comparison of Static Balance and Gait between Subjects with Plantar Fasciitis and Age-Matched Controls. J. Back Musculoskelet. Rehabil. 2022, 1–8, ahead of print. [Google Scholar] [CrossRef]
- Kelly, D.K.; Wiegand, K.; Freedman Silvernail, J. Dynamic Stability in Runners with and without Plantar Fasciitis. Gait Posture 2022, 96, 301–305. [Google Scholar] [CrossRef]
- Gefen, A. The in Vivo Elastic Properties of the Plantar Fascia during the Contact Phase of Walking. Foot Ankle Int. 2003, 24, 238–244. [Google Scholar] [CrossRef]
- Justin, S.; Joshua, B.; Roger, A.; Evangelos, P.; Jack, C. Plantar Heel Pain and Foot Loading during Normal Walking. Gait Posture 2015, 41, 688–693. [Google Scholar] [CrossRef]
- Inmaculada, R.-R.; Aurora, C.-M.; Ana María, J.-C.; María Luisa, G.-E.; Inmaculada, C.P.-T.; Manuel, P.-C. Assessment of Selected Spatio-Temporal Gait Parameters on Subjects with Pronated Foot Posture on the Basis of Measurements Using OptoGait. A Case-Control Study. Sensors 2021, 21, 2805. [Google Scholar] [CrossRef]


Disclaimer/Publisher’s Note: The statements, opinions and data contained in all publications are solely those of the individual author(s) and contributor(s) and not of MDPI and/or the editor(s). MDPI and/or the editor(s) disclaim responsibility for any injury to people or property resulting from any ideas, methods, instructions or products referred to in the content. |
© 2023 by the authors. Licensee MDPI, Basel, Switzerland. This article is an open access article distributed under the terms and conditions of the Creative Commons Attribution (CC BY) license (https://creativecommons.org/licenses/by/4.0/).