Article

An Evaluation of Healthy Eating Scale for Patients with Pre-Diabetes Using Rasch Analysis

by
Kerry Anne de Vent
,
Nguyen Hoang Nguyen Do
and
Fakir M. Amirul Islam
*
School of Health Sciences, Swinburne University of Technology, John St., Hawthorn, VIC 3122, Australia
*
Author to whom correspondence should be addressed.
Appl. Sci. 2023, 13(4), 2050; https://doi.org/10.3390/app13042050
Submission received: 21 December 2022 / Revised: 30 January 2023 / Accepted: 1 February 2023 / Published: 4 February 2023
(This article belongs to the Special Issue Applied Biostatistics for Health Science and Epidemiology)

Abstract

:
Consumption of a healthy diet is required to manage blood glucose level in people with diabetes or pre-diabetes. The aim of this study was to test the internal validity of healthy eating habits assessed using a self-reported scale, the Rapid Eating Assessment for Participants (REAP) scale, in participants with pre-diabetes. The scale had 15 items with 4 categories: “Never”, “Rarely”, “Some days” and “Usually/most days”. Those items were administered to 119 participants from 2006 to 2008 in Victoria, Australia. Rasch analysis was applied using RUMM2030 software. Overall fit was adequate in the unaltered model (χ2 = 29.29, p = 0.500, person separation index (PSI) = 0.500), however, seven items had disordered thresholds which were remedied by collapsing “Rarely” with “Some days” (χ2 = 37.36, p = 0.166, psi = 0.550). Item 1 (“Eat 3 main meals”) remained disordered after collapsing. Two persons were removed due to their fit residuals being outside ±2.5, however, these deletions did not improve the fit, so it was decided to retain these persons in the scale. Overall, there was no significant differential item functioning (DIF) or local dependency. However, there was evidence of multidimensionality and a ceiling effect toward healthy eating in the person item threshold. The results from Rasch analysis showed that the current scale needs some improvement, such as addressing disordered thresholds, for measuring eating habits for people with pre-diabetes. A modified version with middle categories collapsed would provide a psychometrically more robust measure. Further study is needed to validate the scale as a screening tool for measuring healthy eating among people with pre-diabetes.

1. Introduction

Diabetes mellitus (DM) is a major cause of heart disease, stroke, visual impairment, and blindness [1,2]. In 2019 alone, diabetes and kidney disease due to diabetes caused an estimated 2 million deaths. A healthy lifestyle, including maintaining normal body weight and taking part in regular physical exercise, is the way to prevent early onset of diabetes or progression of pre-diabetes to diabetes [1].
Currently, an estimated 537 million adults (aged 20–79 years) are living with diabetes (10.5% of the world’s population). This number is predicted to rise to 643 million by 2030 and to 783 million by 2045. Of those with diabetes, an estimated 240 million people are undiagnosed [3]. An estimated 1.2 million Australians had diabetes from 2017–2018 and contributed to 11% of deaths in 2018 [4].
Ethnic disparities in the prevalence of type 2 diabetes mellitus (T2DM) have been reported in many studies with inconsistent results [5,6,7,8]. According to the Centers for Disease Control and Prevention [9], Asian Americans have a greater prevalence of T2DM than Caucasians. In America, more than one in five people who have diabetes are unaware they have it. For Asian American people, that number is higher (around one in three). According to the Office of Minority Health [10], Asian Americans are 40 percent more likely to be diagnosed with diabetes than non-Hispanic whites. However, another large-scale observational study among Asian subgroups in California indicated that Chinese Americans had lower T2DM prevalence than white Americans [8]. Gender differences have been found to affect the prevalence of diabetes and pre-diabetes [11,12].
Type 2 diabetes is characterized by gradual onset, with most people first experiencing pre-diabetes, a condition of impaired glucose control [13]. Since the pre-diabetic state is often asymptomatic it often takes a considerable amount of time before the condition is diagnosed [14]. Many studies have shown a worrisome situation where people with diagnosed T2DM or pre-diabetes represent a small proportion of the true prevalence of these conditions [14,15,16]. Of further concern, patients often have already experienced health complications such as retinopathy or cardiovascular disease before they were diagnosed with T2DM or pre-diabetes [17]. These findings support the concept that early detection and intervention are crucial.
There are a number of risk factors, including obesity, which contribute to the development of T2DM [18,19,20]. Early detection and management of diabetes through lifestyle changes and healthier eating are recommended [21,22]. Nutrition plays a critical role in the prevention and treatment of T2DM, avoiding or delaying the appearance of related complications [20]. Dietary counseling should be employed in the prevention and management of T2DM [22] to improve the healthy eating habits of patients, because among patients, diabetes awareness and management represent a major challenge [23].
Assessing the quality of eating patterns in people with diabetes and pre-diabetes is needed. Various scales have been developed to assess the quality of eating patterns. Lindstrom et al. [22] developed the “Healthy Diet Index” (HDI) as a tool to evaluate dietary compliance. The index was derived from the 16-item Food Intake Questionnaire (D2D-FIQ), which was a part of a Finnish type 2 diabetes prevention implementation program. The criterion validity of the HDI was tested using the Pearson’s correlation between the index and the nutrient intakes calculated from 7-day food records. In the United Kingdom, England et al. [24] developed the “UK Diabetes and Diet Questionnaire” (UKDDQ) which is a 25-item questionnaire, intended to be used as a quick assessment of a patient’s diet. The authors focused on testing the reliability using the intra-class correlation and the inter-rater reliability using the Cohen’s weighted kappa.
The Dietary Guidelines for Australian Adults [25] identified six food groups (cereals, vegetables, fruit, dairy products, meat, and extra foods) as a basis for healthy eating. Based on that classification, McNaughton et al. [26] developed and evaluated the Dietary Guideline Index (DGI), consisting of 15 dietary indicators. Mean nutrient intakes from 24 h recalls and linear trends across DGI quintiles were used to examine the DGI’s construct validity. Another study by Hackworth et al. [27] also utilized the guidelines to create the Eating Patterns scale, a 16-item questionnaire intended to determine how healthy individuals’ food choices were. Cronbach’s alpha was used to evaluate the internal consistency. Another scale, designed to assist health providers to assess and discuss nutrition with patients, is the Rapid Eating Assessment for Participants (REAP) scale [28].
The items in this scale were developed based on the six types of food groups defined from the Dietary Guidelines for Australian Adults [25]. In addition, items relating to dietary guidelines in terms of fat, sugar, and alcohol consumption were added. This was developed from a study conducted by Hackworth et al. [27]. In the questionnaire of 15 items relating to food habits, each item has four categories. The items asked on how many days in an average week the participants consumed each food, with responses ranging from 1 to 4: 1 = Never; 2 = Rarely; 3 = Some days; 4 = Usually/most days.
The classical test theory (CTT) is a common approach used for psychometric analysis and to evaluate the reliability and validity of scales [29]. CTT was developed for the evaluation of tests as a whole [30] for which interest centers mainly on the participant’s total score on a test [31]. Compared to CTT, IRT mainly uses individual test items [31]. CTT calculates the subject’s total score by adding the scores of the items together. In contrast, IRT assesses the potential ability of the participant based on their response on each item [32]. Although there are some similarities between CCT and the IRT model [33], CTT is based on the assumption that measures are exchangeable, whereas IRT is based on conditional independence [34]. For more details, readers are advised to read Lewis (2007) [33] and Brennan (2010) [35].
Our aim for this study was to validate the Rapid Eating Assessment for Participants (REAP) scale assessing eating habits using Rasch analysis.

2. Materials and Methods

2.1. Participants

This study involved 119 participants (41 males, 78 females) who had been diagnosed with pre-diabetes and who agreed to be part of a lifestyle intervention to improve their health. The sample enabled comparison between Chinese Australian and Anglo-Australian groups as well as gender comparisons.

2.2. Sample Size

The sample size of 119 participants was deemed small for Rasch analysis. Large samples, usually 300 participants, are considered necessary for a Rasch model to obtain robust parameter estimates [36]. Uddin et al. [37] studied the psychometric properties of a Kessler 10-item questionnaire using a large sample and tested several subsamples of 300 and reported a robust conclusion.
Chen et al. [36] evaluated the effect of sample size on Rasch analysis and found that small sample size can lead to opposite conclusions from those based on a larger sample size. They concluded that Rasch analysis based on a small sample size should be used with caution.

2.3. Introduction to Rasch Model and Data Analysis

The specialized software RUMM2030 [38] was used for Rasch analysis. RUMM2030 is one of many software packages that can carry out Rasch analysis. The estimation algorithm used in RUMM2030 is the pairwise conditional estimation procedure which generalizes the equation for one pair of items in which the person parameter is eliminated to all pairs of items taken simultaneously [39]. Of numerous software packages that can be used to perform Rasch analysis [40], the software packages that use the same algorithm as RUMM2030 include Ganz and R (using the “pairwise” or the “sirt” package). A list of software packages to perform Rasch analysis can be accessed on the Institute for Objective Measurement [40] webpage.
The Rasch model was developed by Georg Rasch and is an approach to item analysis where item difficulty and individual ability may be estimated [41]. The original Rasch model was formulated for dichotomous items. This model uses sum scores from ordinal responses to calculate estimates to represent person ability or achievement, and item locations [42].
There are polytomous extensions of the Rasch model [43], which can be used where scores represent categories of increasing level of a trait and are applicable to the use of Likert scales. The polytomous Rasch model was developed by Andrich (1978) [44].
In this study, instead of a generalized partial credit model (GPCM), we used a partial credit model (PCM) which derives from multiple-choice tests. A partial credit model (PCM) can be explained in educational contexts, where an outcome is not always either a correct or incorrect answer, where it is desirable to identify responses that lie in between a completely correct and incorrect answer [45]. Since our scale was in the form of an MCQ without a definite true or false answer but indicated a positive or negative endorsement of items, we applied a PCM by imposing the equality constraint of item discriminations. The PCM assumes that item slopes are equal across items [46]. In our 15-item questionnaire relating to food habits, each item with four categories, we assumed each item contributed equally for item discrimination. The GPCM extends the PCM by including a discrimination term [47] and implements a varying slope parameter [48]. The GPCM allows non-equal item discriminations which are yet to be explored in our current tool. However, we aim to apply GPCM in future studies with a large sample.
The equations for the two versions of the Rasch model are shown below [37].
Dichotomous:
P X n i = x = e x β n   δ i 1 + e x β n   δ i
Polytomous:
P X n i = x = e τ 1 i τ 2 i x   . . . . . . . . τ x i + x β n   δ i x i = 0 m i e τ 1 i τ 2 i x   . . . . . . . . τ x i + x β n   δ i
where βn is the location of person n and δi is the location of item i. τxi, x = 1, 2, …, mi are thresholds which partitioned the latent continuum of item i into mi + 1 ordered categories. X is the response value that qualifies the expression by βn–δi.
Rasch analysis is considered the gold standard with which the validity of scales can be evaluated [49]. Scales that comprise ordinal level items, such as a Likert-style response scale, have historically been developed using classical test theory, however, this approach has limitations due to inconsistent or unknown differences between the levels on the scale [43].
The model makes several hypotheses/requirements to ensure the instrument has Rasch properties. Unidimensionality is a fundamental requirement and indicates that only one construct is being measured [50,51]. It is defined as the absence of any meaningful pattern in the residuals [49]. Another requirement is local independence, which indicates the scores are related to each other through the construct only. The person–item residual correlation matrix is used to determine local dependency, with correlations less than 0.3 generally acceptable [50,52]. Invariance is also a requirement and requires that an instrument should generally function in a similar way for all individuals [50].
Overall fit of the model is defined by χ2 item–trait interaction statistics [53] using a Bonferroni corrected cut-off with a non-significant χ2 statistic deemed to indicate good overall model fit. Model fit is also examined using item–person interaction statistics, which are shown as z-statistics, with a fit residual of the mean close to 0 and SD close to 1, indicating a good model fit. Item and person fit are ascertained by item fit residual statistics, which are satisfactory when inside the range of ±2.5 [50,54].
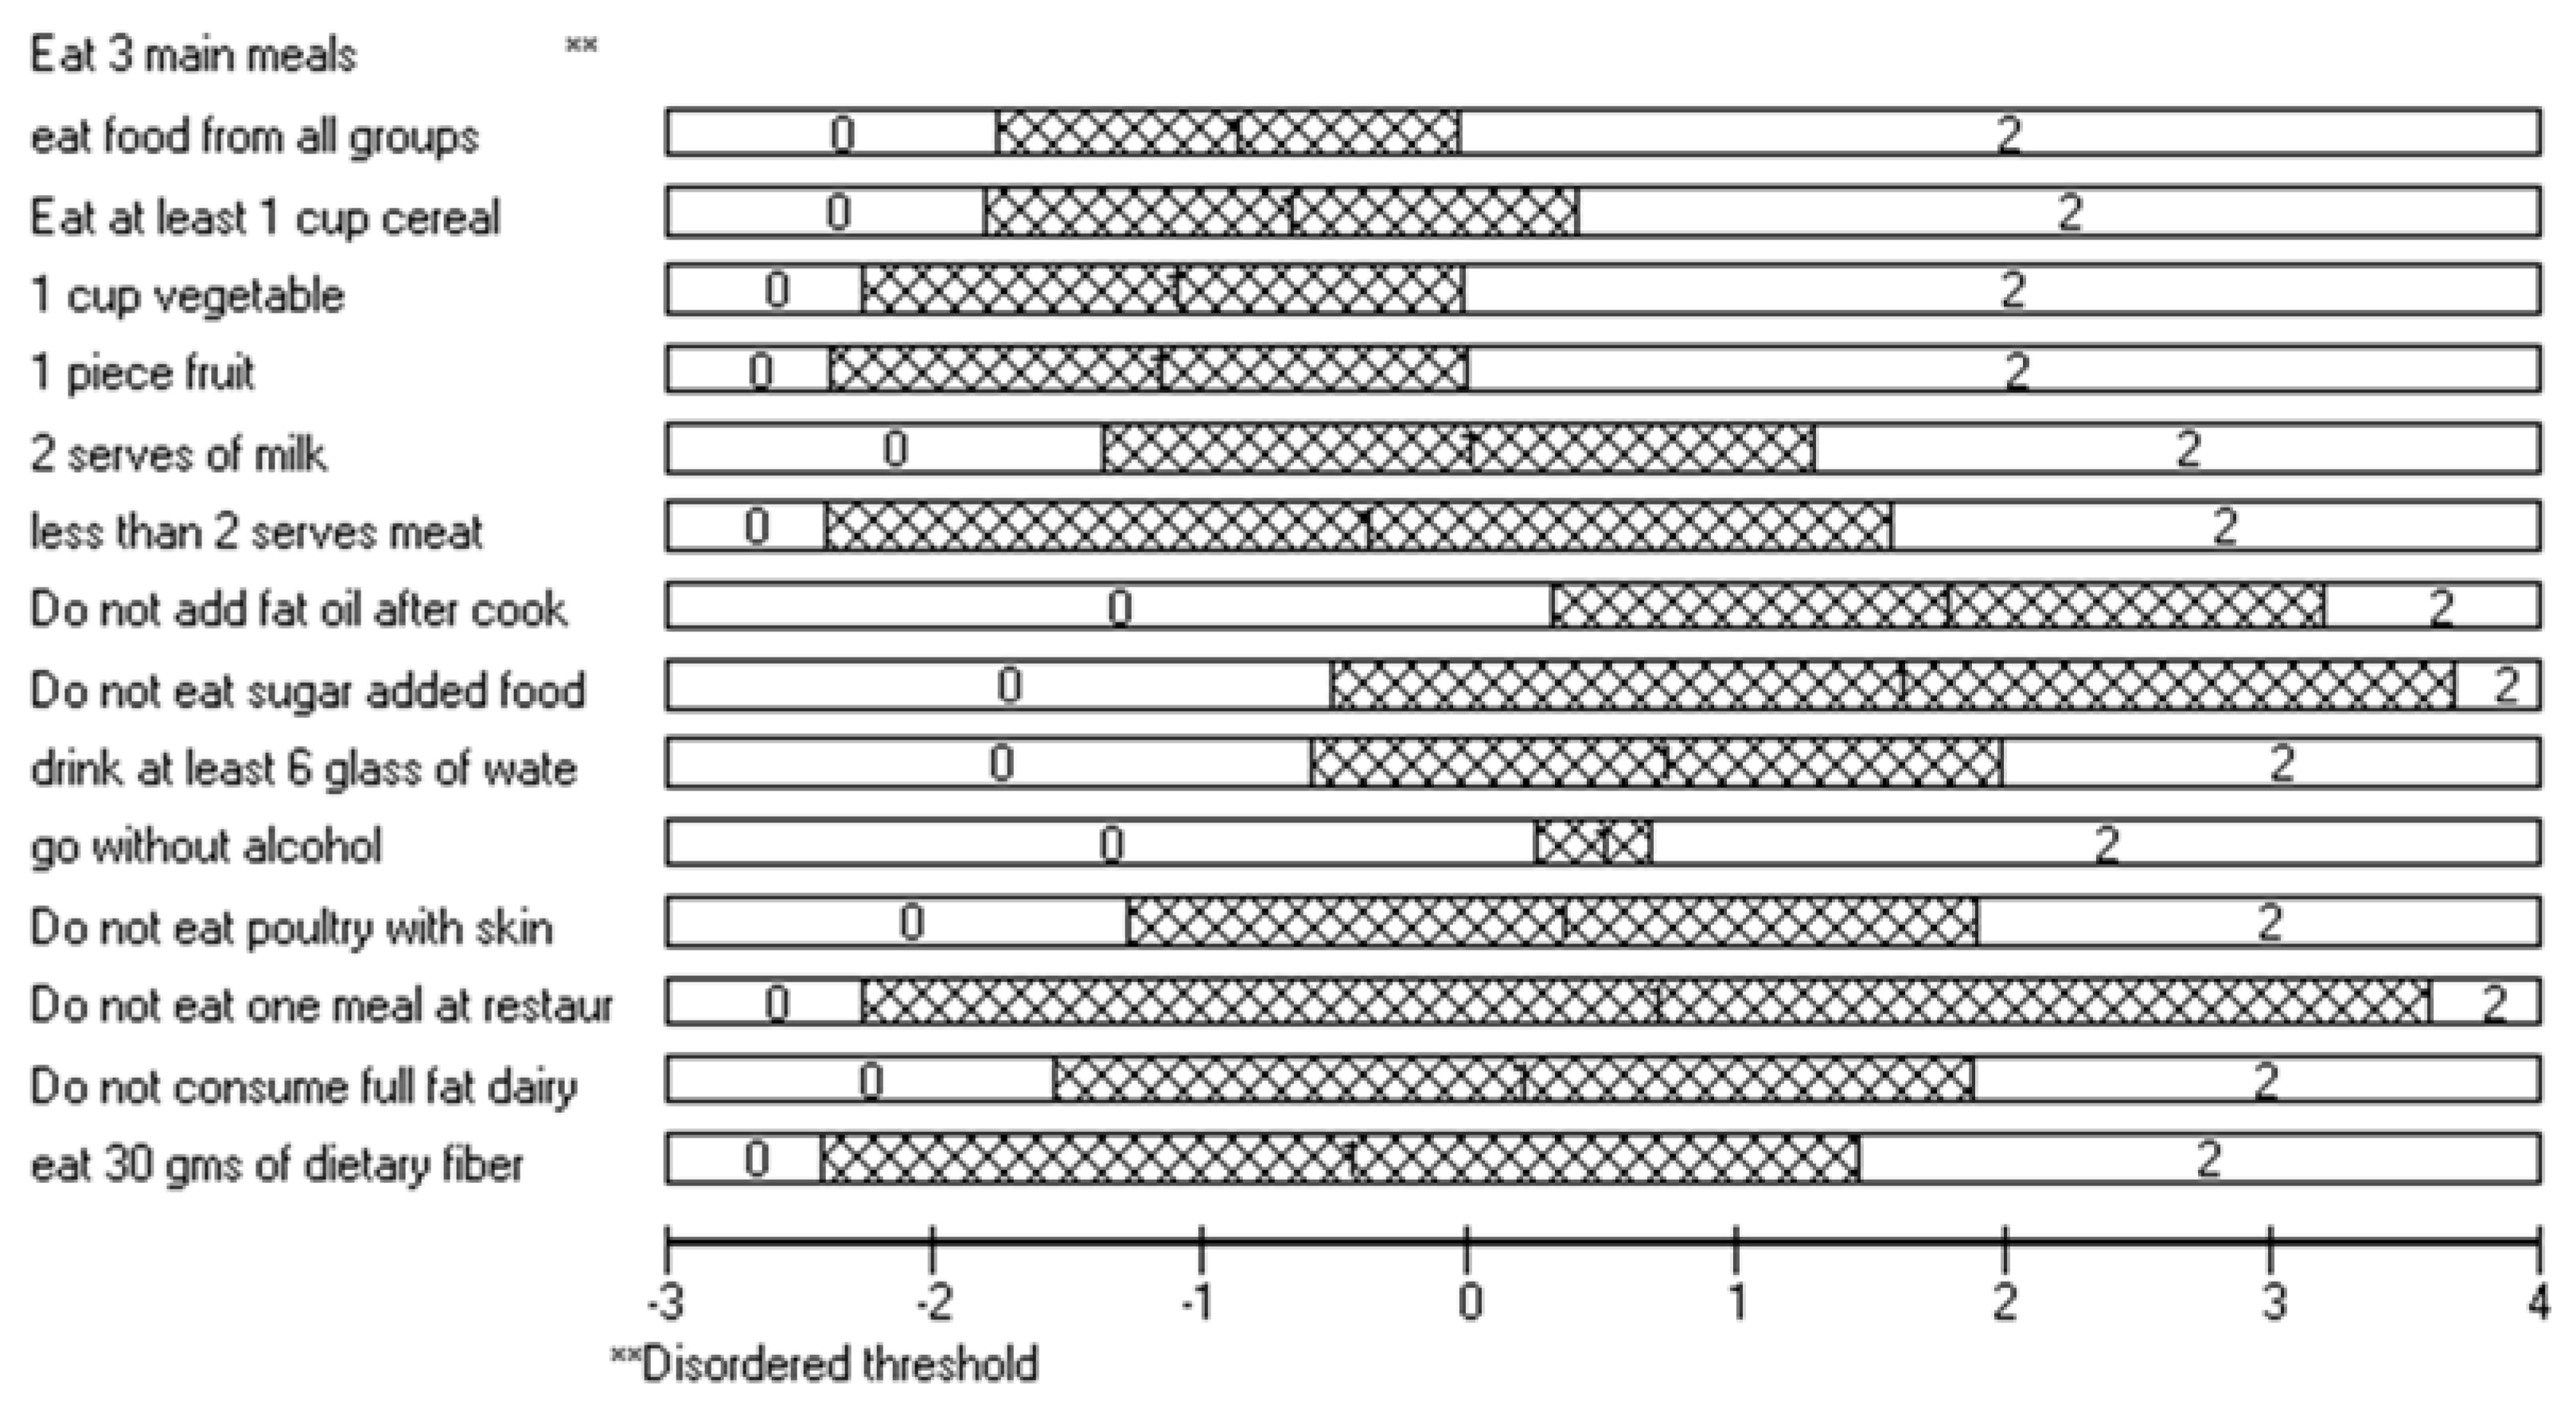
We can detect disordered thresholds by examining the threshold map and may indicate item misfits where the respondents cannot distinguish between the response’s choices [50]. This, however, remains controversial [55]. In RUMM2030 software [38], some software developers consider disordered thresholds a problem, however, other software developers are of the opinion that disorder is not necessarily an indicator of misfit of data to the model [55,56,57]. Disordered thresholds can be addressed by collapsing neighboring response options [58]. However, it can be argued that disordered thresholds are not a reason for collapsing categories.
Differential item functioning (DIF) investigates whether items are similar across different groups [50], in this case testing whether different genders, ages, or ethnicities had equal levels of the trait being evaluated. This was ascertained by examining plots on item characteristic curves (ICCs) for the groups and examining between-group ANOVA [59]. DIF was found to be present if the ANOVA was significant (Bonferroni adjusted) [60]. Differential item functioning (DIF) is a measure that determines whether the items on a scale are functioning equally for subgroups of participants [49]. Although checking for DIF is not required from a random sampling perspective [61], it is an important option to check if the tool is appropriate for all factors, which ensures the items are functioning equally for subgroups of respondents. DIF is only a requirement if one assumes a stochastic subject interpretation of the Rasch model [61].
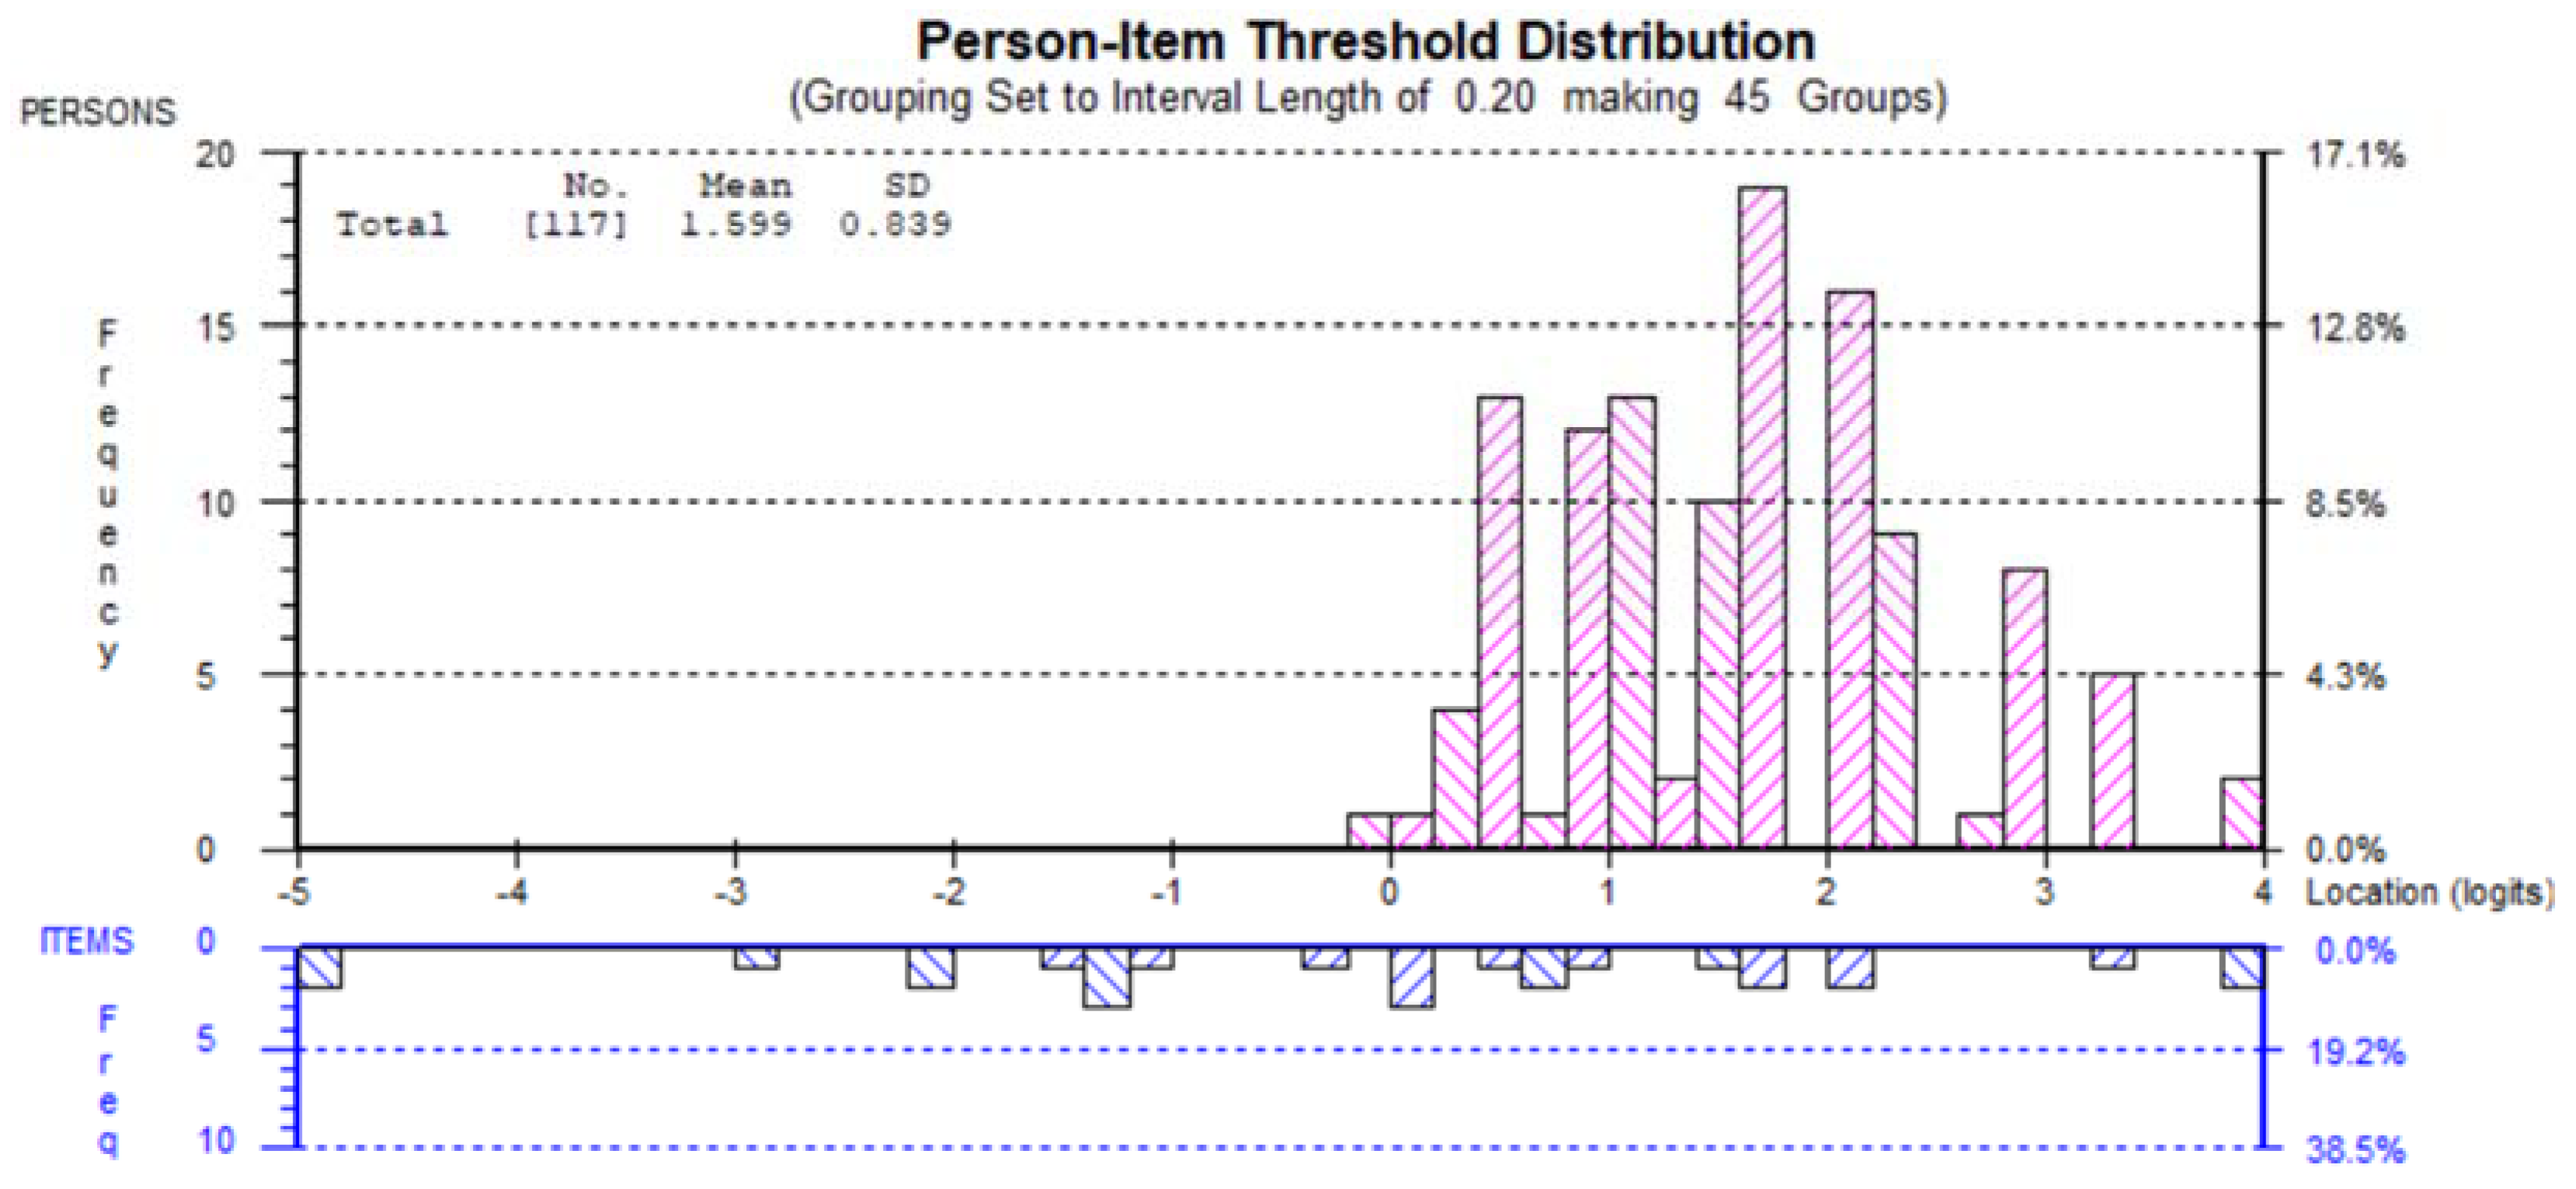
Targeting of items and persons can be ascertained by examination of the person–item threshold distribution map, which plots person locations together with item threshold locations on the same chart. To be considered well-targeted, item and person mean locations should be around zero and there should be a spread of scores among respondents [49].
Rasch analysis can also be used to test internal reliability, given by the PSI which reflects the ability to differentiate between various levels of the underlying construct [59]. A value near 1 indicates high internal consistency with a value less than 0.7 demonstrating low reliability [50].

3. Results

3.1. Participant Characteristics

Of a total of 119 participants, one-third were male, more than 80% were non-Chinese. Females were younger than males, 21% of females vs. 34% of males were older than 70 years. Male and female ratios among Chinese or non-Chinese participants were similar (Table 1).

3.2. Overall Model Fit/Summary

Initial inspection of the original unaltered scale showed satisfactory fit with the Rasch model. This was indicated by a non-significant item–trait interaction (χ2 = 29.29, df = 30, p = 0.500) and person and item fits with means close to 0 and SDs close to 1. Refer to Table 2 for person and item fit statistics.

3.3. Differential Item Functioning (DIF)

DIF was examined for ethnicity (Chinese/Non-Chinese), gender, and age groups by a two-way ANOVA on the residuals for each item across subgroups and across class intervals.
As seen in Table 3, the scale showed no evidence of DIF by age and gender, but there was evidence of DIF between non-Chinese and Chinese, as shown with the effect size. The mean (95% CI) logit for non-Chinese was higher at 0.35 (0.09, 0.61), p = 0.008 compared to Chinese with Cohen’s d =0.66. Cohen’s d is commonly used to refer to effect sizes as small (d = 0.2), medium (d = 0.5), and large (d = 0.8) based on benchmarks suggested by Cohen (1988) [62], which implies that ethnicity had more than a medium effect size. However, gender and age group did not show significant effect size (Table 3).

3.4. Disordered Threshold/Threshold Curves

For the unaltered scale, seven items were found to have disordered thresholds (refer to Figure 1). This indicates that participants may have difficulty discriminating between the response categories for these items. However, as stated earlier, many developers do not see disordered thresholds as a misfit of data to the model [55,56,57]. To address disordered thresholds, the categories were recoded to 0112 (merging the middle categories), however, item 1 “Eat 3 main meals” was still disordered (Figure 2).

3.5. Refinement of Model

Several refinements were trialed to ascertain the best model fit, see Table 2. Rescoring/collapsing categories to address disordered thresholds was trialed, because some model and software developers argue that there are certain circumstances where disordered thresholds may reflect a flaw in the scale [55]. After re-scoring categories, however, there was a drop in item–trait interaction χ2. Even after collapsing the middle categories, item 1 was still disordered. The fit statistics were calculated with item 1 deleted, however, there was no substantial increase in model fit, so it was decided to retain item 1 in the scale.
As previously stated, there were problems with the fits for item 10 (which had fit residual of 2.573) and a Chinese male in the 60–69 age group and a non-Chinese male in the 60–69 age group, having fit residuals of −3.461 and 3.402, respectively, which are outside the ±2.5 recommendation. After collapsing the middle categories, the item 10 fit residual decreased to 1.391 which is acceptable, so item 10 was retained in the scale.

3.6. Targeting Person Item Threshold

Targeting was measured using the person–item threshold distribution map (Figure 3), and an uncentralized threshold diagram (Figure 4).
Figure 4 shows the targeting of the scale with person distribution in the top part and the item thresholds in the bottom half. The overall mean person logit is 1.59 which shows that the respondents had levels of healthy eating higher than the target for the scale.
In terms of the targeting, the results indicate a “ceiling” effect, with the clustering of participants at the high end of the scale, indicating higher levels of persons with the trait of healthy eating. From Figure 3 and Figure 4 below, the scale presented may have poor targeting with unsatisfactory spread between items and spread of respondents, with insufficient items to assess the full range of the attribute of the sample.

3.7. Proposed Final Analysis of Items and Three Response Categories

The final analysis shows that three response categories (rather than four) should be used in the scale. Originally, item 10 was misfit, with an unacceptable fit residual, however, after changing to three response categories (collapsing the middle categories), this was no longer a problem, so item 10 was retained in the scale. Item 1 exhibited disordered thresholds, even after collapsing, so it was removed to ascertain whether it would improve model fit, which it did not. So, item 1 was retained. Two misfit persons were removed based on residual values, however, this did not improve model fit, so these persons were retained in the scale.
Regardless of the modifications, the PSI remained unacceptably low. The PSI ranged from 0.457 to 0.570, depending on various modifications. This is below the recommended 0.700 for PSI, see Table 2. This may indicate the model may not be suitable for use.
A significant DIF for the “Chinese” group was found on item 6 (two serves of milk) using Bonferroni-adjusted alpha value (0.05/15 = 0.003), however, after splitting the file and running separate analysis, there was no significant increase in model fit.
In the final model, 13 items with 3 response categories showed all items to have ordered thresholds. There was no indication of item or person misfit.

4. Discussion

This study investigated the psychometric performance of a healthy eating habit scale using a sample of pre-diabetic people employing Rasch analysis. This paper fills a gap in the literature due to the lack of studies that provide comprehensive assessment of eating pattern scales. The validity of the category scoring system, the fit of individual questions, and an assessment of the possible propensity of ethnicity, gender, and age groups are all included in this current study.
The results from the Rasch analysis suggested that the scale required minor modifications. Some items with disordered thresholds were handled by collapsing response categories. Even though a significantly better fit was not achieved, the best scale appeared to be a 3-point scoring structure. The fact that a better fit was not achieved by collapsing response categories gives further evidence to the notion that disordered thresholds may not indicate a misfit of the data to the model, and it remains controversial [55].
The value of PSI which is analogous to Cronbach’s alpha [49] was 0.57 in the initial model which indicates a problem with the scale. The PSI represents the power of the latent variable to discriminate among persons. A non-satisfactory PSI means that the top measure cannot be reliably distinguished from the bottom measure with confidence [49], essentially reflecting the ability to discriminate between different levels of the construct [59].
There are two types of DIF that RUMM2030 tests for, uniform and non-uniform. Uniform DIF occurs when the group exhibits consistent differences in their responses on an item [59]. According to Hansen and Kjaersgaard [49], items with significant DIFs could be removed because they may reflect misfit in the model.
The scale showed no evidence of DIF by age and gender, but there was evidence of uniform DIF in item 6 (“two serves of milk”) for the ethnicity variable. Table 4 shows that more than half of non-Chinese participants drink two serves of milk daily on most days, whereas 13/20 Chinese participants answered “Rarely” or “Never”. This is aligned with findings from another study where the author found out that Chinese consumption of dairy products is relatively low compared to other countries [63]. This may be due to the fact that high proportion of Asians are lactose-intolerant [64].
The Rasch model showed some good psychometric characteristics such as good person and item fit, and good item–trait interaction statistic (χ2). There were some concerns about the low person separation index (PSI), the unidimensionality, and targeting of the scale. A low PSI may indicate that the power of the test to distinguish misfit between the responses and the model is weak. The issue with targeting, with the many participants at the high end of the scale indicating higher levels of persons with the trait of healthy eating, might be a result of social desirability. The tendency for people to present themselves in a generally favorable fashion could be mitigated by having a self-report scale rather than an in-person interview.
The strength of this study is that Rasch analysis was used to evaluate the Rapid Eating Assessment for Participants (REAP), with Rasch analysis considered the gold standard with which the validity of scales can be evaluated [49] and overcoming limitations of the classical test theory approach. A limitation of this study is that it uses the dataset from Hackworth et al.’s study in 2007 [27], which might not be up to date. A study conducted by Roy Morgan Research in 2017 [65] showed that Australians had changed their attitudes to food between 2006 and 2016 and some changes were worrisome. For instance, fewer people were concerned about their cholesterol level (36.8% in 2006 and 31.1% in 2016) and fewer people considered low-fat diet as a way of life (37.9% in 2006 and 29.9% in 2016). The investigation would be improved by obtaining a more recent sample.
This study involved 119 participants and, according to Jackson et al. (2020), a sample size of at least 100 patients is adequate for Rasch modeling for exploratory purposes. Although the problem with fit statistics in the context of the Rasch analysis is that the larger the sample size, the greater the chance of identifying deviations from the Rasch model, Smith (2008) suggested that a sample of approximately 300 is considered suitable.
Another issue for consideration is that the current sample size is skewed towards females (65.5%) and non-Chinese (83.2%). However, overall, the proportion of non-Chinese is above 94.5% in Australia [66].

5. Conclusions

The Rasch analysis reveals that seven items exhibited disordered thresholds, however, merging categories did not improve the model fit. Although the tool had good psychometric characteristics such as good person and item fit and good item–trait interaction statistics, there were some concerns, especially the low person separation index (PSI), the borderline violation of unidimensionality, and reasonable target between persons and items. Potential problems were that the sample was skewed toward females (65.5%), and non-Chinese (83.2%), which may not be representative of the Australian population. Another limitation was the small sample size, as approximately 300 participants are required for a robust analysis.
The present study provides an important first step in the creation and validation of the Rapid Eating Assessment for Participants (REAP) scale using Rasch analysis. The paper gives evidence of the potential items and categories for creating a valid scale and provides good opportunities for future studies. Future studies should consider a larger sample size that represents the Australian population to recommend the tool as a valid and reliable measure of healthy eating habits in people with pre-diabetes.

Author Contributions

Writing—original draft, K.A.d.V.; Writing—review & editing, N.H.N.D.; Visualization, F.M.A.I.; Supervision and editing, F.M.A.I. All authors have read and agreed to the published version of the manuscript.

Funding

This research received no external funding.

Institutional Review Board Statement

Participants were recruited through referral by general medical practitioners within the study area through opportunistic community screening for diabetes risk factors or through self-reported risk factor assessments based on community mailouts or publicity. No specific approval was taken from any Institutional review board. Participant’s recruitment was opportunistic. Not applicable.

Informed Consent Statement

Written informed consent for participation was not required for this study in accordance with the national legislation and the institutional requirements.

Data Availability Statement

Rapid Eating Assessment for Participants (REAP) scale was obtained from Christine Critchley and is available from Fakir Amirul Islam.

Acknowledgments

The authors would like to thank supervisor Amirul Islam from the Swinburne University of Technology for his guidance in completing this paper.

Conflicts of Interest

The authors declare that they have no conflict of interest.

References

  1. WHO. Diabetes Fact Sheet. Available online: https://www.who.int/news-room/fact-sheets/detail/diabetes (accessed on 18 December 2022).
  2. Cheung, N.M.D.; Mitchell, P.P.; Wong, T.Y.P. Diabetic retinopathy. Lancet 2010, 376, 124–136. [Google Scholar] [CrossRef] [PubMed]
  3. International Diabetes Federation. IDF Diabetes Atlas 10th Edition 2021. Available online: https://diabetesatlas.org/idfawp/resource-files/2021/07/IDF_Atlas_10th_Edition_2021.pdf (accessed on 18 December 2022).
  4. AIHW. Diabetes. Available online: https://www.aihw.gov.au/reports/diabetes/diabetes/contents/how-many-australians-have-diabetes (accessed on 18 December 2022).
  5. Barnes, P.M.; Adams, P.F.; Powell-Griner, E. Health characteristics of the Asian adult population: United States, 2004–2006. Adv. Data 2008, 394, 1–22. [Google Scholar]
  6. Gujral, U.P.; Echouffo-Tcheugui, J.B.; Narayan, K.M.V. Commentary: Trends in prevalence of type 2 diabetes and prediabetes in South Asians-does it tell a story? Int. J. Epidemiol. 2011, 40, 1554–1555. [Google Scholar] [CrossRef]
  7. Wang, E.J.; Wong, E.C.; Dixit, A.A.; Fortmann, S.P.; Linde, R.B.; Palaniappan, L.P. Type 2 diabetes: Identifying high risk Asian American subgroups in a clinical population. Diabetes Res. Clin. Pract. 2011, 93, 248–254. [Google Scholar] [CrossRef]
  8. Choi, S.E.; Liu, M.; Palaniappan, L.P.; Wang, E.J.; Wong, N.D. Gender and ethnic differences in the prevalence of type 2 diabetes among Asian subgroups in California. J. Diabetes Complicat. 2013, 27, 429–435. [Google Scholar] [CrossRef]
  9. Centers for Disease Control and Prevention. Diabetes and Asian American People. Available online: https://www.cdc.gov/diabetes/library/spotlights/diabetes-asian-americans.html (accessed on 18 December 2022).
  10. Office of Minority Health. Diabetes and Asian Americans. Available online: https://minorityhealth.hhs.gov/omh/browse.aspx?lvl=4&lvlid=48 (accessed on 18 December 2022).
  11. Dunstan, D.W.; Zimmet, P.Z.; Atkins, R.; Shaw, J.E.; Welborn, T.A.; De Courten, M.P.; Cameron, A.J.; Sicree, R.A.; Dwyer, T.; Colagiuri, S.; et al. The rising prevalence of diabetes and impaired glucose tolerance: The Australian Diabetes, Obesity and Lifestyle Study. Diabetes Care 2002, 25, 829–834. [Google Scholar] [CrossRef]
  12. Nordström, A.; Hadrévi, J.; Olsson, T.; Franks, P.W.; Nordström, P. Higher Prevalence of Type 2 Diabetes in Men Than in Women Is Associated With Differences in Visceral Fat Mass. J. Clin. Endocrinol. Metab. 2016, 101, 3740–3746. [Google Scholar] [CrossRef] [PubMed]
  13. American Diabetes Association. Diagnosis and classification of diabetes mellitus. Diabetes Care 2012, 37 (Suppl. 1), S81–S90. [Google Scholar] [CrossRef]
  14. Leiter, L.A.; Barr, A.; Belanger, A.; Lubin, S.; Ross, S.A.; Tildesley, H.D.; Fontaine, N. Diabetes screening in Canada (DIASCAN) Study: Prevalence of undiagnosed diabetes and glucose intolerance in family physician offices. Diabetes Care 2001, 24, 1038–1043. [Google Scholar] [CrossRef]
  15. King, H.; Rewers, M.; Who Ad Hoc Diabetes Reporting Group. Global Estimates for Prevalence of Diabetes Mellitus and Impaired Glucose Tolerance in Adults. Diabetes Care 1993, 16, 157–177. [Google Scholar] [CrossRef]
  16. Gu, D.; Reynolds, K.; Duan, X.; Xin, X.; Chen, J.; Wu, X.; Mo, J.; Whelton, P.K.; He, J. Prevalence of diabetes and impaired fasting glucose in the Chinese adult population: International Collaborative Study of Cardiovascular Disease in Asia (InterASIA). Diabetologia 2003, 46, 1190–1198. [Google Scholar] [CrossRef] [PubMed] [Green Version]
  17. Tapp, R.J.; Zimmet, P.Z.; Harper, C.A.; McCarty, D.J.; Chitson, P.; Tonkin, A.M.; Söderberg, S.; Taylor, H.R.; Alberti, K.G.M.M.; Tuomilehto, J.; et al. Six year incidence and progression of diabetic retinopathy: Results from the Mauritius diabetes complication study. Diabetes Res. Clin. Pract. 2006, 73, 298–303. [Google Scholar] [CrossRef] [PubMed]
  18. Fletcher, B.; Gulanick, M.; Lamendola, C. Risk Factors for Type 2 Diabetes Mellitus. J. Cardiovasc. Nurs. 2002, 16, 17–23. [Google Scholar] [CrossRef]
  19. Belkina, A.C.; Denis, G.V. Obesity genes and insulin resistance. Curr. Opin. Endocrinol. Diabetes Obes. 2010, 17, 472–477. [Google Scholar] [CrossRef]
  20. Asif, M. The prevention and control the type-2 diabetes by changing lifestyle and dietary pattern. J. Educ. Health Promot. 2014, 3, 1. [Google Scholar] [CrossRef] [PubMed]
  21. Tuomilehto, J.; Lindström, J.; Eriksson, J.G.; Valle, T.T.; Hämäläinen, H.; Ilanne-Parikka, P.; Keinänen-Kiukaanniemi, S.; Laakso, M.; Louheranta, A.; Rastas, M.; et al. Prevention of Type 2 Diabetes Mellitus by Changes in Lifestyle among Subjects with Impaired Glucose Tolerance. N. Engl. J. Med. 2001, 344, 1343–1350. [Google Scholar] [CrossRef]
  22. Lindström, J.; Aittola, K.; Pölönen, A.; Hemiö, K.; Ahonen, K.; Karhunen, L.; Männikkö, R.; Siljamäki-Ojansuu, U.; Tilles-Tirkkonen, T.; Virtanen, E.; et al. Formation and Validation of the Healthy Diet Index (HDI) for Evaluation of Diet Quality in Healthcare. Int. J. Environ. Res. Public Health 2021, 18, 2362. [Google Scholar] [CrossRef]
  23. Sami, W.; Ansari, T.; Butt, N.S.; Hamid, M.R.A. Effect of diet on type 2 diabetes mellitus: A review. Int. J. Health Sci. 2017, 11, 65–71. [Google Scholar]
  24. England, C.Y.; Thompson, J.L.; Jago, R.; Cooper, A.R.; Andrews, R.C. Development of a brief, reliable and valid diet assessment tool for impaired glucose tolerance and diabetes: The UK Diabetes and Diet Questionnaire. Public Health Nutr. 2017, 20, 191–199. [Google Scholar] [CrossRef]
  25. National Health and Medical Research Council. Dietary Guidelines for Australian Adults. Available online: http://www.nhmrc.gov.au/publications/_files/n33.pdf (accessed on 14 July 2021).
  26. McNaughton, S.A.; Ball, K.; Crawford, D.; Mishra, G.D. An Index of Diet and Eating Patterns Is a Valid Measure of Diet Quality in an Australian Population. J. Nutr. 2008, 138, 86–93. [Google Scholar] [CrossRef]
  27. Hackworth, N.; Moore, S.M.; Hardie, E.A.; Critchley, C.; Buzwell, S.; Crafti, N.; Kyrios, M. A Risk Factor Profile for Pre-diabetes: Biochemical, Behavioural, Psychosocial and Cultural Factors. Ejournal Appl. Psychol. 2007, 3. [Google Scholar] [CrossRef]
  28. Segal-Isaacson, C.J.; Wylie-Rosett, J.; Gans, K.M. Validation of a Short Dietary Assessment Questionnaire: The Rapid Eating and Activity Assessment for Participants Short Version (REAP-S). Diabetes Educ. 2004, 30, 774–781. [Google Scholar] [CrossRef] [PubMed]
  29. All Children Learning. Classical Test Theory and Item Response Theory. Available online: https://allchildrenlearning.org/assessment-topics/analysing/classical-test-theory-and-item-response-theory/ (accessed on 10 October 2022).
  30. Frey, F. Test Theory and Classical Test Theory. In The International Encyclopedia of Media Psychology; Wiley: Hoboken, NJ, USA, 2020. [Google Scholar]
  31. Urbina, S. Essentials of Psychological Testing; John Wiley & Sons Inc: Hoboken, NJ, USA, 2004. [Google Scholar]
  32. Hu, Z.; Lin, L.; Wang, Y.; Li, J. The Integration of Classical Testing Theory and Item Response Theory. Psychlogy 2021, 12, 1397–1409. [Google Scholar]
  33. Lewis, C. 2 Selected Topics in Classical Test Theory. In Handbook of Statistics; Rao, C.R., Sinharay, S., Eds.; Elsevier: Amsterdam, The Netherlands, 2006; Volume 26, pp. 29–43. [Google Scholar]
  34. Bechger, T.; Maris, G.; Verstralen, H.; Béguin, A. Using Classical Test Theory in Combination With Item Response Theory. Appl. Psychol. Meas. 2003, 27, 319–334. [Google Scholar] [CrossRef]
  35. Brennan, R.L. Generalizability Theory and Classical Test Theory. Appl. Meas. Educ. 2010, 24, 1–21. [Google Scholar] [CrossRef]
  36. Chen, W.-H.; Lenderking, W.; Jin, Y.; Wyrwich, K.; Gelhorn, H.; Revicki, D. Is Rasch model analysis applicable in small sample size pilot studies for assessing item characteristics? An example using PROMIS pain behavior item bank data. Qual. Life Res. Int. J. Qual. Life Asp. Treat. Care Rehabil. 2013, 23, 485–493. [Google Scholar] [CrossRef]
  37. Uddin, M.N.; Islam, F.M.A.; Al Mahmud, A. Psychometric evaluation of an interview-administered version of the Kessler 10-item questionnaire (K10) for measuring psychological distress in rural Bangladesh. BMJ Open 2018, 8, e022967. [Google Scholar] [CrossRef]
  38. D Andrich, B.S.; Luo, G. RUMM2030 Professional 5.4; RUMM Laboratory: Perth, Australia, 2015. [Google Scholar]
  39. Rummlab. Frequently Asked Questions. Available online: https://www.rummlab.com.au/faqs (accessed on 10 January 2022).
  40. Institute for Objective Measurement. Rasch Measurement Analysis Software Directory. Available online: https://www.rasch.org/software.htm (accessed on 10 January 2023).
  41. Rasch, G. An Item Analysis which Takes Individual Differences into Account. Br. J. Math. Stat. Psychol. 1966, 19, 49–57. [Google Scholar] [CrossRef]
  42. Wind, S.; Hua, C. Rasch Measurement Theory Analysis in R: Illustrations and Practical Guidance for Researchers and Practitioners. Available online: https://bookdown.org/chua/new_rasch_demo2/ (accessed on 10 October 2022).
  43. An, X.; Yung, Y.-F. Item Response Theory: What It Is and How You Can Use the IRT Procedure to Apply It. Available online: https://support.sas.com/resources/papers/proceedings14/SAS364-2014.pdf (accessed on 10 January 2023).
  44. Wikipedia Contributors. Rasch Model. Available online: https://en.wikipedia.org/w/index.php?title=Rasch_model&oldid=1131516781 (accessed on 10 October 2022).
  45. Lamprianou, I.; Athanasou, J.A. A Teacher’s Guide to Educational Assessment; Brill: Leiden, The Netherlands, 2009. [Google Scholar]
  46. Hays, R.D.; Morales, L.S.; Reise, S.P. Item response theory and health outcomes measurement in the 21st century. Med. Care 2000, 38, 28–42. [Google Scholar] [CrossRef]
  47. Furr, D.C. Partial Credit and Generalized Partial Credit Models with Latent Regression. Available online: https://mc-stan.org/users/documentation/case-studies/pcm_and_gpcm.html#generalized-partial-credit-model-with-latent-regression (accessed on 19 January 2023).
  48. Zanon, C.; Hutz, C.S.; Yoo, H.; Hambleton, R.K. An application of item response theory to psychological test development. Psicol. Reflexão E Crítica 2016, 29, 18. [Google Scholar] [CrossRef]
  49. Hansen, T.; Kjaersgaard, A. Item analysis of the Eating Assessment Tool (EAT-10) by the Rasch model: A secondary analysis of cross-sectional survey data obtained among community-dwelling elders. Health Qual. Life Outcomes 2020, 18, 139. [Google Scholar] [CrossRef]
  50. Robinson, M.; Johnson, A.M.; Walton, D.M.; MacDermid, J.C. A comparison of the polytomous Rasch analysis output of RUMM2030 and R (ltm/eRm/TAM/lordif). BMC Med. Res. Methodol. 2019, 19, 36. [Google Scholar] [CrossRef] [PubMed]
  51. Uddin, M.N.; Islam, F.M.A. Psychometric evaluation of the modified Kessler seven-item version (K7) for measuring psychological distress using Rasch analysis: A cross-sectional study in a rural district of Bangladesh. BMJ Open 2020, 10, e034523. [Google Scholar] [CrossRef] [PubMed] [Green Version]
  52. Brentari, E.; Golia, S. Unidimensionality in the Rasch model: How to detect and interpret. Statistica 2007, 67, 253–261. [Google Scholar] [CrossRef]
  53. Pallant, J.F.; Tennant, A. An introduction to the Rasch measurement model: An example using the Hospital Anxiety and Depression Scale (HADS). Br. J. Clin. Psychol. 2007, 46, 1–18. [Google Scholar] [CrossRef]
  54. Engelhard, G. Rasch models for measurement—Andrich D. Appl. Psychol. Meas. 1988, 12, 435–436. [Google Scholar] [CrossRef]
  55. Bond, T.; Fox, C. Applying the Rasch Model: Fundamental Measurement in the Human Sciences, 2nd ed.; Lawrence Erlbaum Associates Publishers: Mahwah, NJ, USA, 2007. [Google Scholar]
  56. Adams, R.J.; Wu, M.L.; Wilson, M. The Rasch Rating Model and the Disordered Threshold Controversy. Educ. Psychol. Meas. 2012, 72, 547–573. [Google Scholar] [CrossRef]
  57. Linacre, J.M. Step disordering and Thurstone thresholds. Rasch Meas. Trans. 1991, 5, 171. [Google Scholar]
  58. Masters, G.N. A Rasch model for partial credit scoring. Psychometrika 1982, 47, 149–174. [Google Scholar] [CrossRef]
  59. Linacre, J.M. Optimizing rating scale category effectiveness. J. Appl. Meas. 2002, 3, 85–106. [Google Scholar]
  60. Tennant, A.; Pallant, J.F. DIF matters: A practical approach to test if differential item functioning makes a difference. Rasch Meas. Trans. 2007, 24, 1082–1084. [Google Scholar]
  61. Holland, P.W. On the sampling theory foundations of item response theory models. Psychometrika 1990, 55, 577–601. [Google Scholar] [CrossRef]
  62. Cohen, J. Statistical Power Analysis for the Behavioral Sciences; Routledge Acaedmic: New York, NY, USA, 1988. [Google Scholar]
  63. Ma, Y. Dairy Product Per Capita Consumption in China 2013–2019. Available online: https://www.statista.com/statistics/1098497/china-per-capita-milk-dairy-consumption/ (accessed on 24 July 2021).
  64. Davis, B. What Did Ancient Chinese Write On? Available online: https://www.mvorganizing.org/what-did-ancient-chinese-write-on/ (accessed on 24 July 2021).
  65. Morgan, R. Our Changing Culinary Habits. Available online: http://www.roymorgan.com/findings/7179-our-changing-culinary-habits-attitudes-201703150956 (accessed on 24 July 2021).
  66. Statistics, A.B.O. Census All Persons QuickStats. Available online: https://www.abs.gov.au/census/find-census-data/quickstats/2021/AUS (accessed on 18 December 2022).
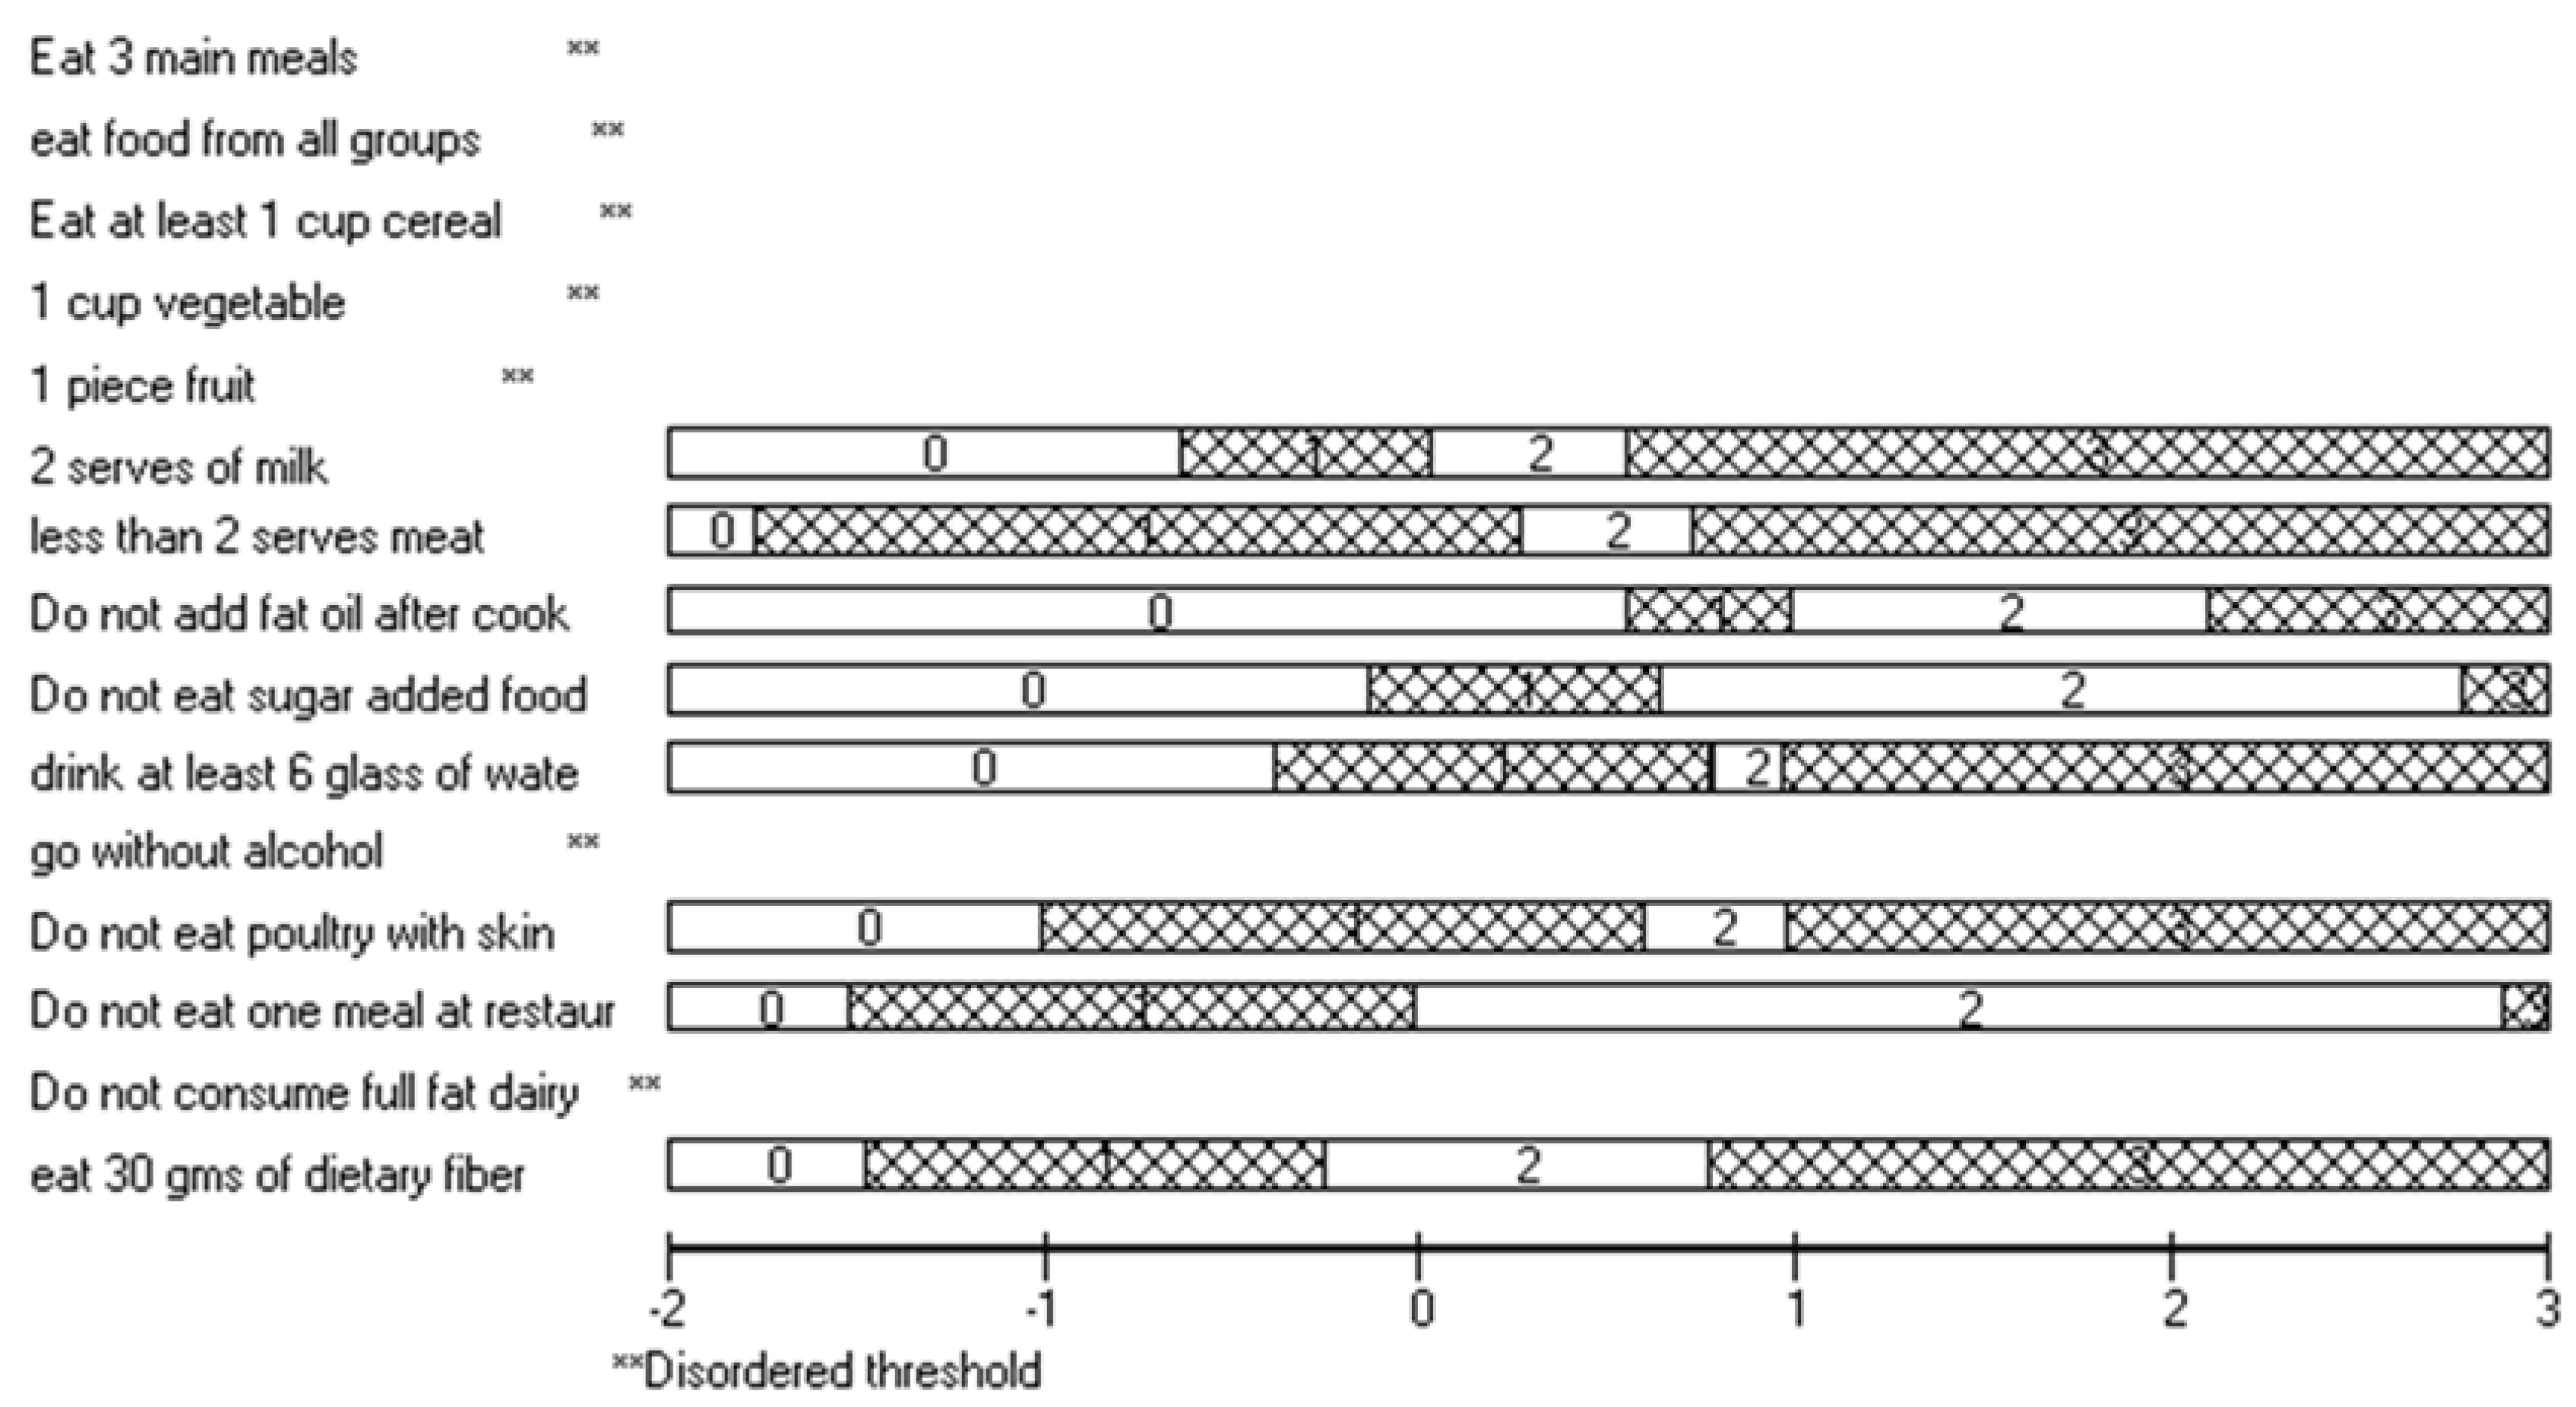
Figure 1. Threshold map for all items.
Applsci 13 02050 g001
Figure 2. Threshold map after collapsing middle categories, notice that “Eat 3 main meals” is still disordered.
Applsci 13 02050 g002
Figure 3. Person–item threshold distribution.
Applsci 13 02050 g003
Figure 4. Persons, items: uncentralized thresholds.
Applsci 13 02050 g004
Table 1. Characteristics of participants.
Gender
CharacteristicTotal, n = 119Male, n = 41Female, n = 78
Age group (in years)
   <6035 (29.4%)8 (19.5%)27 (34.6%)
   60–6954 (45.4%)19 (46.3%)35 (44.9%)
   70+30 (25.2%)14 (34.1%)16 (20.5%)
Ethnicity
   Non-Chinese99 (83.2%)35 (85.4%)64 (82.1%)
   Chinese20 (16.8%)6 (14.6%)14 (17.9%)
Table 2. Fit residuals, item–trait interaction, and reliability for different modifications of the scale.
Fit Residuals Mean (SD)Item-Trait InteractionReliability
Scale AnalysisItemPersonχ2 (df)pPSIPower of Fit
Initial analysis
 1. Full sample (no refinements or alteration)0.12 (0.91)−0.22 (0.98)29.29 (30)0.5000.57Reasonable
 2. Chinese only (full sample, no alteration).0.41 (0.59)0.16 (0.80)38.82 (30)0.1300.457Low
 3. Non Chinese only (full sample, no alteration)0.10 (0.95)−0.24 (0.96)23.90 (30)0.1290.585Reasonable
Analysis after reducing to three scoring categories
 1. Scoring structure 0112 for all items−0.14 (0.70)−0.33 (1.03)37.36 (30)0.1660.55Reasonable
Analysis after removing items and persons (last resort)
 1. Scoring Structure 0112 delete item 1 only (disordered)−0.10 (0.61)−0.33 (1.10)37.91 (28)0.1000.511Reasonable
 2. Scoring structure 0112 delete item 10 and ID 193 161−0.17 (0.52)−0.32 (0.97)32.31 (28)0.2620.559Reasonable
 3. Scoring structure 0112 delete item 1 &10 and ID 193 161−0.12 (0.40)−0.31 (1.05)27.49 (26)0.3840.525Reasonable
Optimal values0 (1.00)0 (1.00) >0.05>0.70
Table 3. Effect size shown as person location (mean (95% CI) logit) and Cohen’s d for ethnicity, gender, and age.
FactorsFactor ComparisonDifference in Mean (95% CI) LogitpCohen’s d
EthnicityNon-Chinese vs. Chinese0.35 (0.09, 0.61)0.0080.66
GenderFemale vs. Male0.09 (−0.12, 0.30)0.410.16
Age group60 and older vs. younger than 60 years0.11 (−1.26, 0.35)0.350.21
Table 4. Frequency of consumption (milk and water) by each person factor.
Chinese ParticipantSex
Non-ChineseChineseMaleFemale
CountCountCountCount
2 serves of milkNever1432
Rarely99810
Some days3151422
Usually/most days5721643
Drink at least 6 glasses of waterNever11056
Rarely3041519
Some days2971026
Usually/most days2991127
Disclaimer/Publisher’s Note: The statements, opinions and data contained in all publications are solely those of the individual author(s) and contributor(s) and not of MDPI and/or the editor(s). MDPI and/or the editor(s) disclaim responsibility for any injury to people or property resulting from any ideas, methods, instructions or products referred to in the content.