Abstract
This article concerns the application of the FEM method for the prediction of stress and deformation states in the workpiece during diamond sliding burnishing (DSB). An updated Lagrange (UL) description was used to describe the phenomena at a typical incremental step. The states of strain and strain rate are described by non-linear relationships without linearization. The material parameters were estimated during tensile tests to determine the characteristics of the 41Cr4 steel. Its hardness was also tested. Its aim was to prepare a table with the material properties of the above-mentioned steel and its implementation for numerical analyses. A Cowper–Symonds material model was used to model the displacement process of the wedge on an elastic/visco-plastic body reflecting the DSB process. The computer model was validated, and a good convergence of the results was obtained. Applications in the ANSYS/LS-Dyna program were developed to simulate the process of DSB. The results of numerical analyses were presented, among others, to explain the influence of the rake angle on the condition of the surface after machining, as well as the phenomenon of chip formation. The results of numerical simulations were verified experimentally on a test stand.
Keywords:
FEM; ANSYS; DEM; modeling; analysis; stresses; strains; diamond sliding burnishing; micro-cutting; chip; experimental plan 1. Introduction
1.1. Modeling of Selected Phenomena in the Diamond Sliding Burnishing Process
Diamond sliding burnishing is a quite well-known technological process. The main advantages include, among others, improved quality of the surface layer, improved fatigue strength or improved corrosion resistance. Numerous papers describe different advantages of using diamond burnishing as an alternative method in relation to the turning process. Below, several papers are shown as an example of the huge popularity of diamond sliding burnishing. The Authors generally research the influence of technological parameters or shape of the tool on the state of the surface layer after research. However, all the papers have the same common features. The Authors will mention these after a brief analysis of the literature.
In paper [1], the Authors present the geometric changes taking place on the surface of an object made of 16HG steel, hardened and burnished with a sliding diamond. They conducted real and simulation tests in the ABAQUS program on the basis of a two-dimensional section of the surface of a real object.
In works [2,3], it was found that the multiplicity of the load (the number of passes) during burnishing should not be too high, as it may cause excessive crushing with all its harmful consequences. Increasing the number of cycles above several is not advisable for economic reasons either, because as a result of the phenomenon of metal hardening, each cycle brings worse and worse effects [2,3].
The model of material deformation using a non-deformable rigid ball, known as the Hertz model, is quite often and with good results, adopted for an analysis of deformation processes in the contact zone of two elements, e.g., in an analysis of strengthened burnishing [4,5]. However, this model is not useful in the case of burnishing and hardening, or even in the case of burnishing itself. The formulas obtained on its basis in comparison with the values of forces used in experimental studies [6,7] indicate significant differences in the results.
The model of material deformation by means of a ball rolling on the machined surface is a better approximation of the burnishing processes, and due to its high similarity to sliding burnishing, it can be used to calculate the tool clamping force. However, attempts to calculate the tool clamping force during smooth burnishing provide inflated results; the values obtained differ significantly from the experimental data [8,9,10].
The model of material deformation by means of a ball sliding on the surface of the workpiece was considered by many authors, among which the studies described in [11] belong to the classics. The effects of burnishing, as practice shows, depend not only on the elastic-plastic properties of the workpiece and the geometry of the contact between the tool and the workpiece, but also on the initial surface roughness, and this factor is not taken into account by classical models, treating output surfaces as perfectly smooth. This is confirmed by the experimental formulas presented in the literature [12,13] that are used to select the burnishing parameters, but do not take into account the effect of the initial roughness of the surface machined. Therefore, it is necessary to take this factor into account in theoretical considerations.
For the reasons mentioned above, in an analysis of burnishing, it is necessary to adopt a different model than the one found in the literature. Such a model should take into account the stereometric state of the surface and, in particular, the height of the initial surface roughness, as the roughness of the surface after burnishing depends to a large extent on it [14,15,16,17,18,19,20].
Work hardening of the surface layer increases the resistance to the development of fatigue processes, especially in materials without very high hardness, such as aluminum alloys [21]. The hardening depth should be up to about 0.25 of the cross-sectional dimension of the part; at greater depths, no improvement in fatigue strength is observed [22].
In the work [23], it was found that anti-corrosion properties after burnishing are not the best, although in some cases sliding burnishing improves them. On the other hand, in [24,25,26,27,28,29,30] it was shown that the presence of compressive stresses may reduce the intensity of tribological wear. After slide burnishing, the depth of hardening is much smaller than in the case of the strengthening burnishing method (e.g., burnishing rolling), usually, hardening occurs within the height of unevenness—this makes it impossible to meet the anti-fatigue condition [31].
After sliding burnishing, compressive stresses are formed in the surface layer. Their maximum value depends on the burnishing parameters and the properties of the material processed. This was demonstrated in study [32], where the presence of compressive stresses in the surface layer is generally considered to have a positive effect on the operational properties, especially on the fatigue strength of machine elements as well as on tribological wear.
In works [33,34] it was shown that the structural changes after sliding burnishing are small and similar to changes after rolling pressure shot peening. In most cases, these changes are invisible even under an optical microscope.
In the work [35], it was stated that sliding burnishing increases the strength of power machine rotors. In the paper [36], a special device was designed and produced for burnishing the curvilinear contours of injection molds made of AISI P20 steel with burnishing forces reaching several hundred Newtons.
There are many studies related to testing the burnishing force of rough surfaces [25,37,38]. The Authors demonstrate how important it is to prepare the surface before diamond sliding burnishing. Papers [39,40] present the decorative qualities of burnished surface layers, which additionally gain increased fatigue strength and resistance to abrasion and corrosion.
An innovative approach was proposed in [41], where AISI 4140 steel was locally heated before using the burnishing tool. This resulted in the use of a lower burnishing force as well as a greater hardness of the surface machined, along with an improvement in the quality of the surface layer.
It has been shown in many publications that burnishing will result in favorable changes in the geometric structure of the surface through the plastic deformation of micro-unevenness and shaping the structure with flat tops with a high load-bearing capacity [32,42,43,44,45].
Diamond sliding burnishing is a very popular process. However, in every case we could observe very precise descriptions of technological parameters or tool geometry, but the beginnings of the burnishing process are discussed nowhere. Some tool geometry could cause different technological processes. It is important to explain in what time we can observe transition from one process to another. It is the main goal of this paper to describe phenomena during the sliding burnishing process transition to the turning process for two tool depths.
1.2. Modeling in Continuum Mechanics
Mathematical models describing a continuous medium usually constitute systems of integral or partial differential equations. This is due to the fact that in a continuous medium, variables are dependent on at least one spatial variable and time (if the object tested is variable in time). The mathematical model is supplemented with appropriate boundary and initial conditions. As a result, a boundary or boundary-initial problem is obtained. Only in simple problems is it possible to obtain a precise analytical solution to a given mathematical problem. Most often, the solution requires the use of approximate methods. In practice, approximate numerical methods are used most often.
Numerical methods of an approximate solution of continuous boundary-initial problems include the finite difference method MRS [46], the method of boundary elements MEB [47], the finite element method FEM [48,49,50,51,52,53], various meshless methods, such as the fuzzy particle method (smoothed particle hydrodynamics, SPH) [54], the free point method [55] and the material point method, also known as the material point method or the particle-in-cell-method [56,57].
The essence of the finite difference method is to replace derivatives with appropriate difference quotients determined on a discrete set of points. The finite difference method was initially applied to differential equations (local formulation), later the range of its applications was extended to problems formulated in variational forms (global formulation). The standard MRS formulation used regular (square, rectangular or cubic) node grids.
In advanced formulations, an arbitrary mesh of nodes is used. Difference quotients can be built on arbitrarily generated points, owing to which this MRS formulation can be classified as a gridless method [58]. It is also used in the mechanics of solids, e.g., a well-known program for solving problems in geomechanics FLAC [59] is based on the finite difference method.
In this paper, the finite element method (FEM) was used to discretize a continuous problem. The essence of FEM is a division of the continuous area under consideration into a finite number of sub-areas (finite elements) connected to each other at node points and an approximation of the solution in the area of elements using interpolation functions (shape functions) and values in nodes [60]. FEM equations are obtained by means of a formulation of an integral (global) problem using the principle of variation or the method of weighted residuals.
The method of boundary elements [61] consists in reducing the system of differential equations with given boundary conditions to the system of integral equations defined on the boundary of the area considered. Contrary to the finite element method and the finite difference method, its application does not require any discretization of the interior of the area, but only its edge. This is the main advantage of this method.
One of the disadvantages of using FEM is the need to generate an appropriate mesh of elements, which in the case of complex three-dimensional geometries is not easy for some types of elements. In an analysis of large deformations, the mesh of elements is subject to excessive distortions, which often makes it necessary to re-mesh the computational domain many times. Avoiding these problems is one of the reasons for the growing popularity of meshless methods. There are many meshless methods. The meshless finite difference method was mentioned above. Other meshless methods include the smoothed particle hydrodynamics method (SPH), the free point method, the finite point method [62] and the element-free Galerkin method [63]. The fuzzy particle method was initially developed for discrete problems in astrophysics [64]. Later, it was applied as a discretization method for continuous problems.
2. Materials and Methods
2.1. Modeling of Diamond Sliding Burnishing and Micro-Cutting Processes
This article concerns the use of the FEM method to predict stress and strain states and the geometric structure of the surface of the workpiece after the diamond sliding burnishing process. The updated Lagrange description was used to describe the phenomena at a typical incremental step. Non-linear incremental models without any linearization were used to describe physical phenomena. The results of the numerical simulation were experimentally verified on the example of selected parameters of the surface roughness profile.
Sliding burnishing, similarly to micro-cutting, can be treated as a process of moving a wedge (tool) over a workpiece. For a given tool geometry (vertical angle β and radius of cutting edge rounding rd) and machining depth ap, there is a limit rake angle at which material flash is formed in front of the tool, but no chip is formed. Thus, for rake angles , the sliding burnishing process takes place, while for , the flash turns into a chip and then the micro-cutting process takes place (Figure 1).
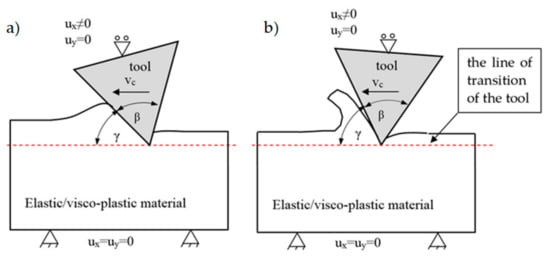
Figure 1.
Scheme showing the processes of sliding burnishing (a) for and micro-cutting (b) .
The processes of sliding burnishing and micro-cutting were considered as a geometrically and physically non-linear boundary-initial problem, in which there are non-linear, moving and variable in time and space boundary conditions. The boundary conditions in the tool–workpiece contact areas are unknown.
A mathematical description of non-linear phenomena requires the use of principles of formulating boundary-initial problems, which are different than those in linear problems, and require more complex methods of solving them.
Geometric non-linearity results from a non-linear relationship between strain and displacement. It is caused by a change in the geometry of the workpiece during the machining process (deformation, cracking).
Physical (material) non-linearity is caused by the non-linear mechanical properties of the workpiece material, leading to a non-linear stress–strain relationship.
2.1.1. The Concept of Incremental Description
To describe the phenomena in a typical incremental step, the updated Lagrange description was used, assuming three systems of orthogonal Cartesian coordinates ({x} movable associated with the object, {y} movable associated with the tool and {z} fixed reference system). The purpose of an incremental analysis is to determine the geometry of the body and the states of incremental displacements, displacement velocities, accelerations, strain, strain rates, stress, etc., existing in this body, in subsequent, discrete moments of time τ = 0, Δt, 2Δt, …, corresponding to a small increment of time. It is assumed that solutions are known for all the time steps in the interval [0, t] (including time t), and solutions will be searched for at time . By repeating this procedure for subsequent moments Δt, a solution is obtained in a given time interval [tp, tk].
Issues related to incremental description were presented in some works, e.g., in the paper by M. Kleiber, various concepts of incremental descriptions in non-linear mechanics were analyzed. An updated Lagrange description (Figure 2) was adopted to describe the wedge displacement process, which is characterized by high universality, based on the assumption of an additivity of individual deformation components on the original or current configuration. This concept of incremental description and algorithms of solutions developed for typical incremental step time has already been used by the Authors for numerical analyses of other technological processes of plastic forming, i.e., cutting [65,66,67,68,69,70,71,72], thread rolling [73], burnishing [74,75,76,77,78], drawing [79,80,81], grinding with a single abrasive grain [82] and for analyses of large plastic deformations and for predicting fatigue strength and product life [83,84,85], and it has been positively verified.
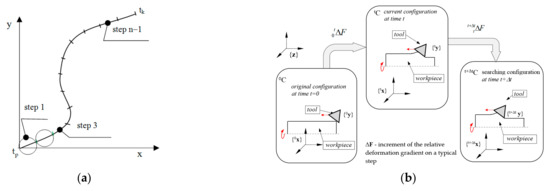
Figure 2.
Schematic diagram of the step-by-step analysis of the slide burnishing process (a) and the configurations adopted by the body in subsequent steps in an updated Lagrange description (red arrows means movement and rotation directions) (b).
According to the updated Lagrange description, at times τ < t, the values of all the functions appearing in the problem are known. According to the assumption referred to above, at the current moment t, the initial (original) configuration of the body and the current configuration are known. On the other hand, the next equilibrium configuration is sought, at the moment (Figure 2).
The incremental description formulated in this way in a non-linear process analysis is associated with a number of significant problems. They concern the selection of appropriate coordinate systems, the definition of strain and stress measures and their increments, as well as the determination of the rules for their accumulation at each incremental step.
2.1.2. Measures of Increments of Physical Quantities
The non-linearity of the object material was described using an incremental model, taking into account the influence of the strain history and the strain rate. The object is treated as a body in which elastic deformations (in the range of reversible deformations) and viscous and plastic deformations (in the range of irreversible deformations) may occur with non-linear hardening. This body was abbreviated as E/VP. The non-linear Huber–Mises–Hencky (abbreviation: HMH) plasticity condition, associated flow law and mixed reinforcement (isotropic-kinematic) were used to build a material model. The state of the material after the preceding treatments was also taken into account by introducing the initial states: displacements, stresses and strains.
An increment of any function at a typical step t→τ = t+Δt is defined using the formalism differential, in the following form:
where τx is a vector (with components τxi, i = 1, 2, 3) of the position of the body particle X at any time τ. The notation indicates an increment of the function f from time t to time τ (the left superscript) expressed in the system {tx} and related to the configuration at time t (the left subscript).
In the process analyzed of moving the wedge, the measures of increments of displacement, strain, strain rate and stress need to be defined. The movement of the body is described by smooth mapping:
The particle displacement vector and its components , and the increment displacement vector and its components take the following form:
where all the components of vectors are related to a common frame of reference . An adequate measure of the strain state of the workpiece, in the adopted updated Lagrange description, is the Green–Lagrange strain tensor , while the measure of the strain rate state is the Green–Lagrange strain rate tensor .
The tensors listed are defined and related to the current configuration . The measure of strain increment, strain rate and stress increment are the increments of strain tensors and strain rate using Green–Lagrange, respectively. The components of the tensor are related to ui displacements according to the formula in Cauchy notation [48]:
where is the partial derivative . The components can be decomposed into a linear part
and a non-linear part
The increment of the components of the tensor will be derived based on the definition of the increment of any function. Thus, writing the components according to Equation (5) at times τ and t and substituting them into Equation (1), after applying the incremental decomposition ) and performing the appropriate algebraic operations, we obtain the following:
where denotes the partial derivative.
Equation (8) is valid for various incremental descriptions. For a specific description, an appropriate simplification should be used. For the updated Lagrange description adopted here, the expression . The increment of the components can be decomposed into a linear part
and a non-linear part
In a similar manner, the following formulas for the increments of the components of the strain rate increase tensor for the linear part are
as is a non-linear part
The introduction of non-linear terms means that exact formulas will be used, without any linearization.
The stress state and stress increment were described by the second (symmetric) Pioli–Kirchhoff stress tensor and its increment , respectively.
The components of the stress increase tensor for the body E/VP were calculated from the following formula:
where are tensor components and B is a scalar, according to the following formulas:
In Equations (13)–(15) are the components of the increment of the tensor of total strain (elastic, plastic and viscous), is the fourth-order tensor characterizing the elastic properties of the object material, is a cumulative component of the stress deviator at the time t considered, is the instantaneous strain-hardening modulus, is the instantaneous strain rate-hardening modulus, is the instantaneous modulus of translational hardening and is the instantaneous plasticizing stress of the object material, depending on the instantaneous values of the effective deformation and visco-plastic strain rate .
The yield stress model takes the following form:
The constants a, b, c, K, n, n1, in the yield stress model (16) were determined in experimental studies and for 41Cr4 steel are listed in Table 1.

Table 1.
Material parameters used in the simulation.
The increment of the yield stress at a typical step t → τ = t + Δt is defined by the following equation [74]:
where and are the increments of the visco-plastic effective strain and the effective strain rate, respectively, and are calculated from the following formulas:
where the sign “⨷” means the multiplication of tensors, and are increments of deviators of strain and strain rates, respectively.
Partial derivatives and are calculated using a geometric interpretation of the derivative. Then the partial derivative at a given time t is equal to the tangents of the angle of inclination of the tangent to the corresponding hardening curve at time t.
2.1.3. The Equation of the Motion of a Discrete Object on Typical Step Time
An incremental functional of the total energy of the system, which consists of a tool and an object, has been developed. From the condition of the stationarity of this functional, a variational, non-linear equation of motion and deformation of the object was derived for a typical step time. This equation was solved using spatial discretization employing the finite element method, obtaining discrete systems of the equations of motion and the deformation of the object in the process of displacement of the wedge, for a typical finite element and for a typical time step . By writing specific equations of motion for all the finite elements, separated from the tool and the workpiece, after their summation, the equation of motion of a discrete object is obtained, in the updated Lagrangian description, on a typical incremental step, of the following form [74]:
where is the instantaneous mass matrix, represents theinstantaneous damping matrix, , , respectively, indicate the instantaneous stiffness matrix and its increment, , , respectively, indicate the instantaneous column vector of the internal loads of nodes and its increment, , , respectively, represent the instantaneous column vector surface loads and its increment, indicates the column vector of node displacement increments, indicates the node velocity increment column vector and indicates the node acceleration increment column vector.
The Matrix Equation (20) being a system of N differential equations of the second order with constant (incremental step) coefficients and appropriate initial conditions , and boundary values constitutes an incremental formulation of the dynamic equilibrium of the deformed solids in contact, for the case of sliding the wedge on the surface of the rough rollers.
The System of Equation (20) contains N equations with 2N known elements of the vector of internal forces and external forces and elements of the matrix , and . However, it also contains unknown elements, i.e., the components of the vectors: an increment of displacements of nodes , an increment of the velocity of nodes , an increment of node accelerations , an increase of the internal loads of the object and unknown elements of the object stiffness increment matrix . In this equation, there is also a part of the components of the vector of the increase in external loads (in contact areas) that is unknown.
Equation (20) was solved using partial linearization and the method of central differences (explicit), in which the differential approximation of the derivatives of partial displacements is assumed according to the following equations:
then Equation (20) takes the following form
where is the effective mass matrix and the effective load vector.
From Equation (23), the unknown column vector of the displacements of the nodes of the discrete object at the end of the considered time step is calculated.
In the already formulated constitutive relationships (material models) Equations (8) and (11), the Cauchy index notation was used to facilitate mathematical operations. In order to use these relationships for the Object Motion Equation (23) derived and to develop computer applications for a numerical simulation of the wedge displacement process, it is convenient to write them in a matrix form.
Relationship (13) now takes a matrix form. The increment of the stress tensor is calculated from the following formula:
where is the Hook matrix, and are the column vectors of the Green–Lagrange strain increment, is the scalar, A is the matrix and B is the scalar, according to the following formulas:
The increment of the total strain tensor is calculated from the following formula:
where is the inverse of Hook’s matrix, is the column vector of the Green–Lagrange increment of total strain and G is a matrix according to the following formula:
In numerical calculations, the matrix notation of Formula (13) obtained after its discretization by the finite element method is also used:
where and are the instantaneous matrices of the linear and non-linear dependence of the strain increment on the displacement increment of the nodal points , respectively, is the stress matrix of the discrete system, and are, respectively, a matrix and a column vector of the displacements increment of the nodal points of the system on a step time.
In the calculation process, it is necessary to accumulate incremental quantities, while the problem of an accumulation of the components of the vectors of the displacement increase , and the components of the strain increment tensors and the components of the strain rate increment tensors at any time τ is trivial. It consists of adding their respective components derived in the previous steps:
The accumulation of yield stress increments and the increments of stress tensors and their components is not trivial; it requires the use of appropriate algorithms named “Yield stress accumulation” and “Stress accumulation”.
2.2. Experimental Research
2.2.1. Research Position
Experimental tests of the diamond sliding burnishing process were carried out on the stand shown in Figure 3. The NEF 400 CNC machining center with the CNC 3D Fanuc 210 is the control, manufactured by the German GILDEMEISTER Drehmaschinen GmbH from Bielefeld, DMG, was used for the tests. The device is a multifunctional machining center. It ensures a high quality and dimensionality of products.
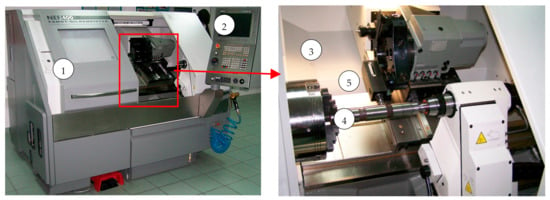
Figure 3.
General view of the NEF 400 CNC machining center: 1—front view, 2—control panel, 3—working space; 4—shaft (sample) made of 41Cr4 steel, 5—tool holder with a diamond burnishing tip.
The machining process was performed with a special tool for sliding burnishing with glued diamond tips, made of a diamond composite with ceramic 512 bonding phase, namely Ti3SiC2 [86], commissioned by the Authors to be performed by the Institute of Advanced Manufacturing Technologies in Krakow (IAMT). The construction of the tool is shown in Figure 4, while Figure 5 shows a general view of the tool and three spherical tips with different values of the radius rd. In proper tests, a burnishing tip with a radius of was used. The required radius rd was calculated from the following formula: , where HV was the microhardness of the workpiece (the hardness of the samples made of 41Cr4 steel was ). During the burnishing process, the rollers were lubricated with Prowadol VG-68 universal lubricating oil.
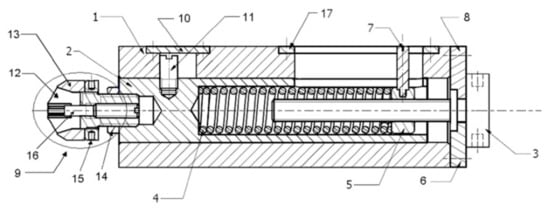
Figure 4.
Technical drawing of the burnishing device: (1) body, (2) guide shaft, (3) adjusting screw, (4) spring, (5) retaining nut, (6) stop plate I, (7) indicator, (8) stop plate II, (9) burnishing head, (10) blanking plate, (11) stop pin, (12) clamping sleeve, (13) clamping sleeve of diamond tip, (14) counter nut, (15) clamping nut, (16) set screw, (17) scale plate.
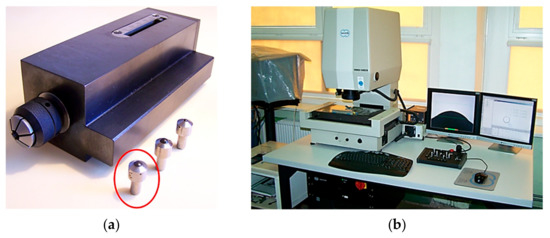
Figure 5.
General view of the tool used in the tests and the diamond tip with a radius of rd = 3.5 mm (a) and the view of the Werth Video-Check-IP 250 measuring machine (b).
The actual radius rd of the diamond burnishing tip was measured on the Werth Video-Check-IP 250 coordinate measuring machine (Figure 5b). The measurements were made at five planes every 60°, obtaining: . Thus, the average rounding radius of the active surface of the diamond tip (with an accuracy of 0.1) is . This value of the radius was assumed in numerical computer simulations.
2.2.2. Test Samples
For the experimental tests of the burnishing process, cylindrical samples (Figure 6) made of rolled bars of 41Cr4 steel in a normalized state were prepared, in accordance with the PN-EN 10002-1+AC1 standard [87]. The chemical composition of the material is shown in Table 2.
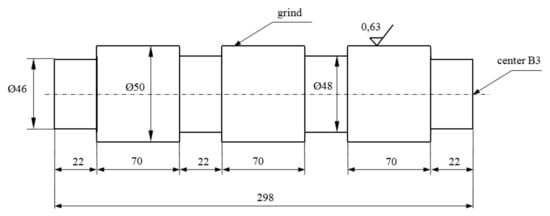
Figure 6.
Technical drawing of roller samples for testing the sliding burnishing process.

Table 2.
Chemical composition of 41Cr4 steel.
Before sliding burnishing, the outer surfaces of the samples were ground with a Korund grinding wheel type 05/0/8 38A80-LVBE 500 × 50 × 203 with a tool speed of 1500 [rev∙min−1] with hydraulic feed. After grinding, each sample had 3 working zones with an average roughness of .
The material parameters of the 41Cr4 steel used in the numerical calculations were determined on the Zwick Roell Z400E in the uniaxial tensile test of one- and three-stage samples (Figure 7 and Figure 8). The tests were carried out at an ambient temperature of 18 °C. The tests were carried out for 5 standardized cylindrical samples and for 5 three-stage cylindrical samples. The strain rate was the default value in accordance with the B standard for conducting static tensile tests. The stress–strain relationship diagram for 41Cr4 steel is shown in Figure 9.
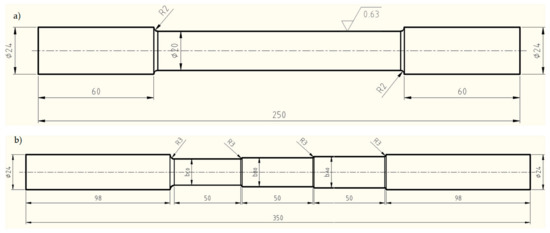
Figure 7.
The shape of a cylindrical sample normalized to tension (a) and the shape of a three-stage cylindrical sample (b) for determining the constants n and K of the hardening curve.

Figure 8.
View of samples for testing the mechanical properties of 41Cr4 steel: (a) one-stage sample, (b) one-stage sample after testing, (c) three-stage sample, (d) three-stage sample after testing.
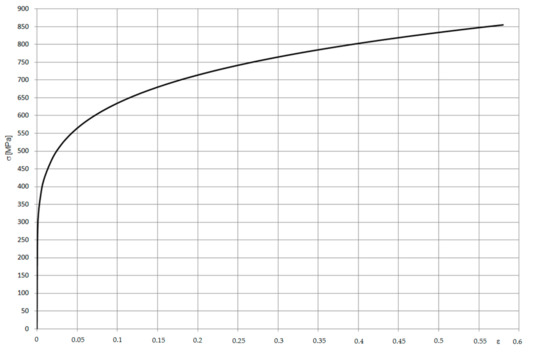
Figure 9.
Material characteristics of 41Cr4 steel after normalizing annealing, prepared on the basis of stretching three-stage samples.
The material constants K and n in the yield stress model (16) were determined using the R. H. Heyer method [88].
In the computer simulations, the elastic/visco-plastic Cowper–Symonds model of plastic stresses was also used. That model does not include any temperature parameters (e.g., the Johnson–Cook model requires temperature parameters) and it is appropriate for calculating the plastic strain rate which occurs during turning or diamond sliding burnishing, which was why it was used in the simulations. This model takes into account mixed isotropic-kinematic or kinematic plastic hardening and the effect of equivalent plastic strain and an equivalent rate of plastic strain, according to the Power Relation [89]:
where:
- -
- B—the hardening parameter, isotropic-kinematic or kinematic plastic hardening,
- -
- —initial, static yield stress [MPa],
- -
- —effective plastic strain rate [s−1],
- -
- C—material parameter determining the influence of the strain rate of plastic deformation [s−1],
- -
- —material constant determining the sensitivity of the material to the plastic strain rate [-],
- -
- —effective plastic strain [-],
- -
- —material parameter dependent on the modulus of plastic hardening, where is the strain-hardening modulus and E is the Young’s modulus of elasticity.
The material parameters in the Plastic Stress Models (16) and (35) were determined on the basis of the results of experimental tests, and it was proven that they have a significant impact on the accuracy of the simulation; these are summarized in Table 1.
—failure strain. The verification of the material parameters determined was carried out by means of a numerical analysis of the tensile strength of a standardized cylindrical sample and a comparison of the sample geometry obtained numerically with those measured experimentally. For this purpose, an original application known as “Stretching a cylindrical sample” in the APDL language in the ANSYS/LS-Dyna program was developed. As input data for the simulation, the material parameters previously determined from the experiment for the power model were introduced. Figure 10 shows selected stages of a numerical analysis of the sample stretching process. Figure 10a already shows the stage of the formation of the so-called “necks”. It is the next stage after the stage of elastic deformation. The material flowed and the neck formed. This is followed by plastic hardening of the material. During the narrowing of the so-called “neck” there is a stress concentration in this area. The strengthening capacity of the material is no longer high enough to overcome the loss in the width and thickness of the material. After exceeding the permissible deformations, the sample breaks in its smallest cross-section (Figure 10b). The greatest stresses occur under the surface of the sample at the fracture site. It is in this area that cracking occurs first, and then it moves outward from the sample.
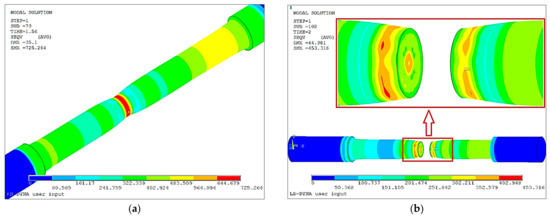
Figure 10.
View of the resulting neck during the simulation of the tensile process of the cylindrical sample just before fracture and the visible stress concentration in the smallest section of the sample (a), and the stage of breaking the cylindrical sample during tensile testing (b).
A numerical measurement of the sample geometry after fracture was also carried out. For this purpose, a grid with a pitch of 1 mm was applied. The diameter of the sample in the neck measured in the experiment was , while the numerically calculated one was . Statistical tests of the significance of dimension differences showed that they are insignificant at the significance level of α = 0.05. This proves the correctness of the models, algorithms and numerical application developed.
2.2.3. Experiment Plan and Methodology of Statistical Elaboration of Research Results
Experimental tests were carried out in accordance with the five-level rotatable experiment plan. The experimental plan along with the actual and coded values of the parameters are listed in Table 3.

Table 3.
The five-level rotatable experiment plan.
Ranges of the variability of technological parameters in the sliding burnishing process were determined. The assumed area of research in the considered case is as follows:
- (1)
- feed: f = 0.04 ÷ 0.1 [mm∙rev−1],
- (2)
- force: F = 5 ÷ 25 [N].
Three-fold repeatability of the tests was used. This task required the following steps to be conducted [90]:
- Determination of the variability range of the parameters studied,
- Choice of the class of the mathematical model,
- Coding the parameters analyzed,
- Collection of the experiment results,
- Elimination of results with gross mistakes,
- Calculation of inter-row variance and standard deviation,
- Checking the homogeneity of variance,
- Calculating the coefficients of regression function,
- Statistical analysis of the regression function,
- Examination of the significance level of the correlation coefficient,
- Checking the adequacy of the mathematical model,
- Decoding the regression function.
The average values of the outputs of the object were approximated with a polynomial of the second degree with double interaction, obtaining the regression equation as two-parameter functions:
where
—unknown coefficients of the Regression Equation,
—input variables: [mm·s−1] and [N].
Using matrix calculus, the column vector {b} of the unknown coefficients in Equation (36) was calculated from the following matrix formula:
where:
- -
- —input variable matrix of dimension N×L, for data N = 13 and L = 6,
- -
- —transposed matrix ,
- -
- —covariance matrix,
- -
- —column vector of the average values of the experimental results.
The boundaries of the confidence region for Regression Function (36) were determined from the following formula:
where:
—regression equation according to Equation (36),
—critical value of Student t test for significance level α = 0.05 and the number of the degrees of freedom f = N − L,
N—number of measurement points in the experimental design: N = 13,
L—number of unknown coefficients in Regression Equation (36); here, L = 6,
and —column vector of the functions of input variables (test factors in real form) and its transposition: ,
—residual variance,
—average values of model outputs for plan points calculated from Equation (36),
—average values of experimental results.
The test results after statistical processing according to the algorithm presented in the study [90] were used to develop Regression Equations (38) and (41).
3. Results
3.1. Results of Numerical Analyses
The results of the displacement of a non-deformable wedge (E → ∞) on an elastic/visco-plastic substrate, which has the material characteristics of 41Cr4 steel after normalization annealing, are presented. For this steel, a Cowper–Symonds non-linear material was selected, according to Equation (35), obtaining a model dependent on the equivalent plastic strain and the equivalent rate of plastic strain according to the power law.
The value of the static friction coefficient was , and the dynamic coefficient . Wedge rounding radius , wedge internal angle β = 60 [°], wedge depth and , wedge travel distance , simulation time t= 0.0002 [s]. The displacement speed of the wedge is . The facility was divided into 60.000 PLANE162 finite elements, which were compacted in the contact zone. This number is based on multiple sensitivity analyses for different workpiece materials. For 41Cr4 steel and given values of and s, this number is the optimal value. The shape factor was assumed, resulting from the Authors’ own simulation studies and those performed by other researchers [65,68,79]. The Cowper–Symonds model contains a critical strain value above which the element is removed (the so-called element removal method). The value of this parameter was determined and it equals ɛf = 1.7.
The wedge in the contact area was discretized using 18.000 finite elements. A regular hexagonal grid with regular fields was used in the simulations. In the material machined, the mesh was refined in the contact zone and in the surface layer (the element’s size being 0.1 × 0.1 μm). The influence of the inclination of the wedge relative to the ground on the type of machining (micro-cutting or sliding burnishing) as well as on the occurring strains and stresses was examined. The range of the rake angle was with a step of 5 [°]. Selected steps from the simulation are shown in the screenshots. Some drawings have a 5 × 5 [μm] grid in order to better illustrate the size of the flash or chip created. The scale in the drawings shows the values of Huber–Mises–Hencky (HMH) stresses and is expressed in [Pa] or HMH strains expressed in a dimensionless number [-]. For each wedge inclination angle, an exemplary displacement of the node along the Y axis located just below the layer processed, located exactly 1 [mm] from the beginning of the sample, is also provided.
Sixteen numerical simulations were performed for wedge depressions and , for different rake angles γ. In each simulation, the displacement along the Y axis of the same node, the number and location of which is shown in Figure 11, was analyzed.
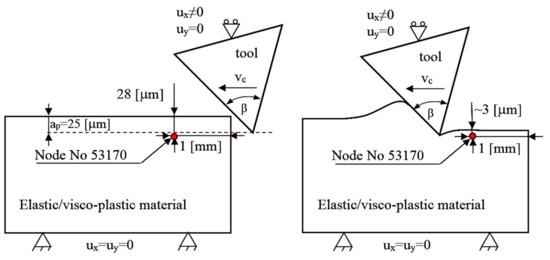
Figure 11.
Diagram showing the location of the analyzed node No. 53170 (red point) before and after machining for .
A summary of the simulation results is shown in Figure 12. From the graph, one may read the limit rake angles of the wedge for a given recess at which the sliding burnishing process takes place. For depth and rake angles , and , the surface is smoothed, while rake angles are greater for micro-cutting. The influence of cutting conditions on the form of the chip created is also visible.
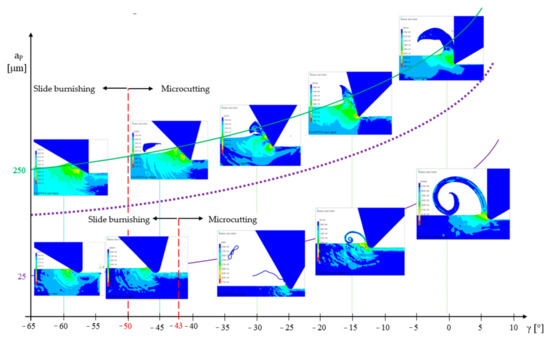
Figure 12.
Graph of the influence of the depth and rake angles on the type of treatment.
For example, the case for and is described in detail. Figure 13 shows stress and strain maps for . For this wedge rake angle, we observe the phenomenon of flash formation but without chip formation. This process may be compared to smooth burnishing. The maximum values of HMH stresses at the selected time step prevail in the contact area of the wedge with the workpiece and are (Figure 13a). The largest deformations were at the point of contact of the rake face of the wedge with the workpiece, and they amounted to [-] (Figure 13b).
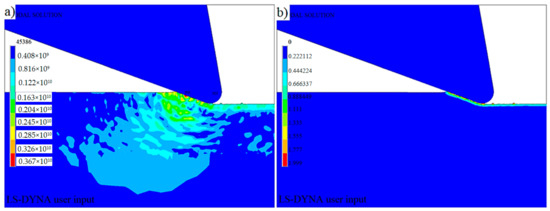
Figure 13.
HMH stress (a) and HMH (b) strain maps for .
From the mesh applied (Figure 14a) it can be read that the height of the flash created was ca. 5 [μm]. The resulting burr due to the large rake angle had a size of approx. 20 [μm]. For this configuration of the wedge, the stresses propagate into the material. Figure 14b shows a diagram of the displacement of the node lying under the contact surface at a distance of 5 μm along the Y axis. It shows that in the initial phase of the process, up to ca. 8 [ms], the node was slowly displaced due to the approach of the tool. At 10 [ms], the tool was located exactly above the selected node, hence its rapid displacement to the value of −2.5 μm. After the tool had passed through, the elastic return of the material node to the value of −1.0 μm took place. Compared to the initial value, this result shows a WW reduction of 1.5 μm.
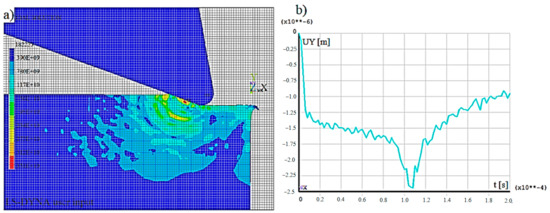
Figure 14.
A 5 × 5 [μm] mesh (a) and a diagram of the displacement of the node along the Y axis (b).
The exemplary results presented of numerical analyses allow, for a given tool geometry and the required burnishing depth, to determine the boundary rake angles for which the process of smoothing surface irregularities (burnishing) takes place.
3.2. Results of Experimental Studies
After the diamond sliding burnishing process, surface roughness parameters were measured: the root mean square height Sq [μm]; skewness Ssk [-]; kurtosis Sku [-]; the maximum peak heigh of the surface Sp [μm]; the maximum pit height of the surface Sv [μm]; the maximum heigh of the surface Sz [μm]; the arithmetical mean height of the surface Sa [μm]. Other factors measured were the height parameters of the roughness profile: the average maximum profile height of the ten largest peak-to-valley separations in the evaluation area Rz [μm], the arithmetical mean deviation of the profile Ra assessed [μm] and the total height of the profile Rt [μm] (Table 4). The measurements were carried out in the Laboratory of micro- and nanoengineering located in the Department of Precision Mechanics, the Koszalin University of Technology, using a Taylor Hobson Precision device with the TalySurf CCI6000 system. A Nikon lens with a magnification of 50× was used. The results were processed in the TalyMap Platinum program. Examples of the surface roughness results according to the Ra parameter after the sliding burnishing process are listed in Table 5. The view of the surface of the sample after grinding and after diamond sliding burnishing is shown in Figure 15.

Table 4.
Average values of surface and profile roughness parameters.

Table 5.
Results of measurements of the Ra [μm] parameter of profile roughness.
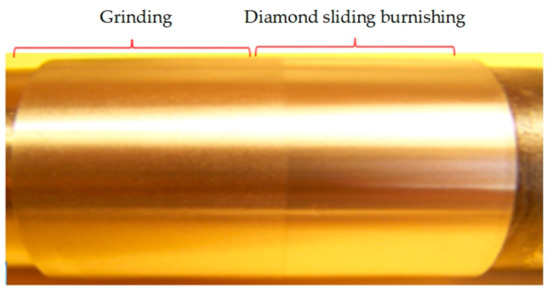
Figure 15.
The view of the surface of the sample after grinding and after DSB.
Exemplary results of the study of the stereometry of the surface machined, which had the lowest value of the Ra parameter, are presented in Figure 16. All the surfaces analyzed have a degressive-progressive material share curve. The traces of diamond sliding burnishing are clearly visible in the autocorrelation function. The distribution of ordinates is close to normal with slight positive skewness. The distribution of the tops of the local hills is close to normal, consisting of two overlapping independent processes, as evidenced by the presence of two peaks.
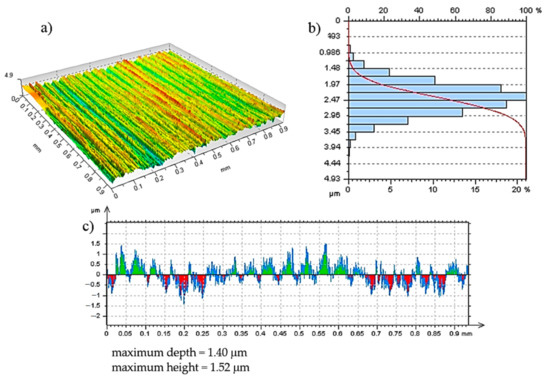
Figure 16.
Geometric Surface Structure for and : (a) 3D surface topography, (b) Abbot load curve, (c) roughness profile (colours means: above zero – green, below zero – red).
The results of the research, after statistical elaboration, allowed the Authors to obtain the required mathematical model of the process. For example, the model describing the dependence of the arithmetic mean deviation of the profile from the mean line Ra of the surface after the process on technological parameters describes the equation for the coded variables and :
where .
After decoding Equation (39) according to the code formulas:
the equation for the real values of the technological parameters f and F is obtained, along with the 95% confidence area of the following form:
where , giving and according to formulas (40) and (41).
The graphs presented in Figure 17 show that the surface roughness Ra after burnishing treatment is affected by both the feed rate f and the burnishing force F. Figure 17b shows the special effect of the feed rate on the quality of the surface obtained. For small feed values, the surface obtained was characterized by the lowest value of the Ra coefficient. As the feed rate increased, the roughness also increased. Increasing the clamping force of the diamond burnishing tool in the case of 41Cr4 steel had a negative effect on the surface quality. In general, an increase in the clamping force resulted in an increase in the roughness coefficient Ra. Its lowest value was recorded for the lowest burnishing force.
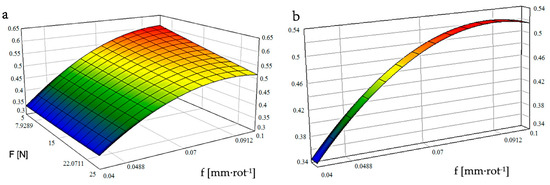
Figure 17.
Influence of force F and feed f on surface roughness Ra after diamond sliding burnishing (a); effect of feed on surface roughness Ra for F = 8 [N] (b).
Experimental research shows that the diamond sliding burnishing process is a very complex process. The technological quality of the product depends on many parameters related both to the condition of the semi-finished product and the conditions of the burnishing process. An incorrect selection of these leads to obtaining a product with defects, e.g., visible grooves in the material due to an incorrectly selected value of the burnishing force, etc. The most important parameters determining the quality of the surface, characterized by the Ra parameter include the tool geometry, the feed rate and the burnishing force. The oil mist lubrication used is also an important factor.
The regression equations developed can be used to determine the burnishing process conditions in terms of the required product quality, or vice versa, for given burnishing conditions, the quality of the surface machined can be predicted. Determining the optimal conditions for the process implementation requires solving the problem of a multi-criteria optimization with constraints. Solving the optimization task will allow one to obtain a product of the required quality at minimum production costs.
3.3. Validation of Models and Numerical Algorithms
The results of experimental research were also used to verify the developed models and algorithms of numerical calculations. For example, in Figure 18, Figure 19 and Figure 20, the results of numerical analyses on the surface roughness profile were compared with the results of experimental measurements.
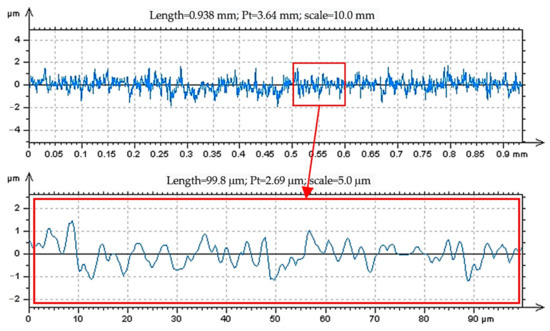
Figure 18.
Surface roughness profile after diamond sliding burnishing on the NEF400 station for and .
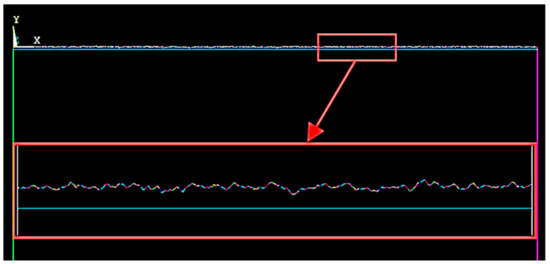
Figure 19.
Surface roughness profile after diamond sliding burnishing obtained in the ANSYS program for and .
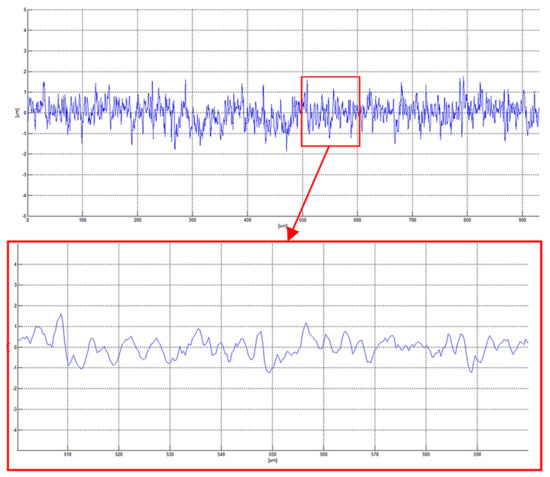
Figure 20.
Surface roughness profile after diamond sliding burnishing obtained in the ANSYS program for and .
In order to better compare the surface roughness from the experimental tests with the simulation tests, the points from the simulation in the ANSYS program were read and implemented in the Matlab program. The roughness profile generated from the ANSYS program is shown in Figure 19 and Figure 20. The comparison of the results of numerical analyses with the results of measurements shows that the differences at the adopted significance level of α = 0.05 are not significant. Therefore, both the process model and computer applications in the ANSYS/LS-Dyna system are developed correctly.
The comparison of the results of numerical analyses with the results of measurements shows that the differences at the adopted significance level of α = 0.05 are not significant. Therefore, it can be concluded that it is possible to predict the quality of diamond sliding burnished products with an accuracy sufficient for engineering practice on the basis of computer simulation results. The results of experimental research showed the usefulness of the developed mathematical models and algorithms for numerical calculations of the burnishing process. Numerical algorithms implemented in the ANSYS system can be used to assess the impact of burnishing technological conditions on product quality. They allow for a better understanding of the phenomena occurring in the contact and deformation zones and, therefore, they may constitute the basis for developing guidelines for the selection of burnishing conditions, due to the required technological quality of the product.
4. Summary and Conclusions from Numerical Analyses
- (1)
- The workpiece in the process of moving the wedge is subjected to a complex deformation process, characterized by large displacements and large deformations. Rendering complex changes in the outline of an object requires a sufficiently fine mesh of finite elements. The use of a very fine mesh of finite elements for the entire workpiece and throughout the process leads to a numerical model with a very large number of unknowns, requiring long calculation times. The developed effective discrete models and numerical algorithms allow for automatic mesh refinement only in areas with high curvature and large deformation gradients. In the numerical examples presented in this article, discretization with 4-node PLANE 162 elements was used. The finite elements used to discretize the object well modeled the complex deformation state, and at the same time, they are characterized by high computational efficiency.
- (2)
- The shape factor of the finite element (SF) significantly affects both the accuracy of mapping the outline of the tool and the value of stresses and strains as well as the course of cracking. The most favorable results of the stresses and strains calculated are obtained for . Further increase of SF (up to nine times) has no significant impact on the accuracy of the stresses and strains calculated, defined as the difference of their values in elements and nodes.
- (3)
- The results of the computer simulation of the wedge displacement process on the effective model and real material confirmed the results of the experimental research. This proves the correctness of the developed mathematical model and the method of integrating the discrete equation of motion.
- (4)
- The results of numerical calculations confirm the possibility of a correct analysis of the burnishing or micro-cutting processes and the determination of the states of displacements, strains and stresses, using the discrete effective models developed.
- (5)
- The application developed in the ANSYS system enables a time analysis of deformation and stress states at any point of the material.
- (6)
- For example, Figure 14b shows the displacement of selected nodes in the contact area in the direction of the Y axis. It is possible to determine the separation point of the material moving with the chip or remaining in the surface layer of the product.
- (7)
- The basic problem in the design of the wedge displacement process is the development of appropriate tool constructions and the selection of process conditions in order to ensure the technical requirements and properties of the product obtained, while increasing tool life and process efficiency. The results of computer simulations may form the basis for the selection of technological parameters in the machining or burnishing process, and they can be used to develop a new technology with the necessary technological equipment.
- (8)
- As a result of the analyses carried out, it was found that the angle of inclination of the shear plane is not the same for each rake angle γ and it varies in the range of , which is consistent with the values given in the professional literature. The values of maximum stresses, for almost every simulation, prevailed in the contact area of the wedge tip with the base material, as well as in the contact areas of the wedge rake surface with the surface of the forming chip, and in the area of the shear plane.
- (9)
- For given machining conditions and tool depth there is a limited rake angle below which the burnishing process takes place (no chip) and above it, the micro-cutting process (chip formation) occurs. For example, Figure 12 shows two cases of wedge displacement, for which the limit rake angle was, respectively, the depth of for the depth of and for the depth of .
Author Contributions
The individual contributions of the authors: conceptualization, J.C. and L.K.; methodology, J.C., L.K. A.M.R. and M.K.; investigation, J.C., G.C., A.M.R. and M.K.; software, J.C., L.K., M.K. and T.T.; data curation, J.C.; validation, J.C., L.K., Ł.B. and R.P.; writing—original draft preparation, J.C., L.K. and M.K.; writing—review and editing, J.C., G.C. and T.T; visualization, J.C. and Ł.B.; supervision, L.K., M.K. and T.T.; All authors have read and agreed to the published version of the manuscript.
Funding
This research received no external funding.
Institutional Review Board Statement
Not applicable.
Informed Consent Statement
Not applicable.
Data Availability Statement
The data presented in this study are available on request from the corresponding author.
Conflicts of Interest
The authors declare no conflict of interest.
References
- Gryglicki, R.; Kukiełka, L. The use of numerical simulation for predicting the surface roughness of an object burnished by sliding diamond. In Contemporary Problems in Burnishing Processing Technology; TON’2008: Gdansk, Poland, 2008. [Google Scholar]
- Przybylski, W. Burnishing Technology; WNT: Warsaw, Poland, 1987. [Google Scholar]
- Torbilo, V.M. Almaznoe Vyglażivanie; Masinostrojenie: Moscow, Russia, 1974. [Google Scholar]
- Biezuchov, N.I. Theory of Elasticity and Plasticity; PWN: Warsaw, Poland, 1957. [Google Scholar]
- Jezierski, J.; Mazur, T.; Siemiątkowski, Z.; Kowalik, M. Calculations of the Thickness of the Surface Layer Plastically Deformed after Burnishing with Ceramic Tools. In Contemporary Problems in Burnishing Processing Technology; Publishing House of the Gdansk University of Technology: Gdansk, Poland, 2005. [Google Scholar]
- Bouzid, W.; Tsoumarev, O.; Sai, K. An investigation of surface roughness of burnished AlSi 1042 steel. Int. J. Adv. Manuf. Technol. 2004, 24, 120–125. [Google Scholar]
- Korzyński, M. Optimalnyje Znaćenia Natjagu Pri Almaznomu Vyglaźivani Sfericeskim Nakonećnikom; Visnik Lvivskogo Politechnićeskogo Instituta nr 225; Lvivski Politechnićeski Institut: Lviv, Ukraine, 1991. [Google Scholar]
- Kudriavcev, I.V. Povysenie Dolgovecnosti Detalej Masin Metodom Poverhnostnogo Naklepa; Maśgiz: Moscow, Russia, 1965. [Google Scholar]
- Mamalis, A.G.; Grabchenko, A.I.; Horvath, M.; Meszaros, I.; Paulmier, D. Ultraprecision metal removal processing of mirror-surfaces. J. Mater. Process. Technol. 2001, 108, 269–277. [Google Scholar] [CrossRef]
- Odincov, L.T. Finisnaja Obrabotka Detalej Vyglazyvaniem i Almaznym Vyglazyvaniem; Masinostrojenie: Moscow, Russia, 1981. [Google Scholar]
- Kragielski, I.V. Trenie i Iznos; Maśinostrojenie: Moscow, Russia, 1968. [Google Scholar]
- Hassan, A.M.; Al-Jalil, H.F.; Ebied, A.A. Burnishing force and number of ball passes for the optimum surface finish of brass components. J. Mater. Process. Technol. 1998, 83, 176–179. [Google Scholar] [CrossRef]
- Tubielewicz, K.; Zaborski, A. Optimization of the Operational Parameters of the Surface Layer after Burnishing. In Modern Problems in Burnishing Treatment Technology; Przybylski, W., Ed.; Publishing House of the Gdansk University of Technology: Gdansk, Poland, 2005. [Google Scholar]
- Hassan, A.M.; Maqableh, A.M. The effects of initial burnishing parameters on non-ferrous components. J. Mater. Process. Technol. 2000, 102, 115–121. [Google Scholar] [CrossRef]
- Patyk, R.; Kukielka, L.; Kukielka, K.; Kulakowska, A.; Malag, L.; Bohdal, L. Numerical Study of the Influence of Surface Regular Asperities Prepared in Previous Treatment by Embossing Process on the Object Surface Layer State after Burnishing. In Applied Mechanics and Materials; Trans Tech Publications Ltd.: Wollerau, Switzerland, 2014; Volume 474, pp. 448–453. [Google Scholar] [CrossRef]
- Kukielka, L.; Geleta, K.; Kukielka, K. Modelling of initial and boundary problems with geometrical and physical nonlinearity and its application in burnishing processes. Steel Res. Int. 2012, 83, 1375–1378. [Google Scholar]
- Patyk, R.; Kukielka, L.; Kaldunski, P.; Bohdal, L.; Chodor, J.; Kulakowska, A.; Kukielka, K.; Nagnajewicz, S. Experimental and Numerical Researches of Duplex Burnishing Process in Aspect of Achieved Productive Quality of the Product. In AIP Conference Proceedings; AIP Publishing LLC: Palermo, Italy, 2018; Volume 1960. [Google Scholar] [CrossRef]
- Patyk, S.; Patyk, R.; Kukielka, L.; Kaldunski, P.; Chojnacki, J. Numerical method for determining the main force of burnishing rolling of rough cylindrical surface with regular periodical outlines asperities. Eng. Mech. 2017, 754–757. [Google Scholar]
- Luca, L.; Neagu-Ventzel, S.; Marinescu, I. Effects of working parameters on surface finish in ball-burnishing of hardened steel. Precis. Eng. 2005, 29, 2005. [Google Scholar] [CrossRef]
- Shiou, F.J.; Chen, C.H. Determination of optimal ball-burnishing parameters for plastic injection moulding steel. Int. J. Adv. Manuf. Technol. 2003, 21, 177–185. [Google Scholar]
- Zhang, P.; Lindermann, J. Effect of Toller burnishing on the high cycle fatique performance of the high-strength wrought magnesium alloy AZ80. Scr. Mater. 2005, 52, 1011–1015. [Google Scholar] [CrossRef]
- Szulc, S.; Stefko, A. Surface Treatment of Machine Parts; WNT: Warsaw, Poland, 1976. [Google Scholar]
- Prevey, P.S.; Cammett, J.T. The influence of surface enhancement by low plasticity burnishing on the corrosion fatique performance of AA7075-T6. Int. J. Fatique 2004, 26, 975–982. [Google Scholar] [CrossRef]
- Tubielewicz, K.; Zaborski, A. Modeling and Experimental Analysis of the Deformation Process during Burnishing and Wear. In Proceedings of the 7th Scientific and Technical Conference “Burnishing Processing Technology”, Bydgoszcz, Poland; 2000. [Google Scholar]
- Korzynski, M. Modeling and experimental validation of the force–surface roughness relation for smoothing burnishing with a spherical tool. Int. J. Mach. Tools Manuf. 2007, 47, 1956–1964. [Google Scholar] [CrossRef]
- Sheng-Kuei, L.; Yung-Li, L.; Ming-Wei, L. Evaluation of the staircase and the accelerated test methods for fatigue limit distributions. Int. J. Fatigue 2001, 23, 75–83. [Google Scholar]
- Korzynski, M.; Pacana, A.; Cwanek, J. Fatigue strength of chromium coated elements and possibility of its improvement with slide diamond burnishing. Surf. Coat. Technol. 2009, 203, 1670–1676. [Google Scholar] [CrossRef]
- Carvalho, A.L.M.; Voorwald, H.J.C. Influence of shot peening and hard chromium electroplating on the fatigue strength of 7050-T7451 aluminum alloy. Int. J. Fatigue 2007, 29, 1282–1291. [Google Scholar] [CrossRef]
- Benedetti, M.; Fontanari, V.; Höhn, B.R.; Tobie, T. Influence of shot peening on bending tooth fatigue limit of case hardened gears. Int. J. Fatigue 2002, 24, 1127–1236. [Google Scholar] [CrossRef]
- Maximov, J.T.; Duncheva, G.V.; Anchev, A.P.; Dunchev, V.P.; Ichkova, M.D. Improvement in fatigue strength of 41Cr4 steel through slide diamond burnishing. J. Bras. Soc. Mech. Sci. Eng. 2020, 42, 197. [Google Scholar] [CrossRef]
- Skalski, K.; Jezierski, J. Analysis of the Depth of Plastic Deformation in Surface Treatment with Burnishing. In Proceedings of the 3rd Scientific and Technical Conference “Burnishing Processing Technology”, Bydgoszcz, Poland; 1984. [Google Scholar]
- Korzyński, M.; Zarski, T. Slide diamond burnishing influence on of surface stereometric structure of an AZ91 alloy. Surf. Coat. Technol. 2016, 307, 590–595. [Google Scholar] [CrossRef]
- Lopez de Lacalle, L.N.; Lamikiz, A.; Munoa, J.; Sanchez, J.A. Quality improvement of ball-end milled sculptured surfaces by ball burnishing. Int. J. Mach. Tools Manuf. 2005, 45, 1659–1668. [Google Scholar] [CrossRef]
- Tubielewicz, K.; Major, B.; Zaborski, A. The Structure of the Surface Layer After Burnishing. In Proceedings of the 7th Scientific and Technical Conference “Burnishing Processing Technology”, Bydgoszcz, Poland; 2000. [Google Scholar]
- Zdrodowski, S. A Summary of the Runout Test Results of the Measurement Paths on the Old and New Borsig Compressor Rotor Shaft; Report on Work for Przedsiębiorstwo Remontowe Maszyn i Armature Masz-ZAP; Przedsiębiorstwo Remontowe Maszyn i Armature Masz-ZAP: Puławy, Poland, 2002. [Google Scholar]
- Shiou, F.J.; Chuang, C.H. Precision surface finish of the mold steel PDS5 using an innovative ball burnishing tool embedded with a load cell. Precis. Eng. 2010, 34, 76–84. [Google Scholar] [CrossRef]
- Patyk, S.; Patyk, R.; Kukiełka, L. Study of the Main Force of Rolling Burnishing of a Rough Surface. In Contemporary Problems in Burnishing Processing Technology; TON’2008: Gdansk, Poland, 2008. [Google Scholar]
- Patyk, S.; Patyk, R.; Kukiełka, L. Analysis of forces in the burnishing process of rough surfaces. In Contemporary Problems in Burnishing Processing Technology; TON’2008: Gdansk, Poland, 2008. [Google Scholar]
- Świrad, S.; Dudek, K. Burnishing as a decorative treatment. In Contemporary Problems in Burnishing Processing Technology; TON’2008: Gdansk, Poland, 2008. [Google Scholar]
- Sznejder, U.G. Obrazowanie Regularnych Mikrorelefov na Detalach i Ich Eksplatacjonnyje Svojstva; Maszinostrojenie: Leningrad, Russia, 1972. [Google Scholar]
- Tian, Y.; Shin, Y.C. Laser-assisted burnishing of metals. Int. J. Mach. Tools Manuf. 2007, 47, 14–22. [Google Scholar] [CrossRef]
- Korzynski, M.; Lubas, J.; Swirad, S.; Dudek, K. Surface layer characteristics due to slide diamond burnishing with a cylindrical-ended tool. J. Mater. Process. Technol. 2011, 211, 84–94. [Google Scholar] [CrossRef]
- Nestler, A.; Schubert, A. Effect of machining parameters on surface properties in slide diamond burnishing of aluminum matrix composites. Mater. Today Proc. 2015, 2, 156–161. [Google Scholar] [CrossRef]
- Bouzid Sai, W.; Lebrun, J.L. Inflence of finishing by burnishing on surface characteristics. J. Mater. Eng. Perform. 2003, 12, 37–40. [Google Scholar]
- Sachin, B.; Rao, C.M.; Naik, G.M.; Puneet, N.P. Infuence of slide burnishing process on the surface characteristics of precipitation hardenable steel. SN Appl. Sci. 2021, 3, 223. [Google Scholar] [CrossRef]
- Orkisz, J. Finite difference method. In Handbook of Computational Solid Mechanics. Survey and Comparison of Contemporary Methods; Kleiber, M., Ed.; Springer: Berlin/Heidelberg, Germany, 1998. [Google Scholar]
- Burczyński, T. Boundary Element Method in Mechanics; WNT: Warsaw, Poland, 1995. [Google Scholar]
- Kleiber, M. Introduction to the Finite Element Method; PWN: Warsaw-Poznan, Poland, 1989. [Google Scholar]
- Kleiber, M. Finite Element Method in Non-Linear Continuum Mechanics; PWN: Warsaw-Poznan, Poland, 1985. [Google Scholar]
- Zienkiewicz, O.C.; Taylor, R.L. The Finite Element Method. Volume 1—The Basis; Butterworth—Heinemann: Oxford, UK, 2000. [Google Scholar]
- Zienkiewicz, O.C.; Taylor, R.L. The Finite Element Method. Volume 2—Solid Mechanics; Butterworth—Heinemann: Oxford, UK, 2000. [Google Scholar]
- Zienkiewicz, O.C.; Taylor, R.L. The Finite Element Method. Volume 3—Fluid Dynamics; Butterworth—Heinemann: Oxford, UK, 2000. [Google Scholar]
- Belytschko, T.; Liu, W.K.; Moran, B. Nonlinear Finite Elements for Continua and Structures; John Wiley & Sons: New York, NY, USA, 2000. [Google Scholar]
- Liu, G.R.; Liu, M.B. Smoothed Particle Hydrodynamics. In A Meshfree Particle Method; World Scientific: Singapore, 2003. [Google Scholar]
- Jach, K. Computer Modeling of Dynamic Interactions of Bodies Using the Free Point Method; PWN: Warsaw, Poland, 2001. [Google Scholar]
- Więckowski, Z. A particle-in-cell solution to the silo discharging problem. Int. J. Numer. Methods Eng. 1999, 45, 1203–1225. [Google Scholar] [CrossRef]
- Więckowski, Z. The material point method in large strain engineering problems. Comput. Methods Appl. Mech. Eng. 2004, 193, 4417–4438. [Google Scholar] [CrossRef]
- Orkisz, J. Recent advances in meshless finite difference methods. In Proceedings of the CMM-2005—Computer Methods in Mechanics, Częstochowa, Poland, 21–24 June 2005. [Google Scholar]
- FLAC. Fast Lagrangian Analysis of Continua; Itasca: Minneapolis Minnesota, MN, USA, 1995. [Google Scholar]
- Bathe, K.J. Finite Element Procedures in Engineering Analisis; Prentice—Hall: Englewood Cliffs, NJ, USA, 1982. [Google Scholar]
- Burakowski, T.; Wierzchoń, T. Metal Surface Engineering; WNT: Warsaw, Poland, 1995. [Google Scholar]
- Oñate, E.; Idelsohn, S.; Zienkiewicz, O.C.; Taylor, R.L. A finite point method in computational mechanics. Applications to convective transport and fluid flow. Int. J. Numer. Methods Eng. 1996, 39, 3839–3866. [Google Scholar] [CrossRef]
- Belytschko, T.; Lu, Y.Y.; Gu, L. Element-free Galerkin method. Int. J. Numer. Methods Eng. 1994, 37, 229–256. [Google Scholar] [CrossRef]
- Dolag, K.; Bartelmann, M.; Lesch, H. SPH simulations of magnetic fields in galaxy clusters. Astron. Astrophys. 1999, 348, 351–363. [Google Scholar]
- Chodor, J.; Kukielka, L. Using nonlinear contact mechanics in process of tool edge movement on deformable body to analysis of cutting and sliding burnishing processes. In Applied Mechanics and Materials; Trans Tech Publications Ltd.: Baech, Switzerland, 2014. [Google Scholar] [CrossRef]
- Chodor, J.; Zurawski, L. Investigations on the chip shape and its upsetting and coverage ratios in partial symmetric face milling process of aluminium alloy AW-7075 and the simulation of the process with the use of FEM. In Advances in Mechanics: Theoretical, Computational and Interdisciplinary Issues; CRC Press: Boca Raton, FL, USA, 2016; pp. 121–124. [Google Scholar]
- Myśliński, P.; Precht, W.; Kukiełka, L.; Kamasa, P.; Pietruszka, K.; Małek, P. A possibility of application of mtdil to the residual stresses analysis the hard coating—Substrate system. J. Therm. Anal. Calorim. 2004, 77, 253–258. [Google Scholar] [CrossRef]
- Bohdal, L.; Kukiełka, L. Application of variational and FEM methods to the modelling and numerical analysis of the slitting process for geometrical and physical nonlinearity. J. Theor. Appl. Mech. 2015, 53, 487–500. [Google Scholar] [CrossRef]
- Bohdal, L.; Kukielka, L. Application of variational and FEM methods to the modelling and numerical analysis of guillotining process for geometrical and physical nonlinearity. Mechanics 2014, 20, 197–204. [Google Scholar] [CrossRef]
- Bohdal, L.; Kukielka, L.; Świłło, S.; Radchenko, A.M.; Kułakowska, A. Modelling and experimental analysis of shear-slitting process of light metal alloys using FEM, SPH and vision-based methods. In AIP Conference Proceedings; AIP Publishing LLC: Palermo, Italy, 2019; Volume 2078, p. 020060. [Google Scholar] [CrossRef]
- Bohdal, Ł.; Kułakowska, A.; Patyk, R. Analysis of Slitting of Aluminum Body Panels in the Aspect of Scrap Reduction. Annu. Set Environ. Prot. 2014, 16, 105–114. [Google Scholar]
- Bohdal, L.; Kukielka, L.; Kukielka, K.; Kulakowska, A.; Malag, L.; Patyk, R. Three Dimensional Finite Element Simulation of Sheet Metal Blanking Process. Appl. Mech. Mat. 2014, 474, 430–435. [Google Scholar] [CrossRef]
- Kukielka, K.; Kukielka, L.; Bohdal, L.; Kulakowska, A.; Malag, L.; Patyk, R. 3D numerical analysis the state of elastic/visco-plastic strain in the external round thread rolled on cold. In Applied Mechanics and Materials; Trans Tech Publications Ltd.: Baech, Switzerland, 2014. [Google Scholar] [CrossRef]
- Kukiełka, L. Mathematical modelling and numerical simulation of non-linear deformation of the asperity in the burnishing cold rolling operation. In Computational and Experimental Methods; WITPRESS: Southampton, UK, 2001. [Google Scholar]
- Kukiełka, L. New damping models of metallic materials and its application in non-linear dynamical cold processes of metal forming. In Steel Research International, Proceedings of the 13th International Conference Metal Forming 2010; Toyohashi, Japan, 19–22 September 2010, Verlag Stahleisen GmbH: Düsseldorf, Germany, 2010; Volume 81, pp. 1482–1485. ISBN 978-3-514-00774-1. [Google Scholar]
- Kukiełka, L.; Geleta, K.; Kukiełka, K. Modelling and analysis of nonlinear physical phenomena in the burnishing rolling operation with electrical current. In Steel Research International; Wiley-VCH Verlag GmbH & Co. KGaA: Weinheim, Germany, 2012; pp. 1379–1382. [Google Scholar]
- Kowalik, M.; Trzepiecinski, T. A method of increasing the depth of the plastically deformed layer in the roller burnishing process. In AIP Conference Proceedings; AIP Publishing LLC: Palermo, Italy, 2018; Volume 1960, p. 040011. [Google Scholar] [CrossRef]
- Kowalik, M.; Trzepieciński, T.; Kukiełka, L.; Paszta, P.; Maciąg, P.; Legutko, S. Experimental and numerical analysis of the depth of the strengthened layer on shafts resulting from roller burnishing with roller braking moment. Materials 2021, 14, 5844. [Google Scholar] [CrossRef]
- Kaldunski, P.; Kukielka, L. Numerical Analysis and Simulation of Drawpiece Forming Process by Finite Element Method. Appl. Mech. Mater. 2014, 474, 153–158. [Google Scholar] [CrossRef]
- Kałduński, P. Numerical analysis of the deep drawing process including the history of stress and strain. J. Theor. Appl. Mech. 2018, 56, 781–792. [Google Scholar] [CrossRef]
- Kaldunski, P.; Kukielka, L.; Patyk, R.; Kulakowska, A.; Bohdal, L.; Chodor, J.; Kukielka, K. Study of the Influence of Selected Anisotropic Parameter in the Barlat’s Model on the Drawpiece Shape; AIP Publishing LLC: Palermo, Italy, 2018; p. 160014. [Google Scholar]
- Kukielka, L.; Kustra, J.; Kukielka, K. Numerical analysis of states of strain and stress of material during machining with a single abrasive grain. WIT Trans. Eng. Sci. 2005, 49, 57–66. [Google Scholar]
- Miksza, M.; Bohdal, Ł.; Kałduński, P.; Patyk, R.; Kukiełka, L. Forecasting the Fatigue Strength of DC01 Cold-Formed Angles Using the Anisotropic Barlat Model. Materials 2022, 15, 8436. [Google Scholar] [CrossRef]
- Kornienko, V.; Radchenko, R.; Bohdal, Ł.; Kukiełka, L.; Legutko, S. Investigation of Condensing Heating Surfaces with Reduced Corrosion of Boilers with Water-Fuel Emulsion Combustion. In Integrated Computer Technologies in Mechanical Engineering—2020; Lecture Notes in Networks and Systems; Nechyporuk, M., Pavlikov, V., Kritskiy, D., Eds.; Springer: Cham, Switzerland, 2021; Volume 188, pp. 300–309. [Google Scholar] [CrossRef]
- Horajski, P.; Bohdal, L.; Kukielka, L.; Patyk, R.; Kaldunski, P.; Legutko, S. Advanced Structural and Technological Method of Reducing Distortion in Thin-Walled Welded Structures. Materials 2021, 14, 504. [Google Scholar] [CrossRef]
- Jaworska, L.; Szutkowska, M.; Morgiel, J.; Stobierski, L.; Lis, J. Ti3SiC2 as a Bonding Phase in Diamond Composites. J. Mater. Sci. Lett. 2001, 20, 1783–1786. [Google Scholar] [CrossRef]
- EN 10002-1+AC1 standard; Metallic materials—Tensile testing—Part 1: Method of test at ambient temperature. European Committee for Standardization: Brussels, Belgium, 2002.
- Heyer, D.E. Plane-Stress Fracture Toughness Testing Using a Crack-Line-Loaded Specimen. Eng. Fract. Machanics 1972, 4, 393–414. [Google Scholar] [CrossRef]
- ANSYS. Theory Reference 11.0; Ansys Inc.: Fort Cannons, PA, USA, 2007. [Google Scholar]
- Kukiełka, L. Fundamentals of Engineering Studies; PWN: Warsaw, Poland, 2002; p. 273. ISBN 8301137495/9788301137496. (in Polish) [Google Scholar]
Disclaimer/Publisher’s Note: The statements, opinions and data contained in all publications are solely those of the individual author(s) and contributor(s) and not of MDPI and/or the editor(s). MDPI and/or the editor(s) disclaim responsibility for any injury to people or property resulting from any ideas, methods, instructions or products referred to in the content. |
© 2023 by the authors. Licensee MDPI, Basel, Switzerland. This article is an open access article distributed under the terms and conditions of the Creative Commons Attribution (CC BY) license (https://creativecommons.org/licenses/by/4.0/).