Article

Design and Application of Intelligent Transportation Multi-Source Data Collaboration Framework Based on Digital Twins

1
School of Information Science and Technology, Fudan University, Shanghai 200433, China
2
Shanghai Artificial Intelligence Laboratory, Shanghai 200232, China
3
Key Laboratory of Growth Regulation and Translational Research of Zhejiang Province, School of Life Sciences, Westlake University, Hangzhou 310024, China
4
Academy for Engineering and Technology, Fudan University, Shanghai 200433, China
*
Author to whom correspondence should be addressed.
Appl. Sci. 2023, 13(3), 1923; https://doi.org/10.3390/app13031923
Submission received: 19 December 2022 / Revised: 25 January 2023 / Accepted: 31 January 2023 / Published: 2 February 2023
(This article belongs to the Special Issue Recent Advances in Big Data Analytics)

Abstract

:
The increasing urban traffic problems have made the transportation system require a large amount of data. Aiming at the current problems of data types redundancy and low coordination rate of intelligent transportation systems (ITS), this paper proposes an improved digital twin architecture applicable to ITS. Based on the improved digital twin architecture, a framework for dynamic and static data collaboration in ITS is constructed. For various collaboration methods, this paper specifically describes the collaboration methods and scopes, and designs the framework and interfaces for data mapping. Finally, the effectiveness of the framework is verified by case studies to mine the spatiotemporal distribution characteristics of data, capture human travel characteristics, and visualize intersections using digital twins. This paper provides a new data fusion idea for digital twin systems in ITS, and the framework covers all data types in digital twin systems for cross-integration analysis.

1. Introduction

With the continuous expansion of the urban scale, transportation is an important issue for the development of the country and the improvement of people’s quality of life. Intelligent systems model, analyze, and digitize traffic scenes, perform macro and micro visual displays, propose intelligent travel suggestions, and apply them to traffic control and services to achieve multiple benefits.
Digital twin is a large virtual data management system that uses three-dimensional (3D) modelling, Internet of Things (IoT) [1], Artificial Intelligence (AI) and other technologies to connect and manage physical cities and virtual cities in digital space. Grieves first proposed his concept in 2003 [2]. Researchers said that physical devices create and connect virtual units in space. This connection is stable and accurate, so it is called model image space. Grieves officially named it “Digital twin” in 2010 [3]. Grieves then proposed 3D models based on physical units, virtual entities and connections [4]. These models have become the most widely used models. With the increase in application requirements and the improvement of theoretical technology, the development of digital twin models also presents a new trend. In order to enable information exchange between simulation and physical twins, A.J.H. Redelinghuys et al. [5] proposed a six-layer structure of digital twins. F. Tao et al. extended the traditional “THREE-DIMENSIONAL” model in [6] and proposed a “FIVE-DIMENSIONAL” model based on the physical entity (PE), the virtual entity (VE), the services (Ss), the digital twin data (DD), and connection (CN), which meets the new requirements of digital twin applications. Unlike A.J.H. Redelinghuys, Tao also took into account the users in the system. Based on the five-dimensional model, Wu proposed a conceptual modelling method of digital twins, using the TRIZ function model to express the complex relationship between digital twins and their attributes [7]. Digital twin technology can help urban management and decision-making to coordinate and achieve intelligent, accurate and safe transportation [8].
In the ITS, the four elements of human-vehicle-road-environment are interrelated and coordinated. Due to its inherent structural characteristics, different data can be used to solve different problems. Compared with traditional data systems, digital twinning technology not only emphasizes information and physical data, but also emphasizes the integration and interconnection between data [9], and achieves interactive real-time information space and physical space through the relationship between data. In the study [10], Jiang et al. elaborated the evolution mechanism of the digital twin workshop and proposed the digital twin evolution model, which was combined with each stage of engineering application to give it application scenarios. Cheng J et al. applied the digital twin technology to the industrial Internet and proposed the self-reinforced digital twin technology of intelligent in [11]. Because of the ability of digital twins to connect the information world and the physical world, they have been used by many researchers in information physics systems [12]. In [13], A.I. Levina et al. applied the IoT solution to intelligent transportation systems, automated data collection and processing functions, and effectively improved efficiency through standardized processes. Many scholars have also applied digital twin technology to the field of architecture. Kaewunruen et al. [14] proposed a future model to improve the energy consumption of buildings by using the combination of hierarchical process and building information modeling (BIM) model, and apply renewable technologies to buildings. Delbrugger T et al. [15] proposed a BIM-based digital twin factory navigation framework to realize path searching of factory robots.
Some scholars make a simple fusion of traffic spatiotemporal data for analysis. Pan et al. [16] has chosen to use the GPS data of taxis and tweets collected on Weibo for three months to build a human detection system for traffic abnormalities, and identify deviations according to the taxi drivers’ action routes. Guo et al. have studied the data of floating cars and excavated the characteristics of the road network [17]. Magsino E.R. et al. used car floating data to study the travel dynamics of two different types of public transportation in a city [18]. E. Felemban et al. introduced an interactive platform that can detect the movement of a bus using large-scale GPS trajectories [19]. Wang et al. proposed a method inspired by data field theory and community detection to mine spatiotemporal trajectory data [20]. Chen et al. combined data collection and Internet data to study human travel behaviour and mobility [21]. However, there are few studies on multiple data fusion modes.
Based on the above problems, this paper uses virtual simulation models to help make decisions and monitor physical devices to solve data interaction and collaboration problems in ITS based on digital compensation technology, where the details are shown in Figure 1. The major contributions of this work are summarized below.
  • We proposed an improved digital twin architecture based on a new ITS to enrich the data types of the digital twin.
  • We used the virtual–physical spatial relationship of digital twin technology to build a data collaboration framework, and its collaboration relationship and input interface were discussed.
  • We showed a case of collaborative analysis using digital twins spatiotemporal data, UAV videos and BIM data.
The outline of the paper is as follows. The Section 1 is the enhanced digital twin architecture and enriched data type for ITS. The Section 2 is to build the dynamic and static data collaboration framework for ITS based on the enhanced digital twin architecture, and specify the collaboration model. The Section 3 is a case study based on the above framework. In Section 4 the limitations and future research of this paper are summarized.

2. Digital Twin-Based ITS Multi-Source Data Cooperation Framework

This chapter focuses on the data collaboration problem in ITS, improves the digital twin data type and designs a new ITS framework.

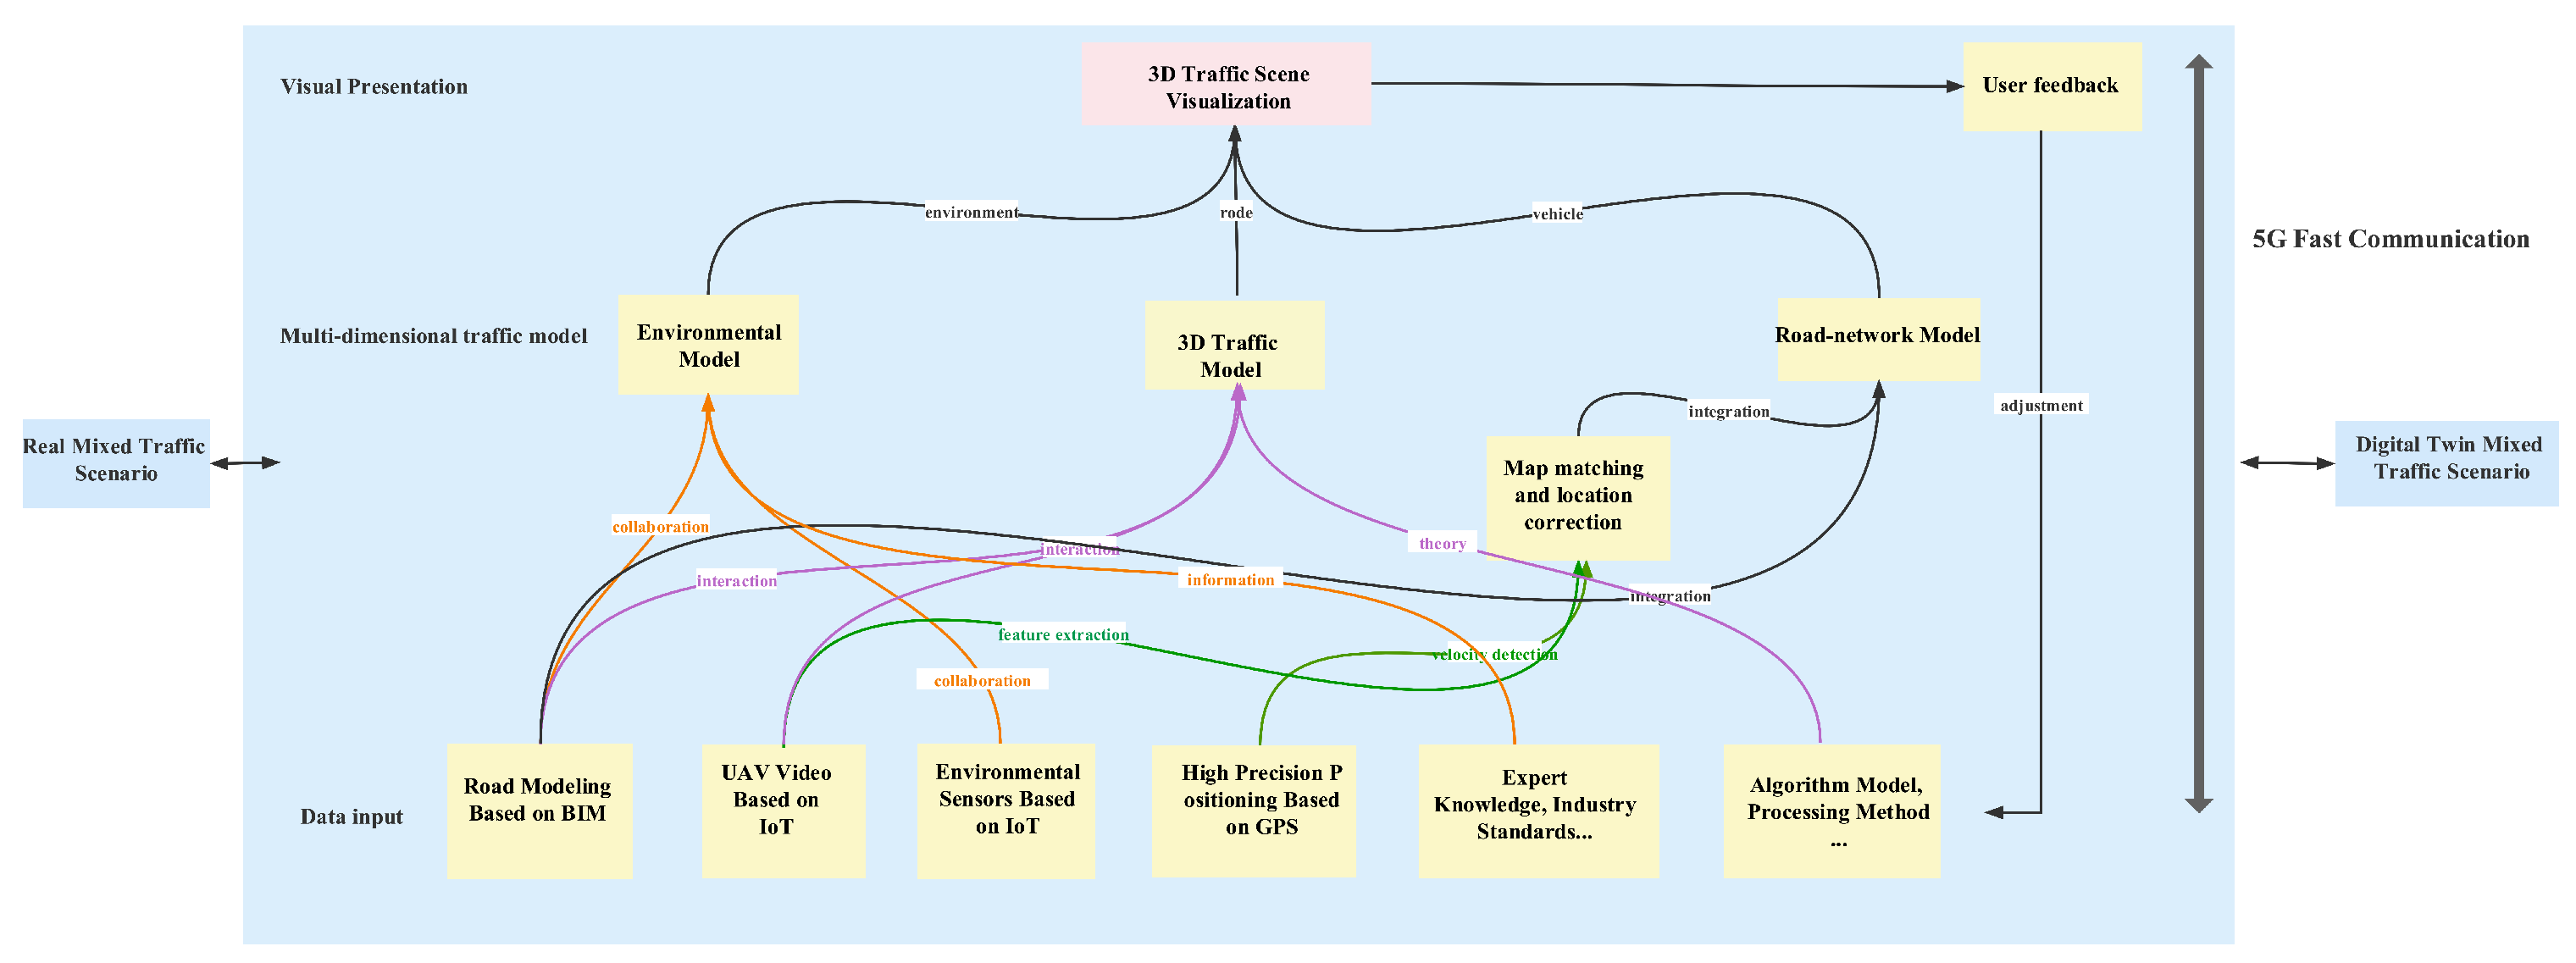
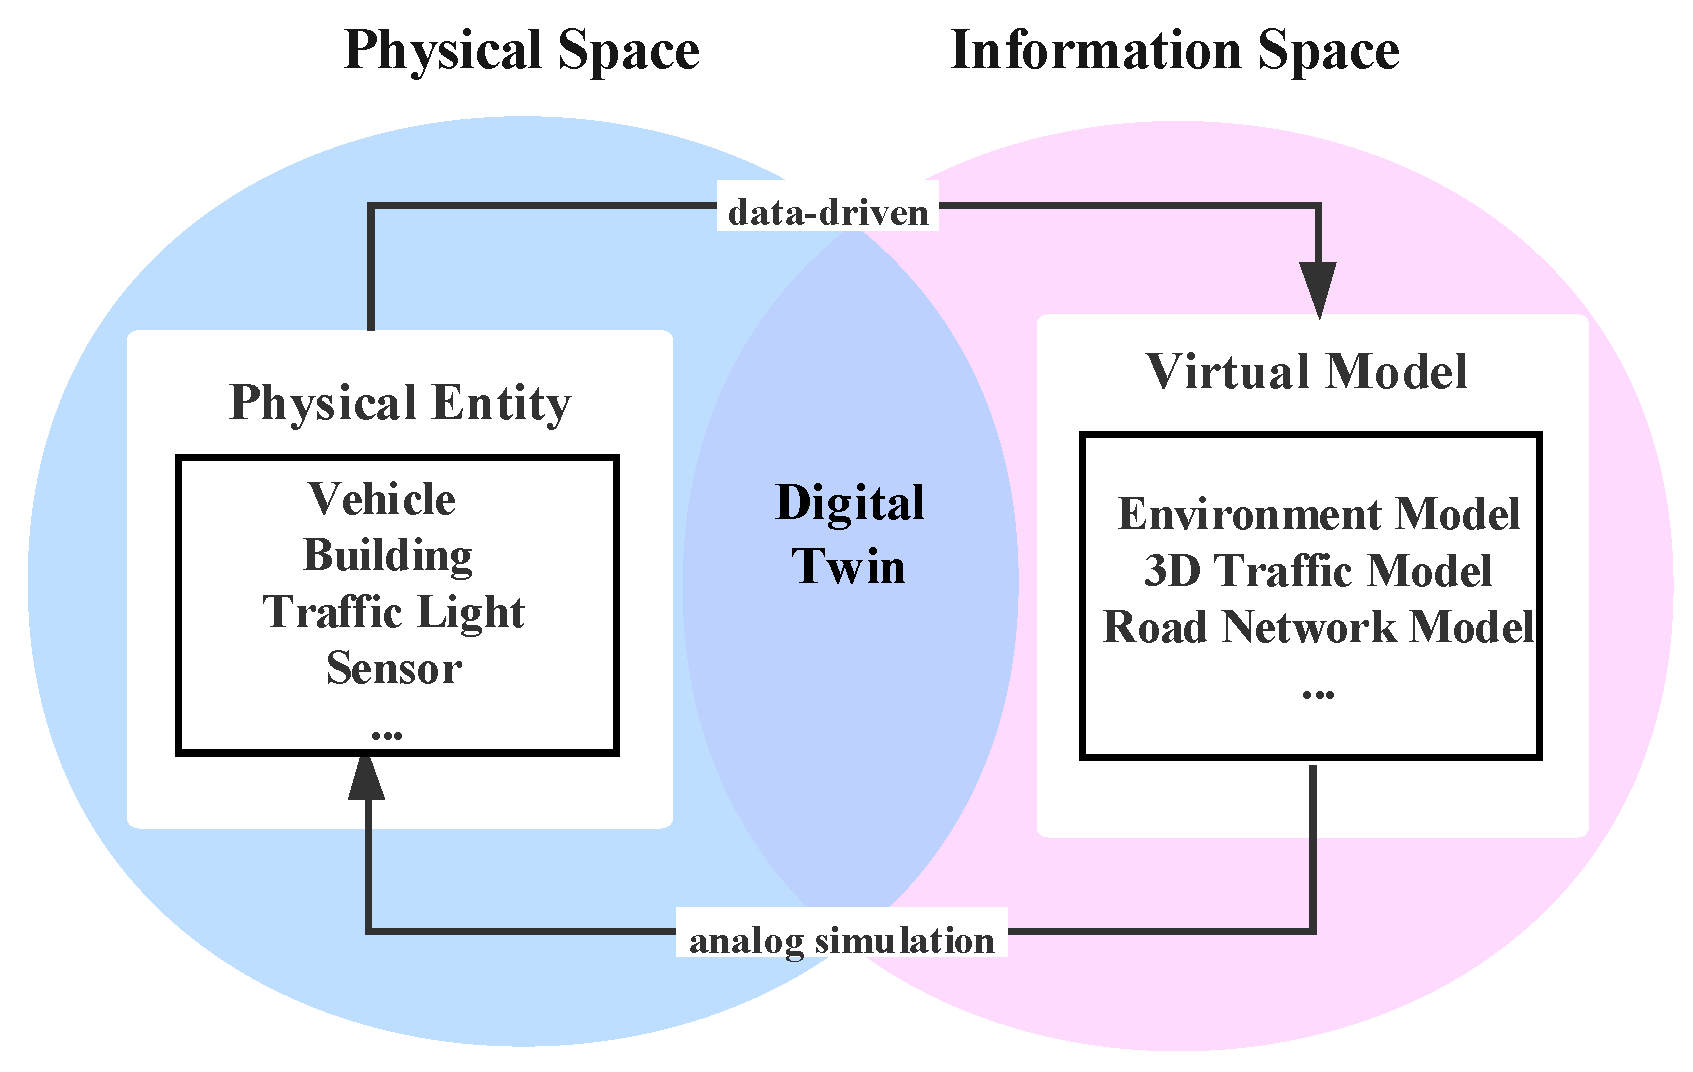
2.1. Improved Digital Twin Data Based on ITS

Intelligent transportation systems rely on big data, the Internet of Things, cloud computing, etc. Digital twins build physical entity models through digital means to connect the physical world and information world to the “virtual-real integration” system [9], connects the physical world and the information world with a system of “virtual-real fusion”, based on the unique dynamic and static combination mode of digital twin data systems. The twinning data are clearly defined in the five-dimensional model of digital twinning [6], DD is the driver of the digital twin [9], including physical entity data ( D p ), virtual entity data ( D v ), services data ( D s ), knowledge data ( D k ), and fusion-derived data ( D f ). D p mainly include the specifications, functions and other data of physical entities, such as environmental parameters, which are mainly collected through sensors. D v mainly includes the data of virtual entities, such as geometric size, material properties and data obtained from process simulation based on the model. D s mainly includes functional service-related data (algorithms, processing methods, etc.) and business service data (production management, market analysis, etc.). D k mainly includes functional service-related data (algorithms, processing methods, etc.) and business service data (production management, market analysis, etc.). D f are derived from the above four kinds of data after conversion, preprocessing, integration, fusion and other operations. The obtained fusion data can reflect the information more comprehensively, and realize information sharing and value-added. Due to the strong application of the transportation system, the above five data types cannot meet the requirements of ITS. Therefore, the data collaboration framework proposed in this paper added user data ( D u ) on the basis of the above five kinds of data as Equation (1) and made multi-directional cooperation.
DD = D p , D v , D s , D k , D f , D u
Compared with previous studies, the data collaboration framework provided by us covers more twin data types as shown in Table 1.

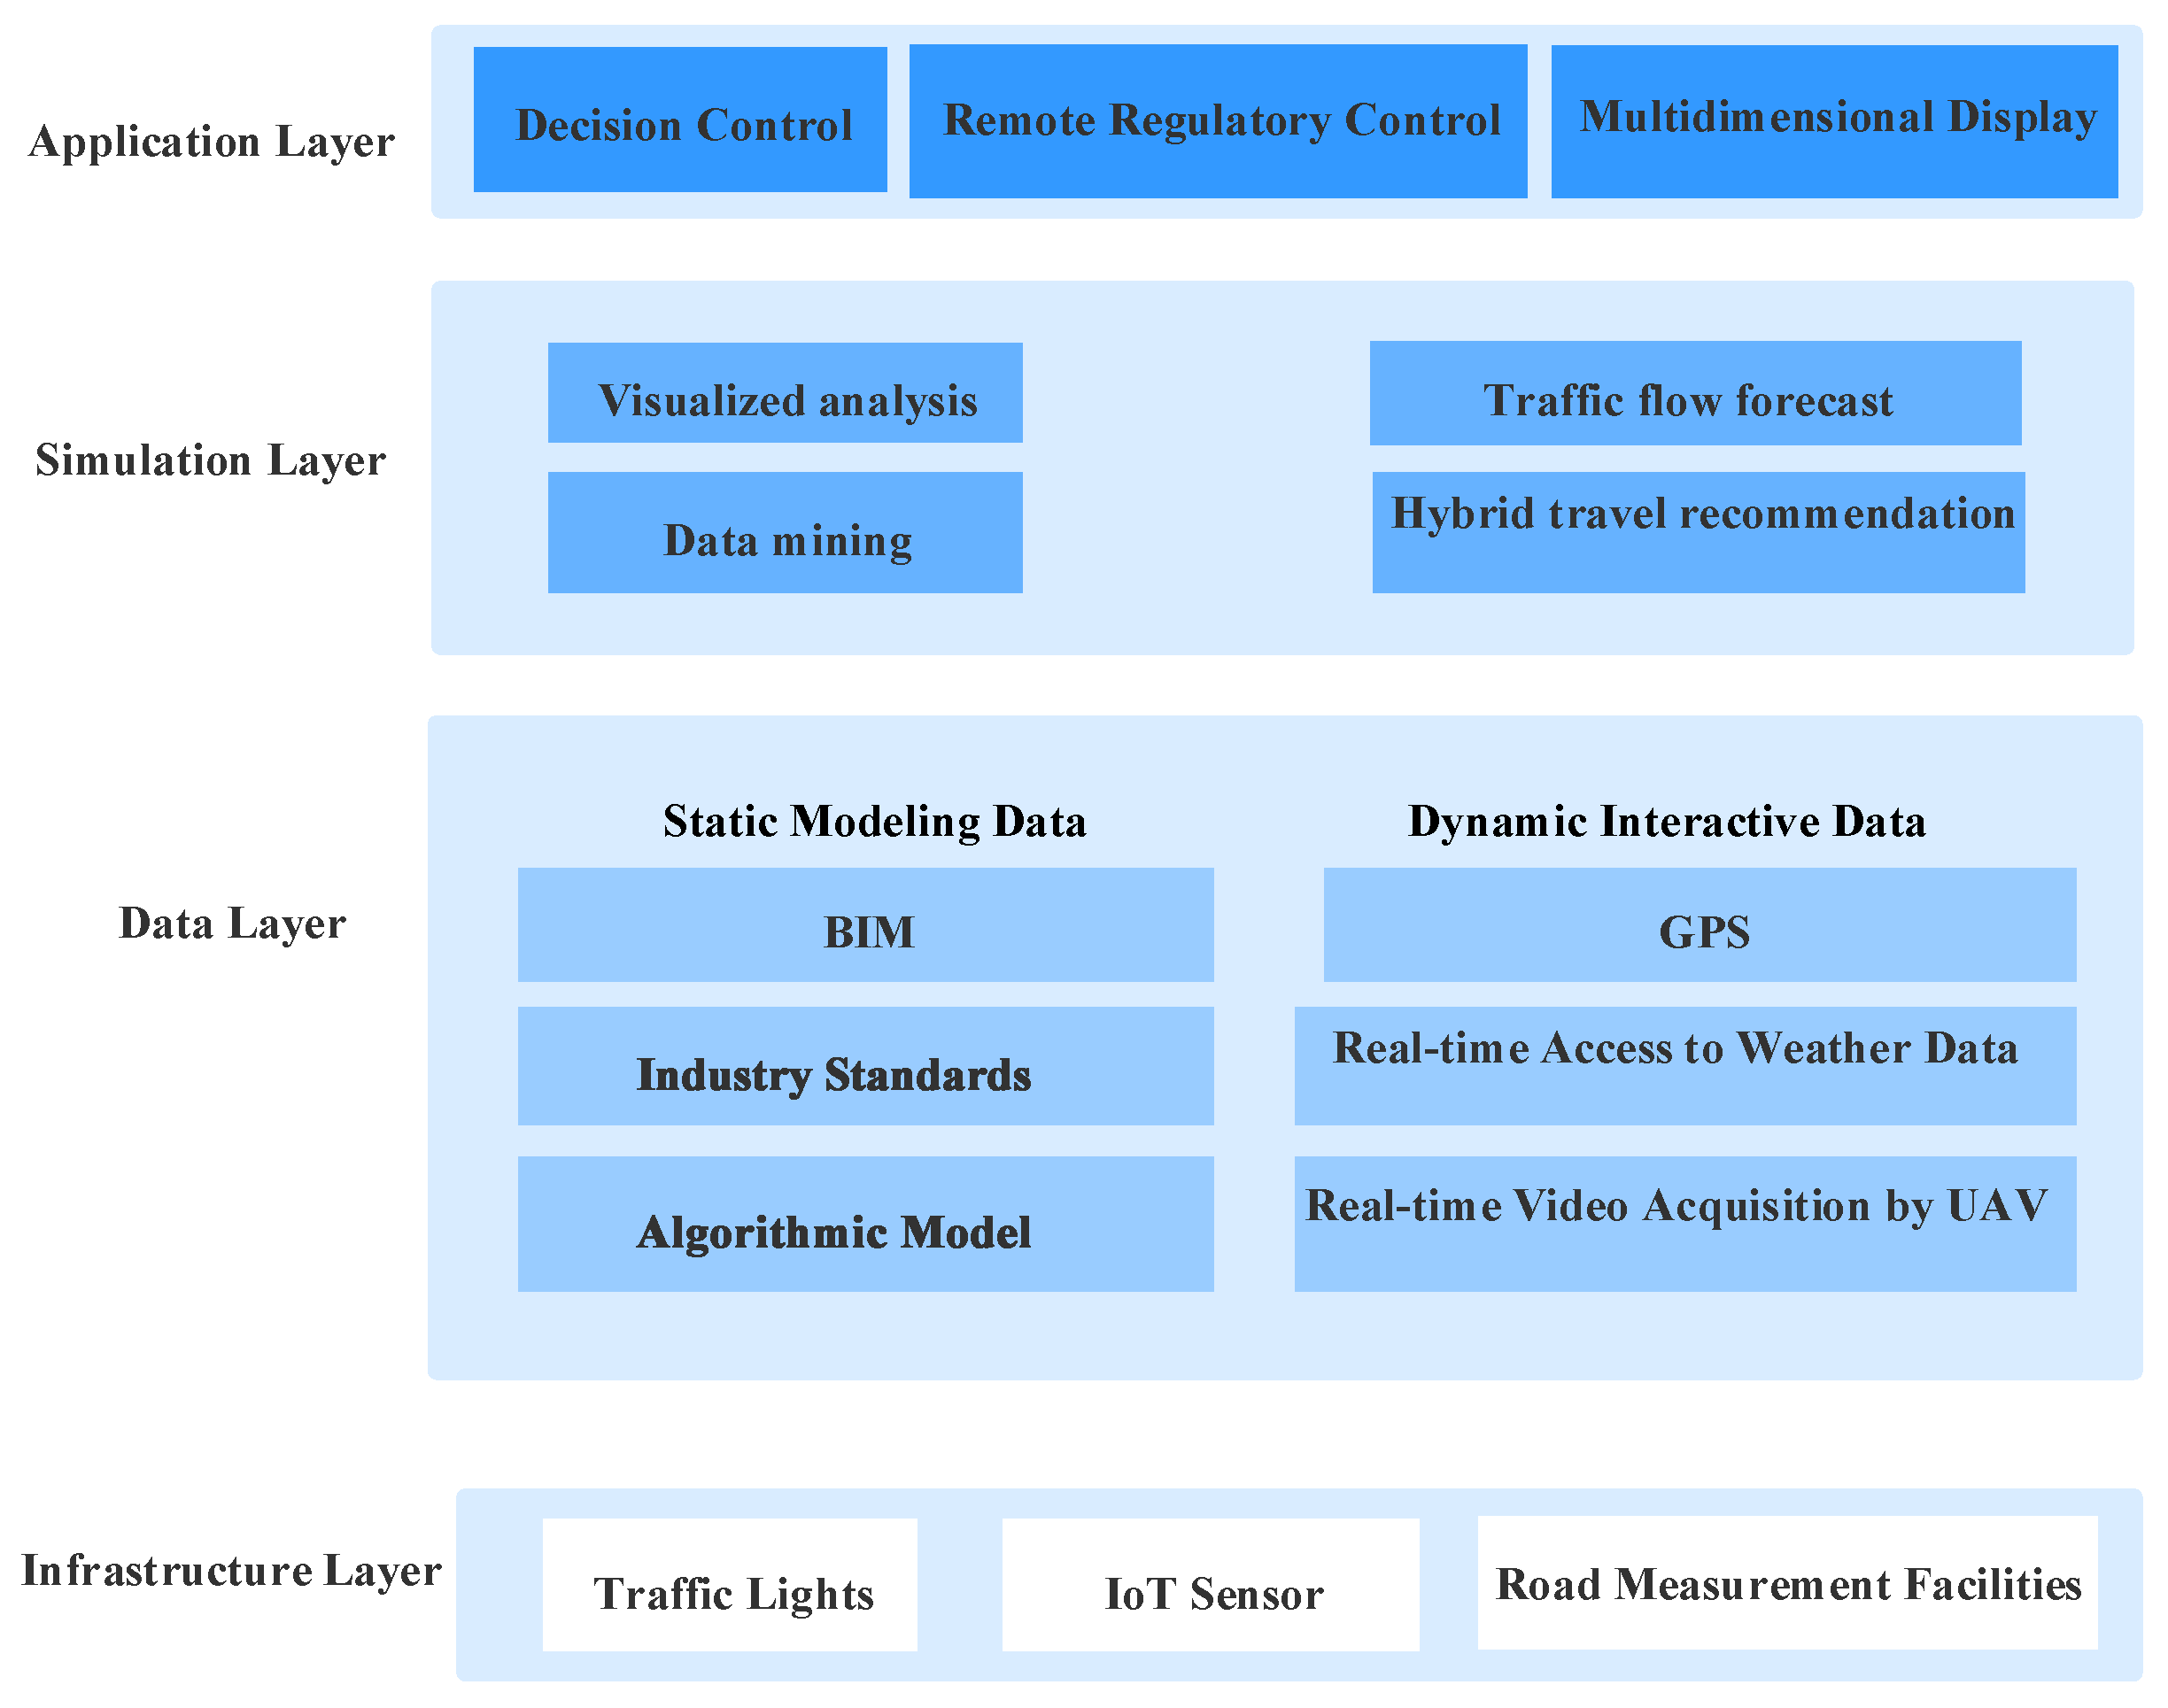
2.2. Framework Design of ITS

Digital twin technology supports ITS development [25]. From the perspective of module functional units, digital twinning technology based on ITS system can be divided into infrastructure layer, data layer, simulation layer, and application layer (Figure 2), simulation layer and application layer, corresponding to physical model, data model and simulation model respectively. Redelinghuys’ [5] six-layer framework is relatively complex and not suitable for the transportation network. In order to be more suitable for the practical application of traffic networks, we added the application layer and combined the multidimensional data into one layer to make it more concise and clear.
The infrastructure layer, as the means and source of data acquisition, plays a supporting role in the entire architecture. The data layer includes static modelling data, dynamic interactive data and service knowledge data as data modules in a digital twin system. In this paper, multi-dimensional and multi-type data interactive combinations are used for fusion analysis to provide support for the simulation layer. The simulation layer provides a reliable basis for the application layer through computational simulation. In the application layer, according to the actual application requirements, information fusion and display of the results are carried out. This paper focuses on the interaction between the data layer and the simulation layer. The data layer is mainly divided into static data and dynamic data. Static modelling data includes modelling of building materials and appearance of intelligent transportation environment by using BIM [26] technology, industry standards and algorithmic models. Dynamic perception data includes real-time acquisition of vehicle information [27] and acquisition of weather information by means of IoT [28] technology of meteorological sensors and UAVs video of fast communication.

3. Design of Data Collaboration Mode Based on Improved Framework

3.1. Data Collaboration Method Based on ITS

Based on the above framework, this chapter refined the digital twin data in ITS and elaborated its multiple collaborative ways. In order to avoid data islands, this paper used the data merge relationship shown in Figure 3 for integrated modeling, established the connection between data and relational database, and returned it in JSON format through network requests.

3.1.1. Collaboration between BIM and IoT in Real-Time

With the rapid development of IoT technology, digital twins can play a role in the field of intelligent transportation, and IoT devices can provide professional services for cloud computing, cloud storage, etc. [29]. BIM is a digital expression of the physical and functional characteristics of facilities [30]. The integrated application of BIM and the IoT can more effectively manage and use a large amount of data, visualize heterogeneous data from multiple sources, establish consistent links between data in real time, and improve the practicability and interactivity of historical data.
Based on the above statement, this paper used the method of multiple BIM collaboration to collect data, model the traffic system, and prepare for subsequent analysis. This paper used the Unreal Engine4 (UE4) engine of Epic Games to create 3D visualization data using BIM model. The main steps are as follows: First, data preprocessing, which calculates the correlation between UE4 scene coordinates and actual space coordinates, and maps them to virtual space by rotating and scaling the coordinates of actual space, and converted the relationship to:
( R ) ( T ) x y z = x y z
where, o ( x , y , z ) is a point in real space, O ( x , y , z ) is a point in virtual space, x , y , z are the coordinates of real space and x , y , z are the coordinates of virtual space. R is the rotation matrix, and T is the translation and scaling matrix. Second, import the UE4 engine to generate 3D scene models of traffic elements such as roads, terrain and buildings. Third, obtain a new 3D interactive traffic model with strong fidelity and immersion.

3.1.2. Collaboration between BIM and UAV

The integration of IoT sensors and BIM makes real-time information exchange and exchange possible. Object perception using unmanned aerial vehicle (UAV) image information improves the fault-tolerance of eye-movement level BIM modeling, making it possible to build high-precision and high-quality traffic models.
As a video sensor in the IoT [31], UAV is a convenient tool for video data acquisition. After the first UAV was launched from the US Navy Research Office, it is mainly used for boring and dangerous work [32]. Combined with cameras, UAVs can obtain high-resolution images from different angles and transmit information to the ground through routing. In order to solve the problems caused by bad weather and the existence of blind spots, this paper combines the UAV technology with the BIM model to model the traffic scene of the corresponding intersection, and imports the cooperation information into the UE4 engine for modeling. The model includes the external information of the building, 3D scene model of road condition information and macro traffic information, and carries out feature extraction and visualization of intersection traffic flow information according to algorithm model.

3.1.3. Collaboration between GPS Information and BIM

This paper aims to carry out a 3D visual display on the basis of establishing the data coordination framework of the intelligent transportation system and using geographic data to enhance the BIM model. Therefore, this paper used the interactive way of GPS information and BIM technology to collect data. In this paper, through desensitization of GPS terminal service providers, we obtained the activity data of personal vehicles equipped with GPS tracking system in Wuxi, Jiangsu Province in 2020, including vehicle identification, pick-up time, longitude and latitude of pick-up location, and vehicle speed. This provides reliable support for follow-up interactive research. This paper carried out the following processing for GPS information: First, data filtering. Delete irrelevant data, low-sampling data, error data, etc. (such as unreal coordinate repeated timestamp, too fast speed, too long waiting time, too small trajectory, etc.); Second, map matching; Third, calculate the road speed; Fourth, coordinate change and eliminate error, applied in BIM traffic model; Fifth, use algorithms to mine travel hotspots and peak times. However, as the data are limited to private cars equipped with the supplier’s location system, the data are still one-sided.

3.1.4. Collaboration between GPS Information and UAV

Considering the high resolution and real-time characteristics of UAV, this paper adopted an image processing algorithm to conduct traffic flow statistics based on real-time data collected by UAV, and comprehensively used GPS macro data and position micro-data collected by UAV to detect flow rate and extract features. Finally, the road index is measured and the road network is constructed based on the data of the traffic simulator.
The UAV video data can also be used to detect weather and air quality at the naked eye level for collaborative analysis.

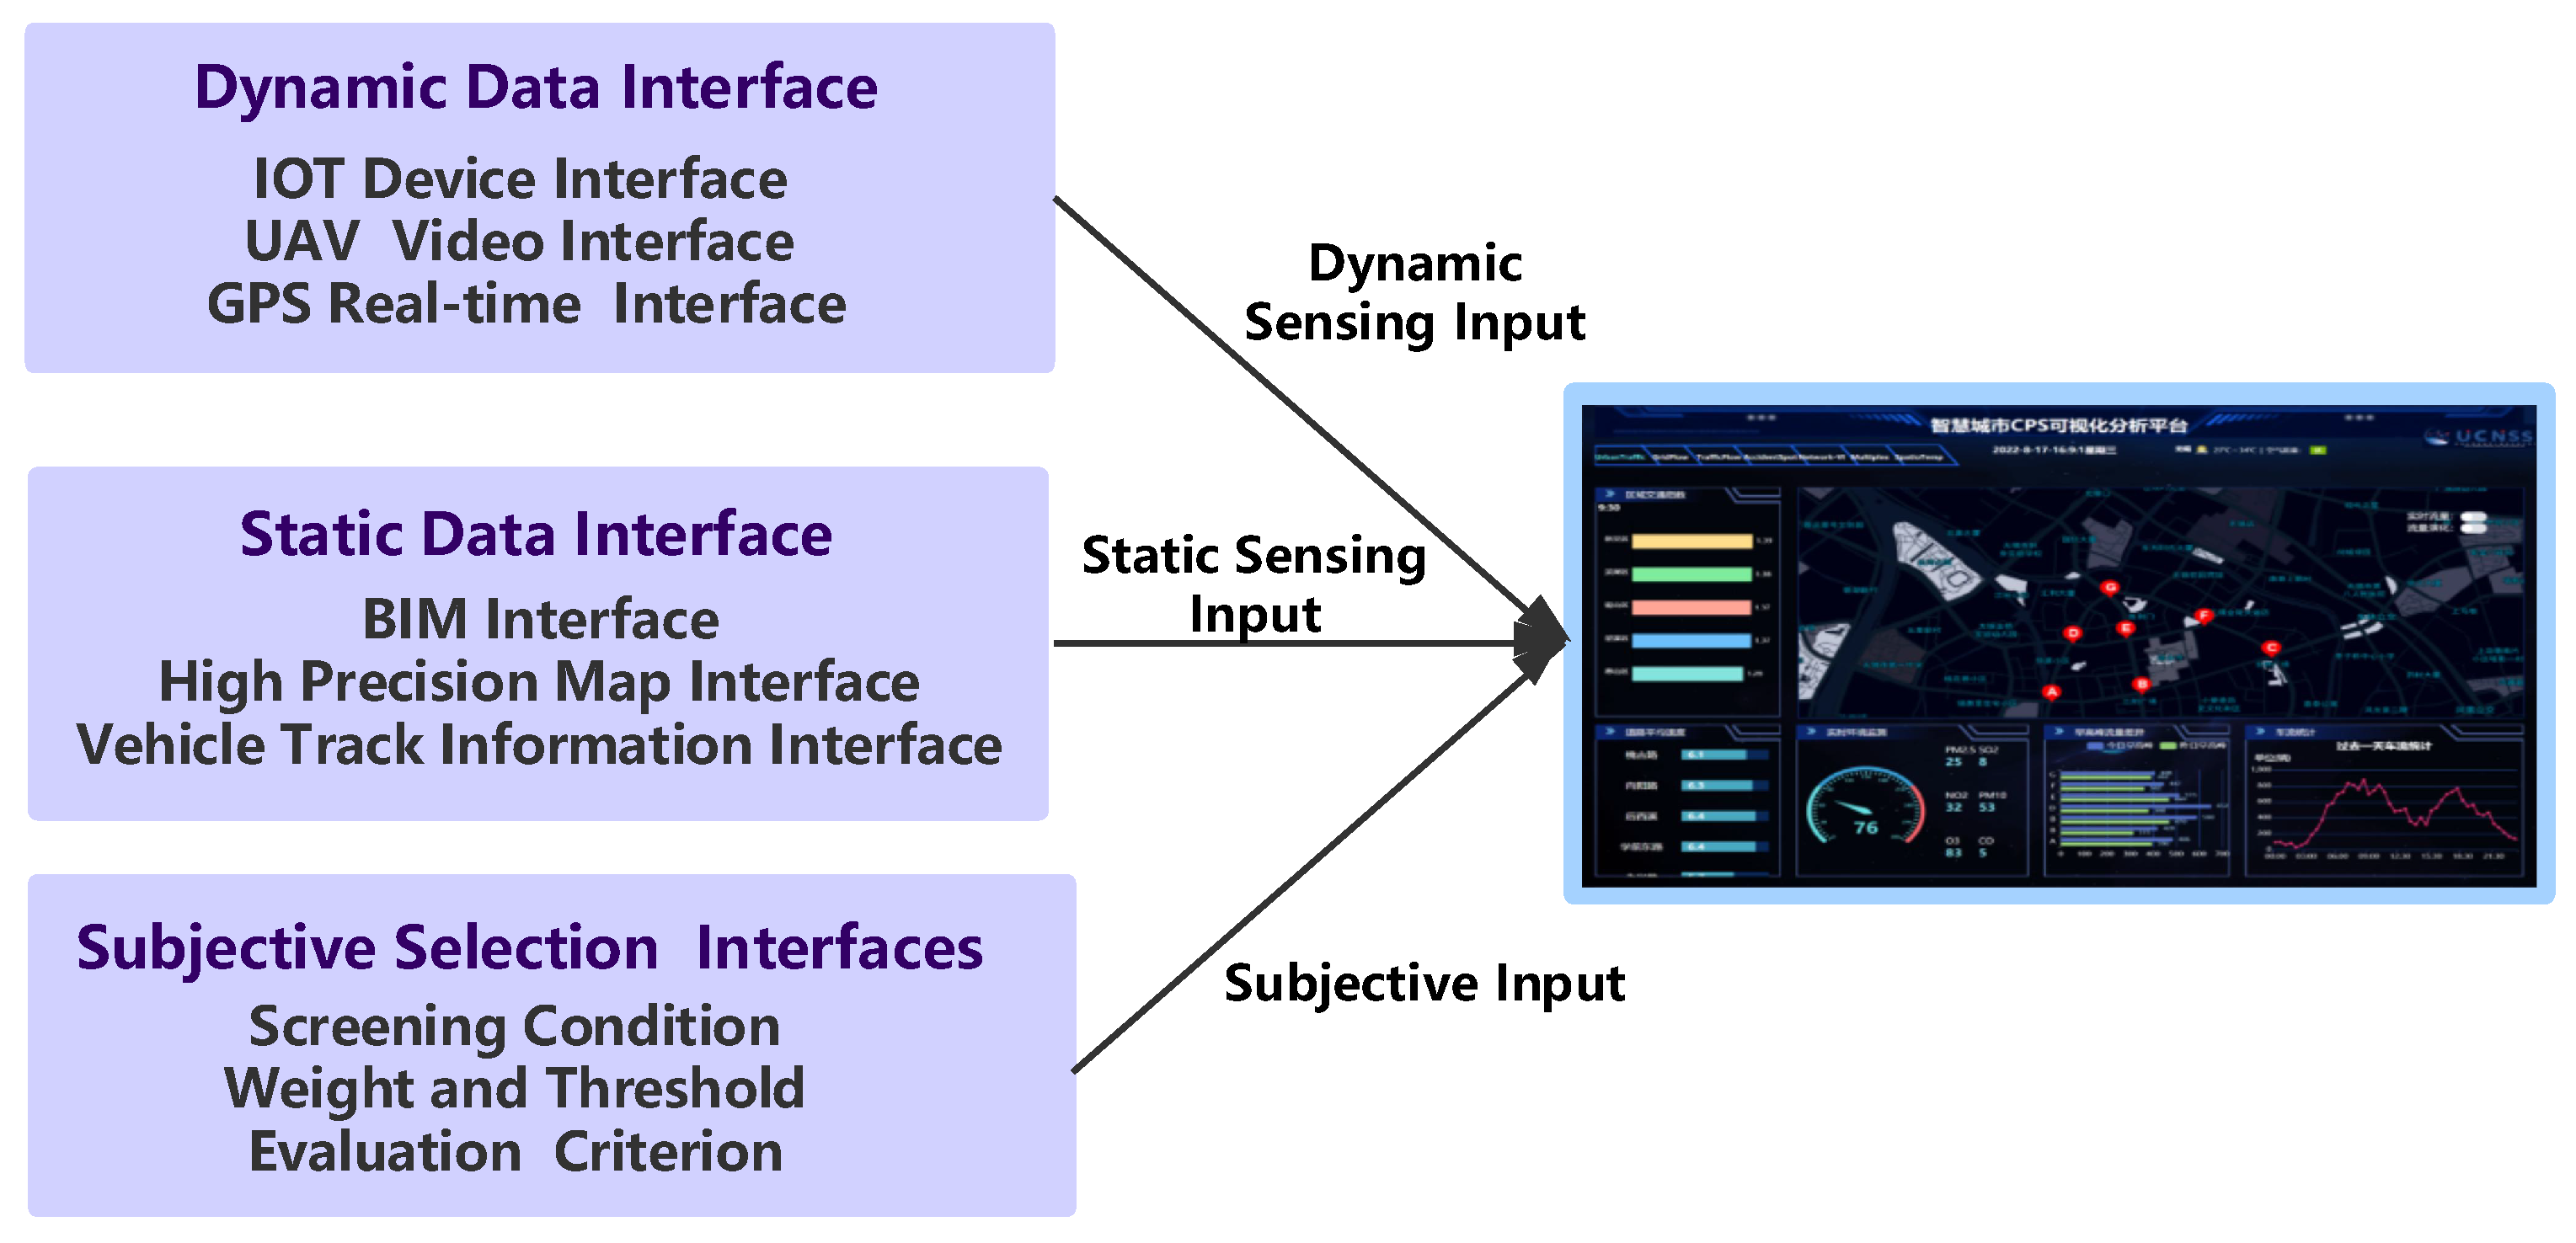
3.2. Input Interface Design Based on Data Collaboration

Compared with model-based simulation, digital compensation simulation emphasizes the combination of real-time data and simulation model. The interface that can transmit data in real time can further activate the intelligent transportation system and convert offline analysis to online analysis. The interface designed in this paper consists of three parts (Figure 4): dynamic data interface, static data interface and subjective selection data interface. These three parts of data serve as the input interface of the results. Through the visual execution of the results evaluation process, the system has the ability of optimization and perception, and improves the accuracy and timeliness of the evaluation.

4. Case Study of Data Collaboration

This paper is based on spatiotemporal data mining and an improved differential fusion algorithm (DFA) to take the collaboration of UAV video data based on IoT, BIM data, GPS trajectory data and algorithm model as an example (Figure 5) to explain the rationality of the framework.
Firstly, the error data in the GPS trajectory data are deleted; Secondly, the GPS data are processed, and their longitude and latitude are mapped to a high-precision map by a matching algorithm (through track correction), and the speed of the road is calculated; Then, the spatiotemporal distribution characteristics are mined to extract travel hotspots and peak hours; Next, aiming at the hot intersections, the UAVs are used to capture the traffic flow data in the peak hours, and the UAV video data are processed and analyzed to mine the traffic flow and capture the behavioural characteristics. Finally, visual modelling of the digital twin of target intersections was conducted using UE4 and BIM data.

4.1. Dataset Description

The case database of this paper consists of three parts, a GPS dataset, a UAV video dataset, and a building model dataset. The GPS dataset is continuous data from 18 July 2020, to 18 August 2020, and there are about 3   ×   10 8 trajectory records per day. The main fields are longitude, dimension, acquisition time, direction, velocity and acceleration. The UAV dataset is video data of seven intersections- about 1680 min. The building model dataset includes building material types and more.

4.2. Space-Time Travel Data Mining

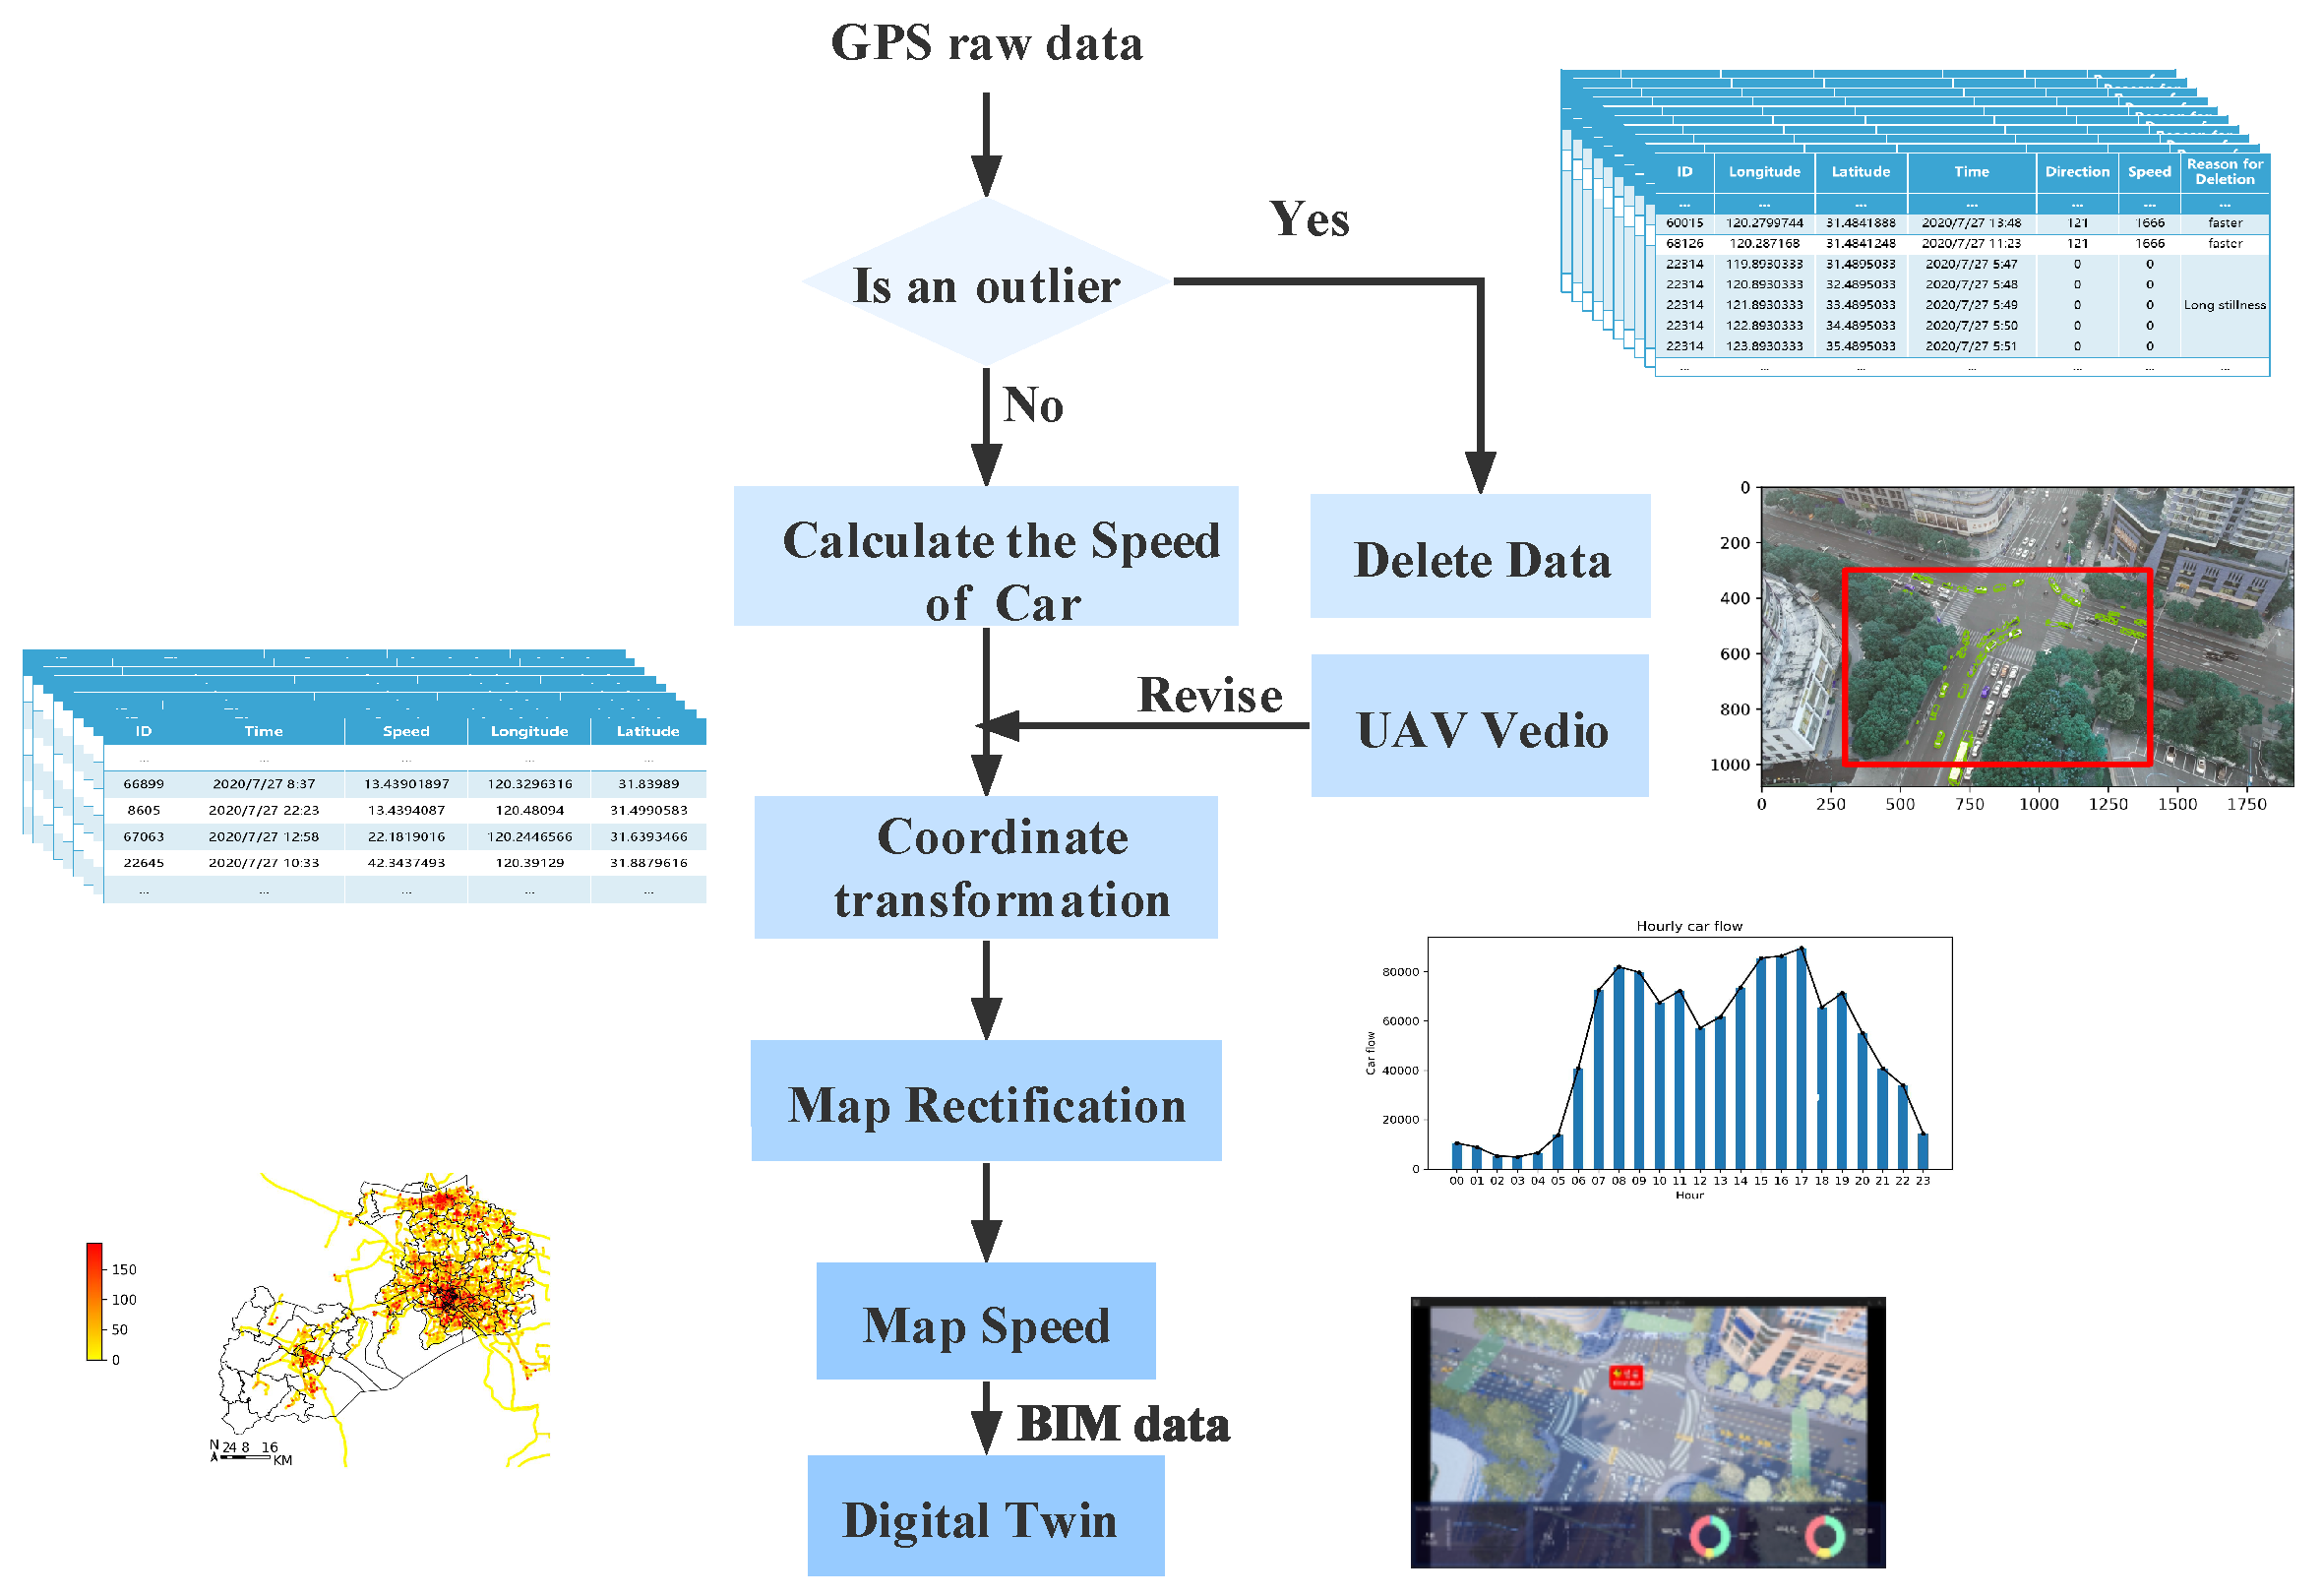
4.2.1. Abnormal Data Filtering

The GPS data in the framework described in this paper serves for traffic flow prediction and travel recommendation, so it is necessary to filter according to application scenarios before data collaboration, so as to reduce data processing capacity and improve processing speed. First, we need to delete fields that do not contribute to the traffic flow rate, such as acceleration. Then, we take a time interval of 1 s for sampling. In order to avoid accidental deletion caused by shortstop or red light, we choose the average duration of red light interval in China of 60 s as the time window length and consider the vehicle whose speed is 0 for 60 consecutive seconds to be stopped and delete it. At the same time, the points with excessive speed are considered error points and are deleted (Table 2 lists some filtered data and deletion reasons). By processing abnormal data, we reduce the amount of GPS data from 3   ×   10 8 to 6   ×   10 7 .

4.2.2. GPS Data Process

Firstly, according to Haversine Formula as shown in Formula (3), the distance between the two points is calculated from the latitude and longitude as the length of the target section.
hav d R = hav φ 2 φ 1 + cos φ 1 cos φ 2 hav ( Δ λ )
where,
hav ( θ ) = sin 2 ( θ / 2 ) = ( 1 cos ( θ ) ) / 2
Including, R is the radius of the earth, and the average value is 6371 km; φ 1 , φ 1 are the latitude of two points; Δ λ represents the difference in longitude between two points.
Then, the time difference of each vehicle passing through the two groups of longitude and latitude points was obtained by looking for vehicle ID, and we take the maximum time difference as the baseline and record the number of vehicles.
Finally, since GPS data are sampled at a time interval of 1 s, in order to obtain the average speed on the whole road, we process the vehicles with the same ID after data screening and calculate their average speed as the vehicle speed on the road based on the longitude and latitude of the intersection at both ends of the road. Table 3 shows partial calculation results.

4.2.3. Mapping

In this paper, the number and speed of cars on the whole road are calculated to find the average travel speed of a road, and according to different values, it is marked in different colours on the high-precision map. Since there are many abrupt changes in the instantaneous speed in our dataset, but the position data are relatively accurate, we choose the ratio of the total distance travelled by vehicles to the total time in the period to represent the average speed of the road section. The average travel speed is calculated as follows:
v ¯ = n L i = 1 n t i
where, L is the length of the regional road section, which was calculated by the Haversine formula, t i is the time for vehicle i to pass through the regional road section, and n is the number of vehicles measured.
According to the latest road traffic congestion evaluation method (GA/T 115-2020), the specific marking colour is divided into four levels, and the range is determined according to the road conditions. For example, on the urban main road with a speed limit of 60 km/h, if the average road travel speed is 35–60 km/h, it is marked in green; if the average road travel speed is 30–35 km/h, it is marked in yellow; 20–30 km/h, it is marked in orange; and 0–20 km/h, it is marked in red.
Due to the unique coordinate marking method of GPS data, we first convert the WGS84 coordinate system to the GCJ02 coordinate system, and then correct the trajectory according to the trajectory correction algorithm [33], and finally match the high-precision map.

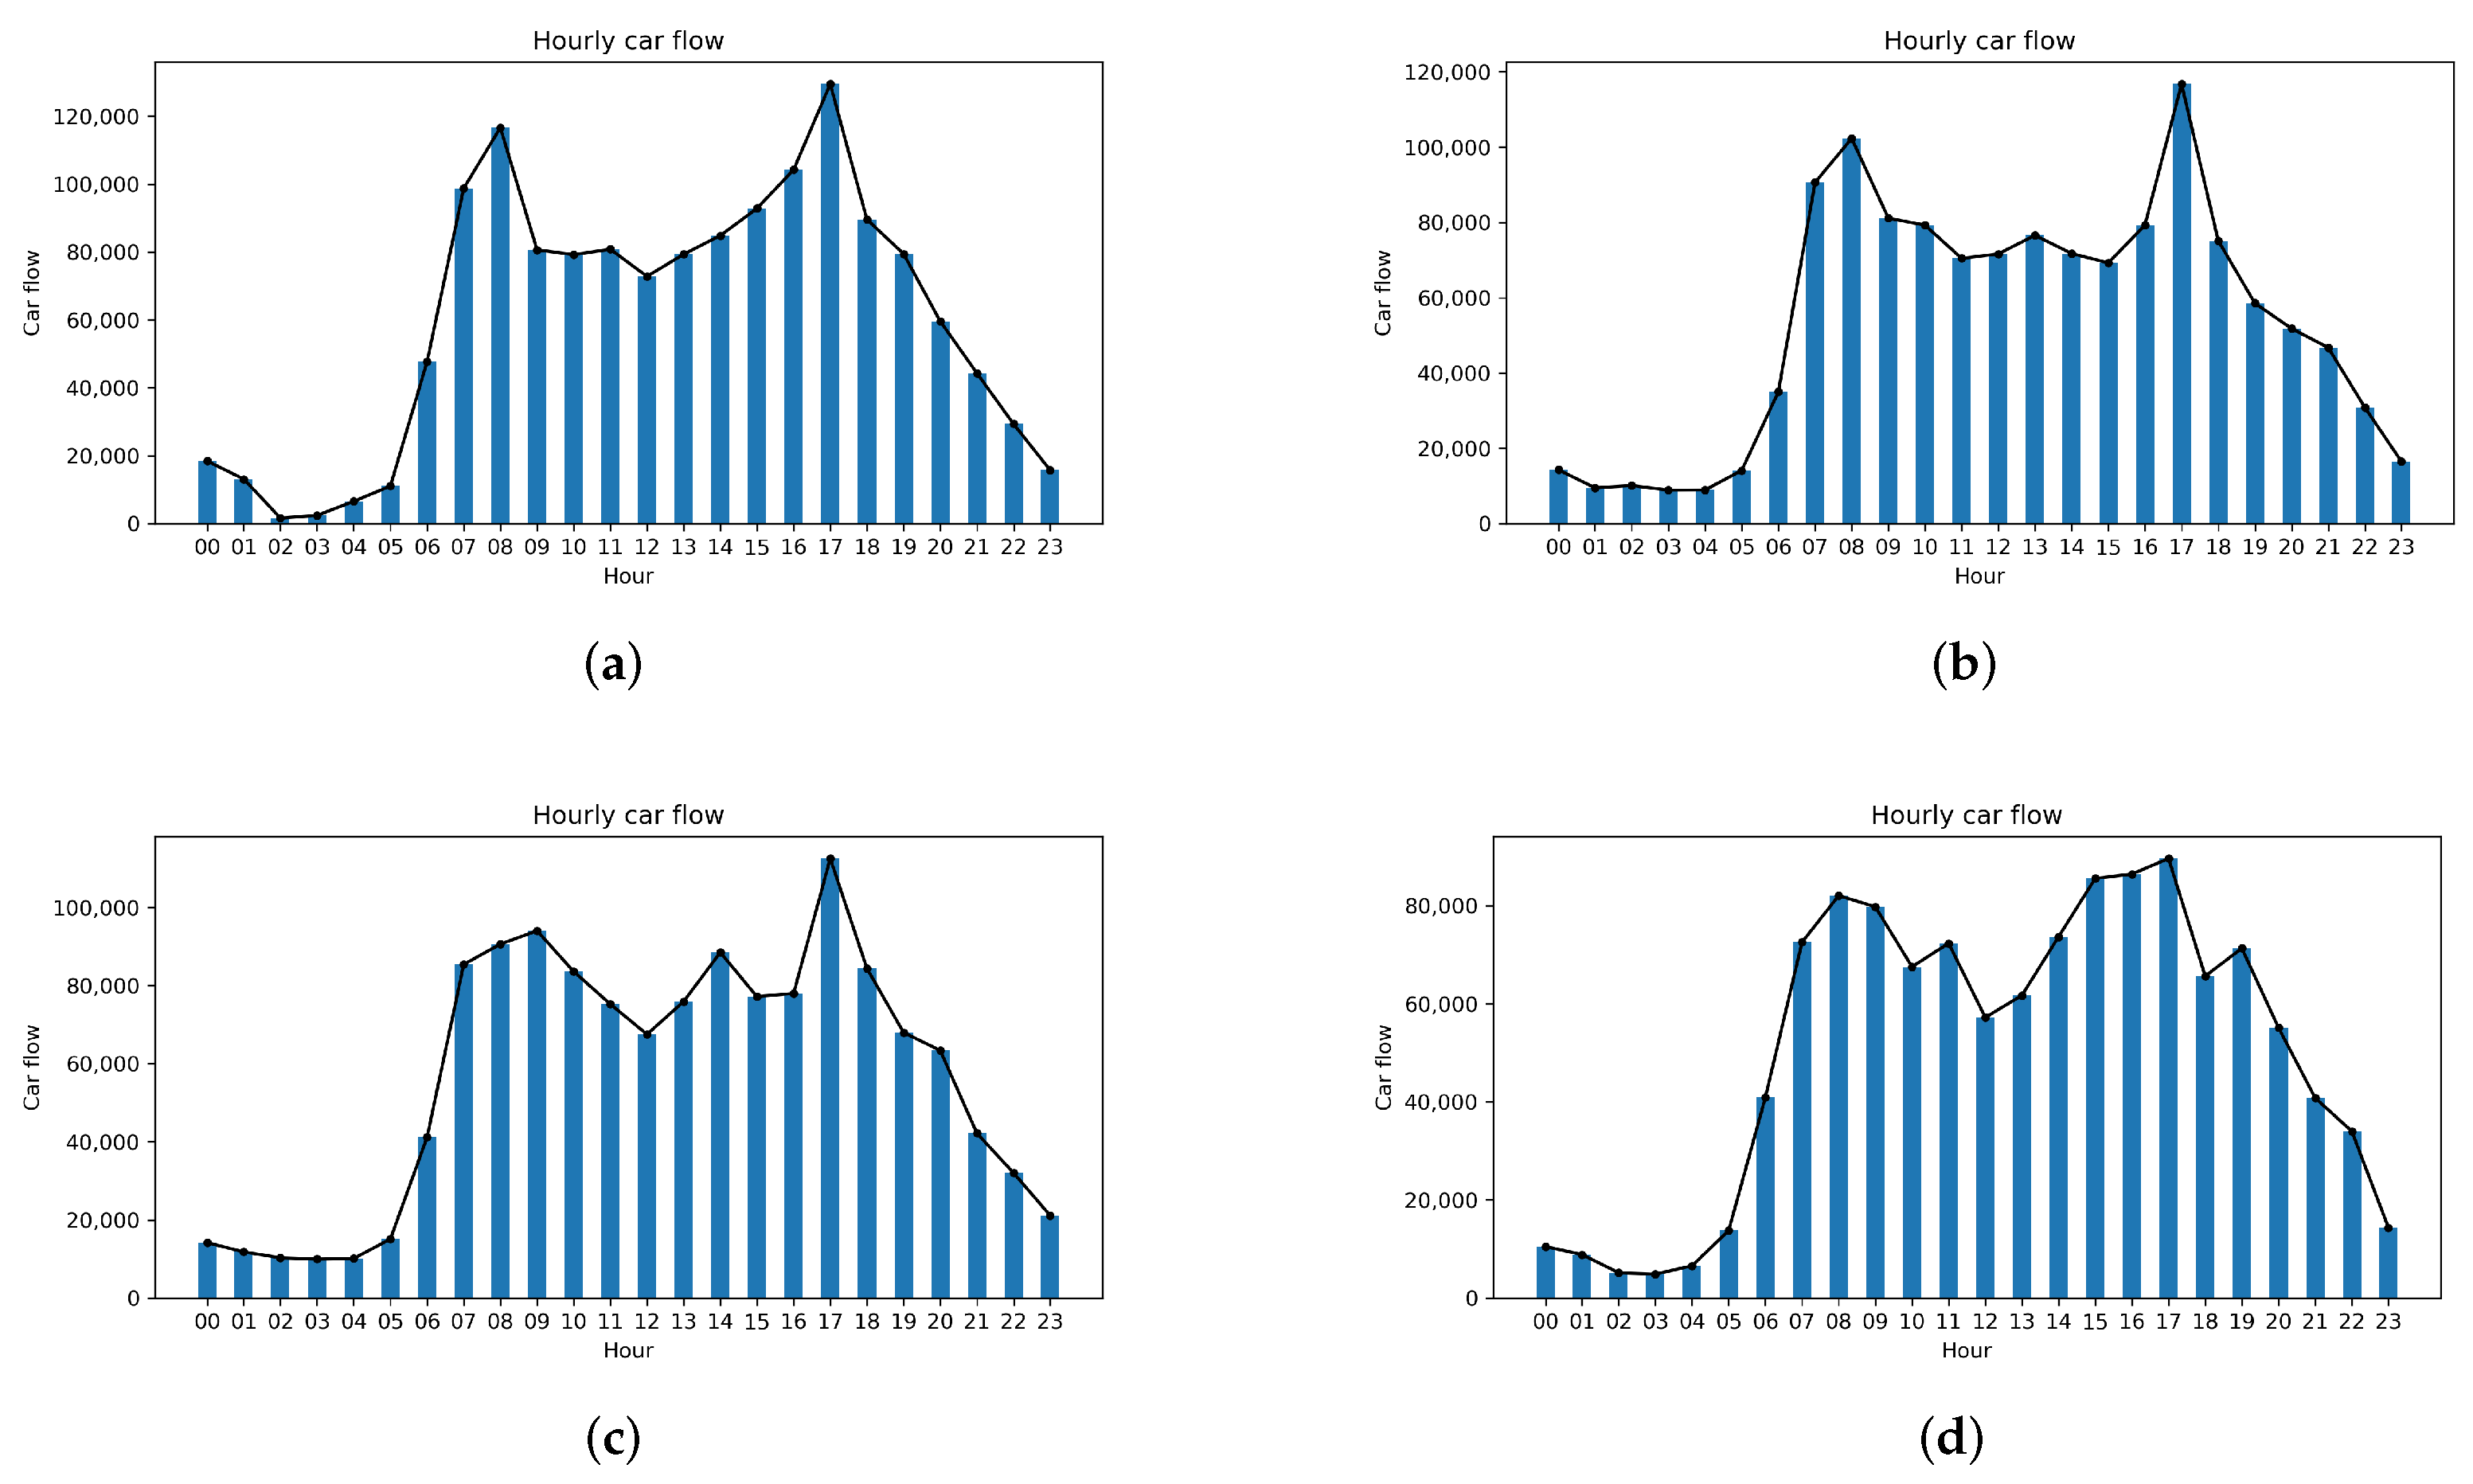
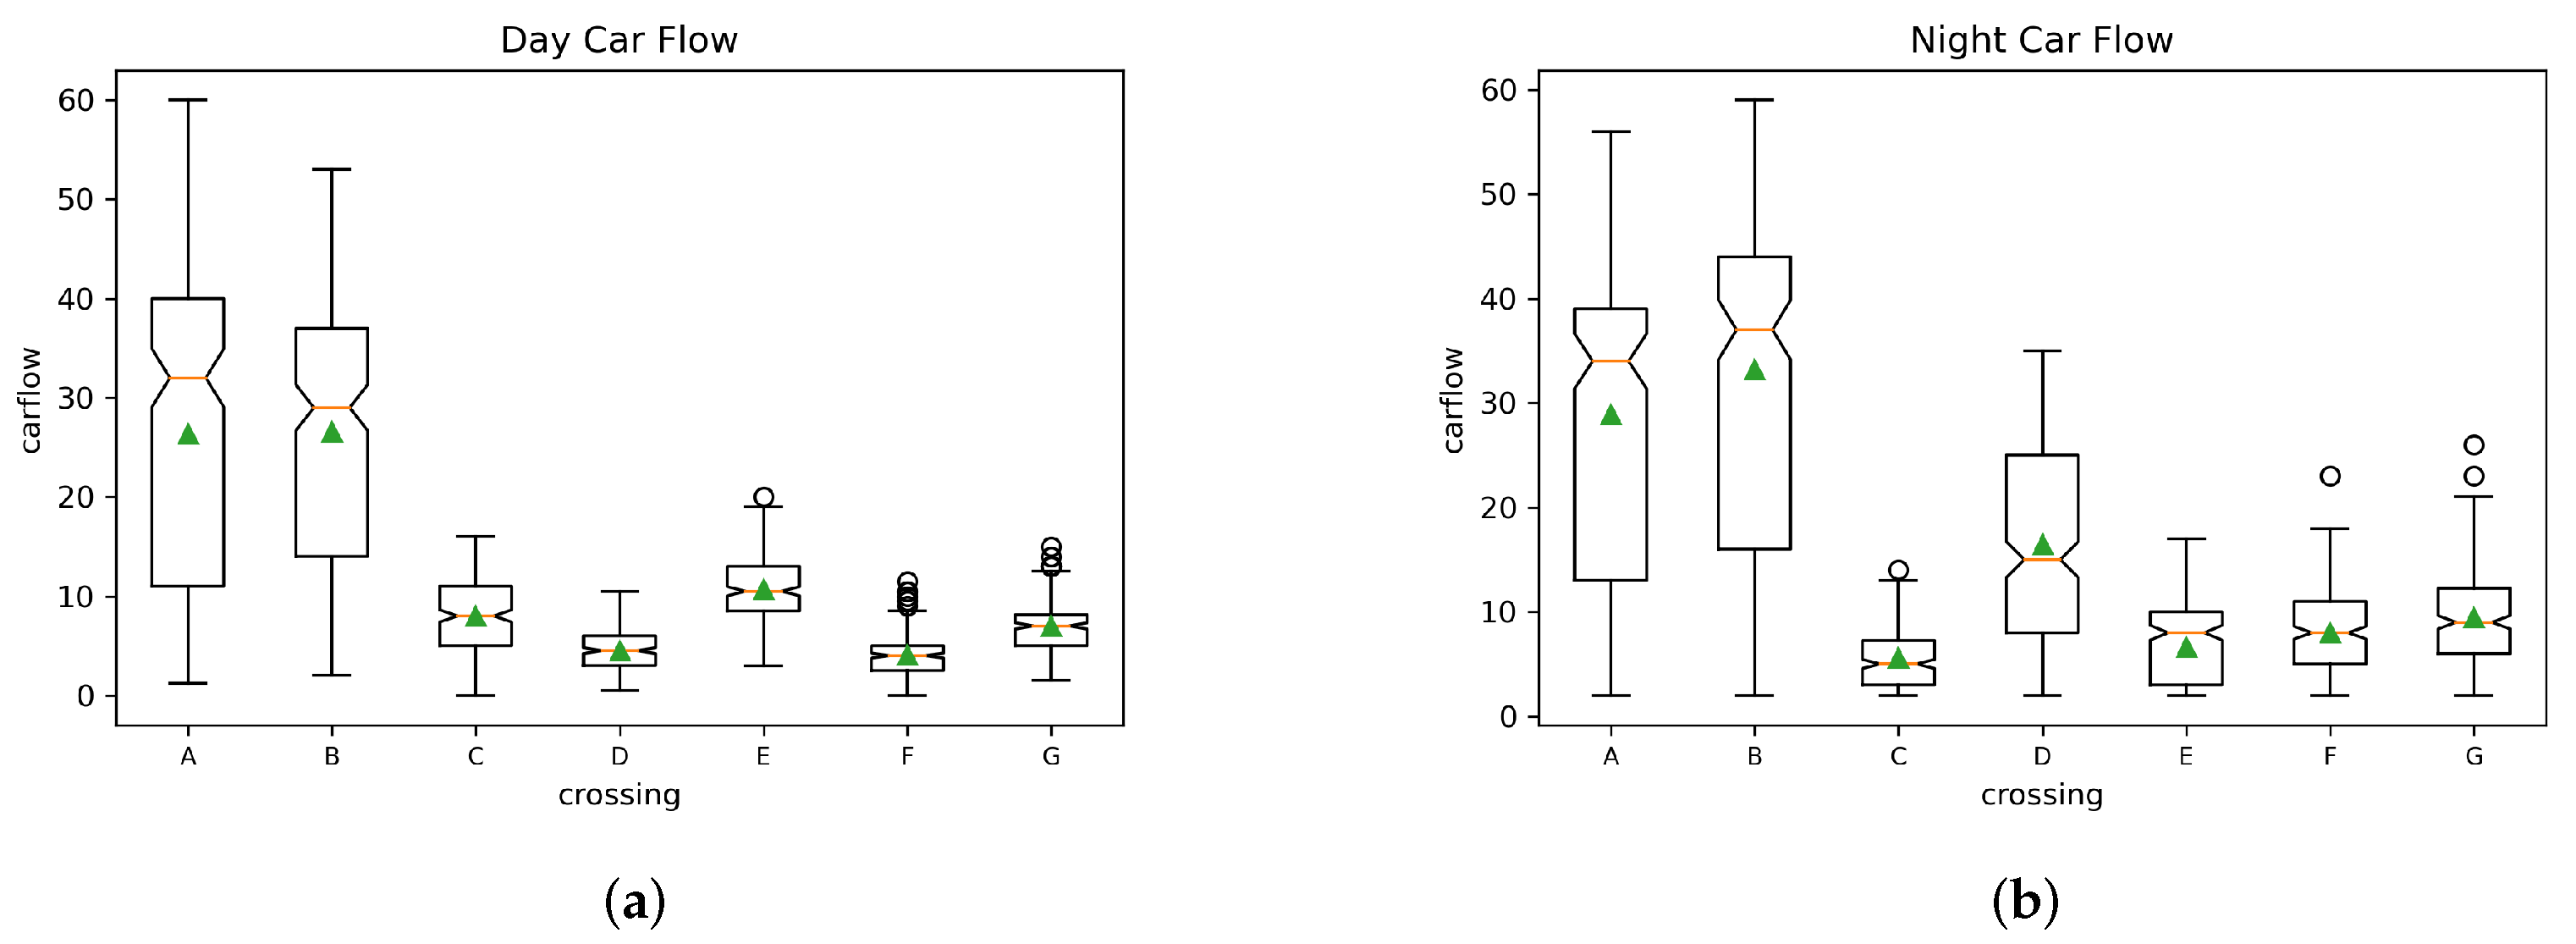
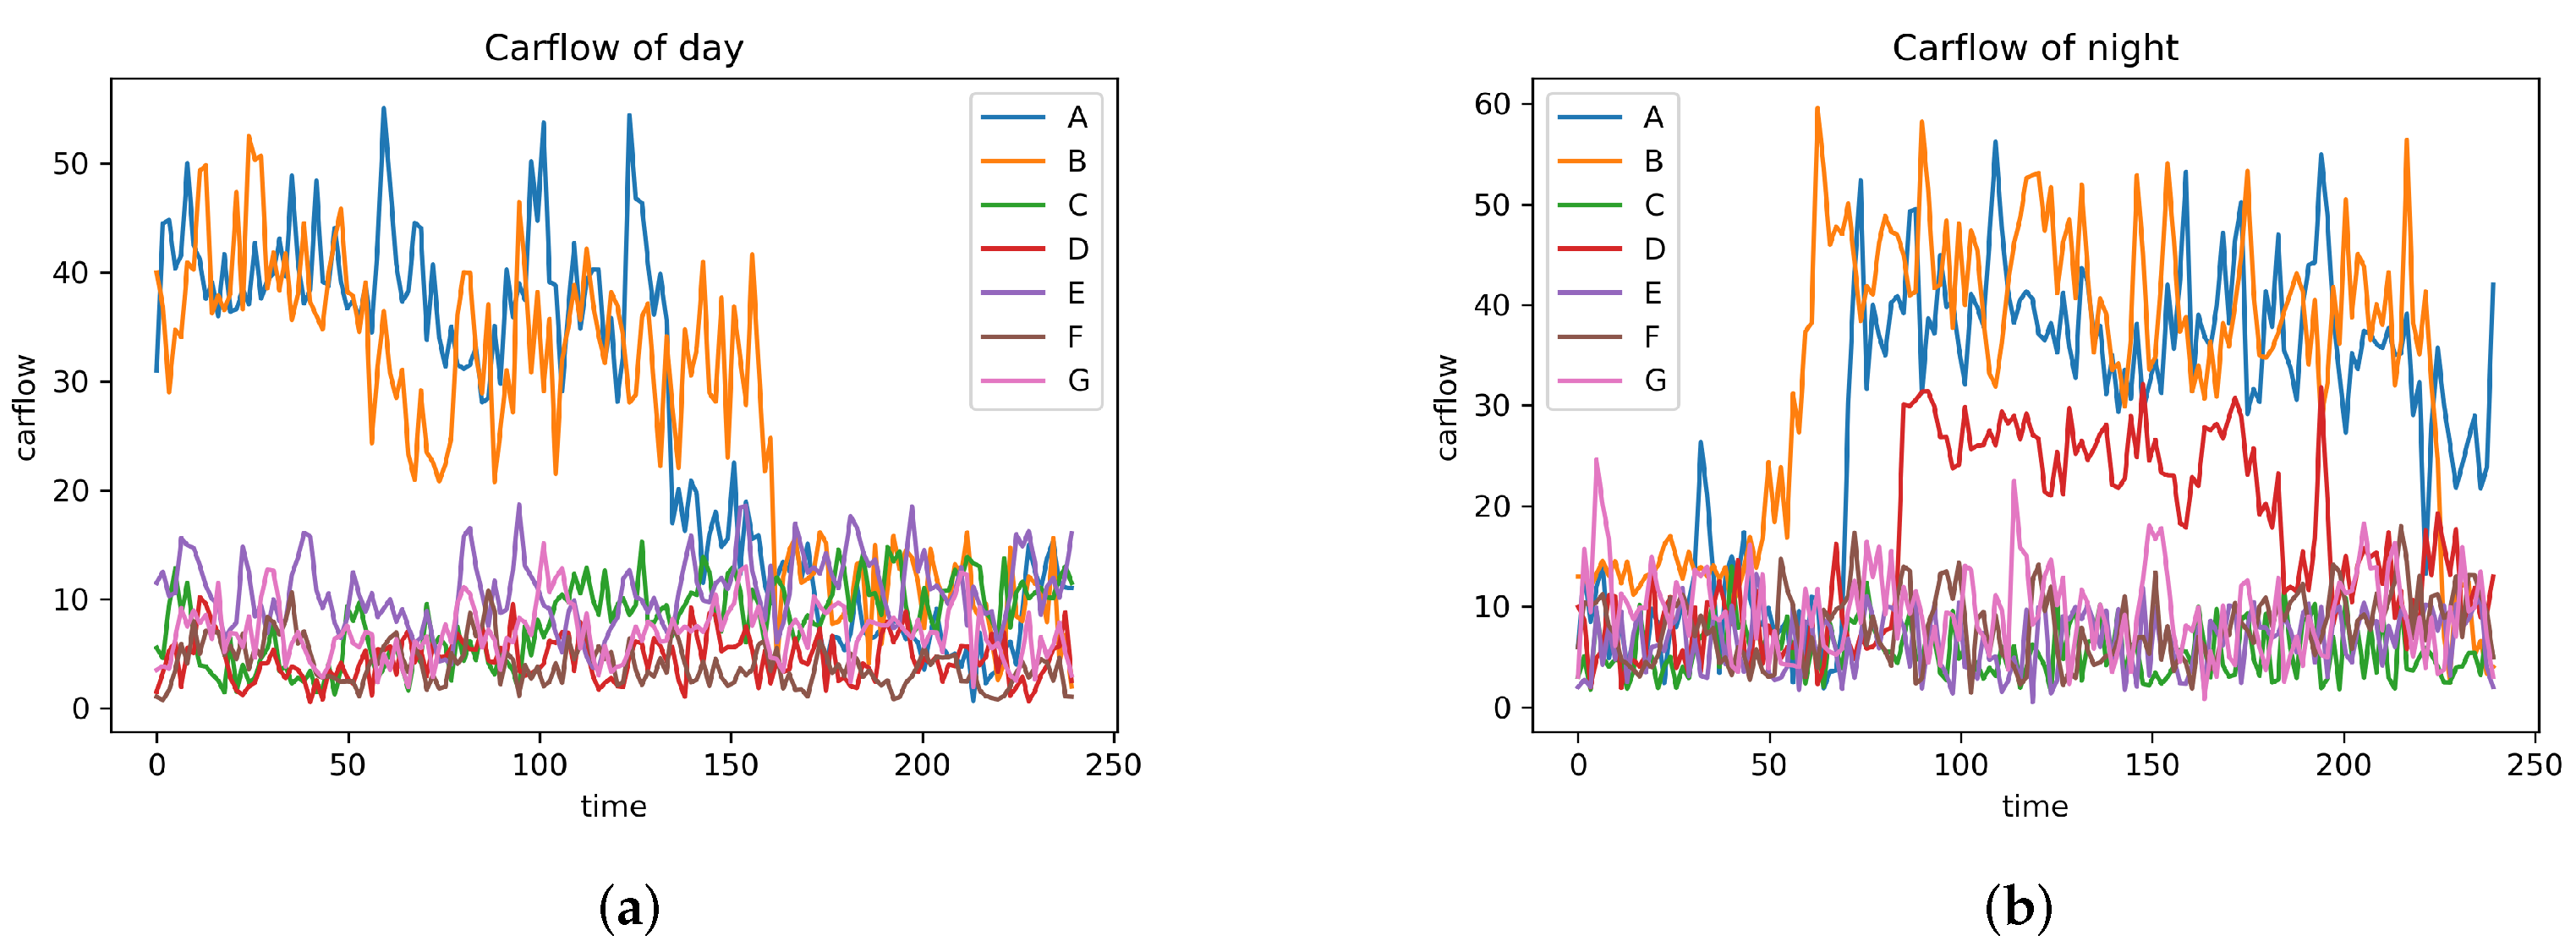
4.2.4. Time Travel Feature Mining

Based on the above GPS data, we calculated the travel data within each hour to mine the travel characteristics. As shown in Figure 6, Both (a) and (b) show obvious peak characteristics at 08 o’clock and 17 o’clock, which are the morning rush hour and evening rush hour of working days. However, the duration of rush hour travel data in (c) and (d) is significantly longer than that in (a) and (b), which proved the difference in travel characteristics between weekdays and weekends.

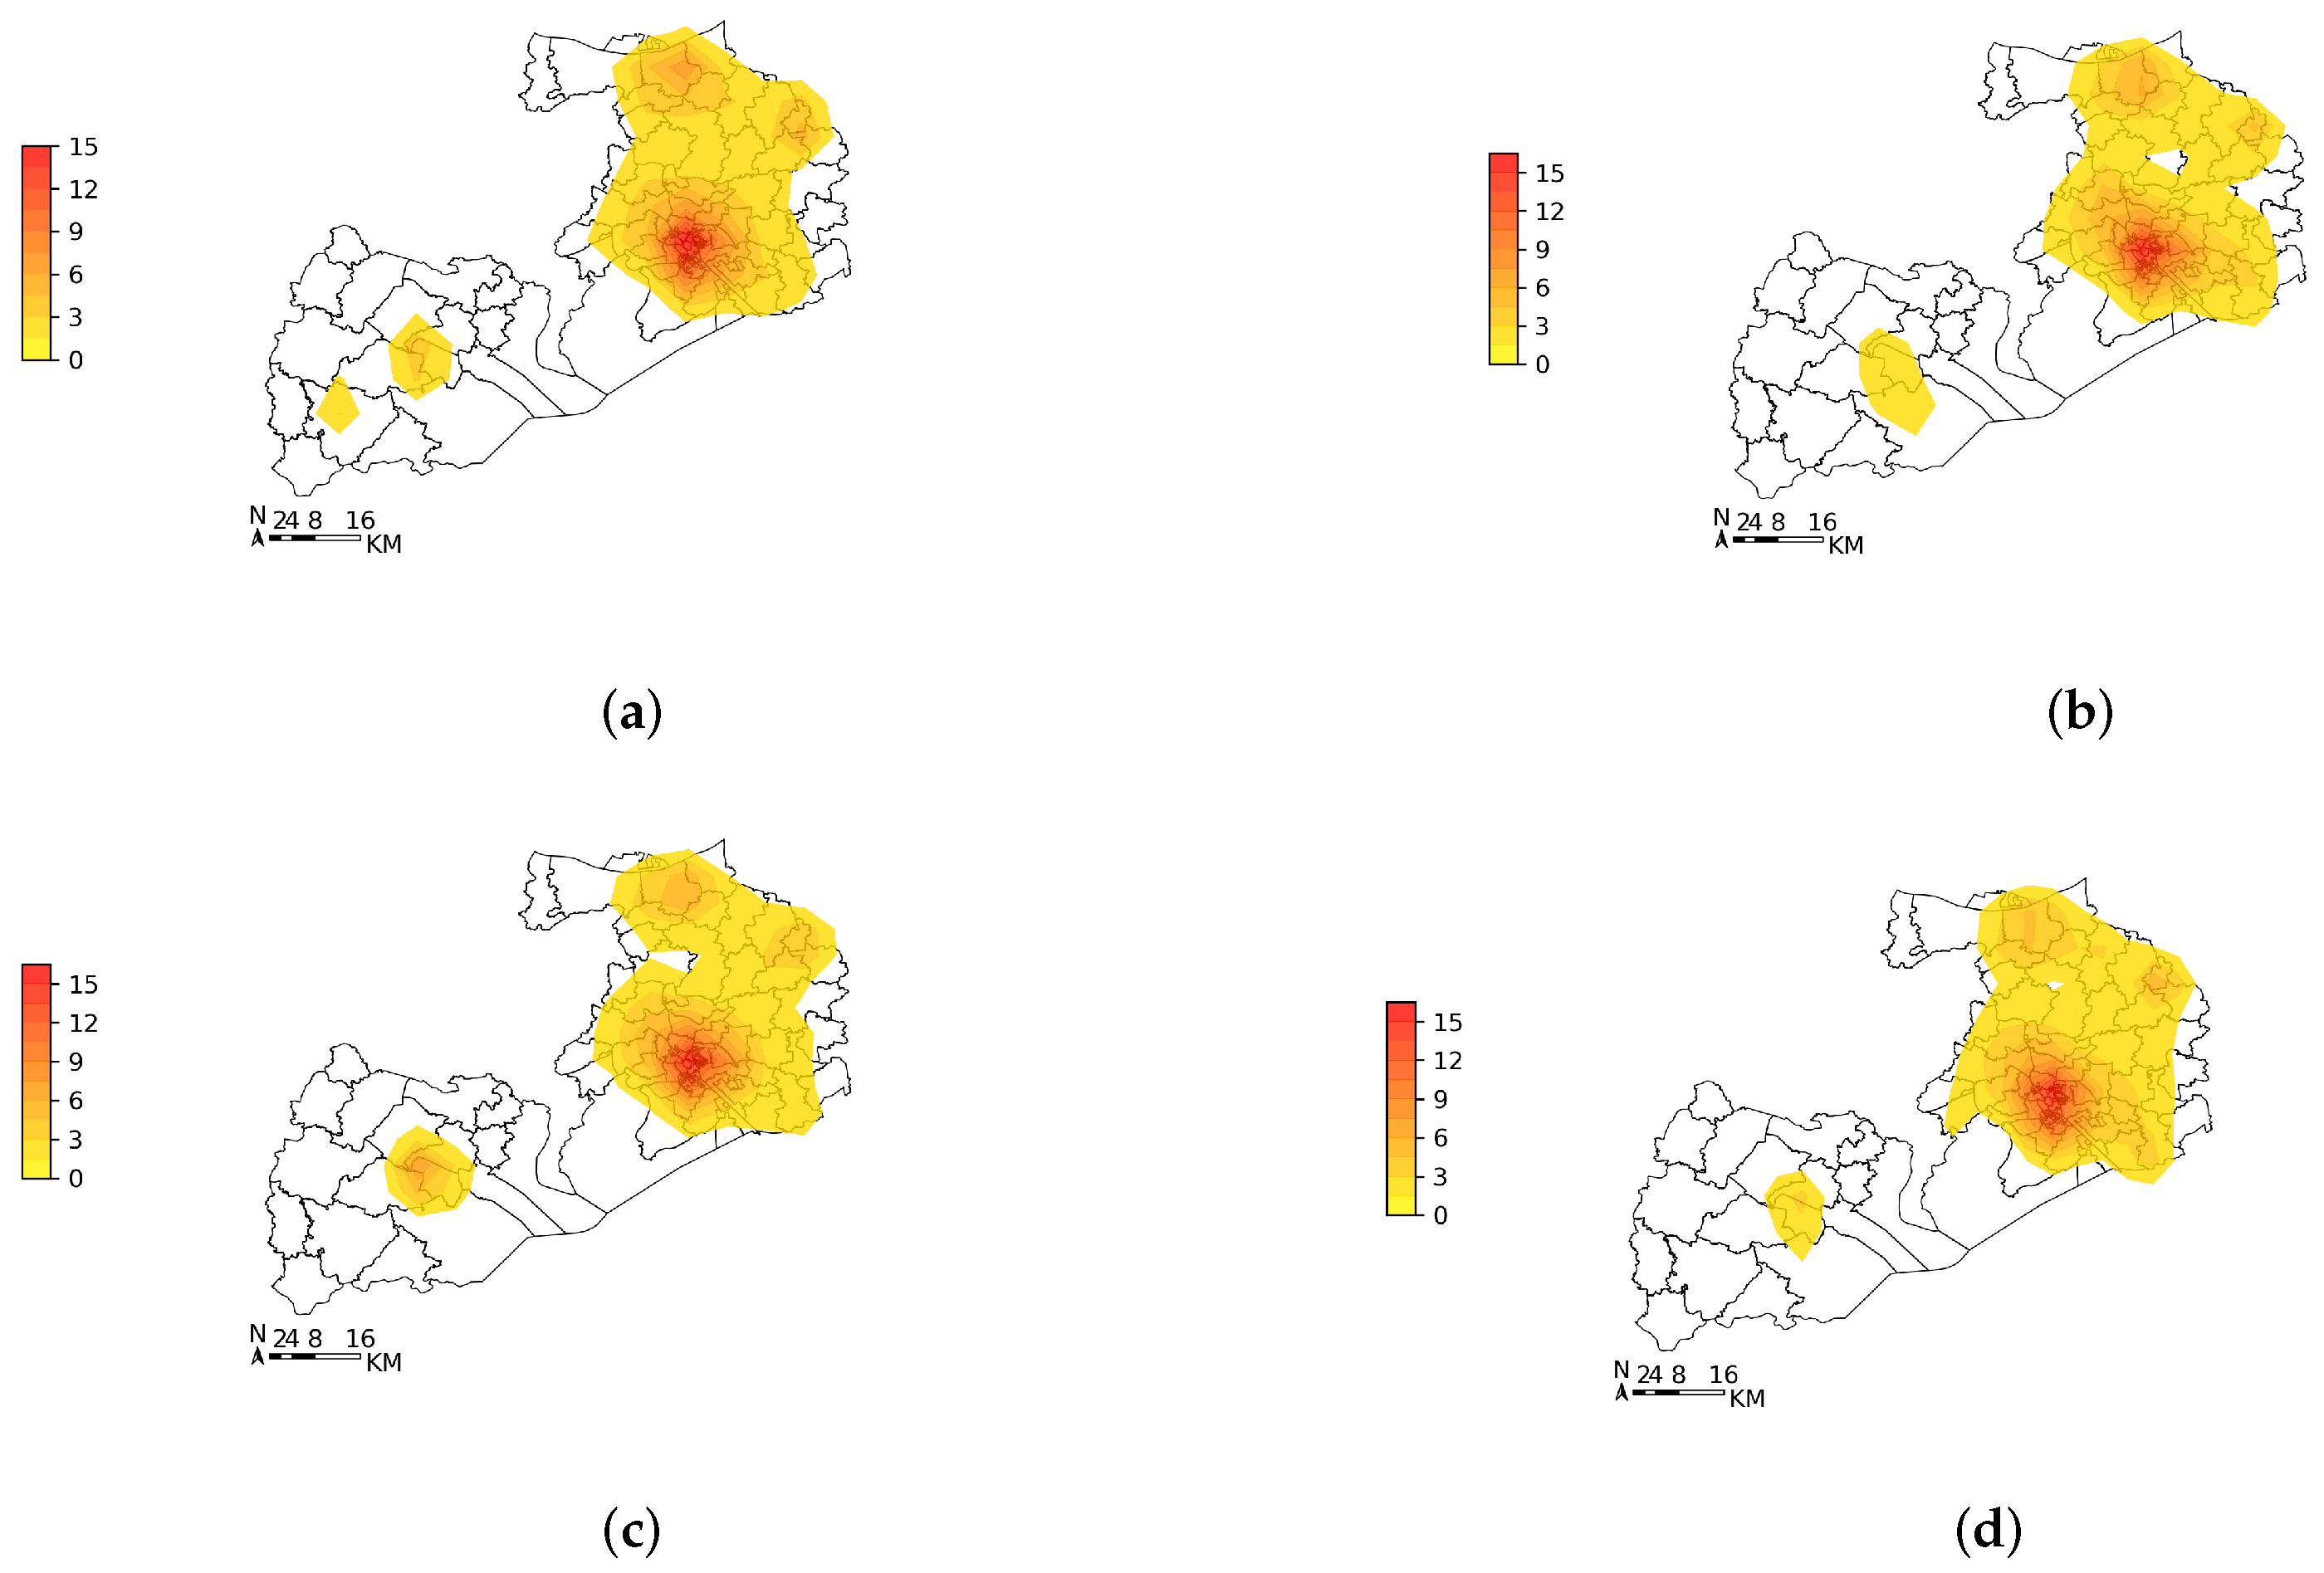
4.2.5. Spatial Travel Hotspots Mining Based on Gaussian Kernel Density Estimation

In order to capture the spatial distribution characteristics of map-matching data more intuitively, we used the kernel density estimation(KDE) method to mine the travel hotspots, and the Gaussian function was selected as the kernel function. Generally, this paper selects two working days and weekends a week for mining the hotspots. As shown in Figure 7, the data presents obvious spatial distribution characteristics, and the weekday and weekend have their own characteristics. By extracting high-density hotspots, it can be seen that Sanyang Square (red area) in the Liangxi District of Wuxi City is the central area of the city, which will be further excavated in the next chapter.

4.3. Visual Traffic Flow Detection Based on DFA

Based on the hotspots in Figure 7 and the peak hours in Figure 6, this section selected seven intersections in Sanyang Square as core data sources for further rush hour data mining.
In the case study described in this paper, UAV video data are used in conjunction with GPS data as auxiliary data for traffic flow mining. This paper designed an improved differential fusion algorithm (DFA), which extracts the moving target and reduces the sensitivity of the target to light through the method of background difference and multi-frame difference reduction, identifies and tracks the car in the UAV, calculates the traffic flow of the moving target in the detection area, and uses the similarity deduplication algorithm to cooperate with the GPS data, and the resulting data are used as a benchmark for the visualization of digital twin technology.

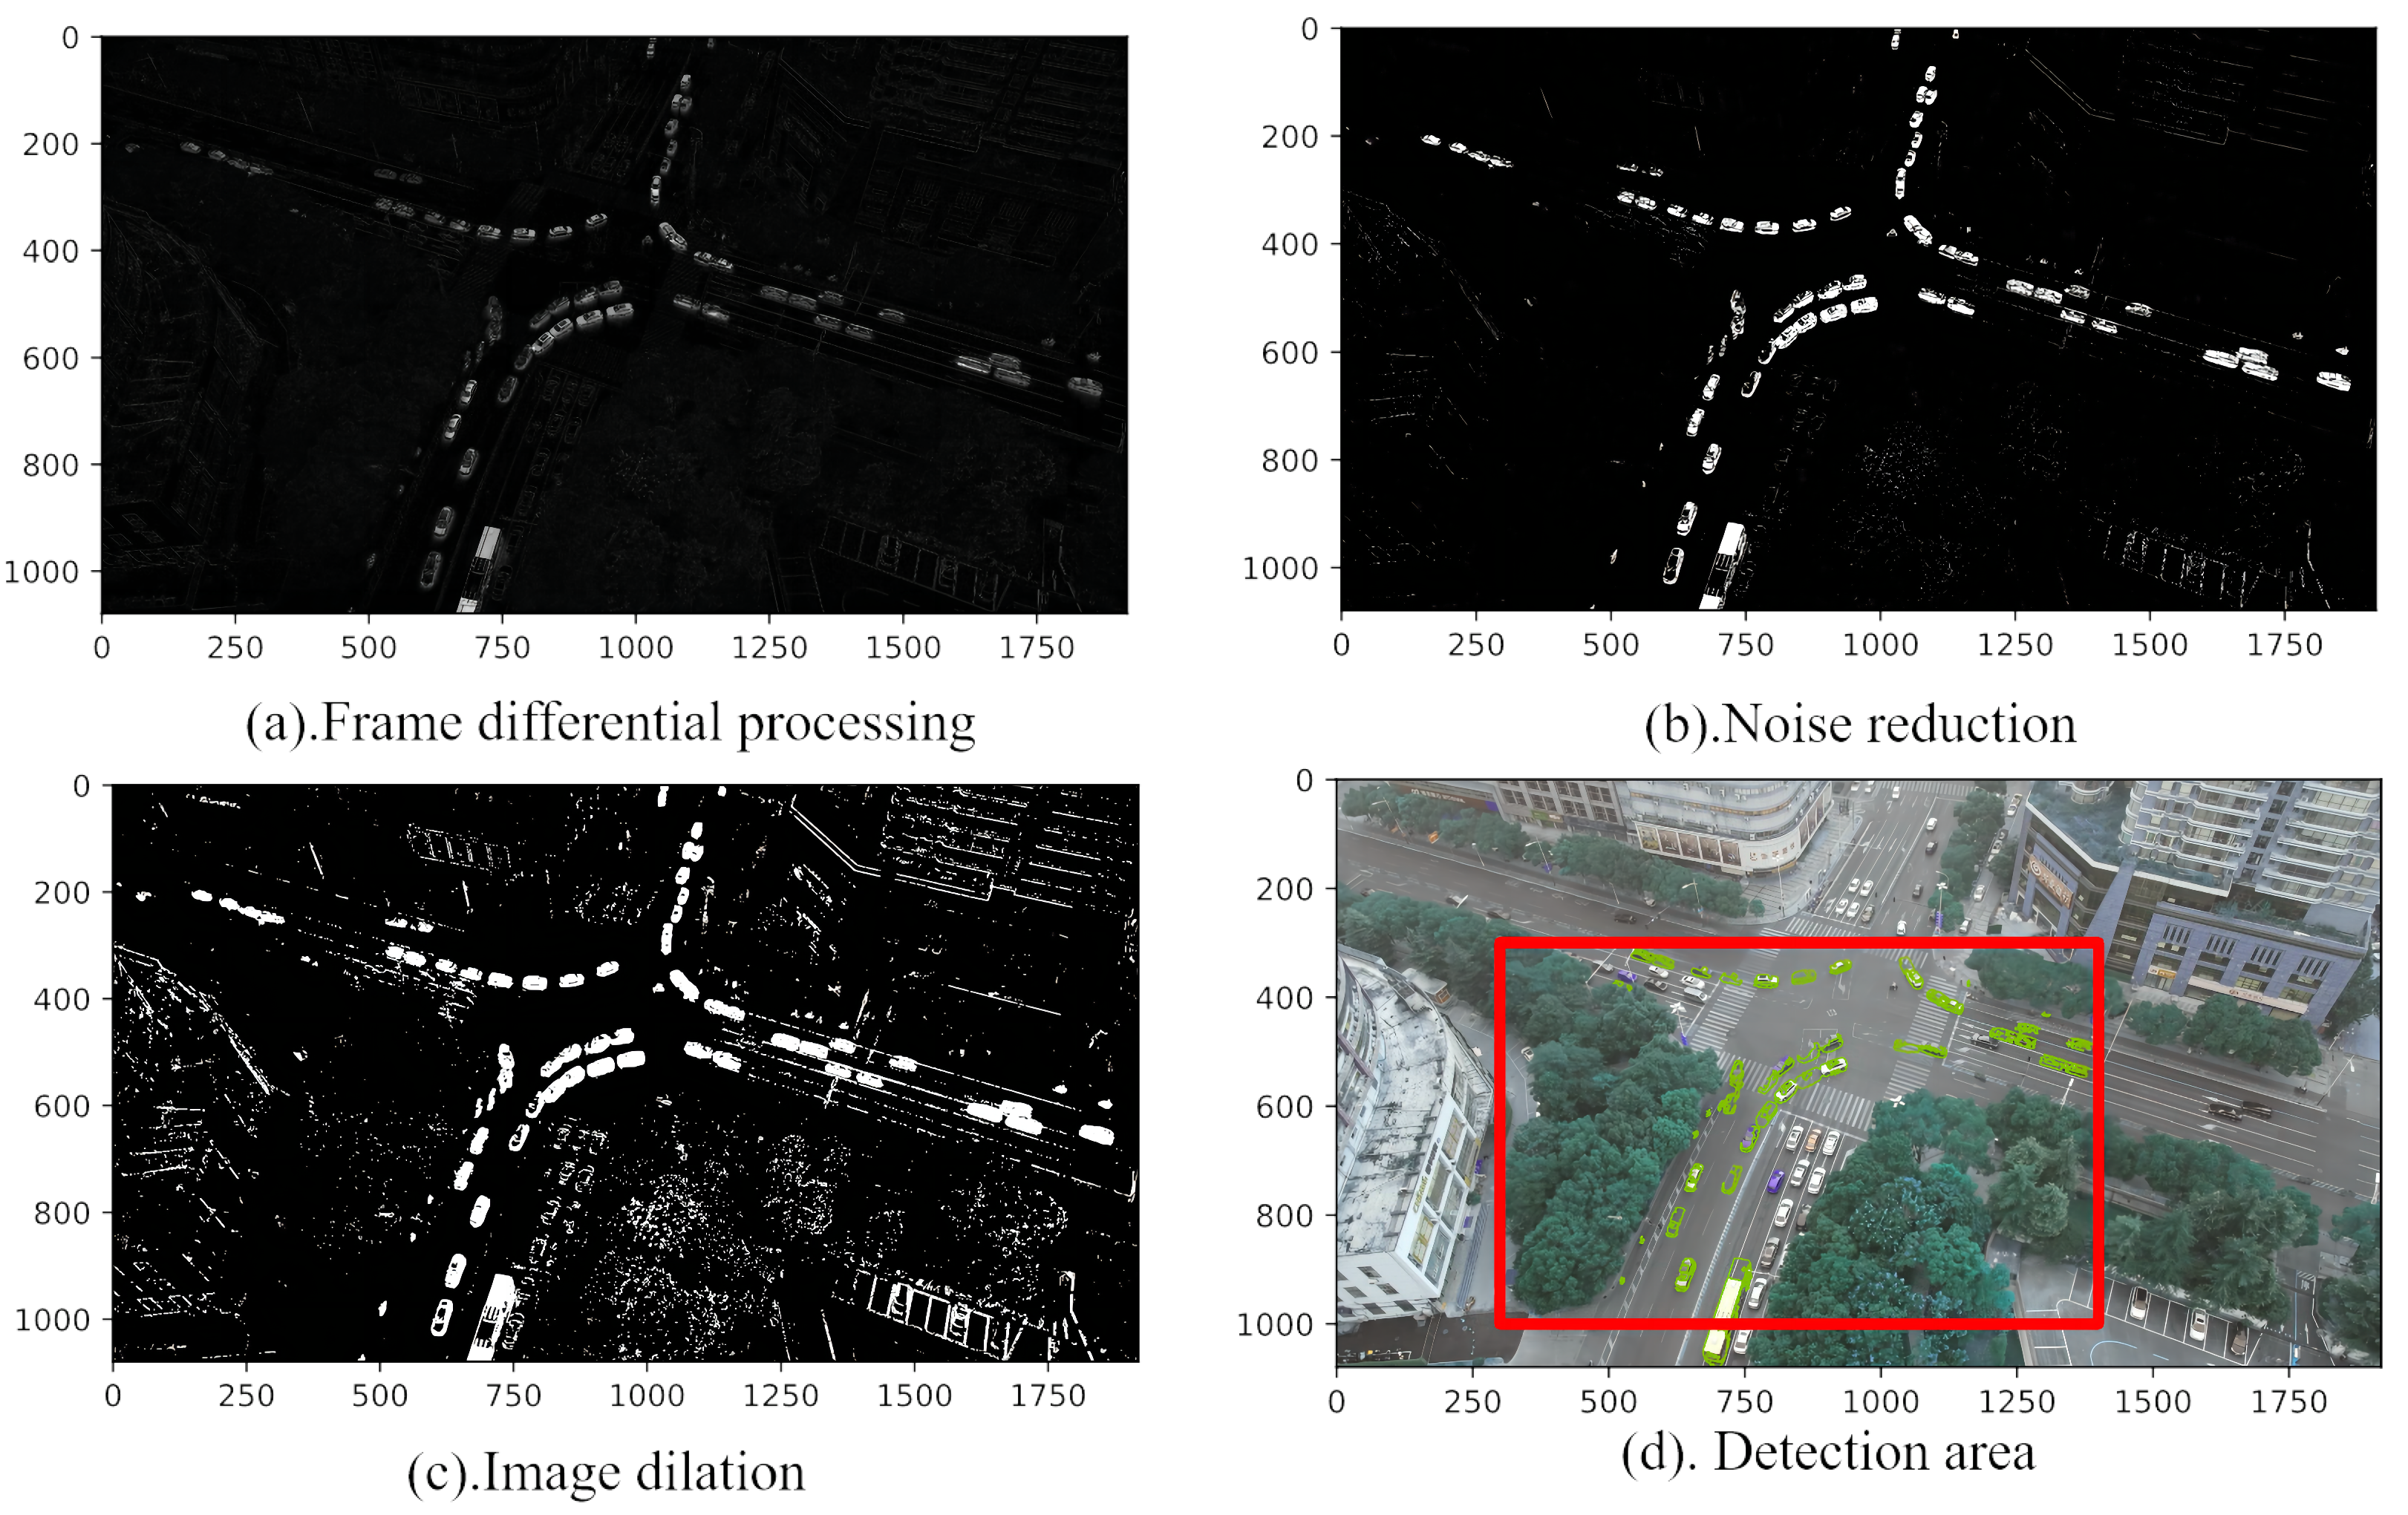
4.3.1. Differential Fusion Algorithm

The main acquisition area of UAV video is the intersection, and the vehicles at the intersection move alternately. In order to avoid repeated detection, multi-frame difference processing is performed first. The difference operation is performed between the (n + 1)th frame and the nth frame image, and between the nth frame and the (n − 1)th frame image and the moving target is selected by the difference operation between the next frame and the selected frame, as shown in Figure 8a. In the figure, the white area is the moving target, and the frame difference is defined as:
D ( n + 1 , n ) ( x , y ) = f n + 1 ( x , y ) f n ( x , y ) D ( n , n 1 ) ( x , y ) = f n ( x , y ) f n 1 ( x , y )
D M n ( x , y ) = 255 if D n ( x , y ) + D n + 1 ( x , y ) 255 D n ( x , y ) + D n + 1 ( x , y ) else
In the equation, f n ( x , y ) is the image of this frame, f n 1 ( x , y ) is the image of the previous frame, f n 1 ( x , y ) is the image of the next frame, and D M n ( x , y ) is the image after multi-frame differential processing. Then, the image D M n ( x , y ) after the multi-frame difference processing is processed by thresholding, as shown in Figure 8b. Thresholding is also a process of noise reduction. The pixels are binarized using T as a threshold, filtering out the non-connected white noise in the background. Then, the current background model is extracted, and the foreground binarized image is shown as Equation (8). Since the image has been processed previously, the extracted foreground is the foreground object of the moving target output.
B n ( x , y ) = 255 f n ( x , y ) f b n ( x , y ) > T 0 else
Due to the high shooting Angle of UAVs, some distant vehicles are blurred, so the images after thresholding are expanded to obtain a clearer binarized target image as shown in Figure 8c. Image expansion is defined as:
A B = x ( B ) x A Θ
where B is a convolution kernel with a circular shape. We used template B to convolve with image A, scan every pixel in the image, and do “and” operation with the kernel element and the binary image element. If both are 0, then the target pixel is 0, otherwise, it is 1. Thus, the maximum value of the pixel in the coverage area of B is calculated, and the pixel value of the reference point is replaced by this value to realize image dilation.

4.3.2. Boundary Detection

For the dilated binary image, we performed contour extraction based on boundary detection [34]. Its contour is drawn in Figure 8d, and the number of contours of the region of interest (ROI) is counted as the original data of the traffic flow at the intersection.

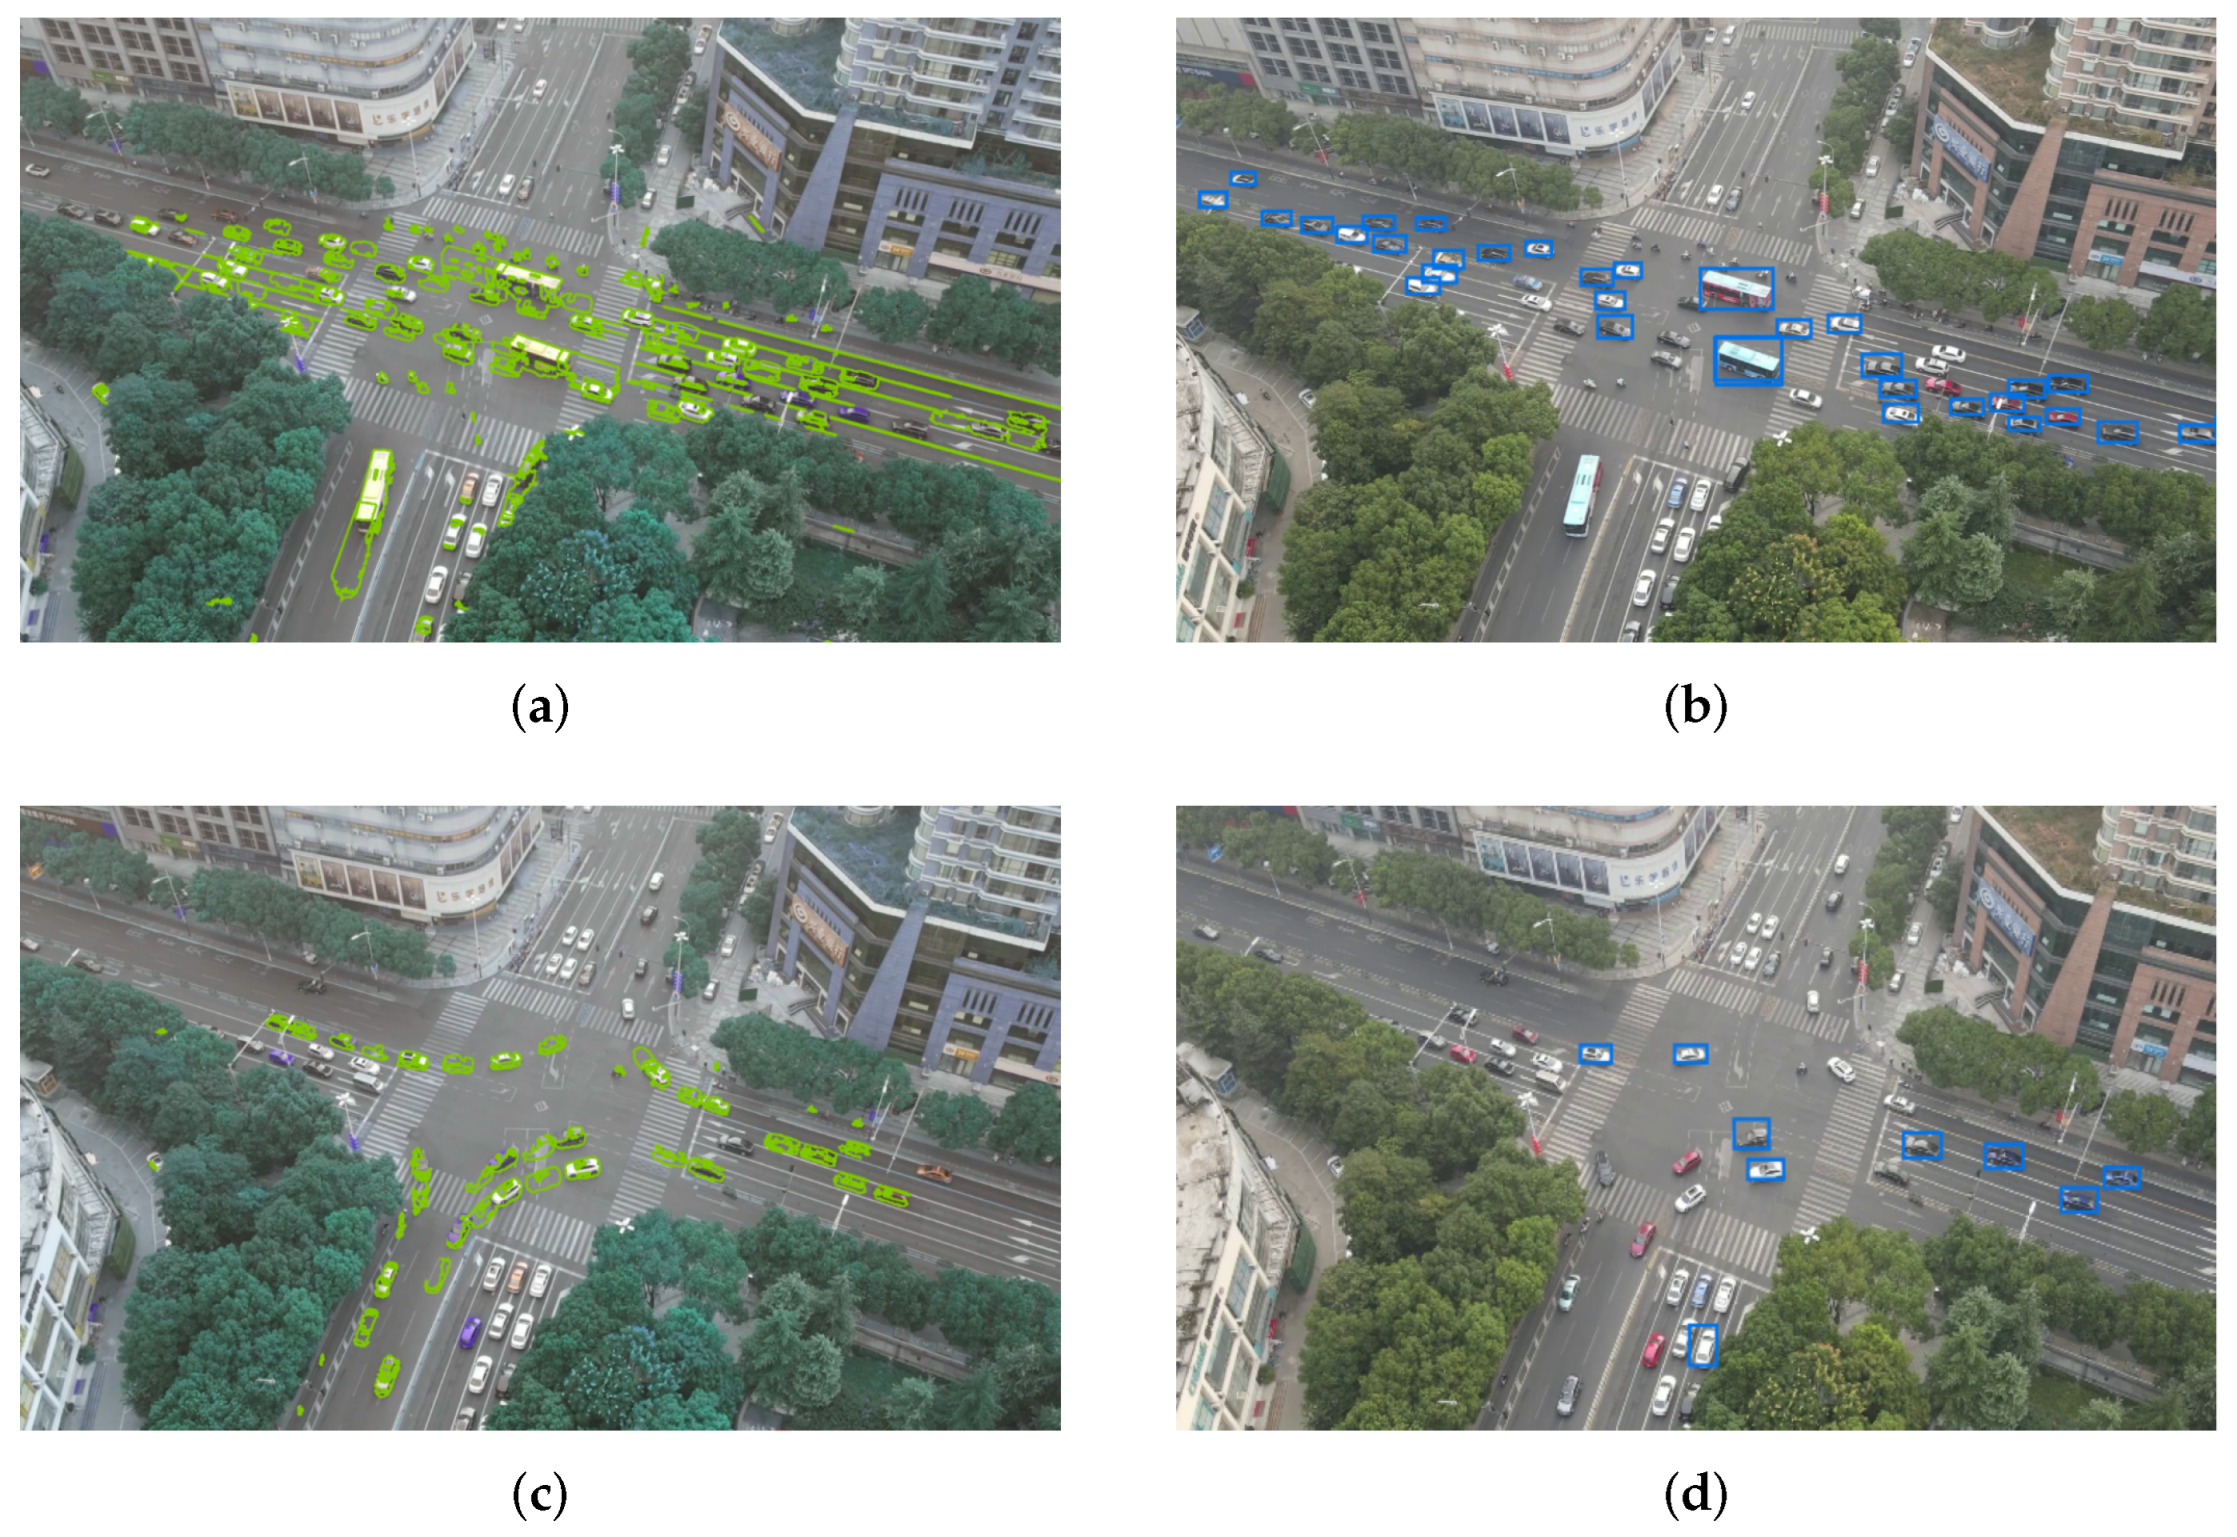
4.3.3. Duplicate Removal Based on Similarity

For the frame-by-frame images in the above detection area, we compared the similarity of the images based on the hash perception algorithm, removed the images whose similarity is greater than the threshold, compressed data, and cleaned the data to form a new image dataset. Its specific content is: First, reduce the image size, the high-frequency details are removed, and the light and dark information is retained. Second, the discrete cosine transform (DCT) is performed on the binarized image after the above image expansion processing, and the influence of noise on the image is ignored. Third, convert the DCT value to a hash value. Next, images are paired to generate Hamming distance. Then, images are filtered according to the threshold calculated by Hamming distance, and the images with high similarity were eliminated. Finally, data cleaning, retrieving the original data according to the image number and updating it.

4.3.4. Traffic Flow Mining

Based on contour detection, our above-deduplicated image collection is mined and extended to real intersections.
In this paper, we selected seven intersections in Wuxi commercial centre to mine the travel traffic flow from 8:00 to 9:00 in the morning and 17:30–18:30 in the evening. As shown in the box plot in Figure 9, the traffic flow variance between intersections A and B during the morning rush hour and intersections A, B, and D during the evening rush hour is large, so they are marked as key mining intersections.
Based on the above analysis, the traffic flow data mining based on DFA is further carried out at key intersections. As can be seen in Figure 10a, intersection A and intersection B show obvious morning peak characteristics, and the traffic flow continues to show a congestion trend from 8:00 to 8:44, and then drops sharply from 8:45. As can be seen from Figure 10b, intersections A, B and D show an obvious evening peak trend, with a sharp increase in traffic flow from 17:45 and continued congestion thereafter.

4.3.5. Target Detection Effect Comparison

Due to the small number of pixels occupied by vehicles in the high-altitude video captured by UAV, the effect of using yolov2 for object detection is not good. We used the number of real vehicles manually counted frame-by-frame as a baseline to calculate the accuracy. The yolov2 algorithm was selected to compare with the differential fusion algorithm designed in this paper for small target identification, and the accuracy of this paper was higher than that of yolov2. Without loss of generality, we randomly selected two frames for comparison. In Figure 11, the blue is the target object recognized by yolov2, and the green is the target object recognized by the fusion algorithm designed in this paper. Since the target object is a moving object, the proposed algorithm is obviously better than yolov2 in the small target environment as shown in Table 4.

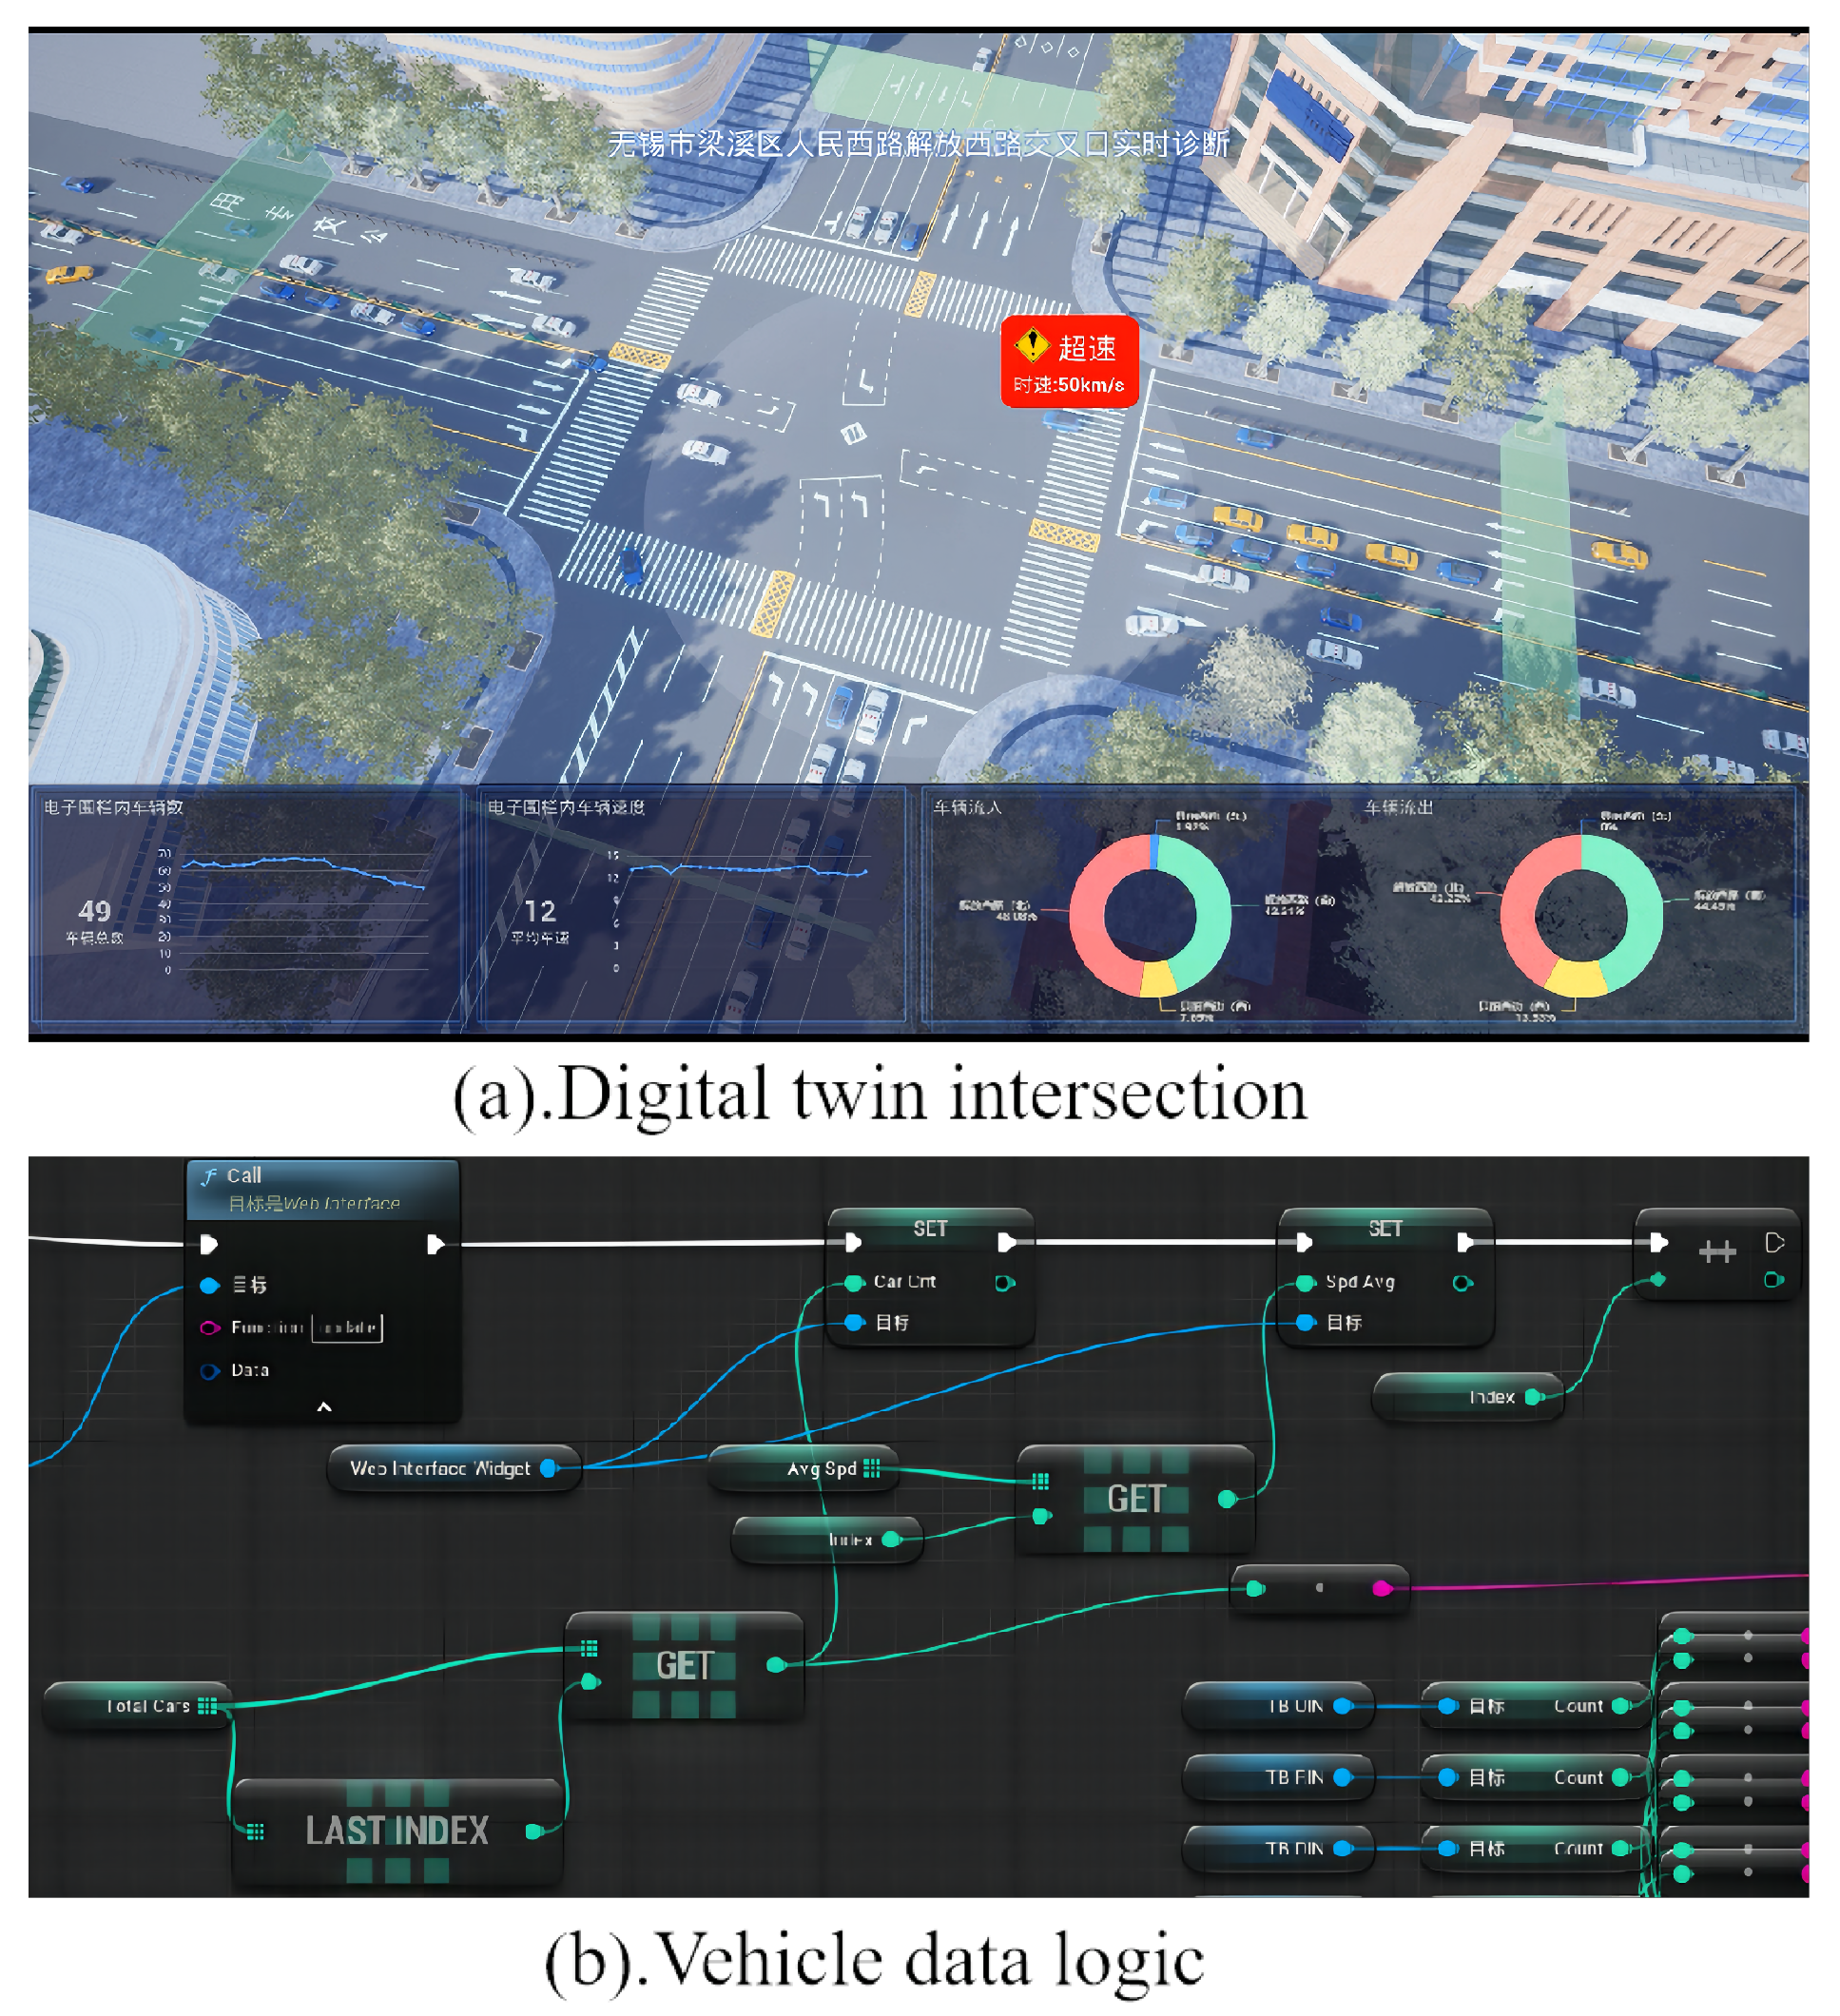
4.4. Digital Twin Visualization

In this paper, UE4 software is used to construct a digital twin scene for the real intersection as the twin of traffic flow data. The BPCounterTB blueprint class is constructed to count the inflow and outflow of vehicles at intersections. The BPTotalTB blueprint class, placed in the centre of the digital twin intersection, is used to count the total number of vehicles in the electronic fence of the intersection. Build the MyHUD blueprint class, and visualize its car flow using the Echarts HTML chart file. The constructed digital twin intersection and vehicle data logic are shown in Figure 12.

5. Conclusions

Aiming at digital twin technology and intelligent traffic control, this paper proposed a digital twin data collaboration framework based on ITS. This framework improves the data type of the traditional digital twin system, integrates multi-dimensional and multi-state data into the data collaboration framework, and maps the physical world and the information world to virtual and real, and represents specific use cases.
The focus of this paper is to put forward a collaborative framework of multi-dimensional and multi-source data of intelligent transportation based on a digital twin system, improve the data type and show an application example. Later, we will conduct simulation analysis at the algorithm level based on the above data collaboration framework. We will use the average speed indicator, the number and length of traffic congestion signal lamp timing, travel cost and other factors to improve the entire digital twin system. At the same time, we will provide data support for road visualization, traffic and passenger flow modelling and traffic light control services.

Author Contributions

X.Z. (Xihou Zhang), conceptualisation, methodology, software, data curation, formal analysis, validation, visualization, investigation, writing—original draft, and writing—review and editing; D.H., conceptualisation, resources, validation, writing—review and editing, supervision, project administration and funding acquisition; X.Z. (Xiaobo Zhang), visualization and investigation; L.F., visualization and investigation. All authors have read and agreed to the published version of the manuscript.

Funding

The research was funded by the National Natural Science Foundation of China (Grant No. 11875133, 12147101, and 11075057) and the Science and Technology Commission of Shanghai Municipality (Grant No. 22JC1402500).

Institutional Review Board Statement

Not applicable.

Informed Consent Statement

Not applicable.

Data Availability Statement

Not applicable.

Acknowledgments

We wish to acknowledge the support of the National Natural Science Foundation of China (Grant No. 11875133, 12147101, and 11075057) and the Science and Technology Commission of Shanghai Municipality (Grant No. 22JC1402500).

Conflicts of Interest

The authors declare no conflict of interest.

Abbreviations

The following abbreviations are used in this manuscript:
ITSIntelligent Transportation System
3DThree-Dimension
IoTInternet of Things
AIArtificial Intelligence
NASANational Aeronautics and Space Administration
BIMBuilding Information Modeling
UE4Unreal Engine 4
UAVUnmanned Aerial Vehicle
DFADifferential Fusion Algorithm
KDEKernel Density Estimation
DCTDiscrete Cosine Transform
ROIRegion of Interest

References

  1. Cha, H.J.; Yang, H.K.; Song, Y.J. A Study on Vehicle Monitoring Service Using Attribute-Based Security Scheme in Cyber–Physical Systems. Appl. Sci. 2022, 12, 4300. [Google Scholar] [CrossRef]
  2. Grieves, M.W. Product lifecycle management: The new paradigm for enterprises. Int. J. Prod. Dev. 2005, 2, 71–84. [Google Scholar] [CrossRef]
  3. Grieves, M. Virtually Perfect: Driving Innovative and Lean Products through Product Lifecycle Management; Space Coast Press: Melbourne, FL, USA, 2011. [Google Scholar]
  4. Grieves, M.; Vickers, J. Digital twin: Mitigating unpredictable, undesirable emergent behavior in complex systems. In Transdisciplinary Perspectives on Complex Systems; Springer: Berlin/Heidelberg, Germany, 2017; pp. 85–113. [Google Scholar]
  5. Redelinghuys, A.; Basson, A.H.; Kruger, K. A six-layer architecture for the digital twin: A manufacturing case study implementation. J. Intell. Manuf. 2019, 31, 1383–1402. [Google Scholar] [CrossRef]
  6. Tao, F.; Liu, W.; Zhang, M.; Hu, T.; Qi, Q.; Zhang, H.; Sui, F.; Wang, T.; Xu, H.; Huang, Z.; et al. Five-dimension digital twin model and its ten applications. Comput. Integr. Manuf. Syst. 2019, 25, 1–18. [Google Scholar]
  7. Wu, C.; Zhou, Y.; Pessôa, M.V.P.; Peng, Q.; Tan, R. Conceptual digital twin modeling based on an integrated five-dimensional framework and TRIZ function model. J. Manuf. Syst. 2021, 58, 79–93. [Google Scholar] [CrossRef]
  8. Yiu, C.Y.; Ng, K.K.; Lee, C.H.; Chow, C.T.; Chan, T.C.; Li, K.C.; Wong, K.Y. A digital twin-based platform towards intelligent automation with virtual counterparts of flight and air traffic control operations. Appl. Sci. 2021, 11, 10923. [Google Scholar] [CrossRef]
  9. Tao, F.; Zhang, H.; Liu, A.; Nee, A.Y. Digital twin in industry: State-of-the-art. IEEE Trans. Ind. Inform. 2018, 15, 2405–2415. [Google Scholar] [CrossRef]
  10. JIANG, H.; DING, G.; ZHANG, J. Evolution and Operation Mechanism of Digital Twin Shopfloors. China Mech. Eng. 2020, 31, 824. [Google Scholar]
  11. Cheng, J.; Zhang, H.; Tao, F.; Juang, C.F. DT-II: Digital twin enhanced Industrial Internet reference framework towards smart manufacturing. Robot. Comput.-Integr. Manuf. 2020, 62, 101881. [Google Scholar] [CrossRef]
  12. Negri, E.; Fumagalli, L.; Macchi, M. A review of the roles of digital twin in CPS-based production systems. Procedia Manuf. 2017, 11, 939–948. [Google Scholar] [CrossRef]
  13. Levina, A.I.; Dubgorn, A.S.; Iliashenko, O.Y. Internet of things within the service architecture of intelligent transport systems. In Proceedings of the 2017 European Conference on Electrical Engineering and Computer Science (EECS), Bern, Switzerland, 17–19 November 2017; pp. 351–355. [Google Scholar]
  14. Kaewunruen, S.; Rungskunroch, P.; Welsh, J. A digital-twin evaluation of net zero energy building for existing buildings. Sustainability 2019, 11, 159. [Google Scholar] [CrossRef]
  15. Delbrügger, T.; Lenz, L.T.; Losch, D.; Roßmann, J. A navigation framework for digital twins of factories based on building information modeling. In Proceedings of the 2017 22nd IEEE International Conference on Emerging Technologies and Factory Automation (ETFA), Limassol, Cyprus, 12–15 September 2017; pp. 1–4. [Google Scholar]
  16. Pan, B.; Zheng, Y.; Wilkie, D.; Shahabi, C. Crowd sensing of traffic anomalies based on human mobility and social media. In Proceedings of the 21st ACM SIGSPATIAL International Conference on Advances in Geographic Information Systems, Orlando, FL, USA, 5–8 November 2013; pp. 344–353. [Google Scholar]
  17. Guo, Y.; Li, B.; Lu, Z.; Zhou, J. A novel method for road network mining from floating car data. Geo-Spat. Inf. Sci. 2021, 25, 197–211. [Google Scholar] [CrossRef]
  18. Magsino, E.R. Investigating the operational dynamics of different transportation modes in vehicular networks. In Proceedings of the 2021 International Conference on Information Technology (ICIT), Amman, Jordan, 14–15 July 2021; pp. 246–250. [Google Scholar]
  19. Felemban, E.; Ur Rehman, F. An Interactive Analysis Platform for Bus Movement: A Case Study of One of the World’s Largest Annual Gathering. In IoT for Sustainable Smart Cities and Society; Springer: Berlin/Heidelberg, Germany, 2022; pp. 125–143. [Google Scholar]
  20. Wang, S.; Niu, X.; Fournier-Viger, P.; Zhou, D.; Min, F. A graph based approach for mining significant places in trajectory data. Inf. Sci. 2022, 609, 172–194. [Google Scholar] [CrossRef]
  21. Chen, C.; Ma, J.; Susilo, Y.; Liu, Y.; Wang, M. The promises of big data and small data for travel behavior (aka human mobility) analysis. Transp. Res. Part C Emerg. Technol. 2016, 68, 285–299. [Google Scholar] [CrossRef]
  22. Wang, Y.; Zheng, Y.; Liu, T. A noise map of New York city. In Proceedings of the 2014 ACM International Joint Conference on Pervasive and Ubiquitous Computing: Adjunct Publication, Seattle, WA, USA, 13–17 September 2014; pp. 275–278. [Google Scholar]
  23. Yuan, J.; Zheng, Y.; Zhang, C.; Xie, W.; Xie, X.; Sun, G.; Huang, Y. T-drive: Driving directions based on taxi trajectories. In Proceedings of the 18th SIGSPATIAL International Conference on Advances in Geographic Information Systems, San Jose, CA, USA, 2–5 November 2010; pp. 99–108. [Google Scholar]
  24. Zheng, Y.; Liu, F.; Hsieh, H.P. U-air: When urban air quality inference meets big data. In Proceedings of the 19th ACM SIGKDD international Conference on Knowledge Discovery and Data Mining, Chicago, IL, USA, 11–14 August 2013; pp. 1436–1444. [Google Scholar]
  25. Rudskoy, A.; Ilin, I.; Prokhorov, A. Digital Twins in the Intelligent Transport Systems. Transp. Res. Procedia 2021, 54, 927–935. [Google Scholar] [CrossRef]
  26. Ugurlu, D.; Sertyesilisik, B. Usage of BIM in Smart Cities. Int. J. Digit. Innov. Built Environ. (IJDIBE) 2019, 8, 17–27. [Google Scholar] [CrossRef]
  27. Naidu, D.S. GIS Applications to Smart Cities. Int. J. Adv. Multidiscip. Sci. Res. (IJAMSR) 2018, 1, 2. [Google Scholar]
  28. Datta, P.; Sharma, B. A survey on IoT architectures, protocols, security and smart city based applications. In Proceedings of the 2017 8th International Conference on Computing, Communication and Networking Technologies (ICCCNT), Delhi, India, 3–5 July 2017; pp. 1–5. [Google Scholar]
  29. Jeong, S.; Simeone, O.; Kang, J. Mobile edge computing via a UAV-mounted cloudlet: Optimization of bit allocation and path planning. IEEE Trans. Veh. Technol. 2017, 67, 2049–2063. [Google Scholar] [CrossRef]
  30. Figueiredo, K.; Pierott, R.; Hammad, A.W.; Haddad, A. Sustainable material choice for construction projects: A life cycle sustainability assessment framework based on BIM and Fuzzy-AHP. Build. Environ. 2021, 196, 107805. [Google Scholar] [CrossRef]
  31. Alizadehsalehi, S.; Yitmen, I.; Celik, T.; Arditi, D. The effectiveness of an integrated BIM/UAV model in managing safety on construction sites. Int. J. Occup. Saf. Ergon. 2020, 26, 829–844. [Google Scholar] [CrossRef]
  32. Shenoy, J.; Pingle, Y. IOT in agriculture. In Proceedings of the 2016 3rd International Conference on Computing for Sustainable Global Development (INDIACom), New Delhi, India, 16–18 March 2016; pp. 1456–1458. [Google Scholar]
  33. Wang, Z.; Lu, M.; Yuan, X.; Zhang, J.; Van De Wetering, H. Visual traffic jam analysis based on trajectory data. IEEE Trans. Vis. Comput. Graph. 2013, 19, 2159–2168. [Google Scholar] [CrossRef] [PubMed]
  34. Suzuki, S. Topological structural analysis of digitized binary images by border following. Comput. Vision Graph. Image Process. 1985, 30, 32–46. [Google Scholar] [CrossRef]
Figure 1. Physical information linkage of a digital twin system. The physical space with physical entities provides data for the information space, and the information space with virtual models simulates the information provided by the object space. The physical units mainly include vehicles, buildings, traffic lights, sensors, etc. Virtual model mainly refers to environment model (environment and weather modeling based on data provided by sensors), 3D traffic model (3D modeling based on building and traffic light information), road network model (road network modeling based on lane information and road information), etc.
Applsci 13 01923 g001
Figure 2. Digital twin technology based on ITS system. The infrastructure layer includes physical entities such as signal lights, sensors, and road test facilities. The data layer is divided into static modelling data and dynamic interactive data, which belong to physical entity data; the simulation layer is based on the virtualization of physical entity data, mainly including visualization analysis, traffic flow prediction, data mining, mixed travel recommendation and so on; application layer is the application convenience provided by virtual entities for users, including decision control, remote control, multi-dimensional display and so on.
Applsci 13 01923 g002
Figure 3. Data interaction between multiple physical entities. Building information data, UAV video data and environmental sensor data belong to physical entity data. Expert knowledge, professional standards, etc. belong to knowledge data. Algorithm models, processing methods and so on belong to services data. Emulator data belongs to virtual entity data. Then the four kinds of data are preprocessed and integrated to acquire the fusion-derived data. User feedback is used as the basis for data structure adjustment. Efficient data transmission using 5G wireless networks.
Applsci 13 01923 g003
Figure 4. Data input interface. The dynamic data interface is mainly for dynamic interactive data in the data layer described in Figure 2, while the static data interface is for static modelling data; the subjective selection data interface is an interface for designers to process data according to the subjective conditions (such as threshold, filter conditions, etc.) required by practical applications.
Applsci 13 01923 g004
Figure 5. The process of data collaboration. Firstly, the original GPS data are judged to delete the abnormal data and retain the normal data. Then, the spatiotemporal distribution features were mined to extract travel hotspots and peak hours. Next, for hot intersections, UAV is used to collect traffic flow data during peak hours, and the UAV video data are processed and analyzed to mine traffic flow and capture behaviour characteristics. Finally, UE4 is used to visually model the digital twin of the target intersection.
Applsci 13 01923 g005
Figure 6. Distribution of temporal travel characteristics on weekdays and weekends. (a) Hourly car flow of Monday. (b) Hourly car flow of Thursday. (c) Hourly car flow of Saturday. (d) Hourly car flow of Sunday.
Applsci 13 01923 g006
Figure 7. Heat map of spatial distribution of travel hotspots. (a) Hotspots of Monday. (b) Hotspots of Thursday. (c) Hotspots of Saturday. (d) Hotspots of Sunday.
Applsci 13 01923 g007
Figure 8. UAV video process. (a) Frame difference processing. (b) Thresholding. (c) Image dilation. (d) Select the detection area and draw the outline.
Applsci 13 01923 g008
Figure 9. Box figure of car flow. (a) Box figure of car flow in morning rush hour. (b) Box figure of car flow in evening rush hour.
Applsci 13 01923 g009
Figure 10. Traffic flow at seven real intersections. (a) Morning rush hour: 8:00 to 9:00; (b) Evening rush hour: 17:30–18:30.
Applsci 13 01923 g010
Figure 11. Comparison of DFA and yolov2. (a) DFA of frame3. (b) yolov2 of frame3. (c) DFA of frame47. (d) yolov2 of frame3.
Applsci 13 01923 g011
Figure 12. Digital twin intersection. (a) The overall display of digital twin intersection. (b) Vehicle data display logic.
Applsci 13 01923 g012
Table 1. Twin data type comparison.
CityNoise [22]T-Drive [23]U-Air [24]E. Felemban [19]Taos’ [6]Ours
D p
D v
D s
D k
D f
D u
Table 2. Partial filtered data and reasons for deletion.
IdLongitudeLatitudeTimeDirectionSpeedReason for Deletion
60015120.279974431.484188827 July 2020 13:481211666faster
68126120.28716831.484124827 July 2020 11:231211666faster
22314119.893033331.489503327 July 2020 05:4700
22314120.893033332.489503327 July 2020 05:4800
22314121.893033333.489503327 July 2020 05:4900Long stillness
22314122.893033334.489503327 July 2020 05:5000
22314123.893033335.489503327 July 2020 05:5100
Table 3. Partial data of car speed.
IdTimeCar SpeedLongitudeLatitude
6689927 July 2020 8:3713.43901897120.329631631.83989
2264527 July 2020 10:3342.3437493120.3912931.8879616
6706327 July 2020 12:5822.1819016120.244656631.6393466
0860527 July 2020 22:2313.4394087120.4809431.4990583
Table 4. Accuracy and time consumption comparison.
MethodAccuracyTime
DFA95.26%0.55 s
yolov278.43%0.41 s
Disclaimer/Publisher’s Note: The statements, opinions and data contained in all publications are solely those of the individual author(s) and contributor(s) and not of MDPI and/or the editor(s). MDPI and/or the editor(s) disclaim responsibility for any injury to people or property resulting from any ideas, methods, instructions or products referred to in the content.

