Abstract
Due to the complexity of the oil and gas station system, the operational data, with various temporal dependencies and inter-metric dependencies, has the characteristics of diverse patterns, variable working conditions and imbalance, which brings great challenges to multivariate time series anomaly detection. Moreover, the time-series reconstruction information of data from digital twin space can be used to identify and interpret anomalies. Therefore, this paper proposes a digital twin-driven MTAD-GAN (Multivariate Time Series Data Anomaly Detection with GAN) oil and gas station anomaly detection method. Firstly, the operational framework consisting of digital twin model, virtual-real synchronization algorithm, anomaly detection strategy and realistic station is constructed, and an efficient virtual-real mapping is achieved by embedding a stochastic Petri net (SPN) to describe the station-operating logic of behavior. Secondly, based on the potential correlation and complementarity among time series variables, we present a MTAD-GAN anomaly detection method to reconstruct the error of multivariate time series by combining mechanism of knowledge graph attention and temporal Hawkes attention to judge the abnormal samples by a given threshold. The experimental results show that the digital twin-driven anomaly detection method can achieve accurate identification of anomalous data with complex patterns, and the performance of MTAD-GAN anomaly detection is improved by about 2.6% compared with other methods based on machine learning and deep learning, which proves the effectiveness of the method.
1. Introduction
The anomaly-detection problem is one of the important research topics for data mining [1], network intrusion [2], structural defects [3], text errors [4], industrial production [5] and social networks [6], etc. Considering the actual situation in physical industrial production, it is very difficult to detect anomalies in the samples due to diverse patterns, variable working conditions and imbalance data. Even though some progress [7,8,9,10,11] has been made, the task of multivariate time series anomaly detection is still very challenging.
Traditional anomaly detection methods have been extensively studied, with various strategies such as density estimation [12], tree based [13], cluster based [14], proximity based [15], probability based [16] and dimension reduction based [17]. However, faced with diverse patterns, variable working conditions and imbalance data, those methods cannot achieve good results. Another kind of anomaly detection methods with multivariate time series is based on deep learning. Among them, the long short term memory (LSTM) provide effective methods for analyzing time correlation features of time-series datasets, i.e., VLSTM [18], AMF-LSTM [19], DBN-LSTM [20], LSTM-AE [21,22,23], etc. Although these methods have improved accuracy and scope of application compared with traditional methods, they still cannot resolve the anomaly detection for the reasons of diverse patterns, variable working conditions and imbalance samples.
In this paper, we construct a digital twin framework by giving definitions of consistency, completeness and soundness for digital twin system, and using stochastic Petri net to realize the virtual and reality mapping. The MTAD-GAN anomaly detection method is designed to enhance the spatio-temporal correlation of multivatiate time serier by combining the attention mechanism of knowledge graph and temporal Hawkes. For resolving the problem of diverse patterns, variable working conditions and imbalance data, we propose a knowledge-aware transfer learning by using the data from digital twin space.
In Figure 1, we present an overview of this paper. In the knowledge graph section, we divide the physical parts and the relationships into several components, and use the knowledge graph for mapping the physical and virtual models. In the Petri net section, we describe the realistic oil and gas station operation behavior logically and achieve an efficient virtual-real mapping. In the evolution rules section, different nodes in the knowledge graph can be set according to different risk factors. In the anomaly detection section, we propose an MTAD-GAN anomaly detection method that reconstructs multivatiate time-series by combing knowledge graph attention and temporal Hawkes attention mechanism, and then uses knowledge transfer learning to detect anomalies in realistic oil and gas stations. Accordingly, our main contributions can be summarized as follows:
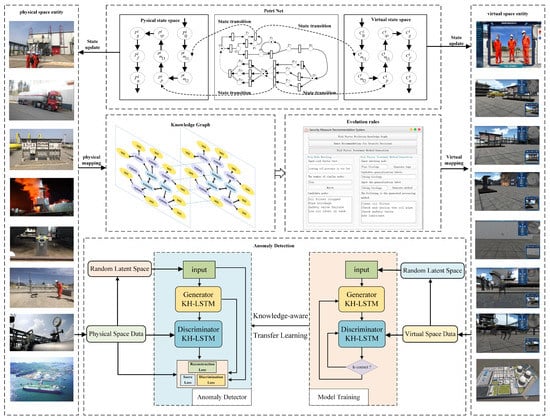
Figure 1.
Oil and gas station digital twin framework.
- We propose a digital twin operation framework, which is mapped to a virtual station by decomposing the knowledge graph of the physical station. The stochastic Petri net is designed to describe the station behavior logic and achieve an efficient virtual mapping.
- In order to resolve the problems of of diverse patterns, variable working conditions and imbalance samples, the method of MTAD-GAN is proposed by using the potential relationship between time-series variables, which enhances the features of multivatiate time-series by combining knowledge graph attention and temporal Hawkes attention mechanism. The ADGS scoring loss function is designed to estimate the probability distribution of network learning samples to complete the anomaly detection.
- Experiments on accuracy, precision, F1 and AUCROC with different datasets have shown great improvements with integrating the proposed MTAD-GAN. It demonstrates that the MTAD-GAN can effectively detect anomalies and outperforms the state-of-the-art deep learning methods as well as traditional methods.
We will introduce the related works in Section 2 and digital twin framework in Section 3.1. We describe the proposed MTAD-GAN in Section 3.2. In Section 4, we present the experimental results and compare our algorithm with others. In Section 5, we discuss the reason for the achieved results. Section 6 gives the conclusions of this paper.
2. Related Works
2.1. Digital Twin
With the rapid evolution of digital twins, the application of digital twins in various industries is becoming more and more widespread. Table 1 shows the key sources from manufacturing and smart cities based on digital twin. The digital twin serves as a bridge between the virtual and real worlds and is often used by industry to enhance the processing and management of information related to virtual and physical entities. Li et al. [24] uses quantitative green performance evaluation of smart manufacturing (GPEoSM) to quantify and evaluate green performance. which focuses more on the evaluation of the completed digital twin for iterative optimization. Priyanka et al. [25] proposes the digital twin framework to detect the failure precursors with the predictive algorithms. Yang et al. [26] uses process transformation technology to build digital twin framework, which is used to mine event logs for characterization and then predicts the remaining cycle values of a manufacturing process based on subsequent states by using a GRU neural network. Salem and Dragomir [27] present a framework of digital twins to manage activities and services related to the operation of buildings and urban structures. Guo et al. [28] introduces an improved random forest algorithm and maps the trained model to the physical production line for fault diagnosis by use transfer learning. Tao et al. [29] demonstrates that the framework of digital twin-driven product design (DTPD) can facilitate the iterative optimisation of bicycle design.

Table 1.
A Comparative Study for Digital Twin in open literature.
2.2. Deep Learning
Deep learning has been the most popular method in recent years. Among them, LSTM networks and GAN networks, as the basic network models for time series prediction, can effectively deal with the problems that cannot be solved by traditional methods. We find the outcomes and limitations of anomaly detection approaches based on LSTM and GAN in Table 2. Li et al. [31] combine a stacked autoencoder (SAE) and a long short-term memory (LSTM) neural network to identify anomalies in a completely unsupervised manner. The VAE-LSTM hybrid model [32] as an unsupervised method for time series anomaly detection utilizes VAE modules to form robust local features over short windows and LSTM modules to estimate long-term correlations in the series on top of the features. To reduce training bias, the ATR-GAN [33] is used to generate more effective artificial samples for training supervised learning models. The DAGAN [34] is designed to solve the sample unevenness problem by using a jump-joint and dual self-encoder architecture, which shows excellent image reconstruction capability and training stability. Using the combination of the advantages of LSTM gate structure in processing time series and the advantages of GAN network in acquiring data depth features, the LSTM-GAN [35] network is proposed. Wang et al. [36] attempts to cope with highly diverse data distributions and lack of labelled anomalous data by proposing an improved long short-term memory (LSTM) based time series anomaly detection scheme. In [37], LSTM-FC uses feature-based transfer learning to reduce the variance between wind turbine data distributions and has been validated for feasibility. However, none of the above methods can completely solve problem of missing data and imbalanced samples in real industrial production. We propose an anomaly detection method combining digital twin and transfer learning, which can effectively solve the problem of insufficient data samples as well as better assist industrial production management.
Table 2.
Comparative Analysis of the proposed deep learning scheme with related research.
2.3. Transfer Learning
Transfer learning [38] refers to the transfer of knowledge learned in a large number of adjacent data domains to solve similar problems in new data domains faster and more effectively. Vercruyssen et al. [39] applies transfer learning to anomaly detection, transferring labeled examples from the source domain to the target domain with no available labels. Andrews et al. [40] uses transfer representation learning for anomaly detection using convolutional neural networks. The MSTLN [41] aggregates and transmits diagnostic knowledge from multiple source machines by combining multiple locally distributed adaptive subnets (PDA-Subnets) and a multi-source diagnostic knowledge fusion module. Based on a combination of long and short-term memory, fuzzy synthesis and feature-based approaches to transfer learning, Zhu et al. [37] use three feature-based transfer learning methods to reduce the differences between WTG data distributions. In the actual operation of the oil and gas station, due to the lack of abnormal samples, it is difficult to obtain a relatively balanced datasets to train a classifier with generalization.
3. Proposed Method
3.1. SSUPS Based Digital Twin Framework
Due to the diversity and complexity of station equipment, it is difficult to construct a complete oil and gas station digital twin directly at one time. Therefore, we propose a SSUPS-based approach to the construction of digital twins which includes scenario, system, unit, part and subpart. The physical entity division can be expressed as follows:
where scenarios are the collection of real systems, such as oil and gas stations, pipelines, etc. The system is specific to a particular system, e.g., compression system, oil delivery system, etc. Units are classes of specific equipment, such as pipeline equipment and compressor equipment. Part is a component of a piece of equipment, such as the body, midbody, cylinders, crankshaft, connecting rods, etc. Subparts are tiny, non-subdividable parts such as bearings and screws. We display the knowledge graph as a semantic network of relationships between physical entities on digital twin framework, as shown in Figure 1. Based on SSUPS component decomposition, the knowledge graph of oil and gas station can deduct the industrial accidents, and judge the early warning and anomaly detection.
3.1.1. Virtual and Reality Mapping Based on SPN
Based on the knowledge graph’s classification of the different components and their relationships, the digital twin (DT) are divided into three classes: entity DT, attribute DT and relationship DT. Therefore, the digital twin mapping of an oil and gas station can be represented as a mapping of the various types of TE, we have:
The mapping between entities is a topology connection relationship. Entities include equipment, pipeline components, buildings, as well as sensor data collections and business processes, etc. All digital twins after entity mapping form a finite set. This finite set can be expressed as:
where N is the number of entities class, is the twinning entity, is the entity digital twin, is the entity mapping set. The mapping function of the entity digital twin can be expressed as:
where is the mapping entity digital twin, f is the mapping function, is a value operation that ignores data structures, formats, timestamps, etc.
The attribute mapping in the knowledge graph triplet has a unique identifier of the device with device information and status, which is represented as follows:
where N is the number of attribute class, is the twinning attribute, is the attribute digital twin, is the attribute mapping set. The mapping function of the attribute digital twin can be expressed as:
where is the mapping entity digital twin, f is the mapping function.
Relationships are the bridges for connecting entities in knowledge graph, which can be expressed as:
where N is the number of Relationship classes, is the twinning attribute, and is the attribute digital twin.
The division of the above three types for TE conducts to the integration of twin body data processing, and facilitates the design of simulation behaviors in the digital twin platform according to the digital twin representation methods of different TEs. In order to enhance virtual and reality interaction performace, our digital twin framework integrates SPN and evolution rules to improve better generalization on anomaly detection task. The SPN is defined as a seven-tuple . Based on the recursive combination of elements such as places and transitions, a logical network model of virtual-real interaction is constructed, as shown in Figure 2. The meanings of all places and transitions in the logical Petri net model are shown in Table 3.
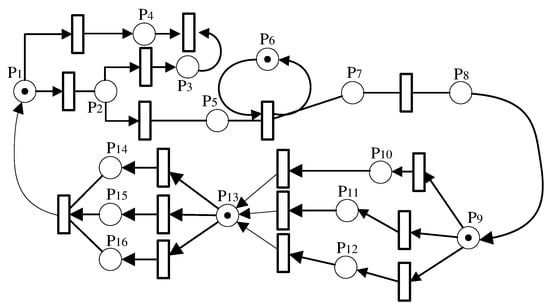
Figure 2.
The virtual-real interactive Petri net model of oil and gas station.
Table 3.
The meaning of place in Petri net.
3.1.2. Digital Twin Definitions
To provide the virtual-real synchronization of consistency, completeness and soundness for the operating logic of behavior of oil and gas station, we provide precise definitions for these three aspects.
Definition 1.
(Consistency): For, exist only one, such that. Where G is the knowledge graph, s is one of the triples in the knowledge graph. This definition reflects entities in physical space are the same as entities in virtual space.
Definition 2.
(Completeness): For, , such that, and for, is also satisfied. Whereis the derivation of s through different relations in the knowledge graph.
Definition 3.
(Soundness): If, , then. Where, f is the mapping function.
When the constructed digital twin satisfies the above three confirmatory definitions, it can be called a qualified digital twin that meets the demand of anomaly detection.
3.2. MTAD-GAN Network
3.2.1. Network Structure
To achieve anomaly detection of multivariate time series data, we designed a multi-level crossover GAN network (MTAD-GAN), as shown in Figure 3. During the MTAD-GAN model training phase, we input random noise with the same dimension as the training sample into the knowledge graph attention and Hawkes attention long short-term memory (KH-LSTM) to obtain the generated sample. Then the generated samples and real samples are simultaneously transmitted to the discriminator for iterative training until the network reaches Nash equilibrium. In the anomaly detection phase, the test samples are mapped to the random latent space, and the reconstruction samples are generated through iterative training by calculating the reconstruction loss. In order to strengthen the feature difference between normal samples and abnormal samples, a scoring network is introduced here to calculate the score loss of the reconstructed samples. Combining the Gaussian joint distribution, the adaptive dynamic Gaussian score (ADGS) is constructed by fusing the scoring loss, reconstruction loss and discrimination loss to detect and judge the anomaly of the data.
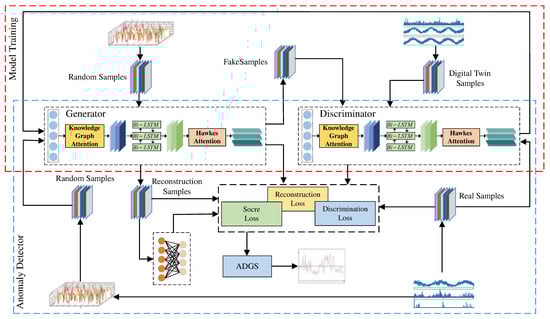
Figure 3.
The structure of GAN for anomaly detection.
3.2.2. KH-LSTM Network Structure
In the anomaly detection task, the knowledge graph attention module is introduced to enhance the spatial correlation of features. We incorporated the temporal Hawkes attention layer into the LSTM to suppress interference from unrelated features, as shown in Figure 4. The knowledge graph attention module is used to spatially weight the original input sequence . Based on the hidden layer space state of LSTM, combined with temporal hawked attention, the temporal correlation characteristics of the input signal are enhanced and obtain the spatiotemporal feature sequence .
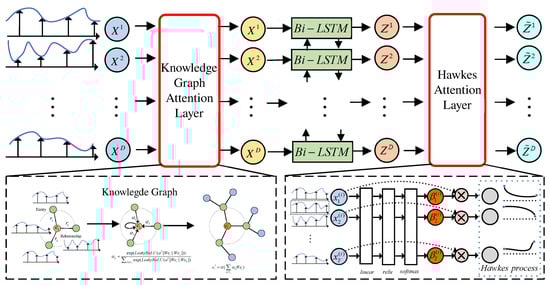
Figure 4.
The structure KH-LSTM with knowledge graph attention and Hawkes attention.
3.2.3. Knowledge Graph Attention Module
Set as the input time series data, D is the sensor variable dimension, T is the time series length. Divide the input X time series data into T D-dimension vectors, the single-layer knowledge graph attention network update node is expressed as follows:
where is a single-layer feed-forward neural network, a and W are learnable parameters in the neural network, ‖ represents the concatenation of vectors, is the attention weight. The node feature representation after the update is obtained by Equation (10).
3.2.4. Hawkes Attention Module
Considering that each spatial feature may have noise, temporal Hawkes attention mechanism is introduced to describe temporal correlation features. Set as LSTM hidden state at time t, we have:
where , , and are the training model parameters, is the weight of the kth LSTM hidden state of the sub window at time t, M is the size of sub window.
The Hawkes process [42] is a self-excited point-in-time process that models discrete sequences of events in continuous time. We compute the temporal features B as:
where is the time point and is the decay parameter. The context vector obtained by weighted summation of hidden states using attention weight is:
where is the context vector at time t, is the temporal attention weight.
3.2.5. Knowledge-Aware Transfer Learning
As shown in the Figure 5, transfer learning can map knowledge from the source domain to the target domain, and the data simulated from our digital twin space may have different effects on the physical devices. Therefore, we apply an attention mechanism to better learn the knowledge relation between two domains. When the device correlation of two domains is low, the shared knowledge will be penalized, and the attention network will learn more device-specific domain knowledge.The formulas for knowledge-aware similarity are as follows:
where W is the weight matrices, h and bias b are the parameters of the network, and are the related to C domain and P domain. The attention scores is normalized with a softmax function:
where and represent common knowledge between two domains. After calculating the above attention weights, the features of the two domains can be expressed as follows:
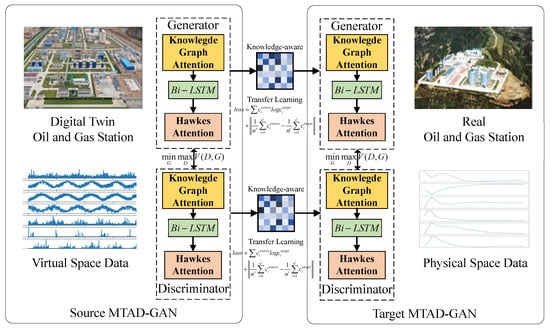
Figure 5.
Knowledge-aware transfer learning Network structure.
Transfer learning computes two types of losses, with marginal distribution loss and conditional distribution loss, which are the data distribution and prediction distribution, respectively. The specific losses are as follows:
where and are the hyper-parameters. We use the grid search method to train the hyper-parameters by the validation set at . The optimal parameter are both set as 0.5 in our experiments.
3.3. Abnormal Score
In the anomaly detection phase, the test set is mapped to the potential feature space and entered into the generator to generate the initial reconstruction sample . The gradient is then updated by calculating the error between the test sample and the reconstructed sample. The similarity measure between the input sample and the potential feature space is defined as follows:
where is the error measurement function, is the similarity measure function, and is the mth reconstruction sample. The Equation (20) is obtained by gradient descent to obtain the optimal solution, then the sample residual function of the moment is expressed as:
The minimize-loss function is used to update the parameters in S, using the reconstruction error as a self-supervised signal, defining the score loss as:
where a is the threshold and is the anomaly score.
The MTAD-GAN model is a multi-branch structure, due to the different learning tasks of different branches, the end-to-end training method is adopted, and the overall loss function is the sum of the weighting coefficients of multiple loss functions, we have:
where is the reconstruction loss, is the discriminant loss, is the score loss. According to the subsequence of multiple test data, we can obtain multiple sets of anomaly loss functions . Here, the anomaly detection loss of multiple groups of subsequences is fitted to a Gaussian distribution, and then the adaptive dynamic scoring function ADGS is obtained, which is defined as follows:
where is the dynamic mean, is the dynamic variance, M is the window size.
4. Experiments
4.1. Datasets
Experiments were carried out on the KDD99 [43], SWaT [44], WADI [45], SKAB [46], DAMADICS [47], MSL [48], SMAP [48], SMD [49] and J10031 datasets. Table 4 shows the detail of our pre-processed dataset. For each full dataset, it is divided into the ratio of training data, validation data and test data as 6:2:2 in the process of learning.
Table 4.
The details of datasets.
4.1.1. KDD99
The KDD99 dataset from the Third International Knowlegde Discovery and Data Mining Tools Competition in 1999 for system evaluation of network security contains 4,898,431 samples with 40 columns of features and 1 column of class labels. In this paper, 562,387 samples for 34 sensors were collected under normal working conditions, and 494,021 samples were collected under various attacked scenario.
4.1.2. SWaT
The Secure Water Treatment (SWaT) dataset is a water treatment testbed, which contains data from the water treatment plant and water treatment process generated. It includes 7 days of normal data with 496,800 samples and 4 days of abnormal data with 449,919 samples. The abnormal data contain 36 attacks in total. The number of sensors and actuators in the testbed for data collection is 51.
4.1.3. WADI
The Water Distribution (WADI) dataset contains data from a water distribution network in a city, which collected by the Singapore Public Utilities Commission. The dataset collected recordings of 123 sensors for 16 days, which contains 1,048,571 samples under the normal scenario for the first 14 days and 172,801 samples under the attacked scenario for the last 2 days. There are 15 attacks in total, generating about 6% abnormal data.
4.1.4. J10031
The J10031 is the measured valve dataset of compressors in an oil and gas station, which contains 43,194 normal samples for 29 sensors and 42,150 data samples under abnormal working condition.
4.1.5. SKAB
The Skoltech Anomaly Benchmark (SKAB) dataset is designed for evaluation algorithms for anomaly detection which contains 35 subsets of data from a water circulation system with the sensors installed on the testbed. The 9401 samples were obtained from the experiments with normal mode and the 35,600 samples were under abnormal scenario.
4.1.6. DAMADICS
The Development and Application of Methods for Actuator Diagnosis in Industrial Control Systems (DAMADICS) is a benchmark which includes data from a real water evaporation process in a boiler of a sugar factory in Poland. In this paper, the DAMADICS simulated 8546 normal samples and 9542 abnormal samples under the operating condition of pneumatic control valves in industrial processes.
4.1.7. MSL and SMAP
The Mars Science Laboratory rover (MSL) and the Soil Moisture Active Passive satellite (SMAP) are real-word datasets acquired from the spacecraft, which were annotated by experts of NASA. MSL dataset includes the 2160 normal samples and the 2731 samples under attack and SMAP includes the 2556 normal samples and the 8071 samples under attack. There are 55 and 27 sensors in SMAP and MSL datasets, respectively.
4.1.8. SMD
The Server Machine Dataset (SMD) is a five-week dataset, which contains data from 28 server machines. To avoid the effect of service change during the data collection period, we used part of the SMD dataset, containing 25,300 normal samples and 25,301 samples under attack. The data on each server are monitored by 38 sensors.
4.2. Evaluation Indicators
To evaluate our method more intuitively and comprehensively, we calculate accuracy A, precision P, recall R, score and AUC-ROC as measure of experimental results. The calculation formula is as follows:
where is a positive sample predicted by the model as a positive value, is a negative sample with negative value predicted by the model, is a negative sample predicted by the model as a positive value, is a positive sample predicted by the model as a negative value, is the offline area of curve.
4.3. Results and Analysis
We compared the performance of MTAD-GAN with six popular anomaly detection methods, including: PCA: The method is based on Principal Component Analysis [50]; RawSignal: Raw Signal is a trivial model that reconstructs any signal to 0, so that the error is the same as the normalized signals; UAE: The method is based on Unimodal Autoencoder [51]; LSTM-ED: The method is based on Long Short Term Memory neural network and Encoder-Decoder [52]; AE: The method is based on Autoencoder [53]; TcnED: The method is based on Temporal Convolutional Network and Encoder–Decoder [54].
Figure 6 shows the performance comparison of this method with PCA, RawSignal, UAE, LSTM-ED, AE and TcnED on SMAP, SMD, DAMADICS, SKAB, MSL and J10031 datasets based on different scoring functions. The experimental results show that the choice of detection model and scoring function has different effects on anomaly detection. Compared with other algorithms, the performance of MTAD-GAN is improved by 0.01∼0.4, while ADGS integrates multiple loss items to better identify abnormal situations. Compared with other scoring functions, the model performance is improved by 0.16∼0.4.
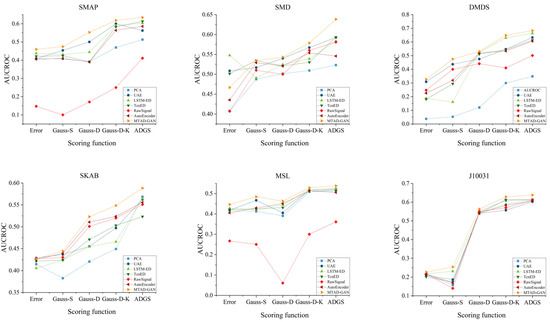
Figure 6.
AUCROC comparison of each model method.
Table 5 shows the prediction results based on the ADGS scoring function in the J10031 dataset. It can be seen that the accuracy of MTAD-GAN is improved by 2.6% compared with TcnED algorithm, indicating that the proposed model has good performance. To compare and analyze the differences between the methods in this paper and TcnED, Table 6 shows the accuracy on SMAP, SMD, DAMADICS, SKAB, MSL, SWAT and WADI datasets. It can be seen that the accuracy of MTAD-GAN algorithm is improved by 6.42∼15.42% compared with TcnED algorithm.
Table 5.
Performance comparison of the time and accuracy of different baseline methods with MTAD-GAN.
Table 6.
Performance comparison of the accuracy of different datasets.
To verify the model’s ability for detecting abnormal data, the SWAT, WADI, MSL and J10031 datasets are evaluated for abnormal scores. It can be seen from Figure 7 that there is a significant difference between normal and abnormal distribution in the scores, and the abnormal score is higher than the normal score with the average score difference between 0.01 and 9.21, which proves that the MTAD-GAN model can reflect the characteristic distribution of data and give more accurate abnormal scores.
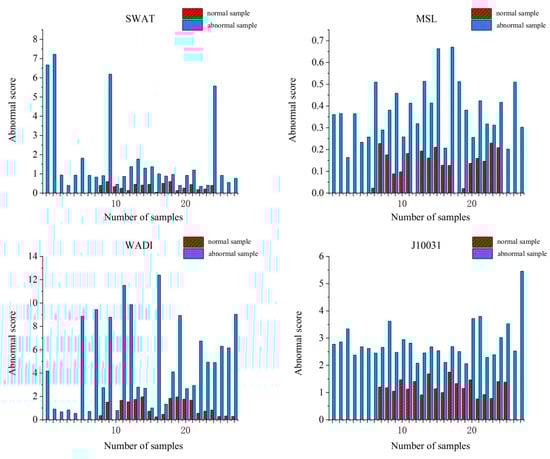
Figure 7.
Performance comparison between scoring distribution map.
We introduce a scoring network to analyze the sensitivity of different weight parameters of MTAD-GAN and optimize the model. The parameters in Equation (22) are divided into two groups, namely and . Figure 8 shows the AUCROC indexes used to measure the sensitivity of the two groups of parameters on the MSL and J10031 data sets respectively. It can be seen that different data sets have different sensitivity to parameters. On MSL dataset, when and , the correlation of parameter is strong. On the J10031 dataset, when and , the model performance is relatively stable.
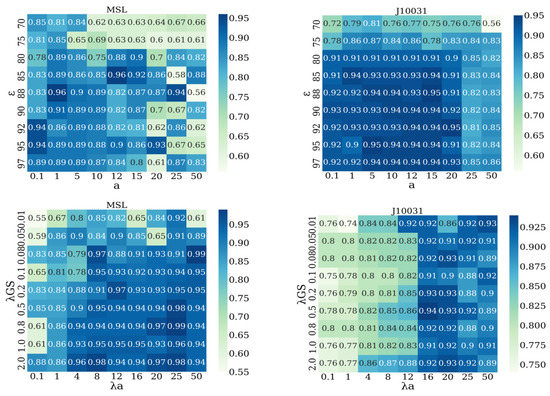
Figure 8.
Performance comparison between heat map distributions for different datasets.
4.4. Ablation Experiment
Experiments were conducted on SWAT, WADI, KDD99 and J10031 respectively by verifying the rationality of MTAD-GAN design. Removal of Hawkes temporal attention module is marked as K-GAN, removal of knowledge graph aware attention module is marked as H-GAN. As shown in the Table 7, the average accuracy of the MTAD-GAN algorithm has increased by 13.42∼21.31%, the average recall rate has increased by 8.53∼23.45%, and the average F1 has increased by 9.49∼16.6%.
Table 7.
Performance comparison of the P, R, F1 of ablation experiment.
To verify the effectiveness of the loss function used in this paper, the scoring loss network is removed from MTAD-GAN and marked as MTA-GAN, and the scoring loss (i.e., LSTMS-GAN) is introduced into LSTM-GAN for retraining. The abnormal samples are randomly deleted from KDD99, SWAT, WADI and J10031 datasets, and the abnormal rates are adjusted to 5%, 10%, 15%, 20% and 25% respectively. The test results are shown in Figure 9. It can be seen that the performances of LSTMS-GAN and MTAD-GAN are relatively stable when all loss functions are used; on the other hand, the AUCROC performance of MTA-GAN and LSTM-GAN has decreased to varying degrees on the four datasets with an average performance decrease of 15∼87.5%.
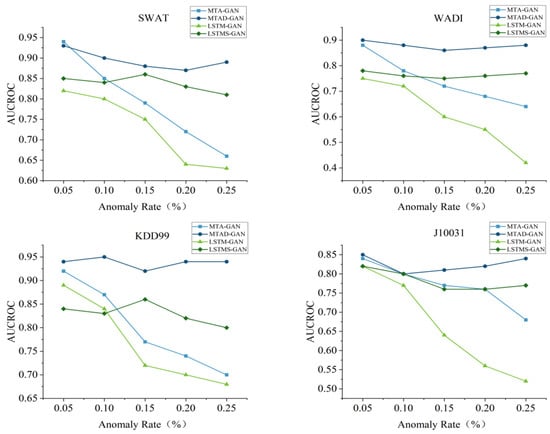
Figure 9.
Comparison plot of the loss function ablation experiment AUC-ROC.
5. Discussion
As shown in Table 7, LSTM combined with the Hawkes process can effectively capture the cascading correlations among historical records for the inherent temporal self-exciting characteristic of anomalies. Hence, the output of the LSTM corresponding to self influence of the Hawkes process demonstrates the accumulated results which decay exponentially with time for anomalies during historical intervals for current detection. The knowledge graph of oil and gas station for multivariate time series data, which enhance the semantic information of detecting anomalies, is constructed to capture the latent inter-deependencies between entities and relations. Then, the anomaly information related to the occurrence of sensors is transformed into the feature vector to mine the potential connections among multi-sensors. The feature vectors are used for training LSTM model to improves the ability of high-level feature expression and the accuracy of anomaly detection.
The novel loss functions including reconstruction loss function, discrimination loss function and score loss function is designed to constrain the hidden variable and accelerate the gradient descent speed with few iterations during the training process. The highest results of AUCROC shown in Table 6 demonstrate the efficiency of our MTAD-GAN method with ADGS to improve the accuracy of detecting anomalies for the imbalanced and high-dimensional data in oil and gas stations.
6. Conclusions
Anomaly detection of multivariate time series is an important task for intelligent operation of oil and gas stations. In this paper, an unsupervised multivariate time series anomaly detection method based on digital twin and MTAD-GAN is proposed, which constructs a digital twin system matching with the actual oil and gas station operation logic and realizes an efficient virtual-real mapping through stochastic Petri nets. Based on the correlation between data samples and using twin space for training, the data of multivariate time series are modeled simultaneously by combining knowledge graph attention and temporal Hawkes attention mechanisms, and the probability distribution of the estimated network learning samples is designed based on knowledge-aware transfer learning model to complete anomaly detection. In the future work, we intend to further explore the various implicit relationships of variate time series and adjust the network structure of the knowledge mapping and Hawkes process modules to adapt to more complex and variable application contexts by fusing more levels of feature information.
Author Contributions
Conceptualization, Y.L. and Y.G.; methodology, Y.L.; software, T.T.; validation, Y.L., Y.G. and T.T.; formal analysis, T.T.; investigation, Y.L.; resources, Y.G.; data curation, Y.G.; writing—original draft preparation, T.T.; writing—review and editing, Y.L.; visualization, Y.G.; supervision, Y.L.; project administration, Y.L.; funding acquisition, Y.L. All authors have read and agreed to the published version of the manuscript.
Funding
This research was funded by grant number NSFC 61972353, NSF IIS-1816511, OAC-1910469 and Strategic Cooperation Technology Proiects of CNPC and CUPB: ZLZX2020-05.
Institutional Review Board Statement
Not applicable.
Informed Consent Statement
Not applicable.
Data Availability Statement
The SWAT and WADI datasets can be download in https://itrust.sutd.edu.sg/itrust-labsdatasets/datasetinfo accessed on 6 January 2022.
Conflicts of Interest
The authors declare no conflict of interest.
References
- Rong, H.; Teixeira, A.; Soares, C.G. Data mining approach to shipping route characterization and anomaly detection based on AIS data. Ocean Eng. 2020, 198, 106936. [Google Scholar] [CrossRef]
- Jamil, F.; Kim, D. An ensemble of prediction and learning mechanism for improving accuracy of anomaly detection in network intrusion environments. Sustainability 2021, 13, 10057. [Google Scholar]
- Chow, J.K.; Su, Z.; Wu, J.; Tan, P.S.; Mao, X.; Wang, Y.H. Anomaly detection of defects on concrete structures with the convolutional autoencoder. Adv. Eng. Inform. 2020, 45, 101105. [Google Scholar] [CrossRef]
- Farzad, A.; Gulliver, T.A. Unsupervised log message anomaly detection. ICT Express 2020, 6, 229–237. [Google Scholar] [CrossRef]
- Liu, J.; Song, K.; Feng, M.; Yan, Y.; Tu, Z.; Zhu, L. Semi-supervised anomaly detection with dual prototypes autoencoder for industrial surface inspection. Opt. Lasers Eng. 2021, 136, 106324. [Google Scholar] [CrossRef]
- Cauteruccio, F.; Cinelli, L.; Corradini, E.; Terracina, G.; Ursino, D.; Virgili, L.; Savaglio, C.; Liotta, A.; Fortino, G. A framework for anomaly detection and classification in Multiple IoT scenarios. Future Gener. Comput. Syst. 2021, 114, 322–335. [Google Scholar] [CrossRef]
- Niu, Z.; Yu, K.; Wu, X. LSTM-based VAE-GAN for time-series anomaly detection. Sensors 2020, 20, 3738. [Google Scholar] [CrossRef]
- Jiang, W.; Hong, Y.; Zhou, B.; He, X.; Cheng, C. A GAN-based anomaly detection approach for imbalanced industrial time series. IEEE Access 2019, 7, 143608–143619. [Google Scholar] [CrossRef]
- Geiger, A.; Liu, D.; Alnegheimish, S.; Cuesta-Infante, A.; Veeramachaneni, K. TadGAN: Time series anomaly detection using generative adversarial networks. In Proceedings of the 2020 IEEE International Conference on Big Data (Big Data), Atlanta, GA, USA, 10–13 December 2020; pp. 33–43. [Google Scholar]
- Zeng, Z.; Jin, G.; Xu, C.; Chen, S.; Zeng, Z.; Zhang, L. Satellite Telemetry Data Anomaly Detection Using Causal Network and Feature-Attention-Based LSTM. IEEE Trans. Instrum. Meas. 2022, 71, 1–21. [Google Scholar] [CrossRef]
- Choi, Y.; Lim, H.; Choi, H.; Kim, I.J. Gan-based anomaly detection and localization of multivariate time series data for power plant. In Proceedings of the 2020 IEEE International Conference on Big Data and Smart Computing (BigComp), Busan, Republic of Korea, 19–22 February 2020; pp. 71–74. [Google Scholar]
- Nachman, B.; Shih, D. Anomaly detection with density estimation. Phys. Rev. D 2020, 101, 075042. [Google Scholar] [CrossRef]
- Primartha, R.; Tama, B.A. Anomaly detection using random forest: A performance revisited. In Proceedings of the 2017 International Conference on Data and Software Engineering (ICoDSE), Palembang, Indonesia, 1–2 November 2017; pp. 1–6. [Google Scholar]
- Li, J.; Izakian, H.; Pedrycz, W.; Jamal, I. Clustering-based anomaly detection in multivariate time series data. Appl. Soft Comput. 2021, 100, 106919. [Google Scholar] [CrossRef]
- Idé, T.; Lozano, A.C.; Abe, N.; Liu, Y. Proximity-based anomaly detection using sparse structure learning. In Proceedings of the 2009 SIAM International Conference on Data Mining, SIAM, Sparks, NV, USA, 30 April–2 May 2009; pp. 97–108. [Google Scholar]
- Zeng, X.; Yang, M.; Bo, Y. Gearbox oil temperature anomaly detection for wind turbine based on sparse Bayesian probability estimation. Int. J. Electr. Power Energy Syst. 2020, 123, 106233. [Google Scholar] [CrossRef]
- Sakurada, M.; Yairi, T. Anomaly detection using autoencoders with nonlinear dimensionality reduction. In Proceedings of the MLSDA 2014 2nd Workshop on Machine Learning for Sensory Data Analysis, Gold Coast, Australia, 2 December 2014; pp. 4–11. [Google Scholar]
- Zhou, X.; Hu, Y.; Liang, W.; Ma, J.; Jin, Q. Variational LSTM enhanced anomaly detection for industrial big data. IEEE Trans. Ind. Inform. 2020, 17, 3469–3477. [Google Scholar] [CrossRef]
- Zhu, M.; Ye, K.; Wang, Y.; Xu, C.Z. A deep learning approach for network anomaly detection based on AMF-LSTM. In Proceedings of the IFIP International Conference on Network and Parallel Computing; Springer: Berlin/Heidelberg, Germany, 2018; pp. 137–141. [Google Scholar]
- Chen, A.; Fu, Y.; Zheng, X.; Lu, G. An efficient network behavior anomaly detection using a hybrid DBN-LSTM network. Comput. Secur. 2022, 114, 102600. [Google Scholar] [CrossRef]
- Provotar, O.I.; Linder, Y.M.; Veres, M.M. Unsupervised anomaly detection in time series using lstm-based autoencoders. In Proceedings of the 2019 IEEE International Conference on Advanced Trends in Information Theory (ATIT), Kyiv, Ukraine, 18–20 December 2019; pp. 513–517. [Google Scholar]
- Que, Z.; Liu, Y.; Guo, C.; Niu, X.; Zhu, Y.; Luk, W. Real-time anomaly detection for flight testing using AutoEncoder and LSTM. In Proceedings of the 2019 International Conference on Field-Programmable Technology (ICFPT), Tianjin, China, 9–13 December 2019; pp. 379–382. [Google Scholar]
- Kang, J.; Kim, C.S.; Kang, J.W.; Gwak, J. Anomaly detection of the brake operating unit on metro vehicles using a one-class lstm autoencoder. Appl. Sci. 2021, 11, 9290. [Google Scholar] [CrossRef]
- Li, L.; Lei, B.; Mao, C. Digital twin in smart manufacturing. J. Ind. Inf. Integr. 2022, 26, 100289. [Google Scholar] [CrossRef]
- Priyanka, E.; Thangavel, S.; Gao, X.Z.; Sivakumar, N. Digital twin for oil pipeline risk estimation using prognostic and machine learning techniques. J. Ind. Inf. Integr. 2022, 26, 100272. [Google Scholar] [CrossRef]
- Yang, M.; Moon, J.; Jeong, J.; Sin, S.; Kim, J. A Novel Embedding Model Based on a Transition System for Building Industry-Collaborative Digital Twin. Appl. Sci. 2022, 12, 553. [Google Scholar] [CrossRef]
- Salem, T.; Dragomir, M. Options for and Challenges of Employing Digital Twins in Construction Management. Appl. Sci. 2022, 12, 2928. [Google Scholar] [CrossRef]
- Guo, K.; Wan, X.; Liu, L.; Gao, Z.; Yang, M. Fault diagnosis of intelligent production line based on digital twin and improved random forest. Appl. Sci. 2021, 11, 7733. [Google Scholar] [CrossRef]
- Tao, F.; Sui, F.; Liu, A.; Qi, Q.; Zhang, M.; Song, B.; Guo, Z.; Lu, S.C.Y.; Nee, A.Y. Digital twin-driven product design framework. Int. J. Prod. Res. 2019, 57, 3935–3953. [Google Scholar] [CrossRef]
- Sacks, R.; Brilakis, I.; Pikas, E.; Xie, H.S.; Girolami, M. Construction with digital twin information systems. Data-Centric Eng. 2020, 1, e14. [Google Scholar] [CrossRef]
- Li, Z.; Li, J.; Wang, Y.; Wang, K. A deep learning approach for anomaly detection based on SAE and LSTM in mechanical equipment. Int. J. Adv. Manuf. Technol. 2019, 103, 499–510. [Google Scholar] [CrossRef]
- Lin, S.; Clark, R.; Birke, R.; Schönborn, S.; Trigoni, N.; Roberts, S. Anomaly detection for time series using vae-lstm hybrid model. In Proceedings of the ICASSP 2020-2020 IEEE International Conference on Acoustics, Speech and Signal Processing (ICASSP), Barcelona, Spain, 4–8 May 2020; pp. 4322–4326. [Google Scholar]
- Li, Y.; Shi, Z.; Liu, C.; Tian, W.; Kong, Z.; Williams, C.B. Augmented time regularized generative adversarial network (atr-gan) for data augmentation in online process anomaly detection. IEEE Trans. Autom. Sci. Eng. 2021, 19, 3338–3355. [Google Scholar] [CrossRef]
- Tang, T.W.; Kuo, W.H.; Lan, J.H.; Ding, C.F.; Hsu, H.; Young, H.T. Anomaly detection neural network with dual auto-encoders GAN and its industrial inspection applications. Sensors 2020, 20, 3336. [Google Scholar] [CrossRef]
- Zhu, G.; Zhao, H.; Liu, H.; Sun, H. A novel LSTM-GAN algorithm for time series anomaly detection. In Proceedings of the 2019 Prognostics and System Health Management Conference (PHM-Qingdao), Qingdao, China, 25–27 October 2019; pp. 1–6. [Google Scholar]
- Wang, Y.; Du, X.; Lu, Z.; Duan, Q.; Wu, J. Improved lstm-based time-series anomaly detection in rail transit operation environments. IEEE Trans. Ind. Inform. 2022, 18, 9027–9036. [Google Scholar] [CrossRef]
- Zhu, Y.; Zhu, C.; Tan, J.; Tan, Y.; Rao, L. Anomaly detection and condition monitoring of wind turbine gearbox based on LSTM-FS and transfer learning. Renew. Energy 2022, 189, 90–103. [Google Scholar] [CrossRef]
- Torrey, L.; Shavlik, J. Transfer learning. In Handbook of Research on Machine Learning Applications and Trends: Algorithms, Methods, and Techniques; IGI Global: Hershey, PA, USA, 2010; pp. 242–264. [Google Scholar]
- Vercruyssen, V.; Meert, W.; Davis, J. Transfer learning for time series anomaly detection. In Proceedings of the Workshop and Tutorial on Interactive Adaptive Learning@ ECMLPKDD 2017; CEUR Workshop Proceedings: Aachen, Germany, 2017; Volume 1924, pp. 27–37. [Google Scholar]
- Andrews, J.; Tanay, T.; Morton, E.J.; Griffin, L.D. Transfer Representation-Learning for Anomaly Detection; JMLR: New York, NY, USA, 2016. [Google Scholar]
- Yang, B.; Xu, S.; Lei, Y.; Lee, C.G.; Stewart, E.; Roberts, C. Multi-source transfer learning network to complement knowledge for intelligent diagnosis of machines with unseen faults. Mech. Syst. Signal Process 2022, 162, 108095. [Google Scholar] [CrossRef]
- Liniger, T.J. Multivariate Hawkes Processes. Ph.D. Thesis, ETH Zurich, Zürich, Switzerland, 2009. [Google Scholar]
- KDD99 Dataset. UCI KDD Archive. 1999. Available online: http://kdd.ics.uci.edu/databases/kddcup99/kddcup99.html (accessed on 10 January 2020).
- Goh, J.; Adepu, S.; Junejo, K.N.; Mathur, A. A dataset to support research in the design of secure water treatment systems. In Proceedings of the Critical Information Infrastructures Security: 11th International Conference, CRITIS 2016, Paris, France, 10–12 October 2016; Revised Selected Papers 11. Springer: Berlin/Heidelberg, Germany, 2017; pp. 88–99. [Google Scholar]
- Ahmed, C.M.; Palleti, V.R.; Mathur, A.P. WADI: A water distribution testbed for research in the design of secure cyber physical systems. In Proceedings of the 3rd International Workshop on Cyber-Physical Systems for Smart Water Networks, Pittsburgh, PA, USA, 21 April 2017; pp. 25–28. [Google Scholar]
- Skoltech Anomaly Benchmark (SKAB). I. D. Katser and V. O. Kozitsin. 2020. Available online: https://www.kaggle.com/dsv/1693952 (accessed on 8 May 2021).
- Damadics Benchmark Website. 2020. Available online: http://diag.mchtr.pw.edu.pl/damadics/ (accessed on 4 March 2019).
- Hundman, K.; Constantinou, V.; Laporte, C.; Colwell, I.; Soderstrom, T. Detecting spacecraft anomalies using lstms and nonparametric dynamic thresholding. In Proceedings of the 24th ACM SIGKDD International Conference on Knowledge Discovery & Data Mining, London, UK, 19–23 August 2018; pp. 387–395. [Google Scholar]
- Su, Y.; Zhao, Y.; Niu, C.; Liu, R.; Sun, W.; Pei, D. Robust anomaly detection for multivariate time series through stochastic recurrent neural network. In Proceedings of the 25th ACM SIGKDD International Conference on Knowledge Discovery & Data Mining, Anchorage, AK, USA, 4–8 August 2019; pp. 2828–2837. [Google Scholar]
- Li, S.; Wen, J. A model-based fault detection and diagnostic methodology based on PCA method and wavelet transform. Energy Build. 2014, 68, 63–71. [Google Scholar] [CrossRef]
- Garg, A.; Zhang, W.; Samaran, J.; Savitha, R.; Foo, C.S. An evaluation of anomaly detection and diagnosis in multivariate time series. IEEE Trans. Neural Netw. Learn. Syst. 2021, 33, 2508–2517. [Google Scholar] [CrossRef] [PubMed]
- Habler, E.; Shabtai, A. Using LSTM encoder-decoder algorithm for detecting anomalous ADS-B messages. Comput. Secur. 2018, 78, 155–173. [Google Scholar] [CrossRef]
- Aygun, R.C.; Yavuz, A.G. Network anomaly detection with stochastically improved autoencoder based models. In Proceedings of the 2017 IEEE 4th international conference on cyber security and cloud computing (CSCloud), New York, NY, USA, 26–28 June 2017; pp. 193–198. [Google Scholar]
- Lin, K.; Sheng, S.; Zhou, Y.; Liu, F.; Li, Z.; Chen, H.; Xu, C.Y.; Chen, J.; Guo, S. The exploration of a temporal convolutional network combined with encoder-decoder framework for runoff forecasting. Hydrol. Res. 2020, 51, 1136–1149. [Google Scholar] [CrossRef]


Disclaimer/Publisher’s Note: The statements, opinions and data contained in all publications are solely those of the individual author(s) and contributor(s) and not of MDPI and/or the editor(s). MDPI and/or the editor(s) disclaim responsibility for any injury to people or property resulting from any ideas, methods, instructions or products referred to in the content. |
© 2023 by the authors. Licensee MDPI, Basel, Switzerland. This article is an open access article distributed under the terms and conditions of the Creative Commons Attribution (CC BY) license (https://creativecommons.org/licenses/by/4.0/).