Article

Research on Image Denoising in Edge Detection Based on Wavelet Transform

1
Faculty of Land Resources Engineering, Kunming University of Science and Technology, Kunming 650093, China
2
PLA Army Academy of Artillery and Air Defense, Zhengzhou 450000, China
*
Author to whom correspondence should be addressed.
Appl. Sci. 2023, 13(3), 1837; https://doi.org/10.3390/app13031837
Submission received: 23 December 2022 / Revised: 21 January 2023 / Accepted: 27 January 2023 / Published: 31 January 2023

Abstract

:
Photographing images is used as a common detection tool during the process of bridge maintenance. The edges in an image can provide a lot of valuable information, but the detection and extraction of edge details are often affected by the image noise. This study proposes an algorithm for wavelet transform to denoise the image before edge detection, which can improve the signal-to-noise ratio of the image and retain as much edge information as possible. In this study, four wavelet functions and four decomposition levels are used to decompose the image, filter the coefficients and reconstruct the image. The PSNR and MSE of the denoised images were compared, and the results showed that the sym5 wavelet function with three-level decomposition has the best overall denoising performance, in which the PSNR and MSE of the denoised images were 23.48 dB and 299.49, respectively. In this study, the canny algorithm was used to detect the edges of the images, and the detection results visually demonstrate the difference between before and after denoising. In order to further evaluate the denoising performance, this study also performed edge detection on images processed by both wavelet transform and the current widely used Gaussian filter, and it calculated the Pratt quality factor of the edge detection results, which were 0.53 and 0.47, respectively. This indicates that the use of wavelet transform to remove noise is more beneficial to the improvement of the subsequent edge detection results.

1. Introduction

Edges are the dividing line between different regions of an image and contain a wealth of detailed information, making them the most fundamental image features. Edge detection is a widely used operation in image processing and plays a very important role in identifying and separating geometric shapes in images [1]. Edge detection is generally the process of finding the region of the graph where the gradient changes significantly and then selecting the pixel with the highest amplitude. It can also obtain the edge information of a region by searching the transfer points where the second-order derivative is zero. Generally, the edge detection operator includes the Sobel operator, Laplace operator and canny operator [1,2]. The canny operator is a relatively complete edge detection operators, but it is affected by image noise. Therefore, it is necessary to apply appropriate filtering (denoising) processing to the image so as to eliminate the noise and retain the original edge information to the maximum extent and improve the edge detection results of the canny operator [3,4,5,6,7].
There are many methods of image denoising, such as traditional mean filtering, median filtering, Gaussian filtering and so on. Although these methods can achieve the purpose of denoising, they produce boundary blurring, edge loss and even pseudo-edge problems. Therefore, in this paper, the wavelet transform is chosen to remove as much noise as possible from the original image, while preserving the edge information and avoiding the problems caused by other denoising methods.
The wavelet transform inherits and develops the idea of the short-time Fourier transform and solves the defect that the scale of the information window does not change with frequency, so that the characteristics of certain aspects of the information can be fully highlighted. The wavelet transform is widely used in signal analysis and image processing due to its multi-resolution, low entropy and decoupling properties. Kimlyk, M. et al. [8] improved the traditional thresholding method by calculating the edge information and obtained a better noise reduction effect. They improved the threshold for zeroing the wavelet coefficients in non-edge regions while preserving the image edges. Ali, M.N. et al. [9] denoised phonocardiogram (PCG) signals using different families of discrete wavelet transforms, thresholding types and techniques, and number of signal decomposition levels, and discussed the effect of the chosen wavelet function and number of wavelet decomposition levels on the efficiency of the denoising algorithm. Saravani, S. et al. [10] proposed a new iterative algorithm to reduce the scattering noise in SAR images and to preserve the edges and structure of the image by aggregating the smooth wavelet transform (SWT), bilateral filtering, Bayesian estimation and anisotropic diffusion (AD) filtering. In addition, neural networks have begun to be used for image denoising. Liu, F. et al. [11,12] used a method based on wavelet transform and deep networks image classification to improve the classification accuracy of topographic images. Singh, A. [13] used a backpropagation algorithm for training in MLP-ANN to achieve good denoising of images without prior knowledge of the degradation model. This demonstrates the promising application of neural networks in the field of denoising, which is well worth the attention of researchers.
In this paper, we want to detect the edges of bridge images that were taken by UAV and obtain the relevant edge detail information. To achieve a better detection effect, wavelet transform is used in advance to remove the noise interference in the image. In the wavelet transform process, relevant comparisons and discussions of wavelet functions and the number of decomposition levels are carried out for the image decomposition, and then, the optimal choice is determined. Edge detection is performed on the images before and after denoising, and the results are compared to show the importance of wavelet transform denoising indirectly. To further illustrate the advantages of the wavelet transform, both wavelet transform and Gaussian filtering are used for denoising, and then, the edge detections are carried out on the denoised results. Their corresponding Pratt quality factors show that using the wavelet transform is better at removing noise interference while retaining edge information.

2. Study Area and Data

2.1. Study Area

In this paper, a bridge in Wenzhou, Zhejiang Province, China, was selected as the experimental area. Wenzhou, in the western part of Zhejiang Province, China, lies between 27.03′ and 28.36′ N latitude and 119.37′ and 121.18′ E longitude and has well-developed water resources. The bridge has an arch-shaped structure, has been in use for many years and provides great convenience for local residents.

2.2. Data

During the maintenance of the bridge, relevant photographs of the bridge were taken by a drone, and a picture that reflected the full view of the bridge was selected as the source of data for this paper. The camera on the drone was a DJI ZH20 with a focal length of 7 mm, and the picture had an exposure time of 1/725th of a second, with a horizontal and vertical resolution of 72 dpi.

3. Materials and Methods

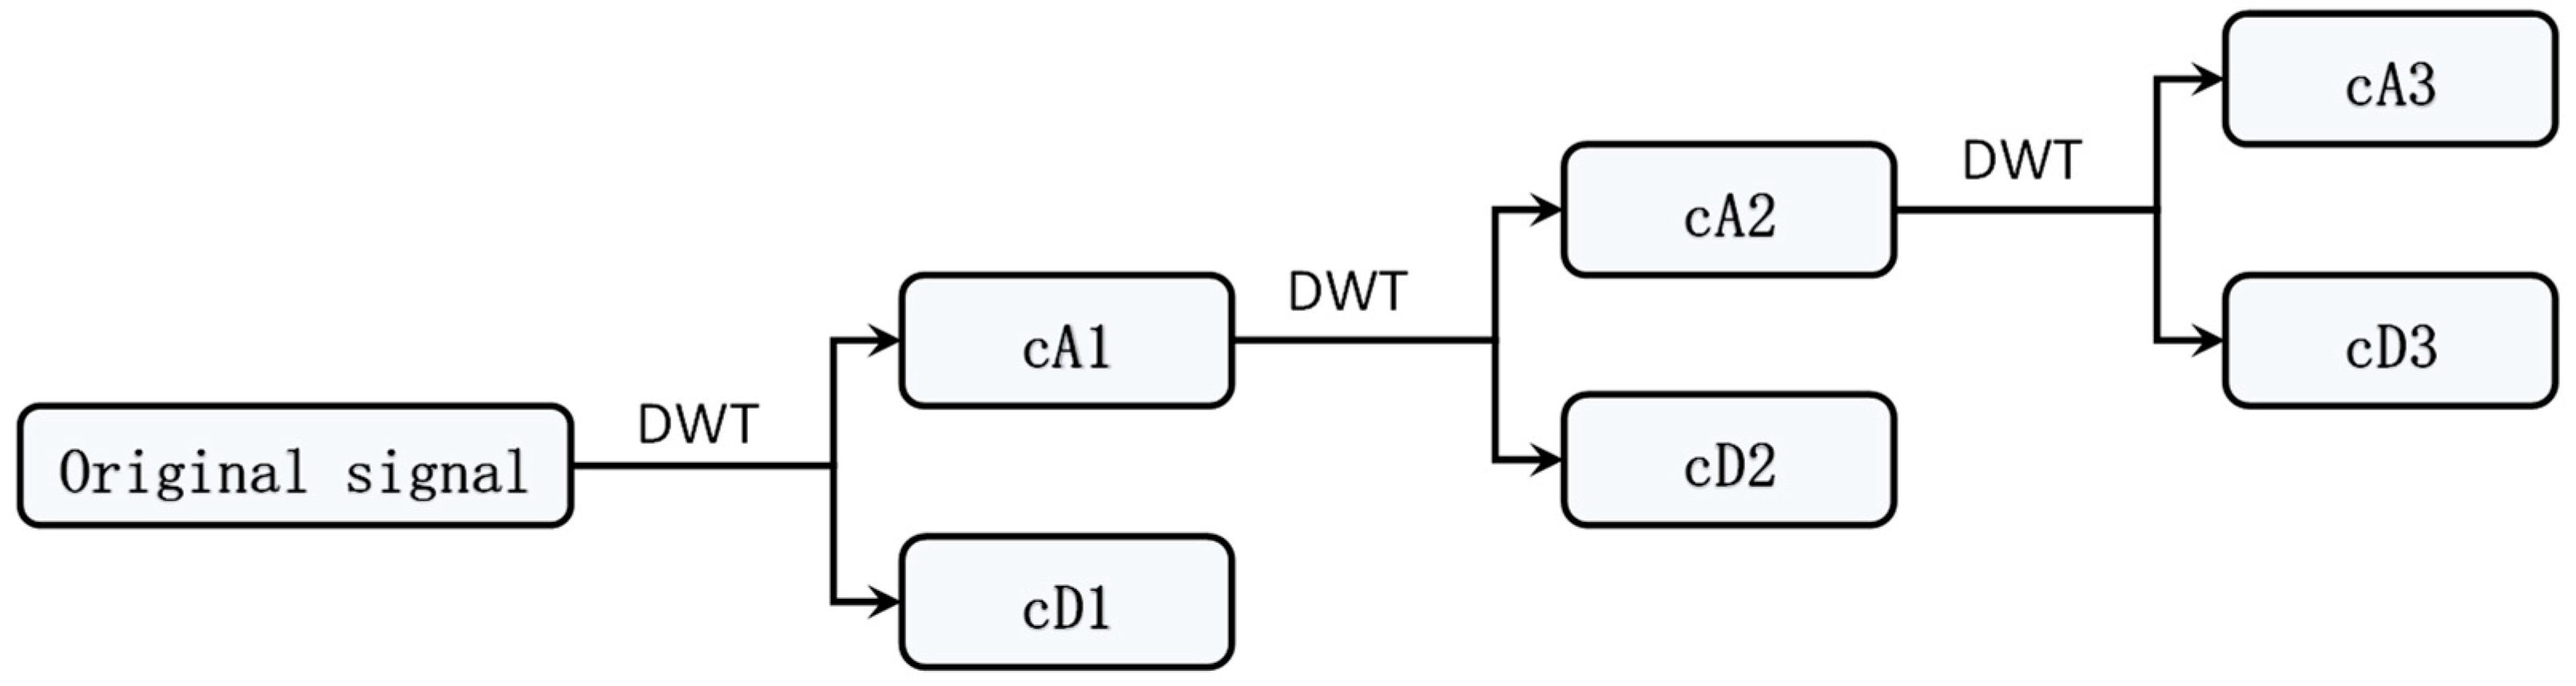
3.1. Wavelet Transform

The wavelet transform replaces the infinitely trigonometric basis of the Fourier transform with a finite decaying wavelet basis. The wavelet basis has a finite energy, usually concentrates around a single point, and the integral value is zero. In the Fourier transform, the variable is only ω, while the wavelet transform contains two variables, namely the scale a and the translation b. The scale a corresponds to frequency, and the translation b corresponds to time, so the wavelet transform can be used for time–frequency analysis to obtain the time–frequency spectrum of the signal. The wavelet sequence can be derived using the scaling and translation of the mother wavelet function, and the general form of the wavelet sequence is given below [14].
ψ a , b ( t ) = 1 a ψ ( t b a ) a , b R
In the process of performing the wavelet transform, the scale factor a and the time shift b are theoretically continuously varying, but this is a calculation that a computer cannot complete in a finite amount of time. In the wavelet transform, the scale factor a and the time shift b are taken to be discrete according to certain rules, also known as the discrete wavelet transform (DWT). If the scale factor a and the time shift b are chosen according to a power of 2, the analysis of the signal will become more accurate and efficient [15,16]. The wavelet function can be written as [14].
ψ m , n ( k ) = 2 m 2 ψ ( 2 m k n ) m , n Z
The wavelet transform can decompose the original image information into approximate and detailed components that mainly display the noise in the image.
After the wavelet reconstruction is then performed on the thresholding detailed components, we can obtain smoother image information. The general process of wavelet transform denoising is shown in Figure 1.
Based on the theory of function spaces, the wavelet transform is suitable for multi-scale analysis. Under different scales and space conditions, a set of scaling function vectors V and a set of wavelet function vectors V are created. At a particular level, the convolution of the signal in the scale space V obtains the approximation of the signal, which is a low-frequency signal. Meanwhile, the details of the signal obtained by convolving the signal in the wavelet space W are the high-frequency signals. During the decomposition process, the signal data are passed through a low-pass filter and a high-pass filter. The low-pass filter produces a low-frequency component of the signal, which is the approximation coefficient, while the high-pass filter produces the high-frequency component, which is the detail coefficient.
The advantage of the wavelet transform is that it can effectively avoid the disadvantages of the Fourier transform. It develops the localization idea of the short-time Fourier transform, and it can provide a “time–frequency” window that changes with frequency, which is an ideal tool for time–frequency analysis and signal processing.
It can highlight the characteristics of certain aspects of the problem by the transformation, localize the analysis of time (space) frequency and automatically adapt to the requirements of time–frequency signal analysis. Thus, it can focus on any details of the signal to solve the difficult problems faced by the Fourier transform, making it a major breakthrough in the scientific method since the Fourier transform.
In the wavelet transform, the functions are crucial and should be selected in a comprehensive manner in terms of support length, symmetry, regularity and similarity. The functions, such as db, sym, coif and fk [11,17,18,19,20,21,22,23], are the most commonly used. db is short for Daubechies. The wavelet function was constructed by Daubechies and is generally abbreviated as dbN (N being the order of the wavelet). With good regularity, the dbN wavelet is characterized by nonlinear phase energy concentrated near the beginning of its support.
For the dbN wavelet, as the order (sequence N) increases, the greater the order of the vanishing moment, where the higher the vanishing moment the better the smoothness, the stronger the localization ability of the frequency domain, and the better the division of the frequency band, but it will make the time domain tight support weaken, while the computational volume increases greatly and the real-time performance becomes worse. sym is short for Symlet, and the Symlet wavelet is usually denoted as symN (N = 2, 3 …, 8). symN wavelets also have good regularity. The wavelet is consistent with the dbN wavelet in terms of continuity, branch length and filter length, but the symN wavelet has a better symmetry, i.e., it can reduce phase distortion when analyzing and reconstructing the signal to some extent. coif is short for coiflet and is usually denoted as the series coifN (N = 1, 2, 3, 4, 5). The wavelet function Ψ(t) of a coiflet has zero moments of order 2N, and the scaling function φ(t) has zero moments of order 2N − 1. Ψ(t) and φ(t) have a support length of 6N − 1. Ψ(t) and φ(t) of a coiflet have better symmetry than dbN. They are characterized by scaling functions and wavelets with the same number of vanishing terms. fk is short for Fejér–Korovkin and is usually denoted as fkN (N = 4, 6, 8, 14, 18, 22), with N denoting the filter length. A filter is constructed by minimizing the difference between an effective scaling filter and an ideal sine-pass filter, particularly useful in discrete (extracted and unextracted) wavelet packet transforms.
At the same time, the number of decomposition levels is also crucial. In wavelet decomposition, the signal is decomposed level by level. The decomposition of the approximate component of one level can produce the approximate component (cA) and the detail component (cD) of the next level, as shown in Figure 2.
Therefore, the more levels there are, the more obvious the distinction between information and noise is, and the better it is to distinguish between the two. However, the increased number of levels also leads to increased distortion of the reconstructed signal, which may affect the reconstruction of the signal.

3.2. Data Processing

PSNR (peak signal-to-noise ratio) is the ratio of the maximum possible power of the information to the noise that affects its fidelity. In the image processing, PSNR is mainly used to measure the reconstruction effect of pictures and images disturbed by lossy compression. PSNR can be expressed as:
P S N R = 20 lg ( M A X 1 ) 10 lg ( M S E )
where MSE is the mean square error between images and MAX1 is the maximum possible pixel value in the images. In this paper, the peak signal-to-noise ratio and the inter-image mean square error are used as the main basis for selecting the optimal wavelet function and the number of decomposition levels.

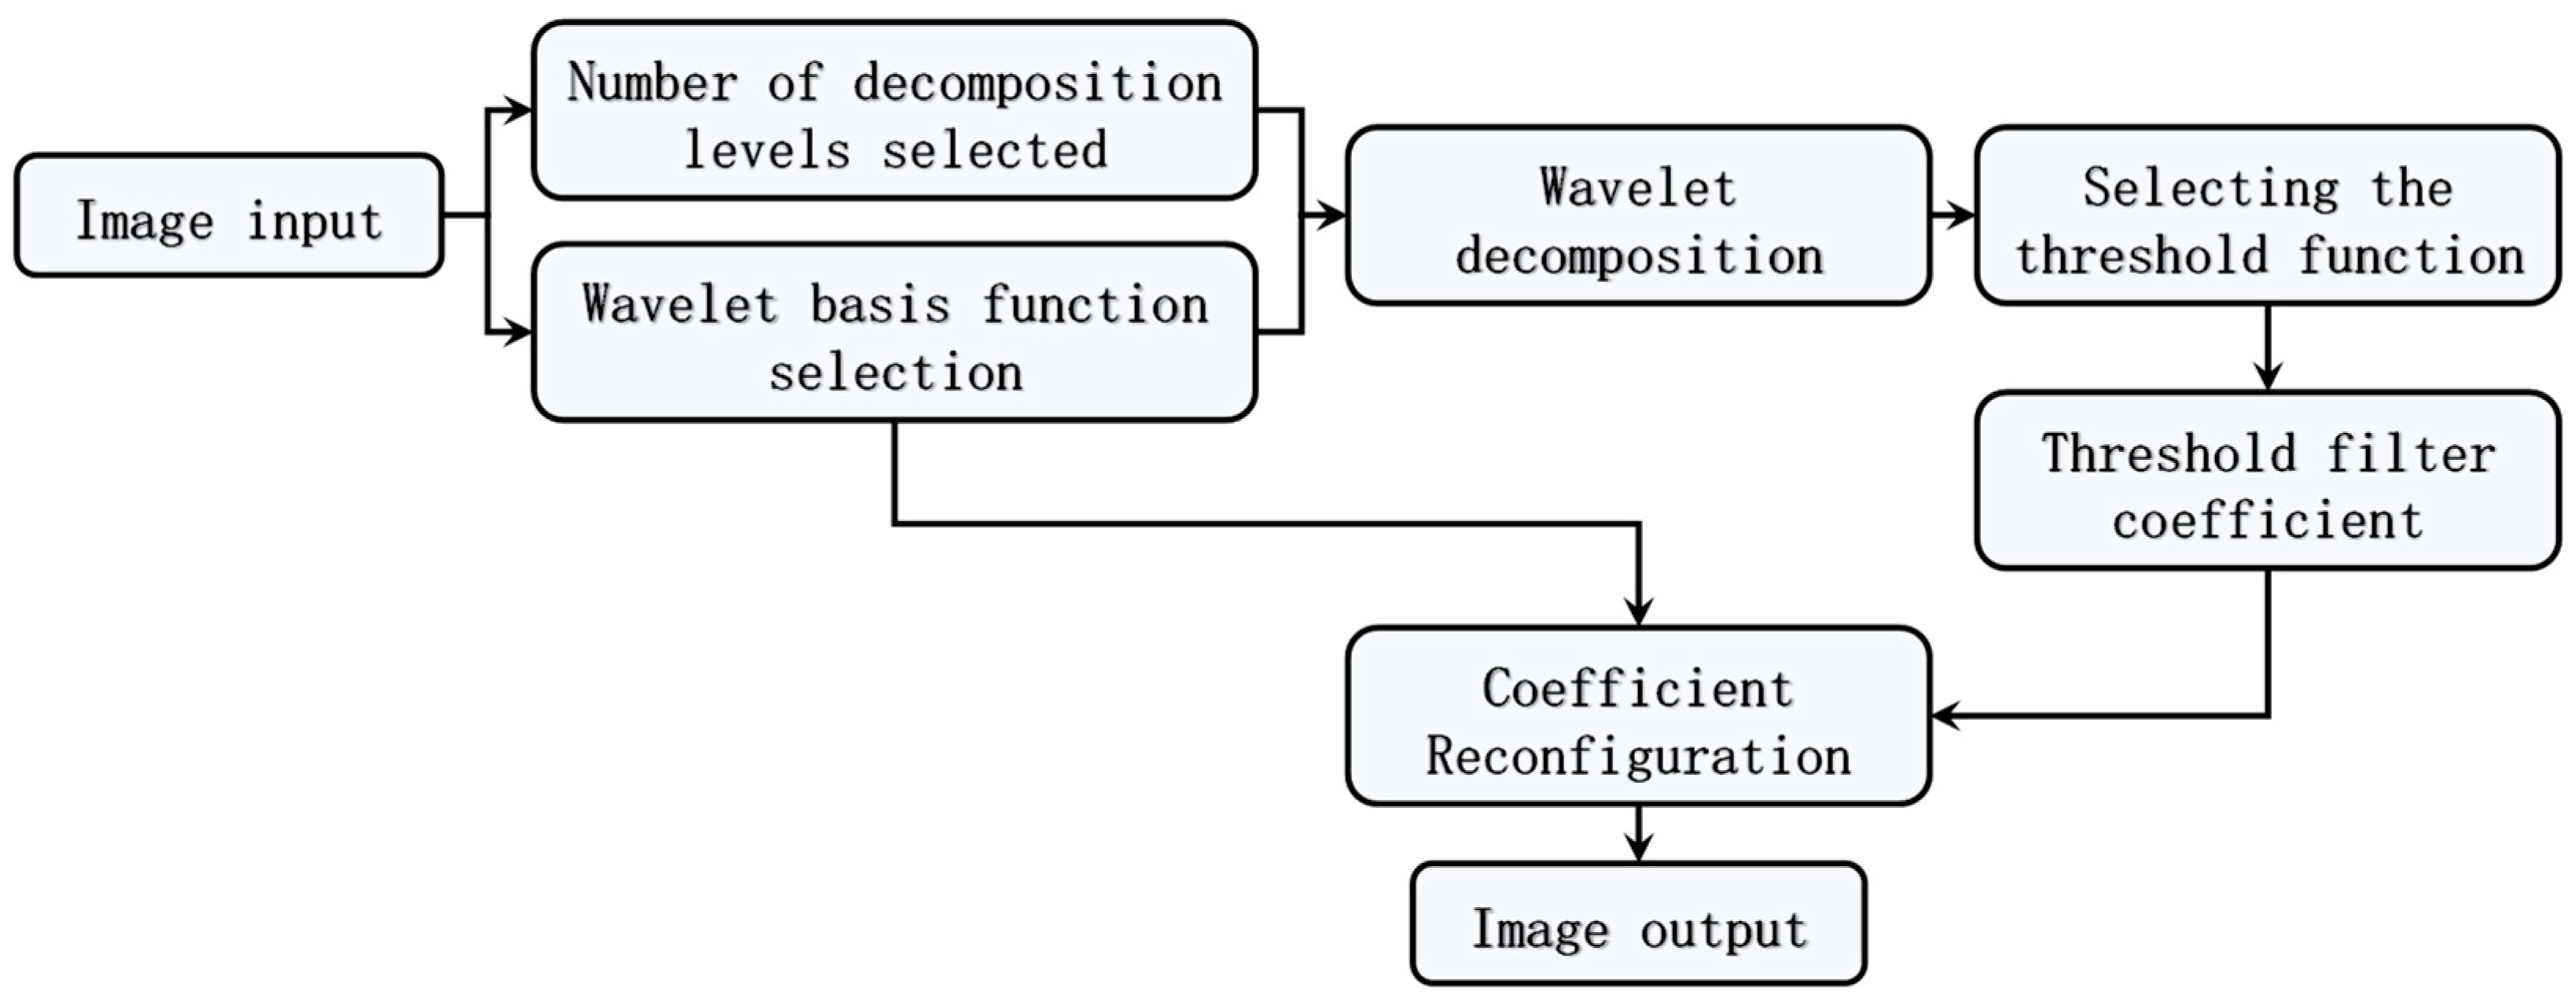
3.2.1. Selecting Wavelet Function and Number of Levels

The wavelet functions sym5, db5, coif5 and fk6 were chosen to decompose the target image with three decomposition levels. A hard threshold function was used for denoising. The PSNR and MSE of the reconstructed results were calculated.
Comparing the results of this image processing from Table 1, the performances of the four wavelet functions show little difference from each other. Generally speaking, sym5 corresponds to a PSNR and MSE of 23.48 dB and 299.49, which are the maximum and minimum values in the results, respectively. Therefore, sym5 performs slightly better than the other wavelet functions overall. That is, sym5 will be a better choice for noise removal.
Now, the sym5 wavelet function is used to decompose the image into different levels for denoising, and the PSNR and MSE of the processing results are calculated again.
Comparing the PSNR and MSE in the results, we can see that when the number of decomposition levels is three, the PSNR is the largest and the MSE is the smallest, at 23.48 dB and 299.49, respectively, which means that the denoising effect on the image is more obvious.
Considering Table 1 and Table 2 together, when the sym5 wavelet function is chosen to perform a three-level decomposition on the original image, the result shows the largest PSNR, the smallest MSE and the best image quality. Therefore, the combination of sym5 wavelet function and three-level decomposition will be adopted in the following edge detection in this paper.

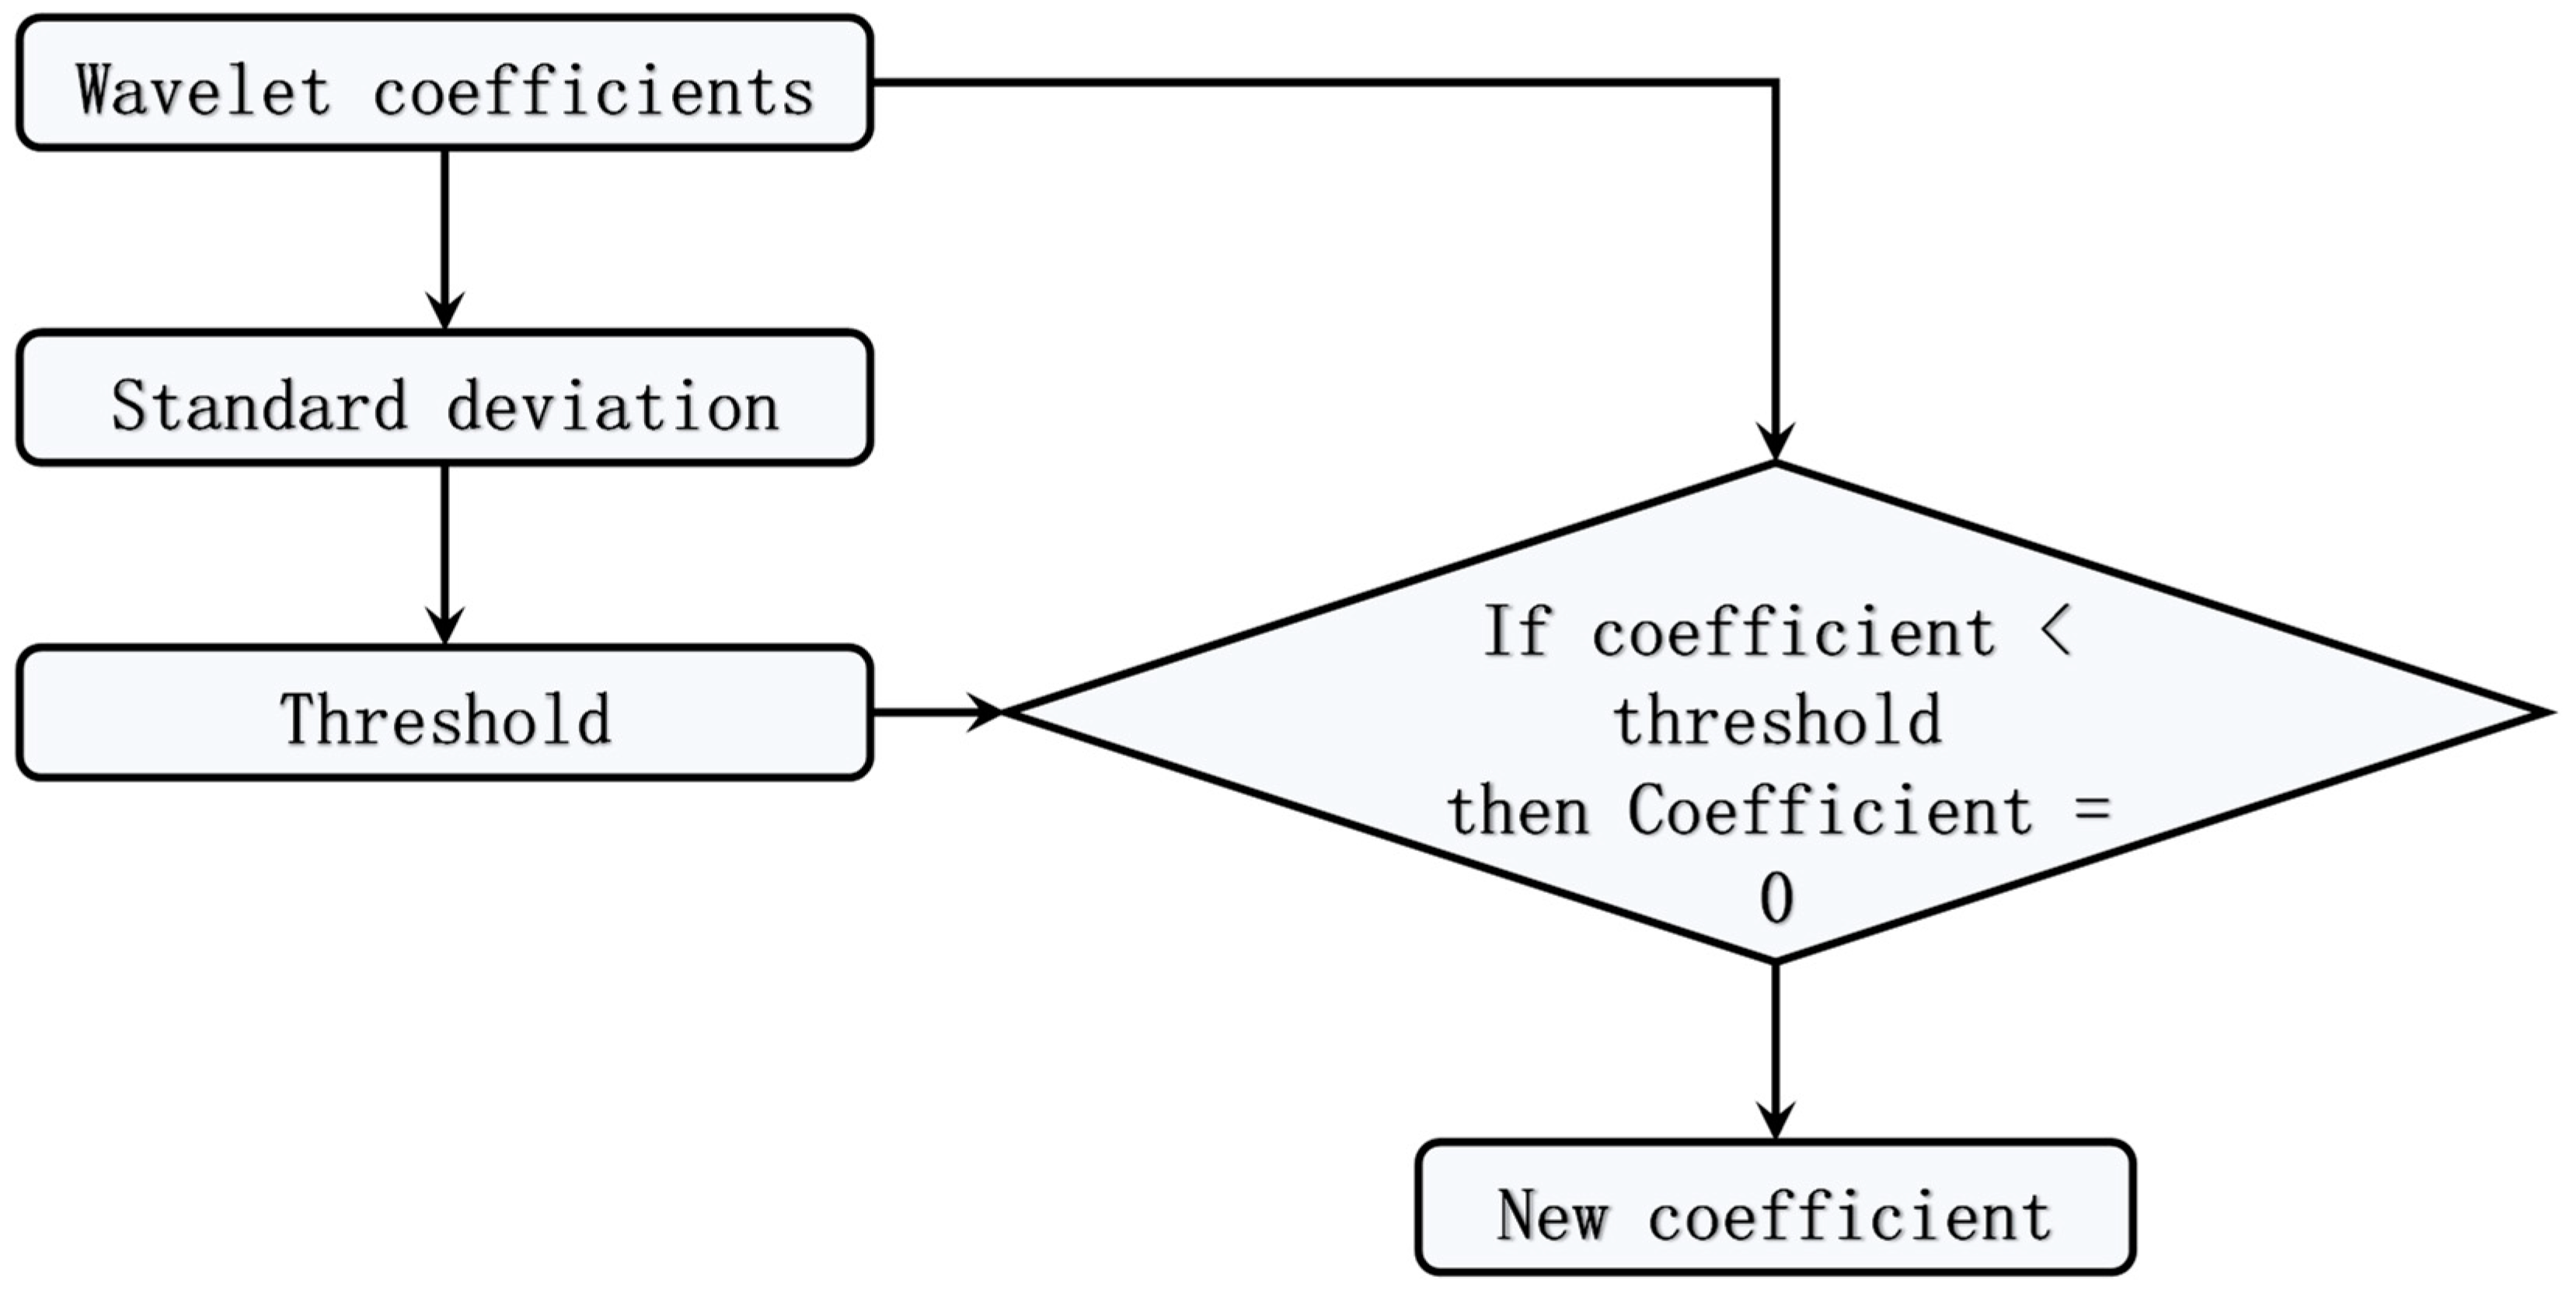
3.2.2. Image Denoising

For two-dimensional image information, wavelet decomposition can be performed in the horizontal and vertical directions to obtain the corresponding wavelet coefficients. The wavelet coefficients are the projection of the space of wavelet functions chosen to run the wavelet decomposition. The decomposed high-frequency coefficients are threshold quantized and filtered by selecting an appropriate threshold value and a suitable threshold function. Finally, the wavelet inversion is performed, and the wavelet reconstruction is carried out using the reconstruction algorithm to obtain the denoised signal based on the deepest low-frequency coefficients of the wavelet decomposition and the high-frequency coefficients (wavelet coefficients) of each level after the threshold quantization process. After the multi-resolution decomposition is achieved, the approximate coefficients, horizontal detail coefficients, vertical detail coefficients and diagonal detail coefficients of each level can be derived. The decomposition results are shown in Figure 3 and Figure 4.
After the decomposition is completed, the effective part of the signal corresponds to a larger coefficient, and the noise corresponds to relatively small coefficient. Therefore, the coefficients in a certain interval can be filtered, and the noise will be suppressed simultaneously by setting a suitable threshold and threshold function. In general, the threshold function can be selected as either a hard or soft threshold function, both of which have advantages and disadvantages. Hard threshold functions are better than soft threshold functions in the sense of mean squared deviation, but they may produce jump points, while soft threshold functions have better continuity but produce biases that affect the reconstructed signal [5,24,25,26]. The hard threshold function working process is shown in Figure 5.
In this paper, a hard threshold function is chosen to process the coefficients, and the wavelet reconstruction is followed. The wavelet function used in the reconstruction process is consistent with the decomposition process. After thresholding of the bridge image, which contains noise, the coefficients are reconstructed, as shown in Figure 6.

4. Results and Verification

It has been more than thirty years since the canny edge detection algorithm was proposed, and it is still one of the classic image edge detection algorithms. Compared to other edge detection algorithms, canny has significant improvements in both non-extreme value suppression based on the direction of the edge gradient and lag thresholding with double thresholding. The process generally consists of four stages: noise removal, calculation of gradient amplitude and direction, non-maximum suppression and hysteresis thresholding [27,28,29].
The bridge images before and after noise removal by wavelet transform were subjected to edge detection, and the results obtained are shown in Figure 7. From Figure 7a, it can be seen that the edges of the bridge are initially revealed, but the noise has affected the accuracy of obtaining the relevant detail information of the bridge, and the quality of the whole image is not good enough to provide more reference and support. Compared to Figure 7a, the effect of noise on the results has been significantly reduced in Figure 7b; the bridge edges are basically clear and the presentation of details has been improved, which shows that the removal of noise with wavelet transform before edge detection is obvious and necessary.

5. Analysis and Discussion

In the previous sections of this paper, it was shown that the difference in the results of edge detection before and after denoising illustrates the importance of denoising. When using the canny operator for detection, Gaussian filtering is generally used for denoising purposes. Gaussian filtering is a linear smoothing filter, which is suitable for removing Gaussian noise and is widely used in the noise reduction of image processing. Generally speaking, Gaussian filtering is the process of weighted averaging of the entire image, where the value of each pixel is obtained by a weighted average of its own value and the values of other pixels in its neighborhood.
Gaussian filtering is performed by scanning each pixel in the image with a template (or convolution, mask) and by replacing the value of the pixel point at the center of the template with the weighted average grey value of the pixels in the neighborhood determined by the template.
For mean and box filtering, the weights of each pixel in the neighborhood are equal. In the case of Gaussian filtering, the weights at the center are increased and the weights away from the center are decreased, on the basis of which the sum of the different weights of each pixel value in the neighborhood is calculated.
To further illustrate the superiority of the wavelet, transform denoising in edge detection, the effects of wavelet transform and Gaussian filtering corresponding to the two denoising methods are compared. The effect can be expressed in terms of the Pratt quality factor, which focuses on the three errors of missed detection of valid edges, edge positioning errors and misjudging noise as edges [30,31], and takes values from 0 to 1. The calculation is as follows [32].
F M = 1 max ( I A , I I ) i = 1 I A 1 1 + a d i 2
where IA, II, di and a are the detected edge point, the reference edge point, the distance between the detected edge point and the reference edge point and the design constant that is used to penalize misaligned edges, respectively. Generally, a = 1/9 is taken.
As shown in Table 3, the quality factors of 0.47 and 0.53 were calculated for the Gaussian-filtered and wavelet-transformed images, respectively, which showed that the quality factor of edge detection increased after the wavelet-transformed noise removal, and the detection effect was improved to a certain extent, that is to say, more edge details were retained while the noise interference was removed.
Gaussian filtering is mainly applicable to the removal of Gaussian noise and has limited effects on the removal of other types of common image noises (pretzel noise, Poisson noise, multiplicative noise), while the wavelet transform has no such limitations. The PSNR and MSE of the denoised images were calculated and are plotted in Table 4. They initially suggest that the wavelet transform is less susceptible to the limitations of noise types. In the following, the edge detection results will be combined for further argumentation.
Figure 8, Figure 9 and Figure 10 show the edge detection results after noise removal. Because Gaussian filtering has limited effects on the elimination of these three types of noise, the noise will lead to a negative impact on the detection effect in the edge detection process, and a lot of noise remains in the image, which affects the image quality and the extraction of relevant detail information. In contrast, the effect of noise in the edge detection image after denoising by wavelet transform is less, which is more conducive to the following effective information extraction. Therefore, in terms of applicability to noise types, wavelet transform has more advantages.

6. Conclusions

In many cities in China, especially in the southern region, as a kind of infrastructure, bridges always affect the basic operation and economic development of the city. In order to meet the daily maintenance requirements of the bridge, we can extract the edges of bridges from maintenance images to obtain a lot of useful information. In the process of edge extraction, the edges of the original images are often interspersed with a lot of noise, which affects the edge extraction. In this paper, the wavelet transform is used to remove the noise from the images before edge detection, which effectively improves the effect of bridge image edge detection. The detailed conclusions are as follows.
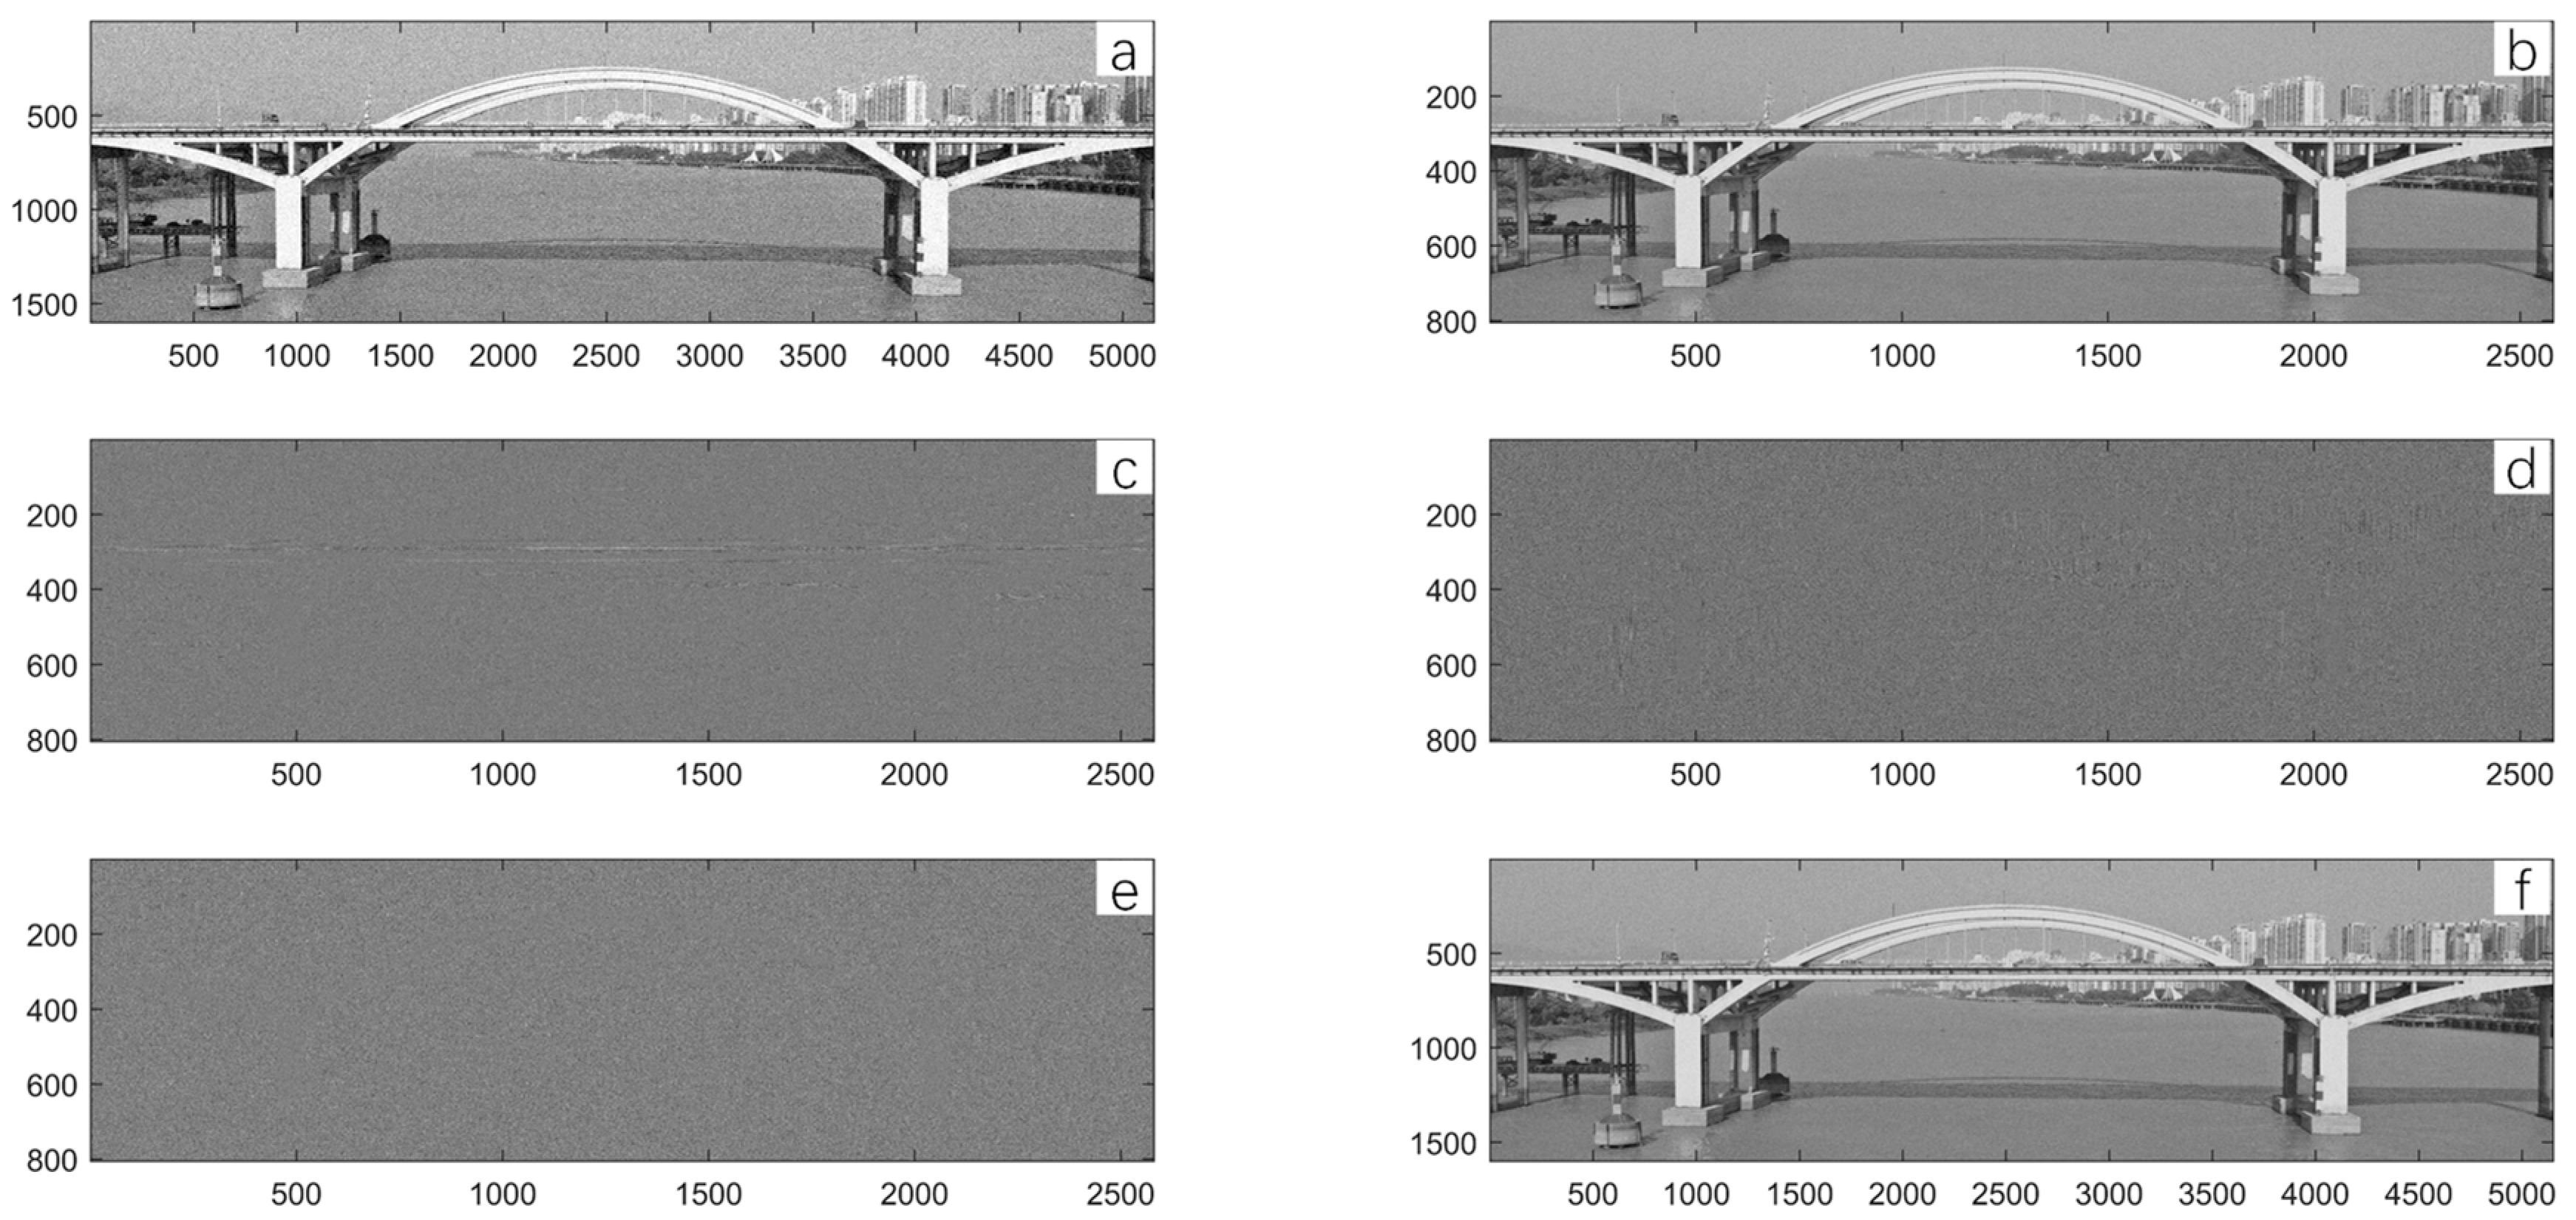
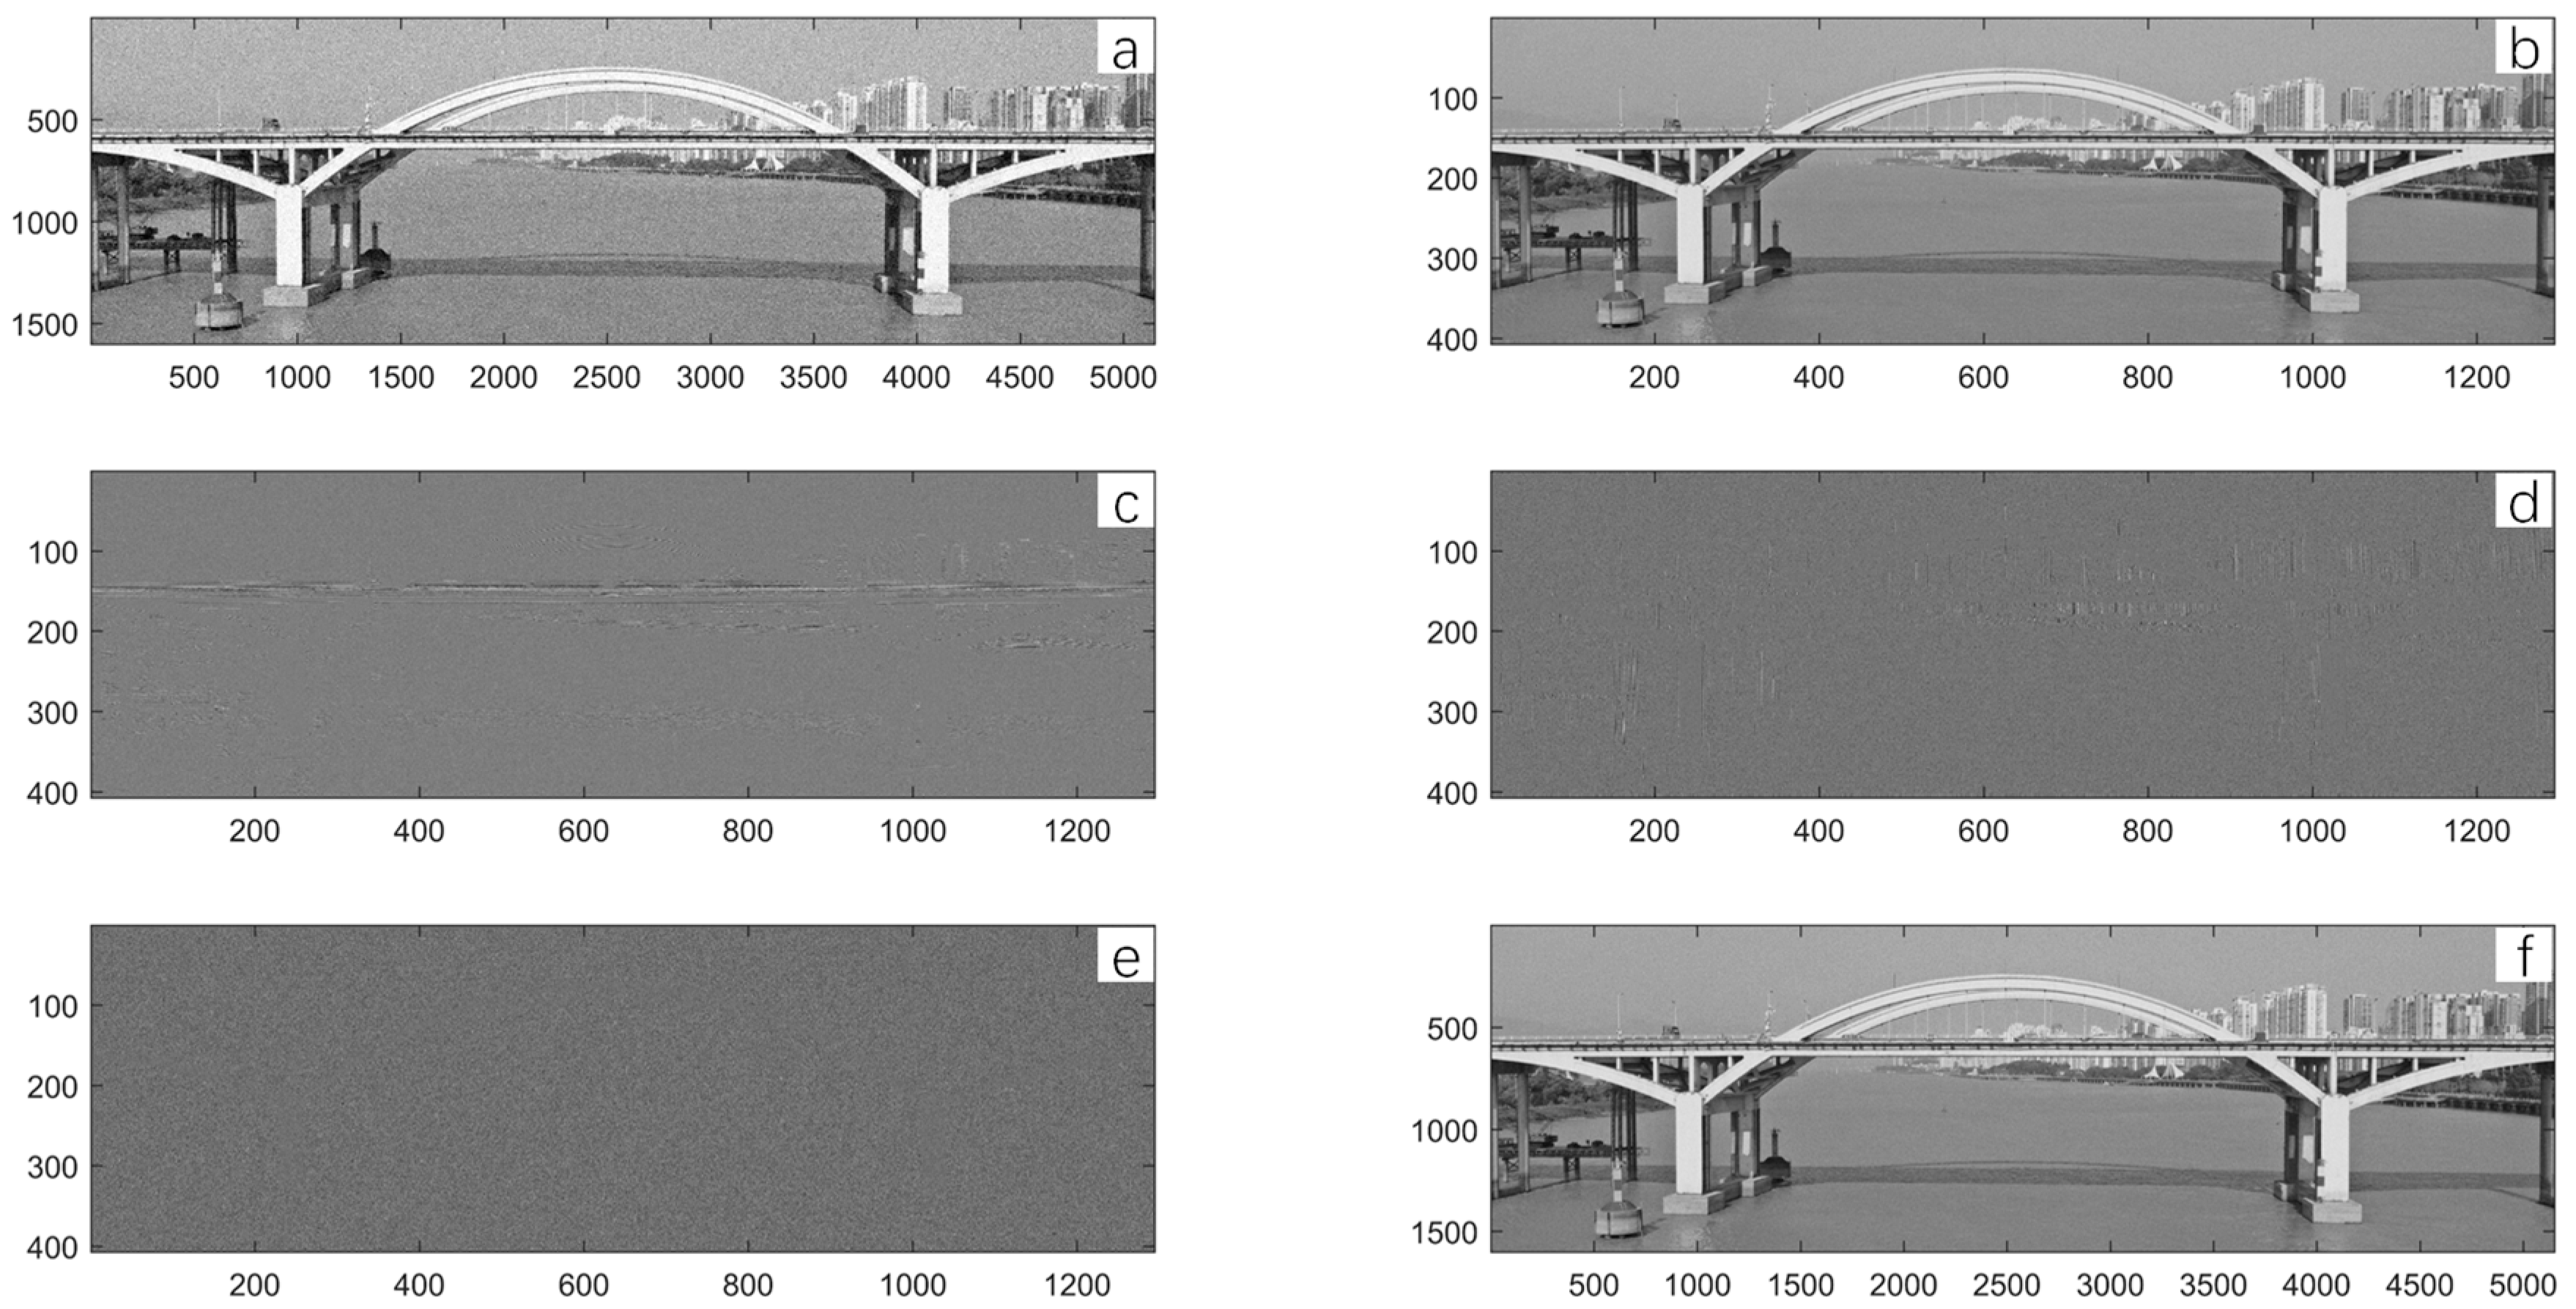
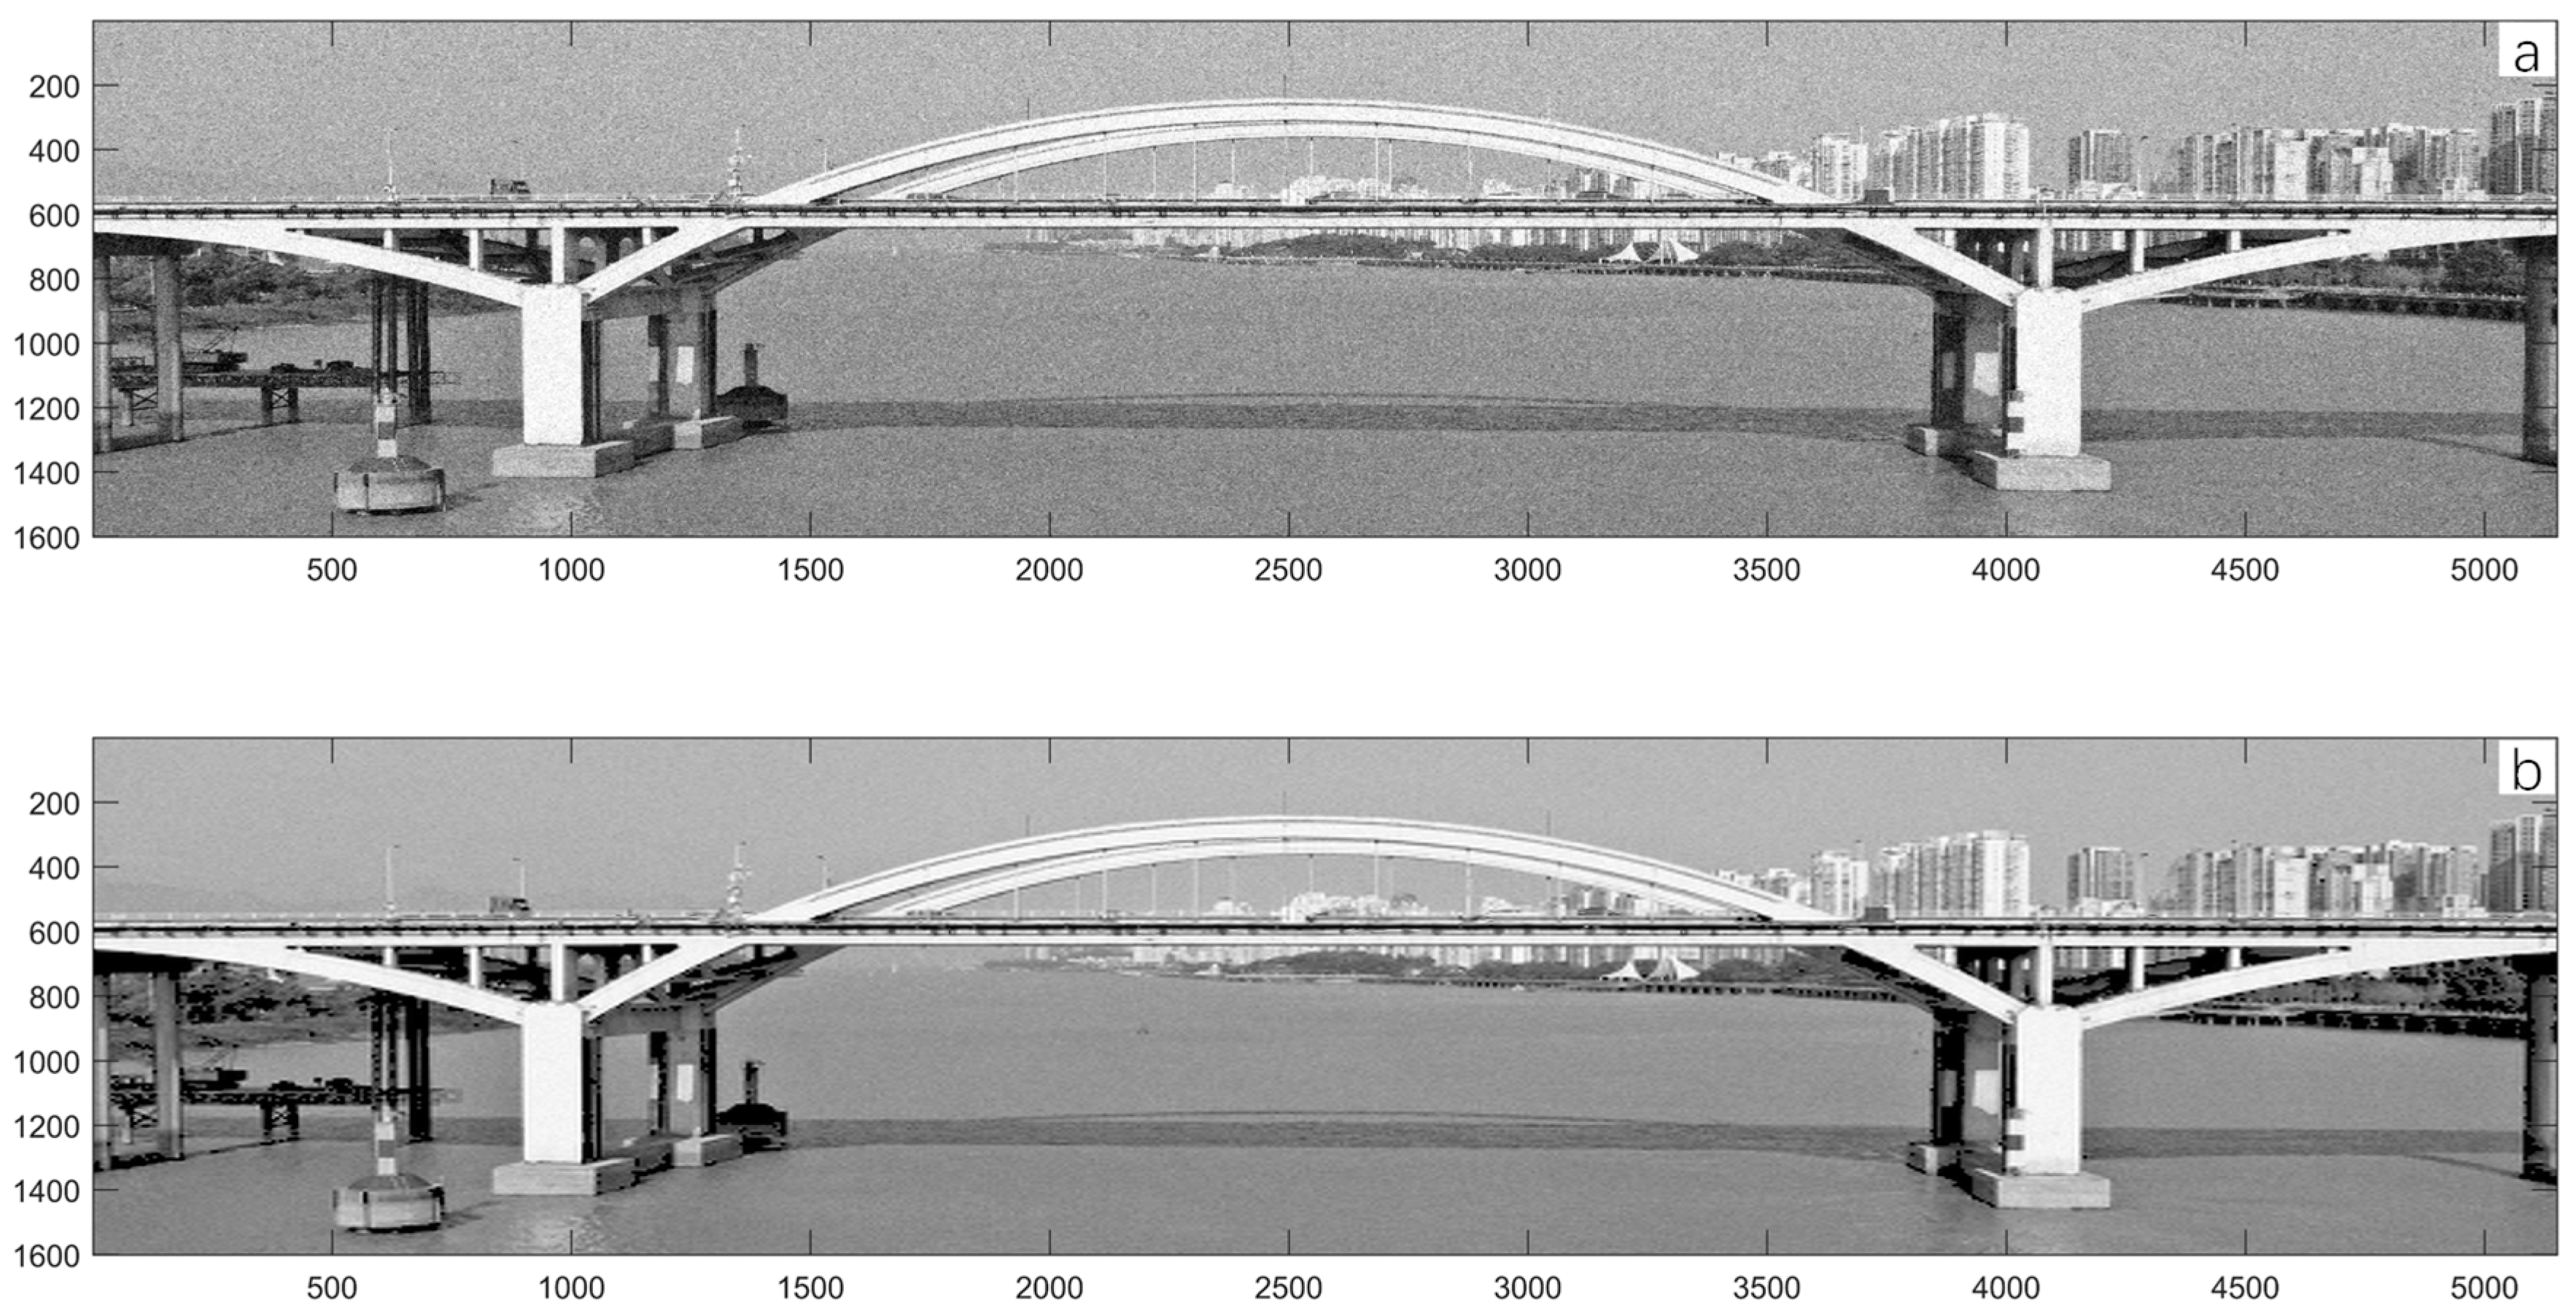
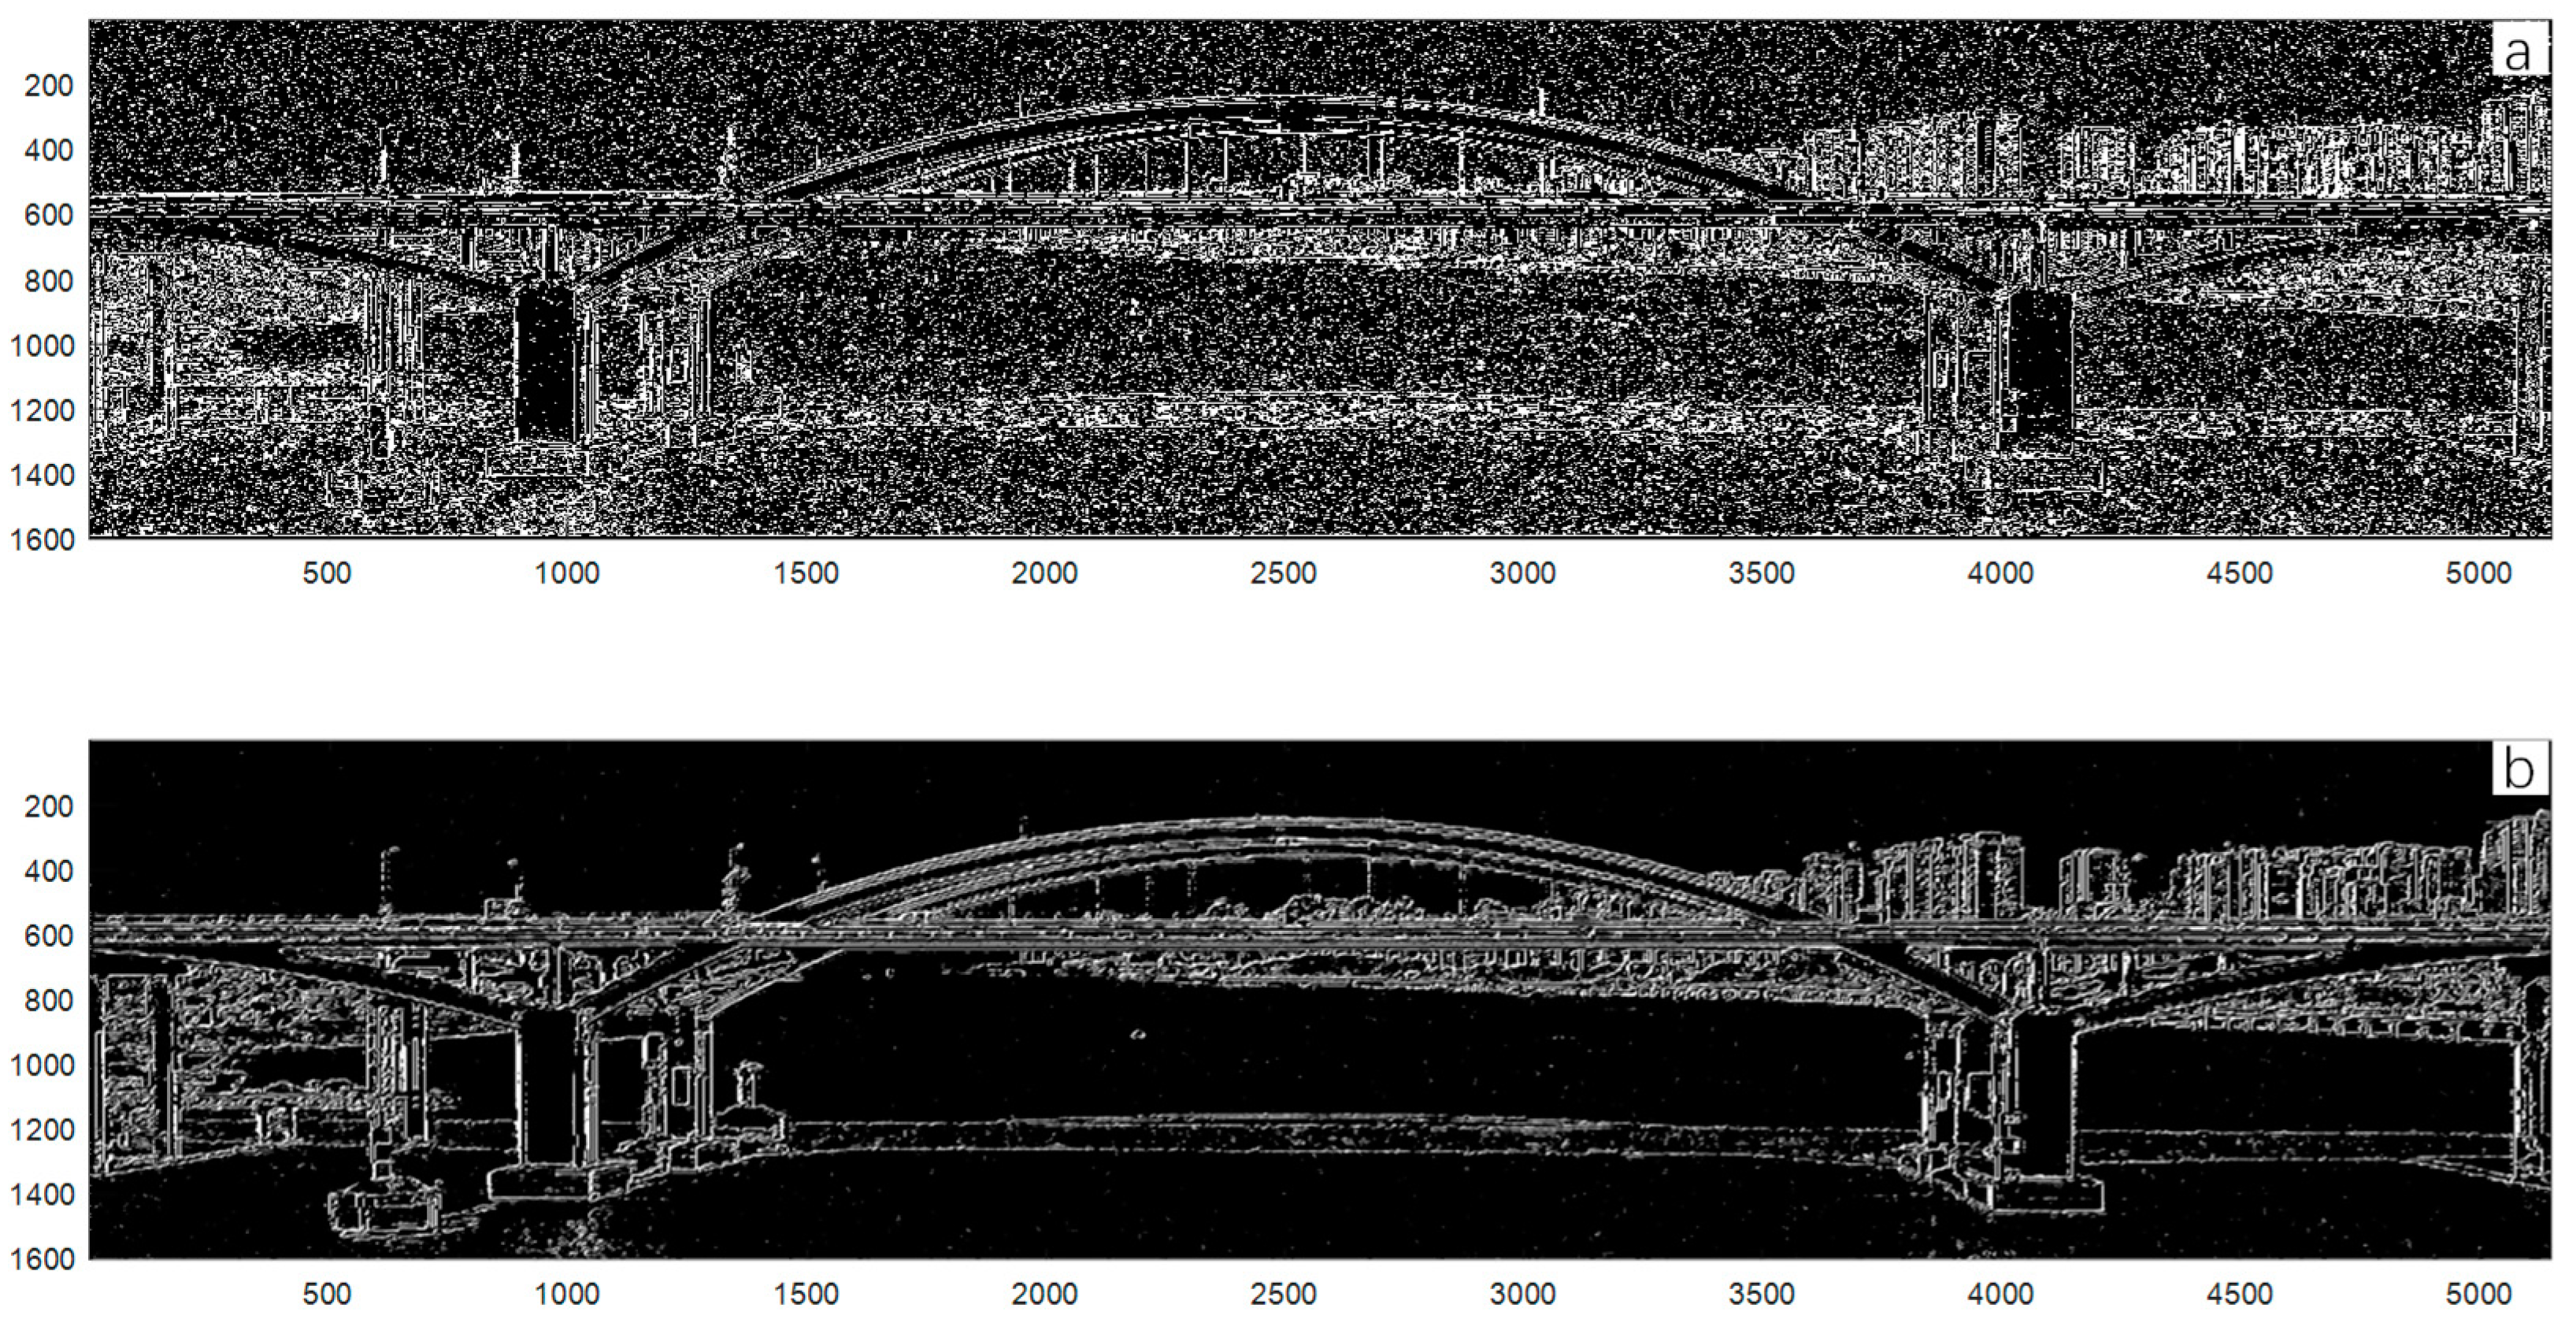
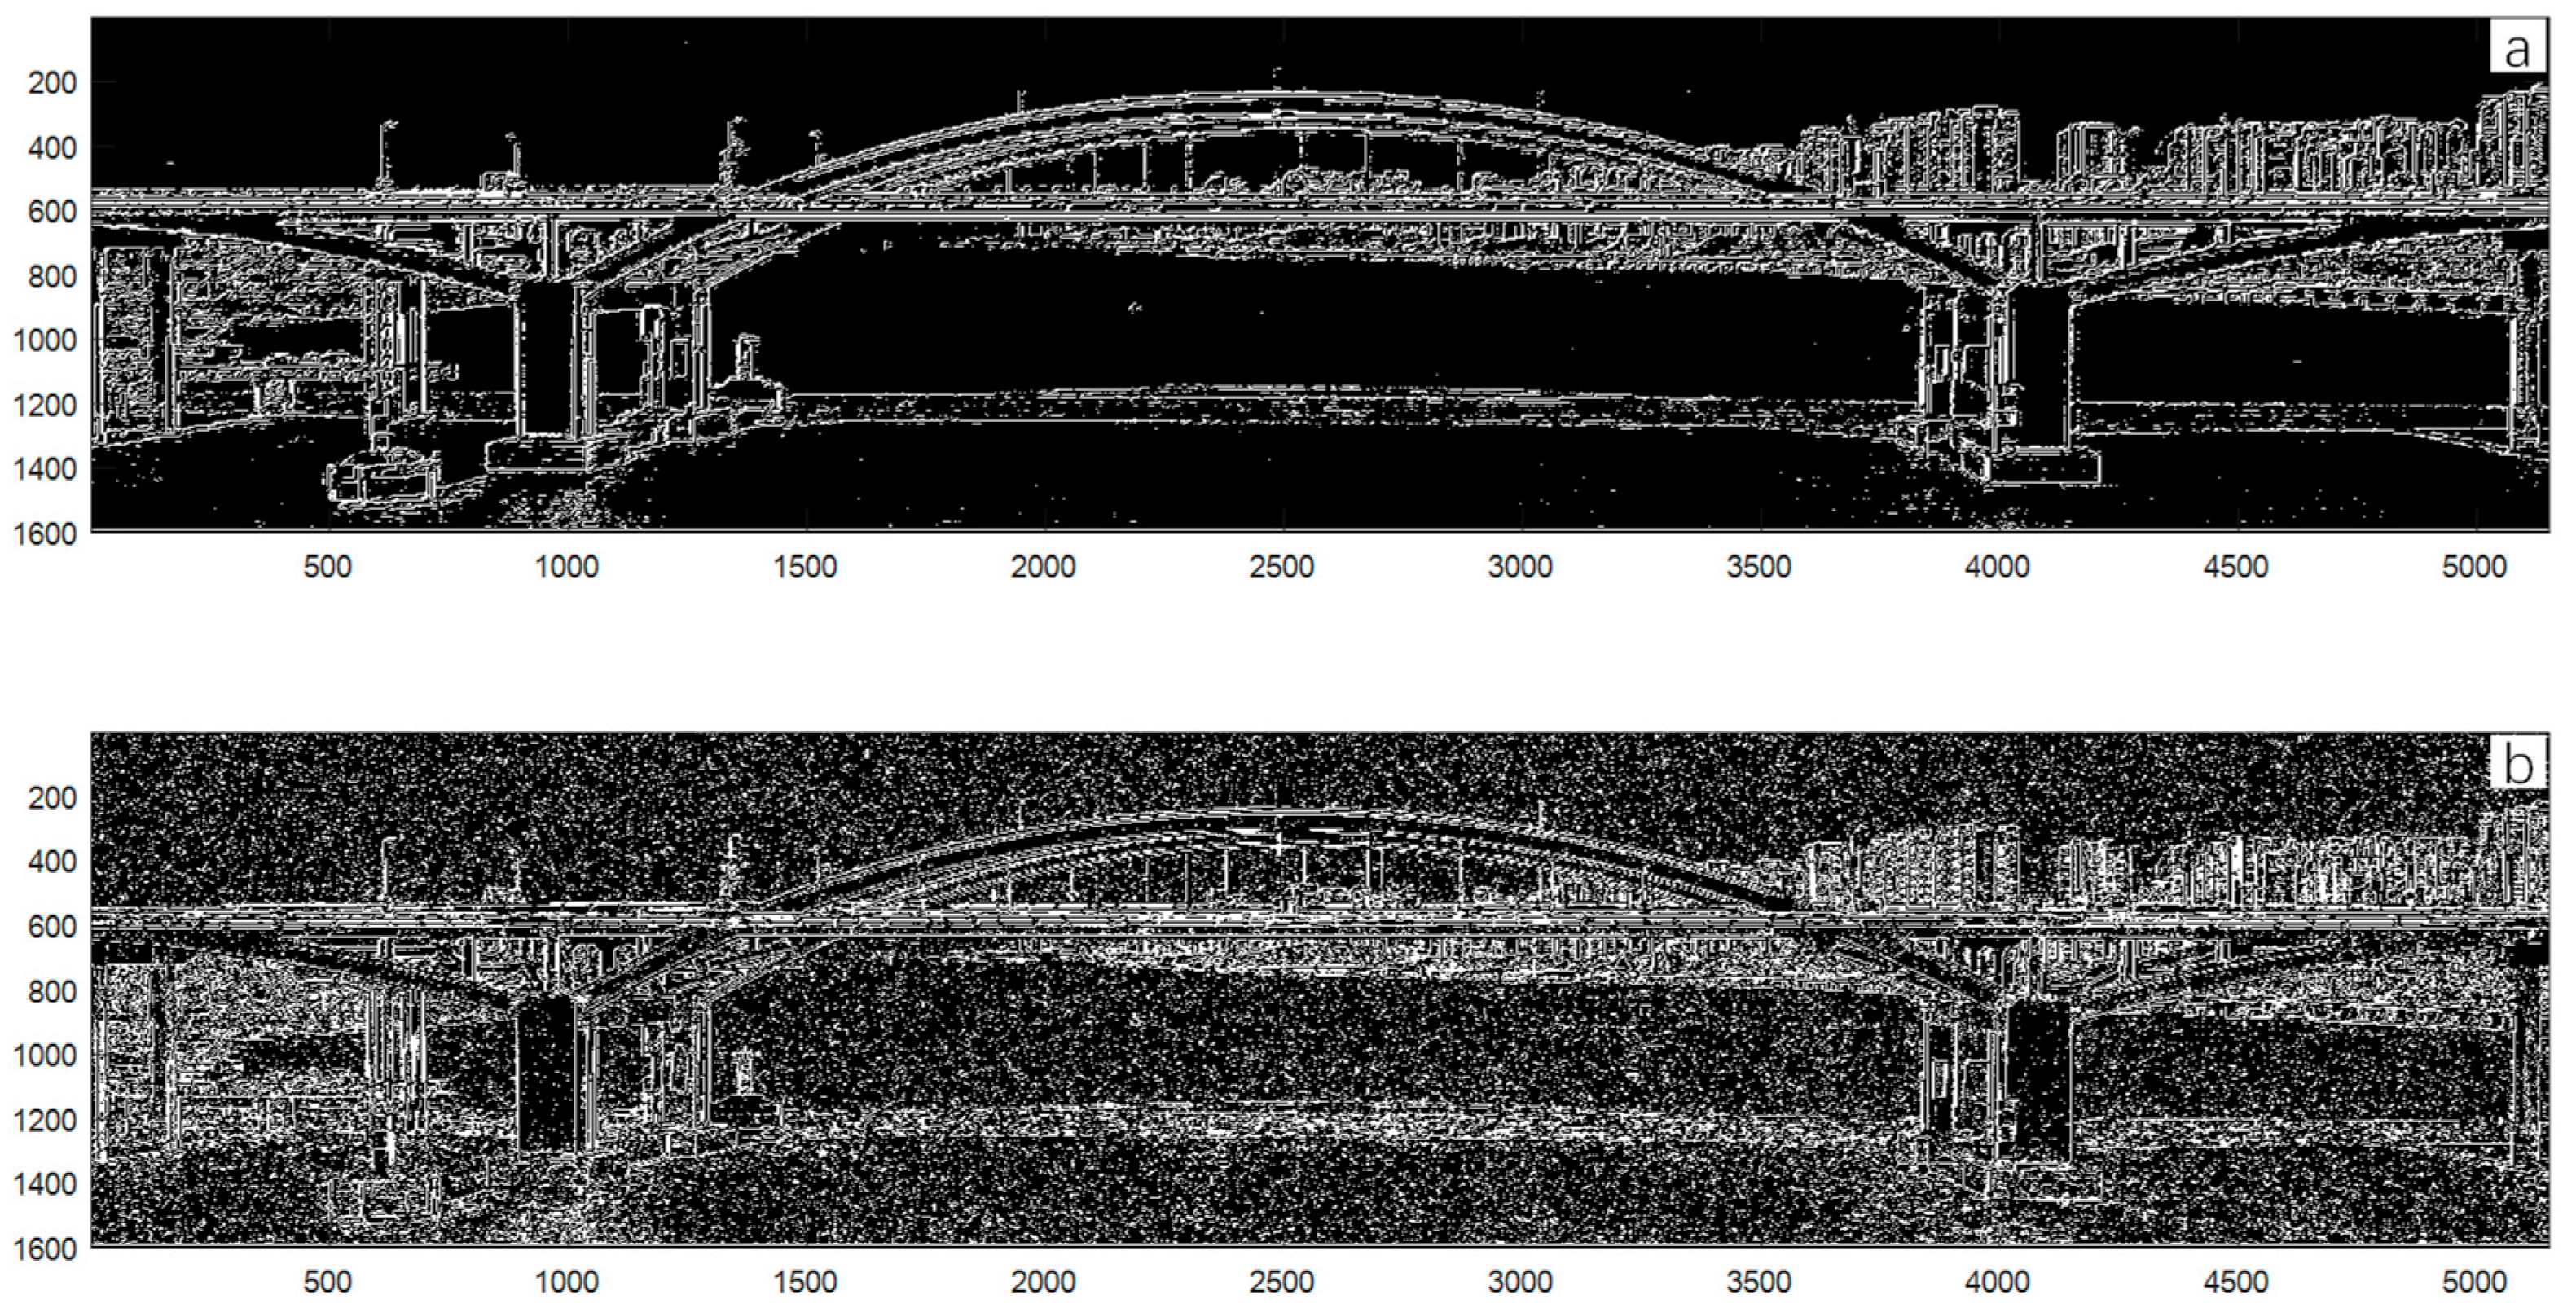
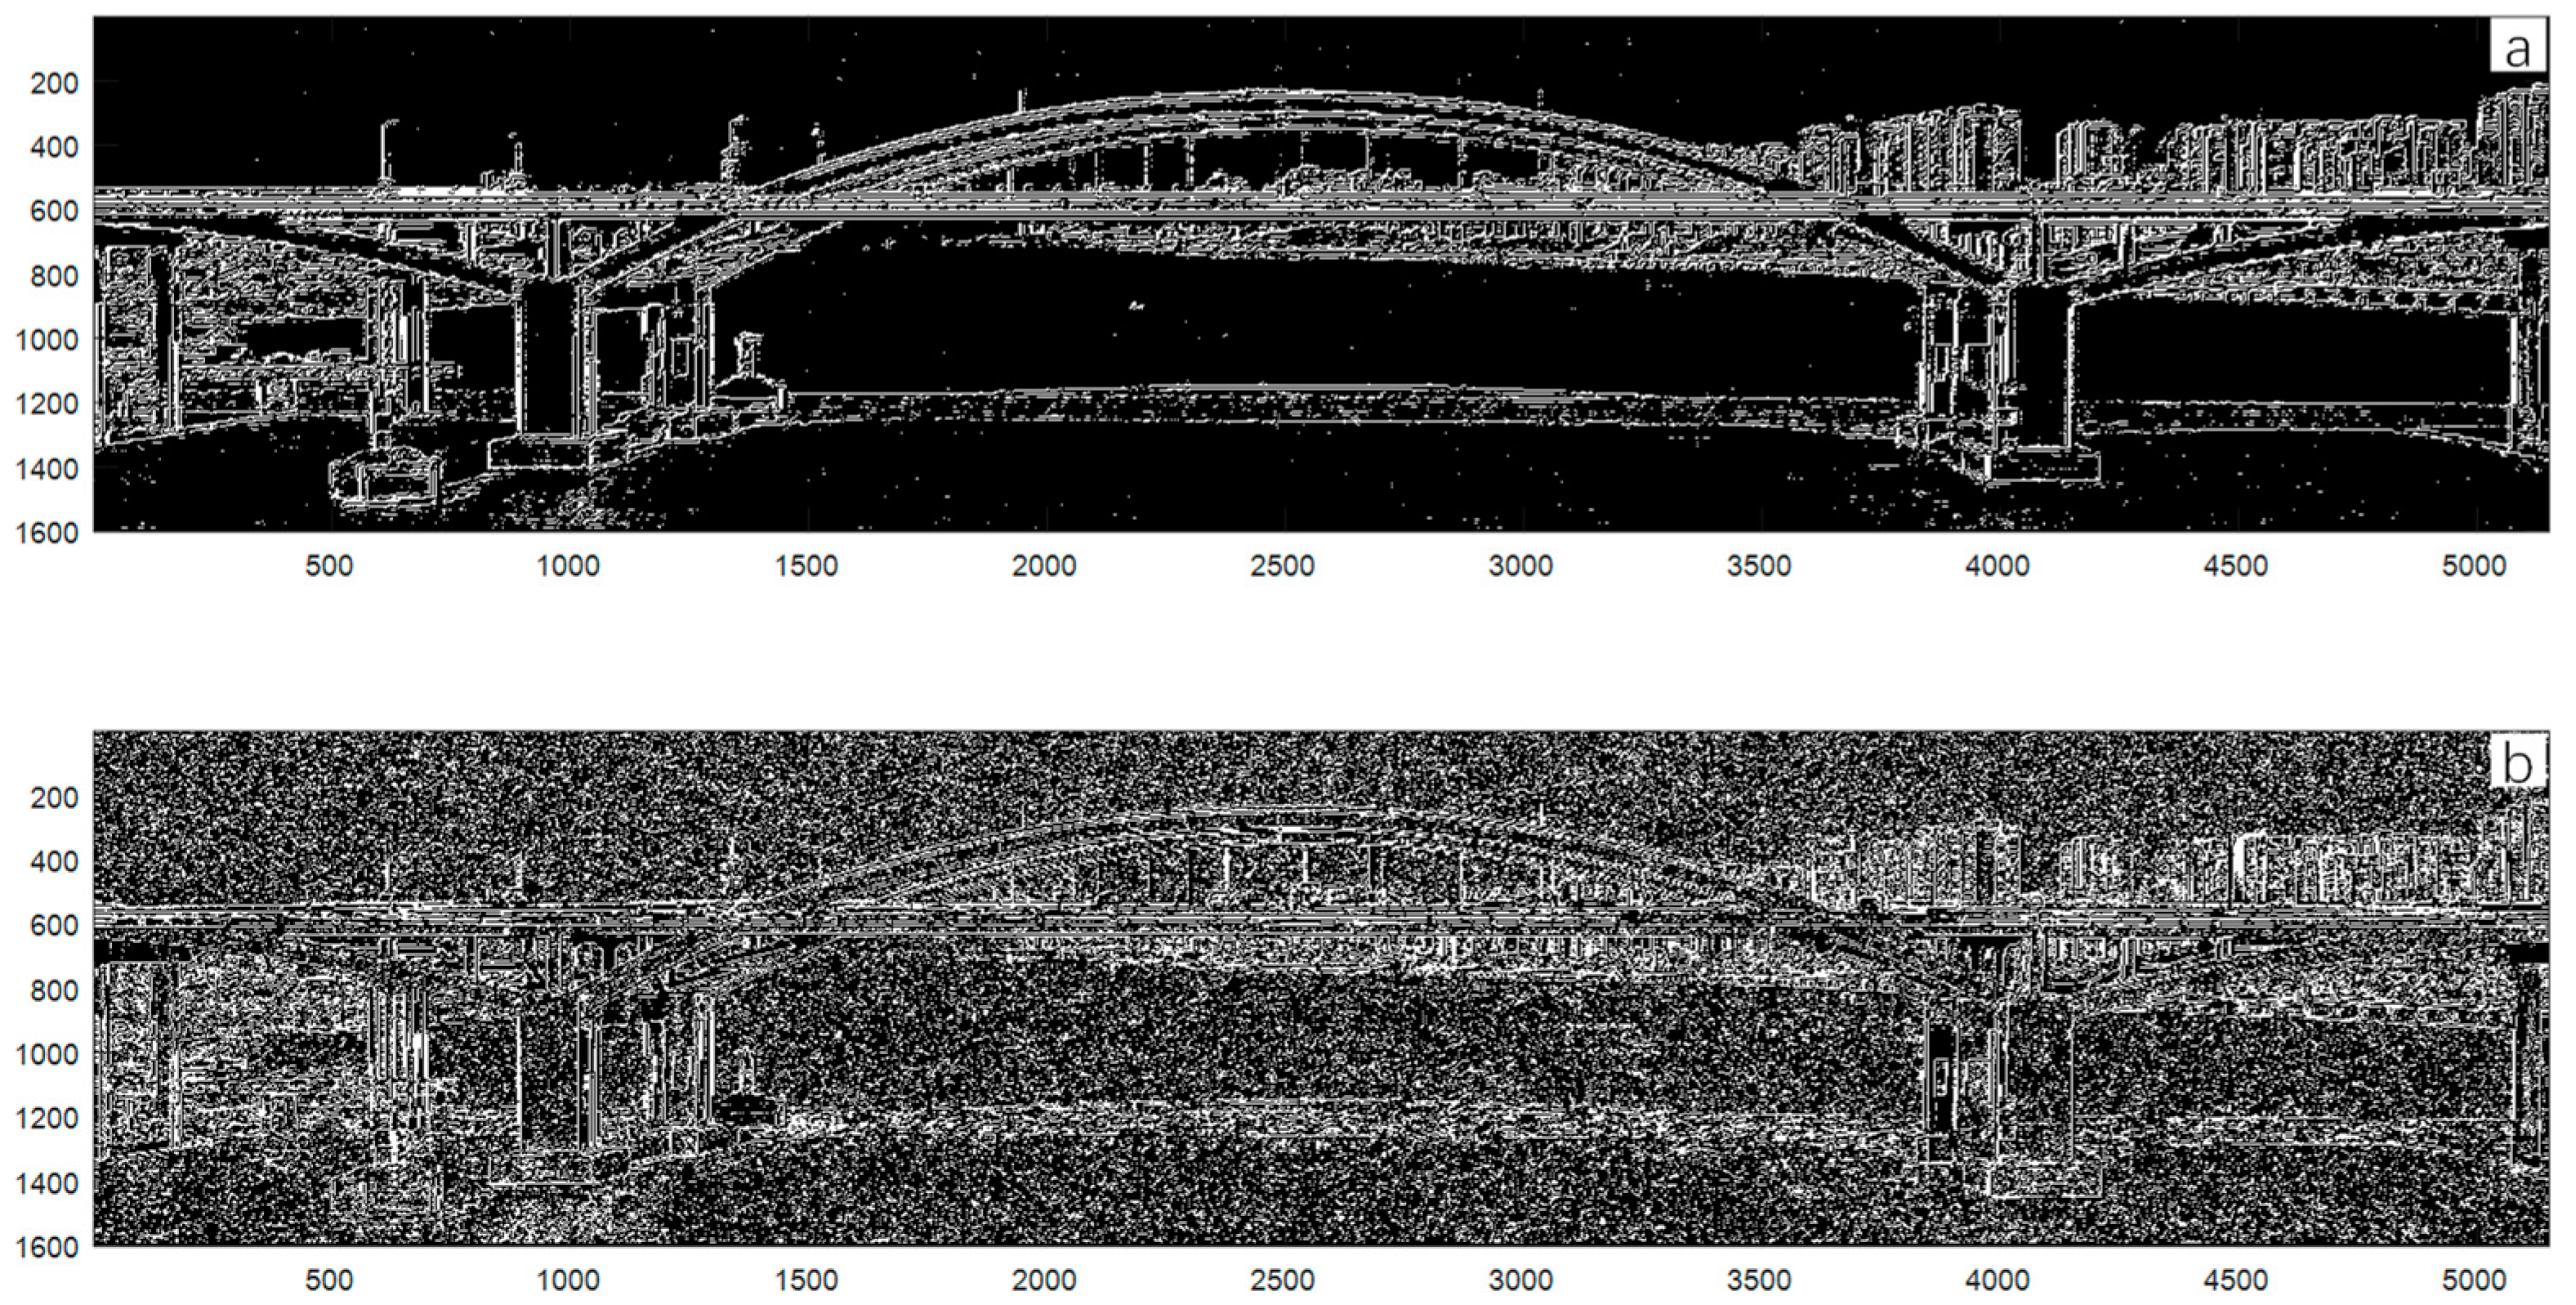
  • A bridge image taken in Wenzhou was chosen for study and analysis. The wavelet transform was used to denoise the image before extracting the bridge edges to improve the signal-to-noise ratio of the image. In the wavelet transform, four wavelet functions (sym5, db5, coif5 and fk6) and four decomposition levels (two, three, four and five levels) were used to decompose the image, followed by coefficient filtering and reconstruction to obtain the denoised image. The results show that the sym5 wavelet function performs best in the three-level decomposition, with PSNR and MSE of 23.48 dB and 299.49, respectively. The canny algorithm was used to detect the edges of the images before and after denoising, and it is obvious that the edge detection of the images was better after wavelet transform denoising.
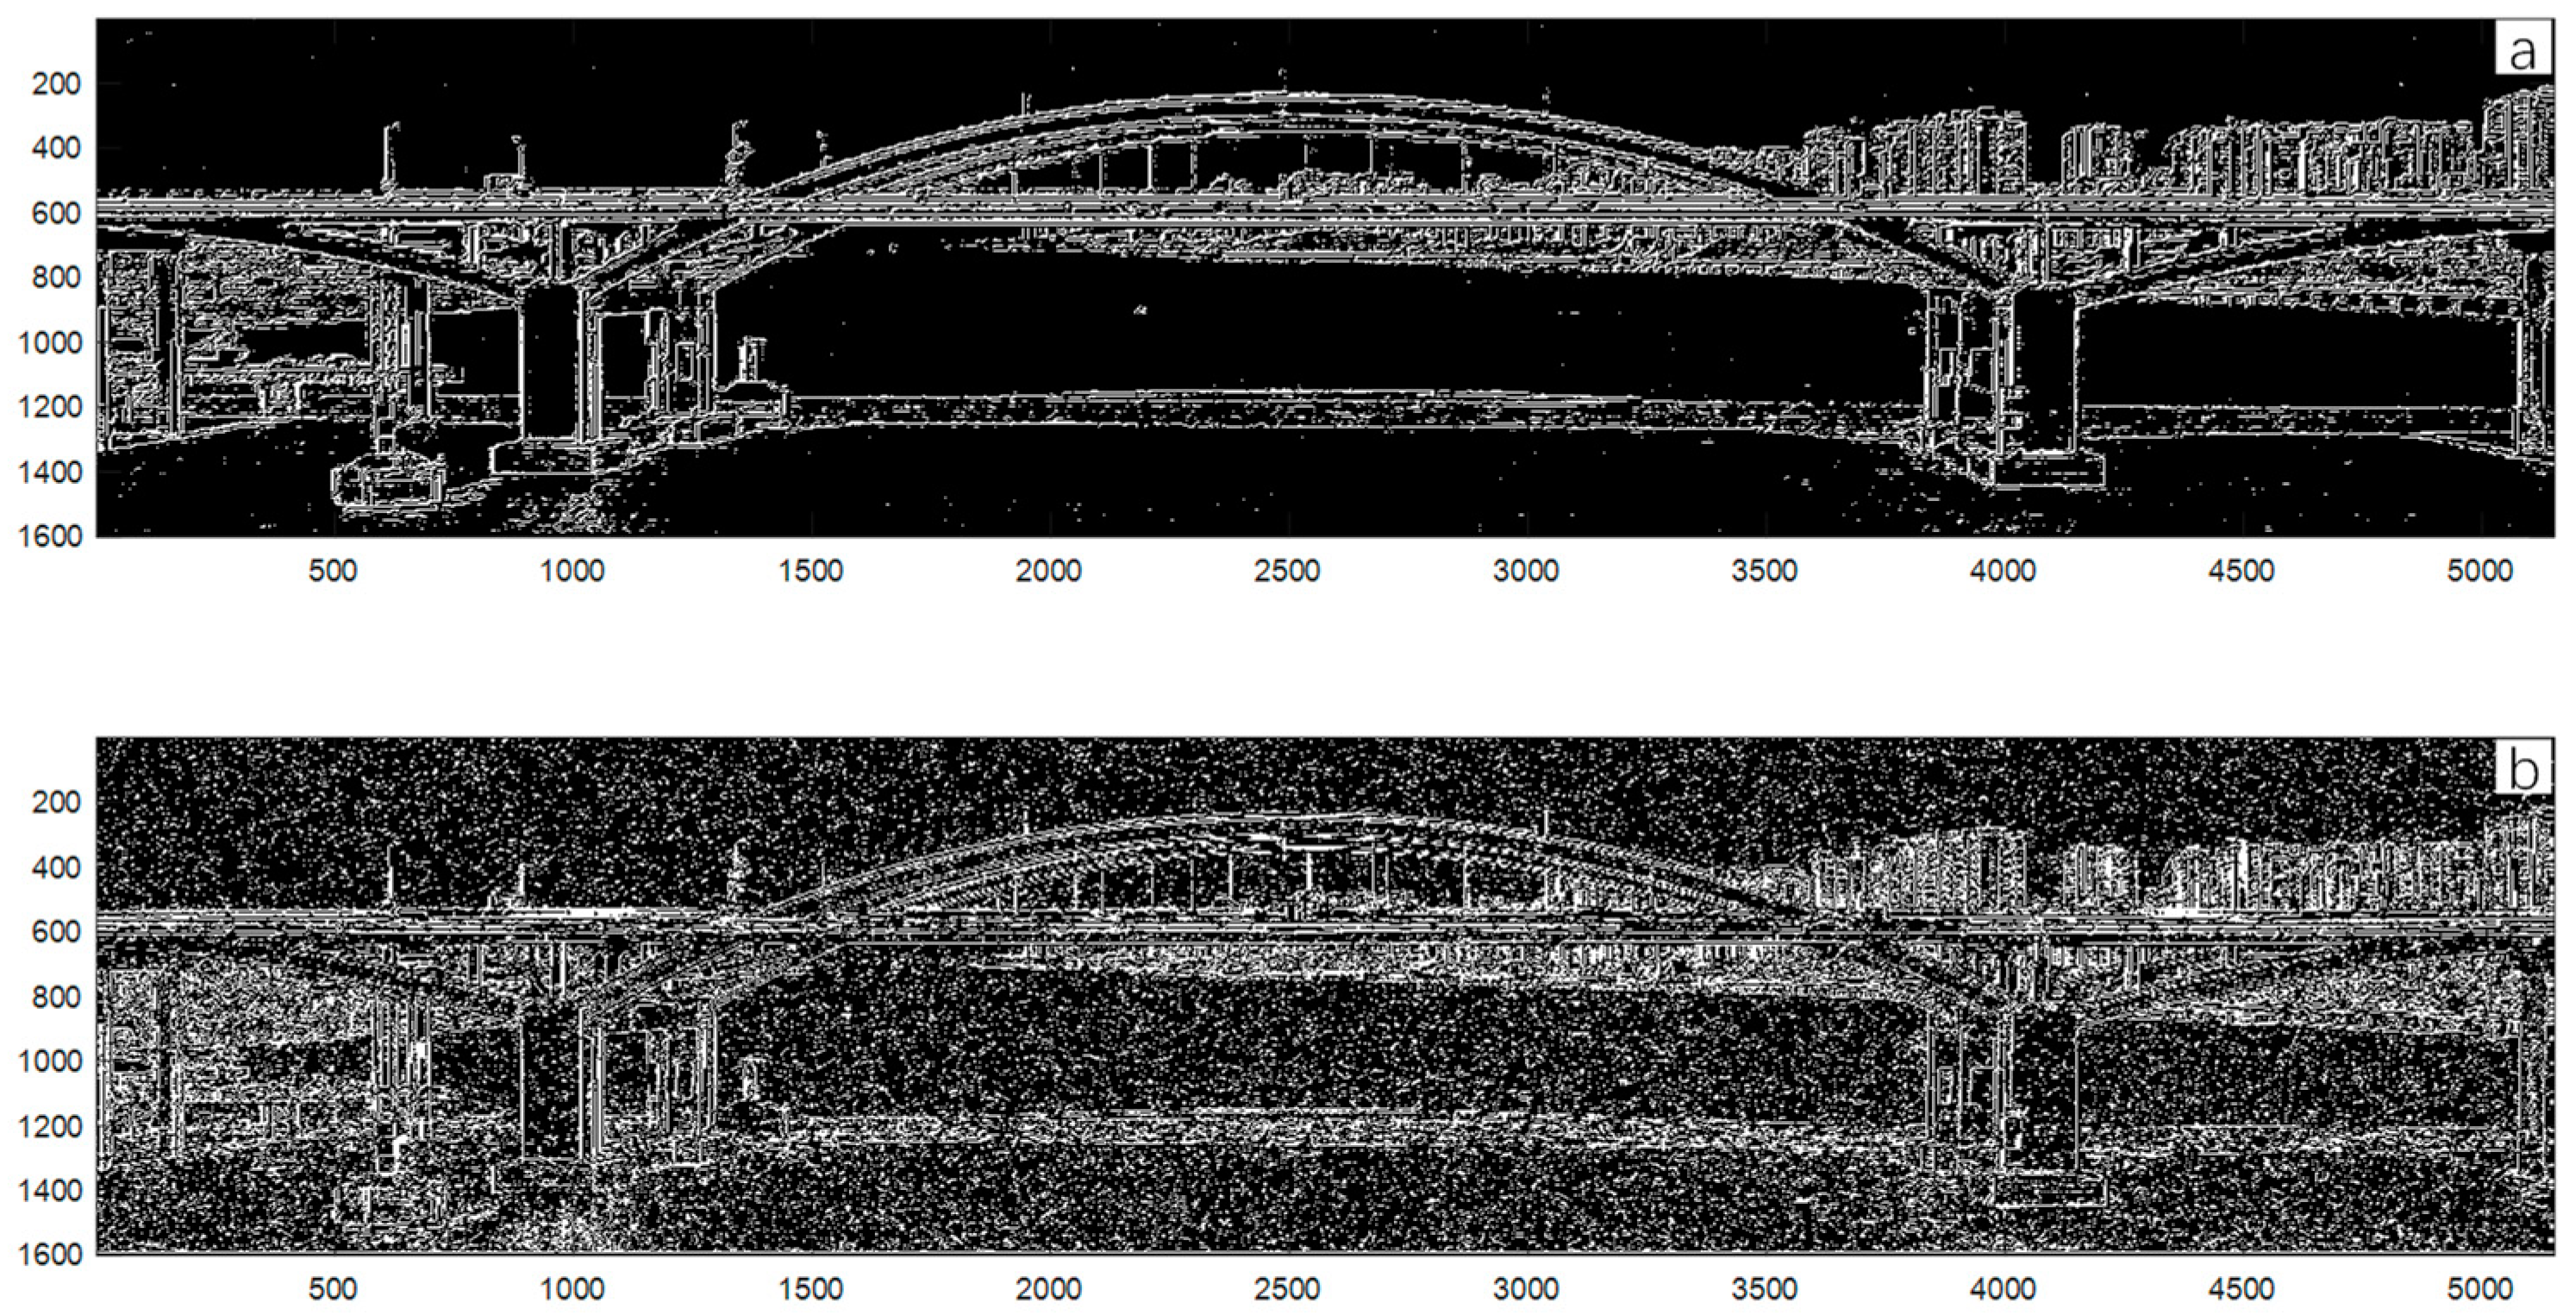
  • In addition, the improvements of edge detection by Gaussian filtering and wavelet transform were compared and discussed. The Pratt quality factors of the two methods were 0.47 and 0.53, respectively, which shows that wavelet transform noise removal has better quality factors compared to Gaussian filtering. Thus, the effect of edge detection was improved. In summary, the use of wavelet transform to remove noise can provide a favorable method for edge detection and can lay a solid basis for the daily maintenance of bridges and related scientific research work.
In this paper, color bridge images taken by UAVs were converted to monochrome images in order to verify the effectiveness of the wavelet transform. However, in many scenarios, the user would prefer to perform the processing with colored images. In addition to this, with the increasing superiority of technical tools, such as neural networks and deep learning, it will be the next research direction of the authors to apply the wavelet transform and the above two techniques to the edge detection of colored images.

Author Contributions

Conceptualization, N.Y. and L.H.; data processing, N.Y. and L.H.; writing—original draft preparation, N.Y.; writing—review and editing, N.Y., L.H. and W.S.; supervision and project administration, D.Z. and W.S. All authors have read and agreed to the published version of the manuscript.

Funding

This research received no external funding.

Institutional Review Board Statement

Not applicable.

Informed Consent Statement

Not applicable.

Data Availability Statement

The bridge photograph datasets were freely provided by Yangtze Delta Institute of Urban Infrastructure.

Acknowledgments

The authors would like to thank the editors and the anonymous reviewers for their valuable suggestions.

Conflicts of Interest

The authors declare no conflict of interest.

References

  1. Sekehravani, E.A.; Babulak, E.; Masoodi, M. Implementing canny edge detection algorithm for noisy image. Bull. Electr. Eng. Inform. 2020, 9, 1404–1410. [Google Scholar] [CrossRef]
  2. He, Y.; He, H.; Xu, Y. Marine Multi-Target Detection Based on Improved Wavelet Transform. In Proceedings of the 2019 3rd International Conference on Electronic Information Technology and Computer Engineering (EITCE), Xiamen, China, 18–20 October 2019; IEEE: New York, NY, USA, 2019; pp. 804–811. [Google Scholar]
  3. Dris, E.; Bentahar, M.; Drai, R.; El Mahi, A. A0 Lamb Mode Tracking to Monitor Crack Evolution in Thin Aluminum Plates Using Acoustic Emission Sensors. Appl. Sci. 2022, 12, 12112. [Google Scholar] [CrossRef]
  4. Li, C.Y.; Wang, C.; Yang, Q.X.; Qi, T.-Y. Identification of Vehicle Loads on an Orthotropic Deck Steel Box Beam Bridge Based on Optimal Combined Strain Influence Lines. Appl. Sci. 2022, 12, 9848. [Google Scholar] [CrossRef]
  5. Huang, Z.; Zeng, X.; Wang, D.; Fang, S. Noise Reduction Method of Nanopore Based on Wavelet and Kalman Filter. Appl. Sci. 2022, 12, 9517. [Google Scholar] [CrossRef]
  6. Xuan, L.; Hong, Z. An improved canny edge detection algorithm. In Proceedings of the 2017 8th IEEE international conference on software engineering and service science (ICSESS), Beijing, China, 20–22 November 2017; IEEE: New York, NY, USA, 2017; pp. 275–278. [Google Scholar]
  7. Qiang, L.; Yuting, D. Canny Edge Detection Algorithm Based on lmproved Kalman Filter. World Sci.-Tech. RD 2013, 35, 216. [Google Scholar]
  8. Kimlyk, M.; Umnyashkin, S. Image denoising using discrete wavelet transform and edge information. In Proceedings of the 2018 IEEE Conference of Russian Young Researchers in Electrical and Electronic Engineering (EIConRus), Moscow, Russia, 29 January–1 February 2018; IEEE: New York, NY, USA, 2018; pp. 1823–1825. [Google Scholar]
  9. Ali, M.N.; El-Dahshan EL, S.A.; Yahia, A.H. Denoising of heart sound signals using discrete wavelet transform. Circuits Syst. Signal Process. 2017, 36, 4482–4497. [Google Scholar] [CrossRef]
  10. Saravani, S.; Shad, R.; Ghaemi, M. Iterative adaptive Despeckling SAR image using anisotropic diffusion filter and Bayesian estimation denoising in wavelet domain. Multimed. Tools Appl. 2018, 77, 31469–31486. [Google Scholar] [CrossRef]
  11. Liu, F.; Han, X. Image Classification of Landing Landform Based on Wavelet Transform and Deep Network. Acta Electonica Sin. 2021, 49, 2171. [Google Scholar]
  12. Chen, C.; Seo, H.; Zhao, Y. A novel pavement transverse cracks detection model using WT-CNN and STFT-CNN for smartphone data analysis. Int. J. Pavement Eng. 2021, 23, 4372–4384. [Google Scholar] [CrossRef]
  13. Singh, A.; Kushwaha, S.; Alarfaj, M.; Singh, M. Comprehensive Overview of Backpropagation Algorithm for Digital Image Denoising. Electronics 2022, 11, 1590. [Google Scholar] [CrossRef]
  14. Rhif, M.; Ben Abbes, A.; Farah, I.R.; Martínez, B.; Sang, Y. Wavelet transform application for/in non-stationary time-series analysis: A review. Appl. Sci. 2019, 9, 1345. [Google Scholar] [CrossRef] [Green Version]
  15. Kamal NA, M.; Bakar, A.A.; Zainudin, S. Optimization of Discrete Wavelet Transform Feature Representation and Hierarchical Classification of G-Protein Coupled Receptor Using Firefly Algorithm and Particle Swarm Optimization. Appl. Sci. 2022, 12, 12011. [Google Scholar] [CrossRef]
  16. Song, P.; Tan, Y.M.; Li, X.H.; Guo, H.; Zhang, L.J. Research on Power-line lnterference Removal Method of Ultraviolet Communication Signal Based on Wavelet Transform. Acta Photonica Sin. 2021, 50, 31. [Google Scholar]
  17. Kuo, J.Y.; Hsu, C.Y.; Wang, P.F.; Lin, H.-C.; Nie, Z.-G. Constructing Condition Monitoring Model of Harmonic Drive. Appl. Sci. 2022, 12, 9415. [Google Scholar] [CrossRef]
  18. Wu, Y.; Mu, C.; Zong, Q.; Wu, J.; Zhou, H. Study on Blasting Vibration Control of Brick-Concrete Structure under Subway Tunnel. Appl. Sci. 2022, 12, 10960. [Google Scholar] [CrossRef]
  19. Osadchiy, A.; Kamenev, A.; Saharov, V.; Chernyi, S. Signal processing algorithm based on discrete wavelet transform. Designs 2021, 5, 41. [Google Scholar] [CrossRef]
  20. Zhang, Y.X.; Li, C.; Jia, J.; Fang, D.Y. A new approach for optimal decomposition level selection in wavelet de-noising. Appl. Mech. Mater. 2013, 333, 540–545. [Google Scholar] [CrossRef]
  21. Kadir, R.; Saha, R.; Akhter, M.M.; Awal, M.A.; Kadir, M.I. LDPC coded hybrid discrete cosine transform and Fejér–Korovkin wavelet transform-based SC-FDMA for image communication. Array 2021, 12, 100107. [Google Scholar] [CrossRef]
  22. Pavan, B.; Rani, P.E. Eeg Signal De-Noising Based on The Fejer-Korovkin Wavelet Filter. J. Theor. Appl. Inf. Technol. 2021, 99, 17. [Google Scholar]
  23. Kharchenko, V.; Kuzmenko, N.; Ostroumov, I. An investigation of synthetic aperture radar speckle filtering and image segmentation considering wavelet decomposition. In Proceedings of the 2019 European Microwave Conference in Central Europe (EuMCE), Prague, Czech Republic, 13–15 May 2019; IEEE: New York, NY, USA, 2019; pp. 398–401. [Google Scholar]
  24. Zheng, J.; Hou, R. Selection of wavelet base in denoising of wavelet transform. J. Shenyang Univ. 2009, 21, 108–110. [Google Scholar]
  25. Loseva, E.; Lozovsky, I.; Zhostkov, R.; Syasko, V. Wavelet Analysis for Evaluating the Length of Precast Spliced Piles Using Low Strain Integrity Testing. Appl. Sci. 2022, 12, 10901. [Google Scholar] [CrossRef]
  26. Xiaodong, D.; Xiangdong, G.; Shaoduo, L.; Dan, H.; Chunrong, P. Study on soft-hard threshold compromise denoising method for weld forming measurement. Trans. China Weld. Inst. 2021, 42, 51–55. [Google Scholar]
  27. Hsia, C.H.; Yang, Z.H.; Wang, H.J.; Lai, K.-K. A New Enhancement Edge Detection of Finger-Vein Identification for Carputer System. Appl. Sci. 2022, 12, 10127. [Google Scholar] [CrossRef]
  28. Wang, S.; Lai, Z.; Tan, G. Edge Detection of Strong Noise Image Based on WMF and Improved Canny Algorithm. In Proceedings of the 2021 IEEE 3rd Eurasia Conference on IOT, Communication and Engineering (ECICE), Yunlin, Taiwan, 28–30 October 2021; IEEE: New York, NY, USA, 2021; pp. 252–256. [Google Scholar]
  29. Huang, H.; Dong, L.; He, J. Edge Detection of an Improved Canny Algorithm under Strong Noise. Comput. Technol. Dev. 2021, 31, 83–87. [Google Scholar]
  30. Mohan, C.R.; Chouhan, K.; Rout, R.K.; Sahoo, K.S.; Jhanjhi, N.Z.; Ibrahim, A.O.; Abdelmaboud, A. Improved Procedure for Multi-Focus Images Using Image Fusion with qshiftN DTCWT and MPCA in Laplacian Pyramid Domain. Appl. Sci. 2022, 12, 9495. [Google Scholar] [CrossRef]
  31. Cai, H.; Zhang, G.; Zhang, H.; Zhou, Z. Novel edge detection method based on multiple information measures fusion. J. Zhejiang Univ. Eng. Sci. 2008, 42, 1671–1675. [Google Scholar]
  32. Daubechies, I. Ten Lectures on Wavelets; Society for Industrial and Applied Mathematics: Philadelphia, PA, USA, 1992. [Google Scholar]
Figure 1. General process of wavelet transform denoising.
Applsci 13 01837 g001
Figure 2. Structure of wavelet decomposition.
Applsci 13 01837 g002
Figure 3. The first level of decomposition: (a) noisy image; (b) approximation coefficient; (c) detail coefficient; (d) detail coefficient; (e) detail coefficient; (f) reconstruction result.
Applsci 13 01837 g003
Figure 4. The second level of decomposition (a) noisy image; (b) approximation coefficient; (c) detail coefficient; (d) detail coefficient; (e) detail coefficient; (f) reconstruction result.
Applsci 13 01837 g004
Figure 5. Hard threshold function working process.
Applsci 13 01837 g005
Figure 6. Image denoising: (a) noise-laden images; (b) denoised images.
Applsci 13 01837 g006
Figure 7. Canny operator edge detection results: (a) not denoised; (b) denoised.
Applsci 13 01837 g007
Figure 8. Edge detection image: (a) wavelet transform to remove salt and pepper noise; (b) Gaussian filtering to remove salt and pepper noise.
Applsci 13 01837 g008
Figure 9. Edge detection image: (a) wavelet transform to remove Poisson noise; (b) Gaussian filtering to remove Poisson noise.
Applsci 13 01837 g009
Figure 10. Edge detection image (a) wavelet transform to remove multiplicative noise; (b) Gaussian filtering to remove multiplicative noise.
Applsci 13 01837 g010
Table 1. The PSNR and MSE of different images denoised by different wavelet functions.
Wavelet FunctionsPSNR (dB)MSE
sym523.48299.49
db523.37300.53
coif523.22309.89
fk623.28305.40
Table 2. The PSNR and MSE of different levels denoised.
LevelsPSNR (dB)MSE
2 levels17.141251.00
3 levels23.48299.49
4 levels23.31303.25
5 levels22.72347.75
Table 3. Figure of merit for edge detection.
Denoising MethodPratt Quality Factor
Gaussian Filter0.47
Wavelet Transform0.53
Table 4. Treatment results for three similar noises.
Salt and Pepper NoisePoisson NoiseMultiplicative Noise
Denoising MethodPSNR (dB)MSEPSNR (dB)MSEPSNR (dB)MSE
Wavelet Transform23.58285.2123.53288.1423.46293.29
Gaussian Filter23.50290.4023.48291.4723.22309.78
Disclaimer/Publisher’s Note: The statements, opinions and data contained in all publications are solely those of the individual author(s) and contributor(s) and not of MDPI and/or the editor(s). MDPI and/or the editor(s) disclaim responsibility for any injury to people or property resulting from any ideas, methods, instructions or products referred to in the content.

