The developed MCNP DEMO models, with a fully heterogeneous representation of the 2019 divertor and IL PFCs, has been used to assess the nuclear damage (dpa/FPY), nuclear heating (W/cm3) and He-production rate (appm/FPY), spatial distributions on W-monblocks, Cu-interlayers/CuCrZr-pipe and PFC-CB supports made of Eurofer steel, on inner and outer target. These results are presented through 2D-meshes with fine resolutions:
3.1. Spatial Distributions of the Nuclear Loads on the Divertor Targets, Both for WCLL and HCPB Blanket
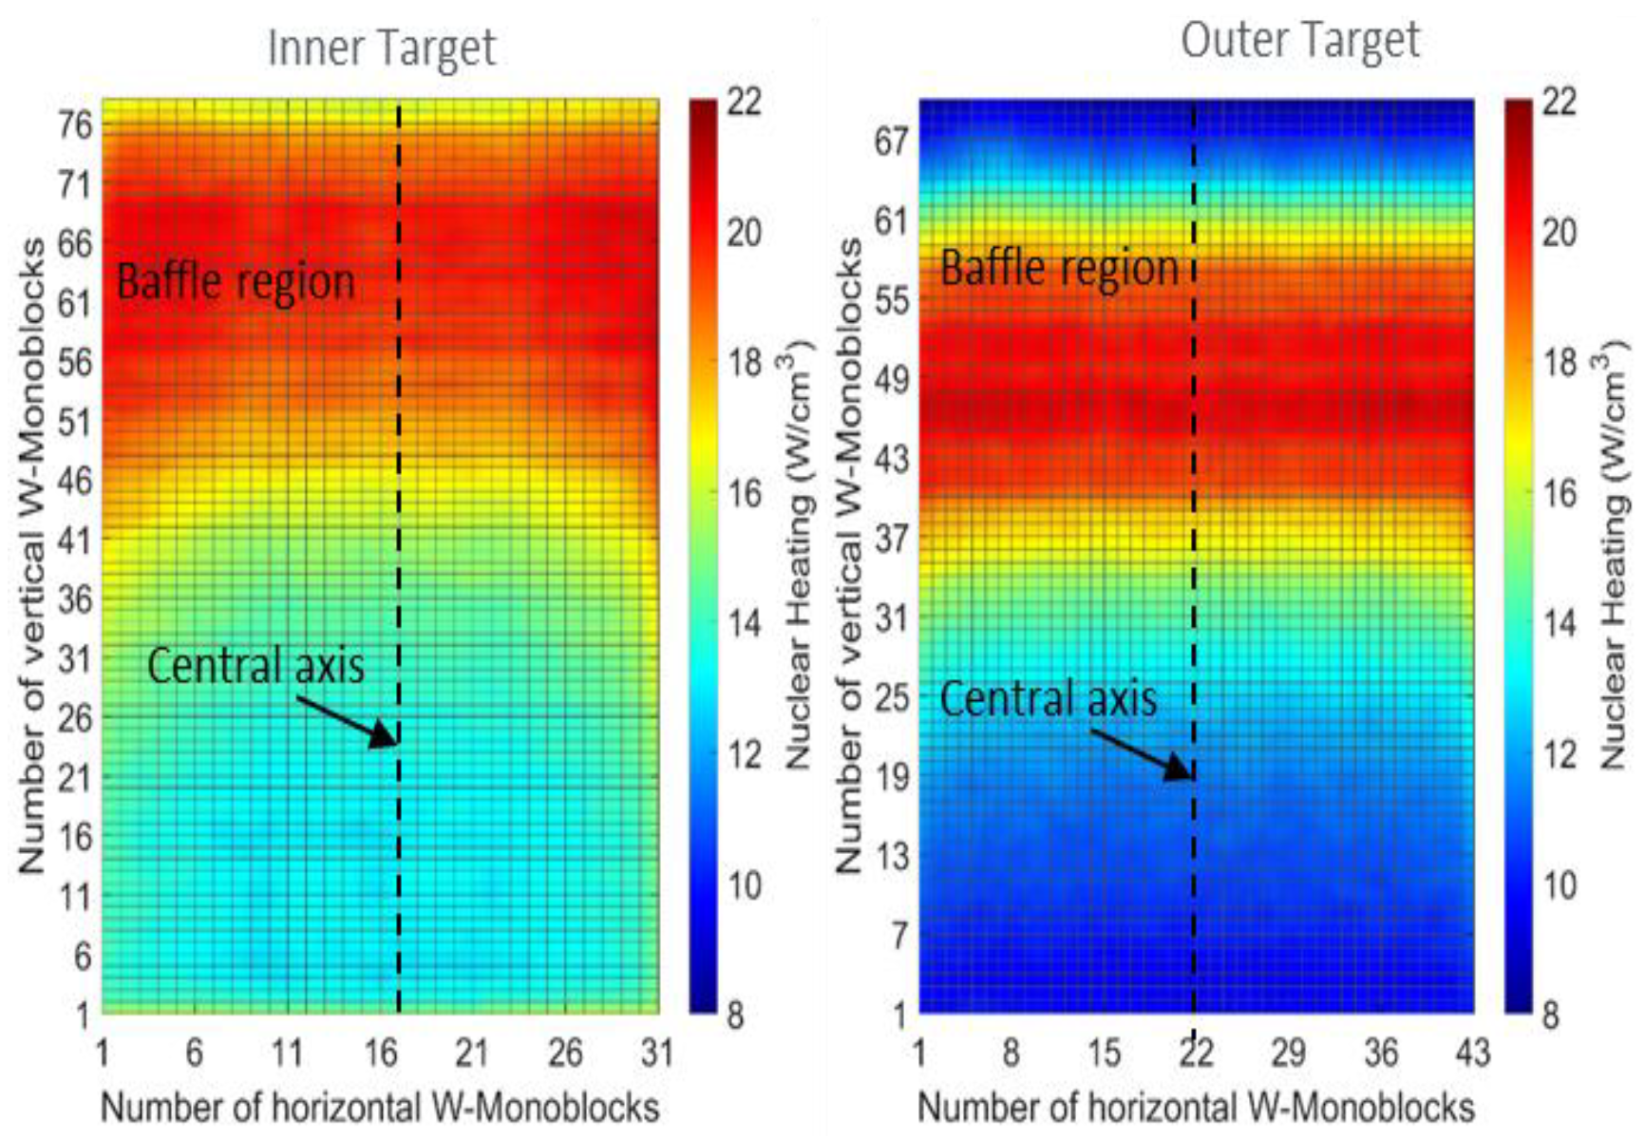
Figure 11 and
Figure 12 show the nuclear heating (W/cm
3) distribution on W-monoblocks of the inner and outer target, both for WCLL and HCPB, respectively. From the maps shown in
Figure 11 the following considerations can be pointed out: the absolute peak value amounts to around 21.40 W/cm
3 with the WCLL blanket and it is achieved in correspondence of the 47th monoblock along the vertical direction of the 1st and 43rd columns (external sides) on the outer target. The maximum value on the inner target amounts to around 21.20 W/cm
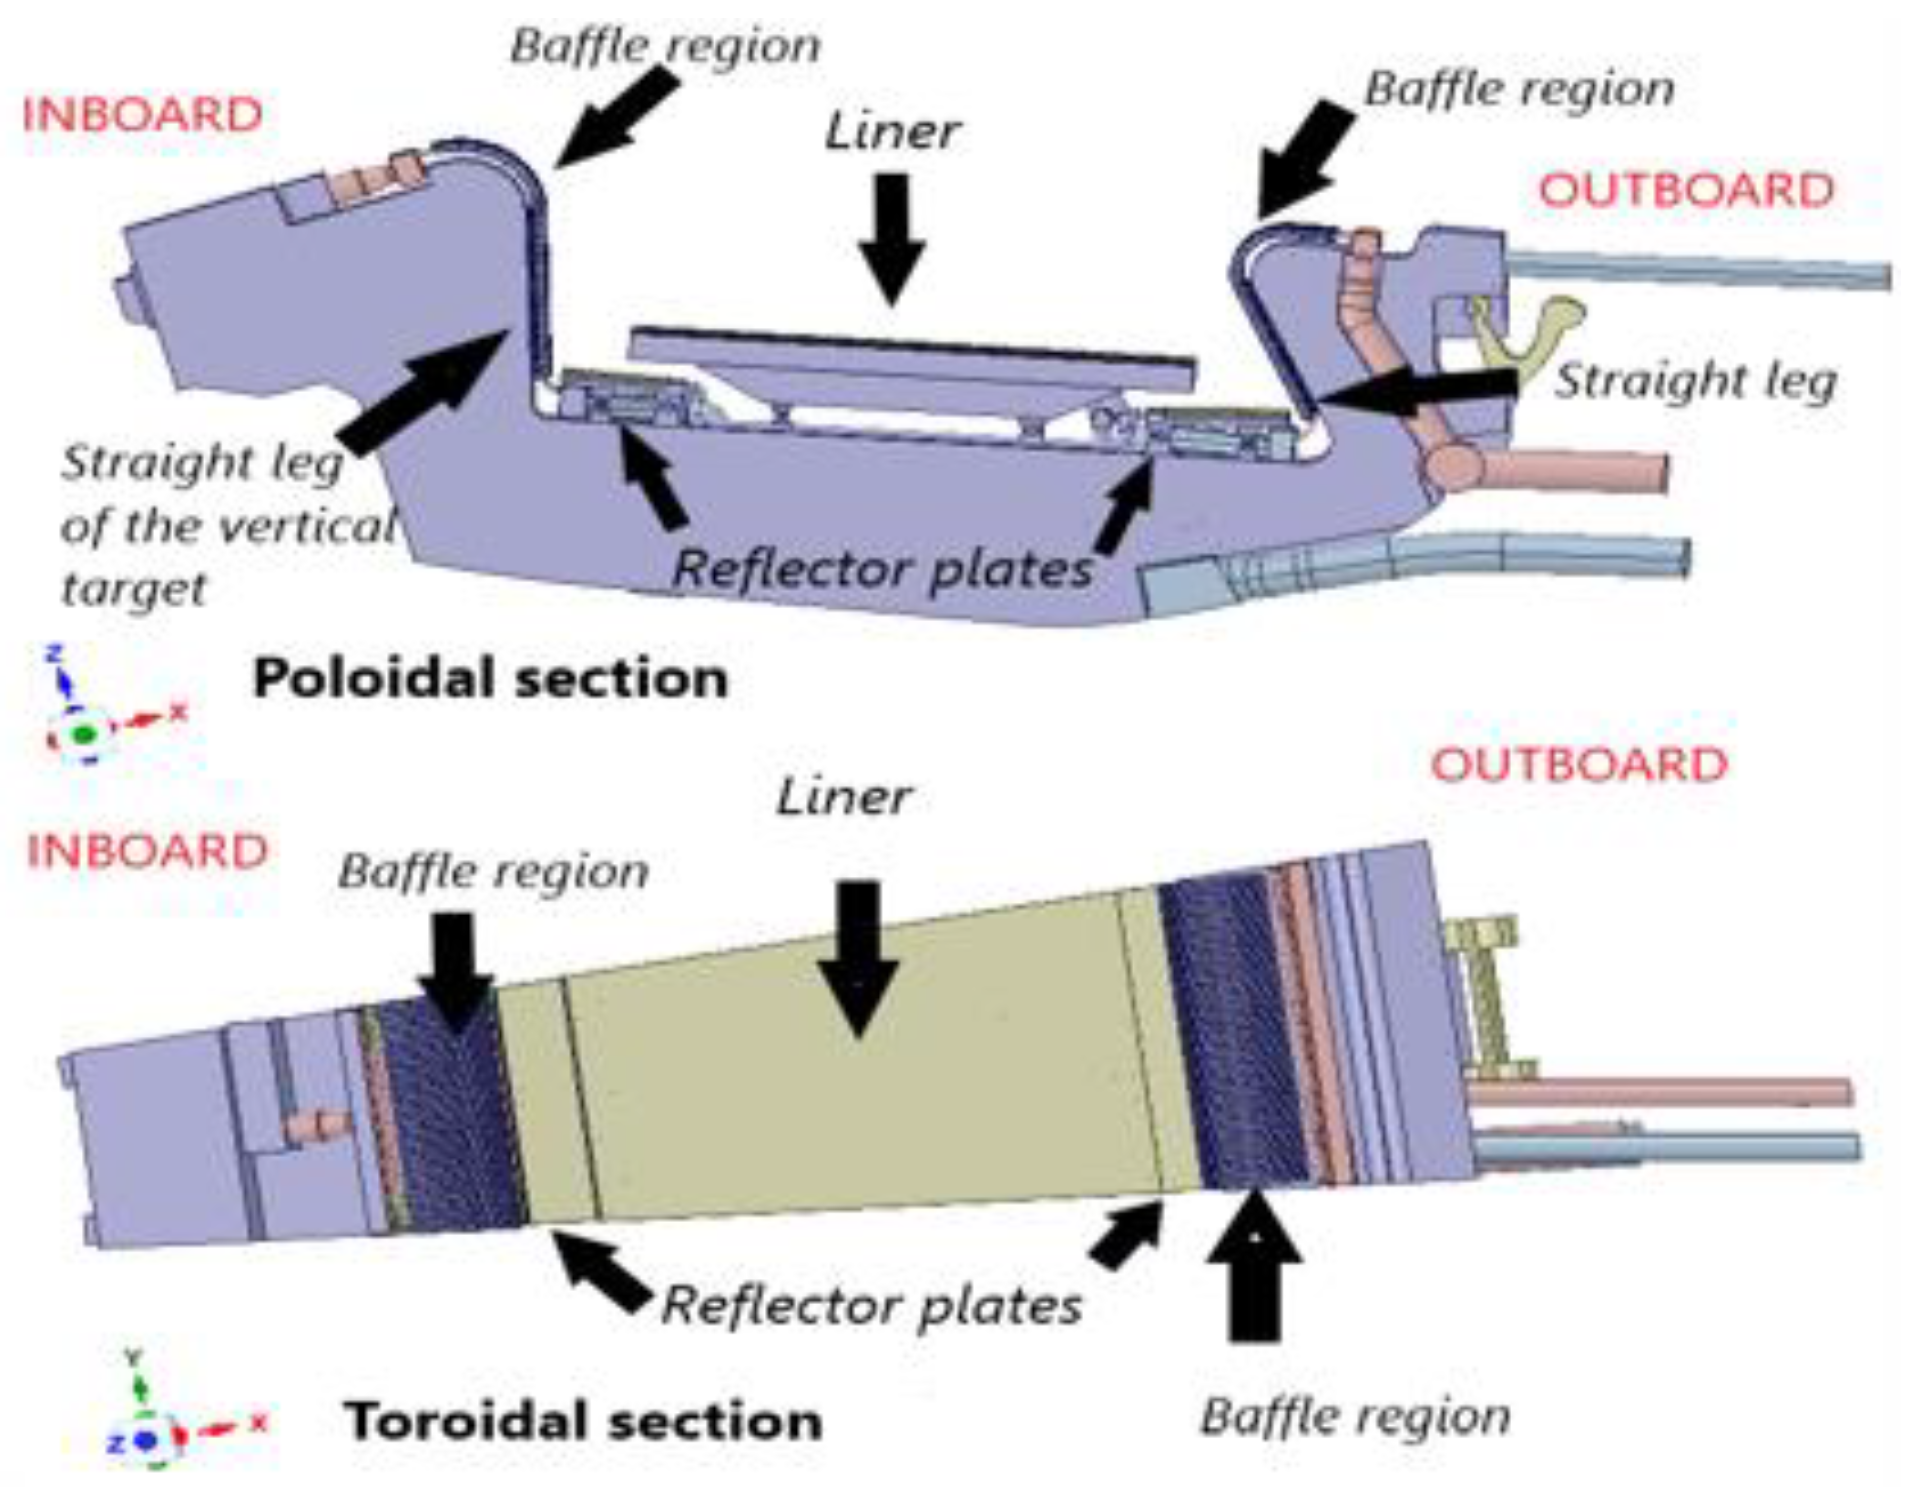
3, achieving it in correspondence of the 58th monoblock along the vertical direction of the external edges of the target (1st, 2nd, 30th and 31st columns). More in general, for both the targets, the highest values of nuclear heating are reached on the baffle regions than the straight leg of the vertical target, this latter area being less exposed to neutron irradiation (smaller plasma view factor). In this regard, the minimum values amount to about 12.80 W/cm
3 for the inner target, achieved in correspondence of the 4th monoblock on the innermost arrays (columns: 14th, 15th and 16th) and 8.31 W/cm
3 on the 4th monoblock arranged on the innermost arrays (columns: 21st, 22nd, 23rd arrays) of the outer target. In addition, a symmetrical trend of the distribution with respect to the target central axis is highlighted for both the targets. It can also be noted that the intensity of the nuclear heating tends to be greater on the external sides of the target than on the internal ones. This effect on the toroidal distribution of the loads is much more accentuated on the inner target than the outer one and it is probably since the external sides (especially on the baffle region) are subjected to higher irradiation levels due to the radiation streaming in the gaps between the cassettes. From the maps shown in
Figure 12 the following highlights can be underlined: the absolute peak value amounts to around 19.00 W/cm
3 with the HCPB blanket both for the outer and inner target. They are achieved in correspondence of the 47th monoblock along the vertical direction of the 1st and 43rd columns (external sides) for the outer target and of 58th monoblock towards the vertical direction of the external edges of the inner target (columns: 1st, 2nd, 30th and 31st arrays). Once again, for both the targets, highest values of nuclear heating are reached on the baffle regions than the straight leg of the vertical target, being the minimum values about 10.44 W/cm
3 for the inner target, reached in correspondence of the 4th monoblock on the innermost arrays (columns: 14th, 15th and 16th) and 7.84 W/cm
3 on the 4th monoblock arranged on the innermost arrays (21st, 22nd, 23rd columns). The symmetrical trend of the distribution with respect to the target central axis for both the targets is confirmed also with the HCPB blanket. The intensity of the nuclear heating tends to be greater on the external sides of the target than on the internal ones (especially for the inner target), also considering the HCPB case.
The nuclear heating density distribution (W/cm
3) on Cu\CuCrZr components of the inner and outer target, are shown in
Figure 13 and
Figure 14, for the WCLL and HCPB case, respectively. Looking at the maps of
Figure 13, the following highlights can be underlined: the absolute maximum value amounts to 8.77 W/cm
3, considering the WCLL blanket and it is achieved in correspondence of the 60th copper element along the vertical direction of the external sides of the inner target (1st, 2nd, 30th and 31st arrays). The peak value on the outer target is reached in correspondence of the 49th copper element placed along the vertical direction, again on the external edges (1st, 2nd, 42nd and 43rd arrays), amounting to around 8.28 W/cm
3. The minimum values on the inner and outer target are 3.88 W/cm
3 and 2.94 W/cm
3, respectively. In the same order, they are achieved both on the 1st row of Cu/CuCrZr elements and in the innermost columns (inner: 14th, 15th and 16th, outer: 21st, 22nd and 23rd). Considering the maps shown in
Figure 14, related to the HCPB case, the following evaluations can be done: the absolute peak value amounts to 8.14 W/cm
3 and it is observed on the 60th Cu\CuCrZr element along the vertical direction of the inner target external sides, as before seen. Regarding the outer target, the maximum nuclear heating value is reached in correspondence of the 52nd Cu\CuCrZr segment on the vertical abscissa, again on the same external sides already stated, amounting to 7.66 W/cm
3. The minimum values on the inner and outer target are 3.22 W/cm
3 and 2.48 W/cm
3, respectively. In the same order, they are achieved both on the 1st row of Cu/CuCrZr elements and in the innermost columns (inner: 14th, 15th and 16th, outer: 21st, 22nd and 23rd). Once again, the symmetrical trend of the heat load distribution with respect to the target central axis is evident, as well as the more intense values on the baffle regions of both the targets than the vertical straight leg and strike zones, as can be expected. This is confirmed for both the blankets.
Figure 15 and
Figure 16 show the nuclear heating (W/cm
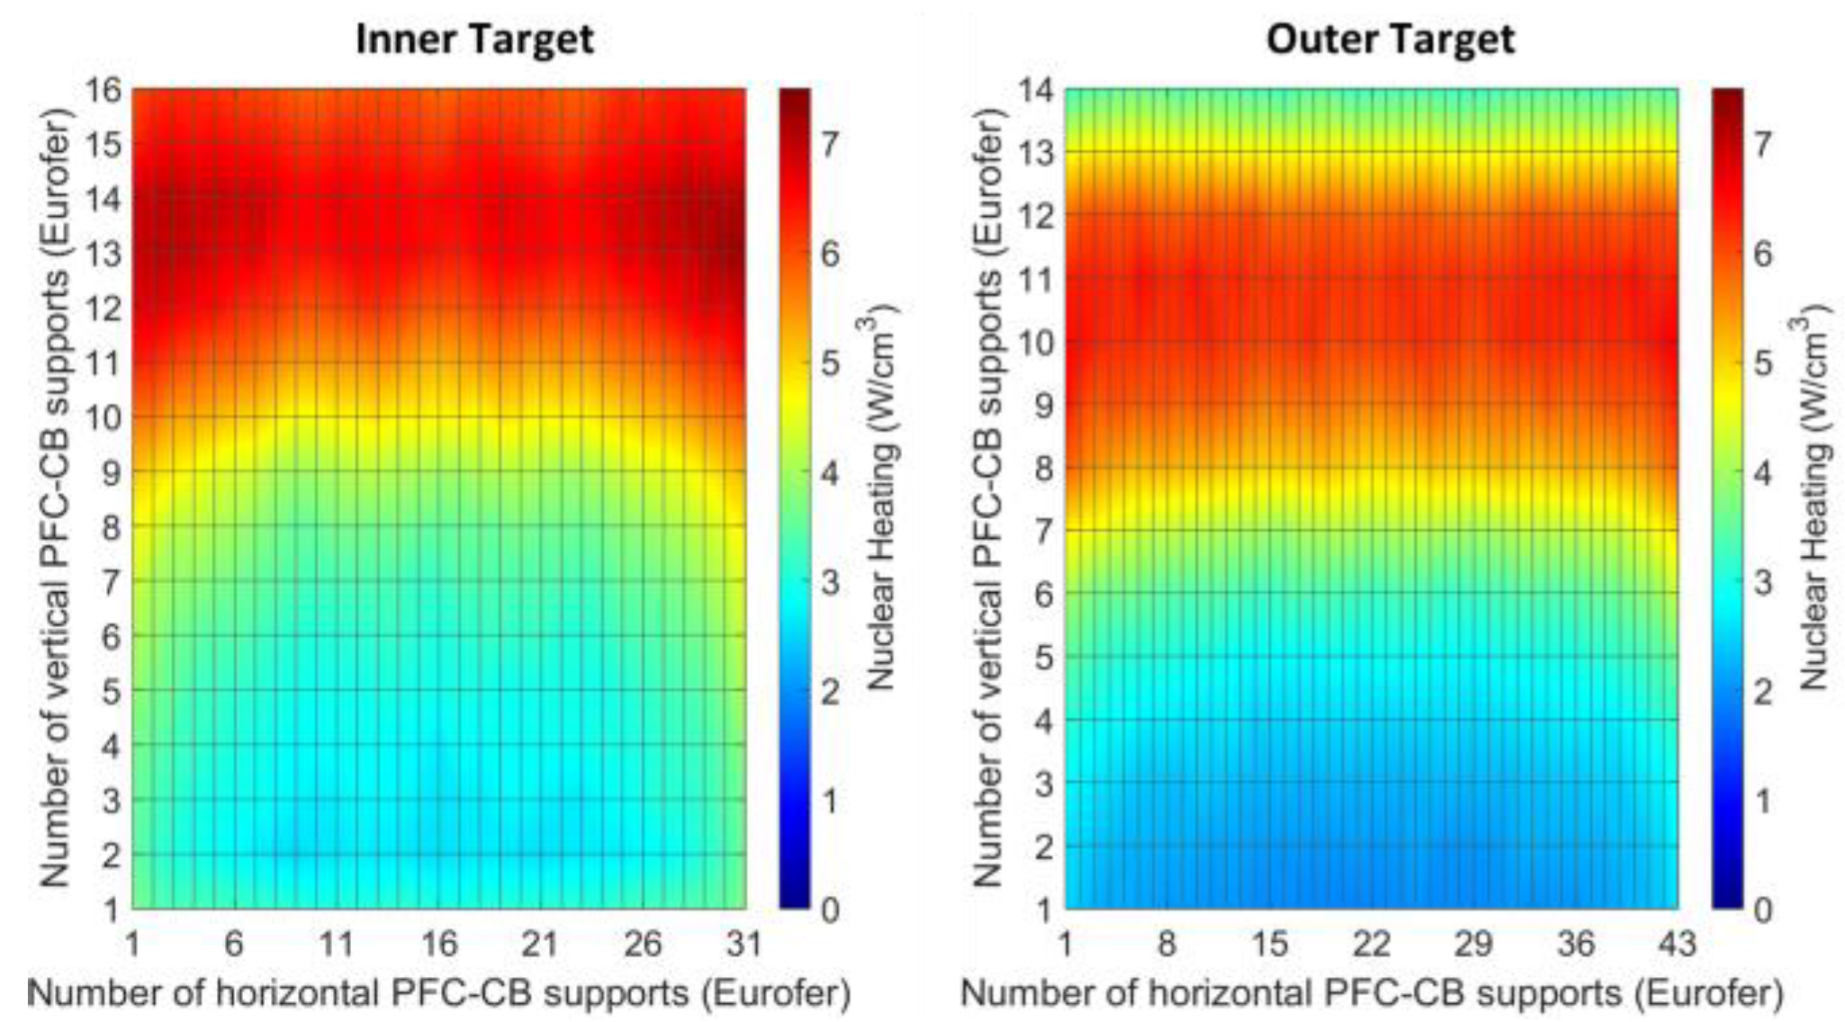
3) distribution on the Eurofer PFC-CB supports of the inner and outer target, both for WCLL and HCPB, respectively. As far as the maps shown in
Figure 15 are concerned, the following main evaluations can be stated: the absolute peak value amounts to 7.29 W/cm
3, which is observed in correspondence of the 13th row of the PFC-CB supports, arranged on the more external sides of the inner target (columns: 1st, 2nd and 30th and 31st). The maximum value on the outer target PFC-CB supports is 6.69 W/cm
3 and it is reached in correspondence of the 10th row and external columns (1st and 43rd arrays). The minimum values amount to 2.63 W/cm
3 and 1.96 W/cm
3, respectively, reached on the 2nd row of the inner target (innermost columns: 14th, 15th and 16th) and 1st row of the outer target (innermost columns: 21st, 22nd and 23rd). Looking at maps shown in
Figure 16, which are related to the HCPB blanket case, the following assessments can be made: the absolute maximum value is 6.45 W/cm
3, which is reached on the 13th row of the PFC-CB supports, placed on the more external edges (columns 1st and 31st) of the inner target. The peak value on the outer target is 6.12 W/cm
3, which is in correspondence with the 11th row of the PFC-CB supports (external columns of the array: 1st and 43rd). The minimum values amount to 1.62 W/cm
3 and 2.09 W/cm
3, respectively, reached on the 1st row and 2nd row and innermost columns: 21st, 22nd and 23rd (outer target), 14th, 15th and 16th (inner target). Additionally in this case, the symmetrical trend of the nuclear heating distribution with respect to the target central axis is highlighted, as well as the more intense values on the baffle regions of both the targets than the vertical straight leg and strike zones, as reasonable. This is verified for both blankets.
Figure 17 and
Figure 18 show the nuclear damage (dpa/FPY) distribution on W-monoblocks of the inner and outer target, both for WCLL and HCPB, respectively. Considering the maps shown in
Figure 17, related to the WCLL case, the following observations can be noted: the absolute peak value is 2.10 dpa/FPY, achieved in correspondence of the 67th row of the W-monoblock arrangement, and in particular non the external columns (1st, 2nd and 30th, 31st) of the inner target. The maximum value on the outer target amounts to 2.07 dpa/FPY, which appears to be quite similar to the inner target case, and it can be observed on the 53rd row and external columns (1st, 2nd and 42nd, 43rd) of the W-monoblock array. The absolute minimum value of nuclear damage on W is 0.43 dpa/FPY which is reached on the 1st row and internal columns (21st, 22nd, 23rd) of the outer target. The minimum value on the inner target is 0.52 dpa/FPY, reached on the innermost columns and lowest row of the array (1st row; 15th, 16th and 17th columns). Observing
Figure 18, which show the maps of the nuclear damage (dpa/FPY) distribution on W-monoblocks for both the target with the HCPB blanket, the following assertion can be made: the absolute peak value amounts to 1.84 dpa/FPY, and it can be observed on the 53rd row and external columns (1st, 2nd and 42nd, 43rd) of the outer target. The maximum value on the inner target is 1.83 dpa/FPY dpa/FPY, reached on the 66th row and external columns (1st, 2nd and 30th, 31st) of the inner target. The absolute minimum value is 0.39 dpa/FPY, which is reached on the 1st row and innermost columns (21st, 22nd and 23rd) of the outer target. The lowest value on the inner target is 0.44 dpa/FPY, once again on the 1st row and innermost columns (15th, 16th and 17th). Additionally in this case, the highest values of the nuclear damage are achieved on the external edges of both the targets and in particular on the baffle region, showing overall a symmetrical distribution with respect to the central column of both the targets.
Figure 19 and
Figure 20 show the maps of the nuclear damage (dpa/FPY) distribution of the Cu/CuCrZr components on the inner and outer target, both for WCLL and HCPB, respectively. In particular, looking at the maps of
Figure 19, which are referred to the DEMO configuration with WCLL blanket the following highlights can be noted: the absolute peak value amounts to 8.75 dpa/FPY and it is achieved in correspondence of the 60th row and external columns (1st, 2nd, 30th and 31st) of the inner target Cu/CuCrZr components. The maximum value on the outer target Cu/CuCrZr components, is 8.47 dpa/FPY, which is reached on the 54th row and external columns (1st, 2nd and 42nd, 43rd) of the array.
The absolute minimum value is 1.42 dpa/FPY, observed on the 1st row and innermost columns (21st, 22nd and 23rd) of the Cu/CuCrZr components of the outer target. The lowest value of the inner target is 1.78 dpa/FPY, once again reached on the bottom and central part of the target (1st row and 15th, 16th, 17th columns). Regarding the HCPB blanket, the same maps of the nuclear damage distribution on Cu/CuCrZr components, can be seen in
Figure 20, pointing out the following highlights: the absolute peak value is reached on the 60th row and external columns (1st, 2nd and 30th, 31st) of the inner target, and it amounts to 7.31 dpa/FPY.
The peak value on the outer target is achieved on the 53rd row and external columns (1st, 2nd and 42nd, 43rd) and it is 7.22 dpa/FPY. The absolute minimum value is 1.28 dpa/FPY, on the 1st row and innermost columns (21st, 22nd and 23rd) of the Cu/CuCrZr components of the outer target. The lowest value of the inner target amounts to 1.47 dpa/FPY, once again reached on the bottom and central part of the target (1st row and 15th, 16th, 17th columns). The nuclear damage distributions, as in the previous cases, show a greater intensity, both with WCLL and HCPB, on the baffle region and external sides of the targets, as it is reasonable to expect.
Figure 21 and
Figure 22 show the maps of the nuclear damage (dpa/FPY) distribution of the Eurofer PFC-CB supports on the inner and outer target, both for WCLL and HCPB, respectively. If the maps of
Figure 21 are observed, which are related to the configuration with WCLL, the following considerations can be stated: the absolute peak value amounts to 5.07 dpa/FPY and it is achieved in correspondence of the 14th row and external columns (1st, 2nd, 30th and 31st) of the inner target array. The maximum value of damage on the outer target is 4.99 dpa/FPY and it is reached in correspondence of the 11th row and external columns (1st and 43rd) of the array. The absolute minimum value amounts to 0.77 dpa/FPY and it can be observed on the 1st row and innermost columns (21st, 22nd and 23rd) of the outer target arrays. The minimum value on the inner target is 0.86 dpa/FPY, reached on the 1st row and innermost columns (15th, 16th and 17th) of the array.
Regarding the HCPB blanket, the same maps of the nuclear damage distribution on Eurofer PFC-CB supports, can be seen in
Figure 22, highlighting the following main considerations: the absolute peak value is reached on the 11th row and external columns (1st and 43rd) of the outer target array, and it amounts to 4.41 dpa/FPY. The peak value on the inner target is achieved on the 13th row and external columns (1st and 31st) and it is 4.40 dpa/FPY, showing an identical peak value of the outer target. The absolute minimum value is 0.68 dpa/FPY, on the 1st row and innermost columns (21st, 22nd and 23rd) of the outer target array. The lowest value of the inner target amounts to 0.72 dpa/FPY, once again reached on the bottom and central part of the array (1st row and 15th, 16th, 17th columns). These nuclear damage distributions, as for the other components already analyzed, show higher levels of magnitude, both with WCLL and HCPB, on the baffle region and external sides of both the targets, as already underlined.
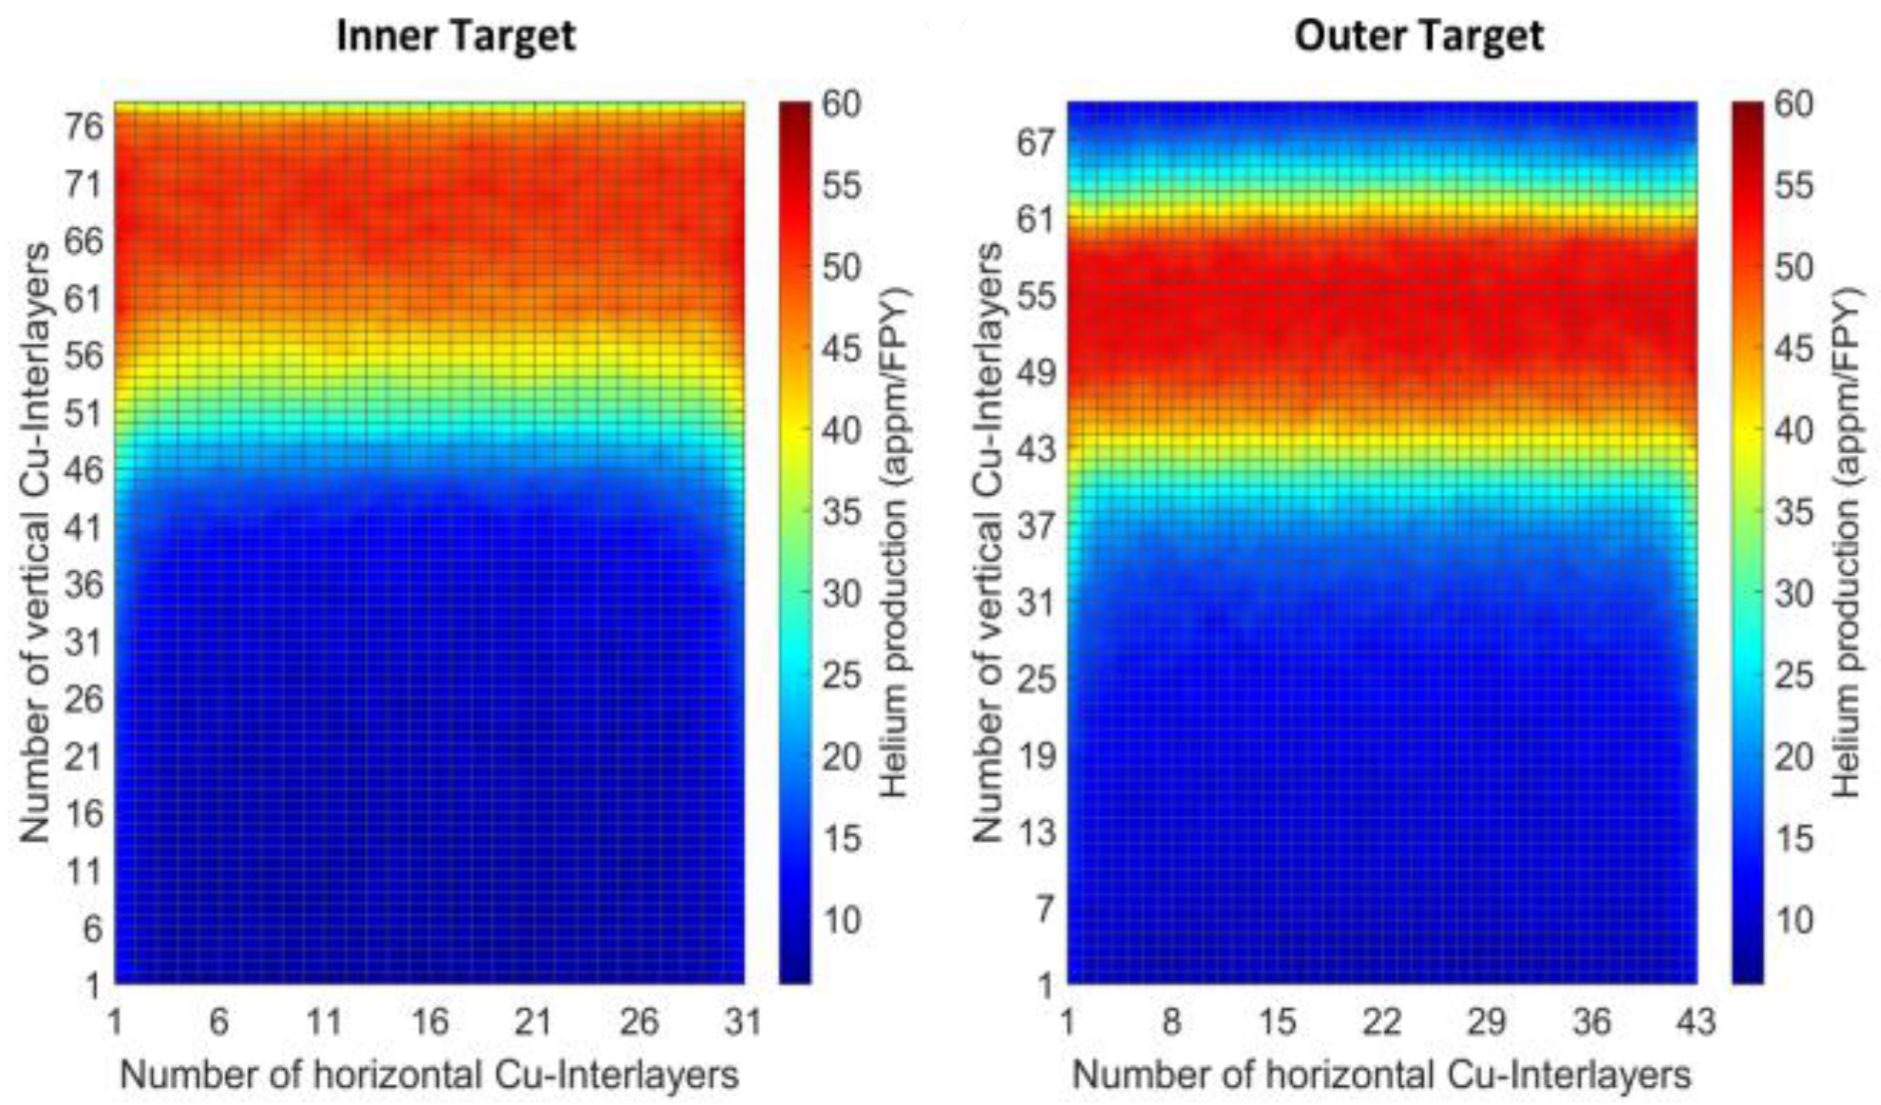
Figure 23 and
Figure 24 show the maps of the He-production rate (appm/FPY) distribution of W-monoblocks arranged on the inner and outer target, both for WCLL and HCPB, respectively. The maps of
Figure 23 (WCLL) highlight the following main considerations: the absolute peak value amounts to 1.88 appm/FPY, reached in correspondence of the 53rd row and external columns (1st and 43rd) of the outer target array. The maximum value on the inner target is 1.83 appm/FPY and it is achieved in correspondence of the 67th row and external columns (1st and and 31st) of the array. The minimum values amount to 0.32 appm/FPY (inner target) and 0.37 appm/FPY (outer target), both reached on the 1st row and innermost edges (15th, 16th and 17th; 21st, 22nd and 23rd; inner and outer, respectively).
In the maps of
Figure 24, which are referred to the HCPB case, the following main considerations can be stated: the absolute peak value is again reached in correspondence of the 53rd row and external columns (1st and 43rd) of the outer target, amounting to 1.90 appm/FPY. The maximum value on the inner target is 1.84 appm/FPY, achieved on the 67th row and external sides (columns 1st and 31st of the array). The minimum values are substantially the same already observed for the WCLL case. The He-production distributions, as for the other components already analyzed, highlight higher intensities, both with WCLL and HCPB, on the baffle region and external sides of both the targets and a symmetrical distribution with respect to the target central axis. In addition, comparing the maximum and minimum values, as well as the overall distributions, no significant differences between the WCLL and HCPB can be noted, outlining a very similar response in terms of He-production.
Figure 25 and
Figure 26 highlight the maps of the He-production rate (appm/FPY) distribution of Cu/CuCrZr components arranged on the inner and outer target, both for WCLL and HCPB, respectively. The maps of
Figure 25 (WCLL) show the following main conclusions: the absolute peak value amounts to 55.56 appm/FPY, reached in correspondence of the 52nd row and external columns (1st and 43rd) of the outer target array. The maximum value on the inner target is 55.20 appm/FPY and it is achieved in correspondence of the 60th row and external columns (1st and and 31st) of the array. The minimum values amount to 6.76 appm/FPY (inner target) and 8.04 appm/FPY (outer target), both reached on the 1st row and innermost sides (15th, 16th and 17th; 21st, 22nd and 23rd; inner and outer, respectively).
If the maps of
Figure 26, which are referred to the HCPB case, are seen, the following main considerations can be stated: the absolute peak value is again reached in correspondence of the 54th row and external columns (1st and 43rd) of the outer target, amounting to 56.28 appm/FPY. The maximum value on the inner target is 54.65 appm/FPY, achieved on the 60th row and external sides (columns 1st and 31st of the array). The lowest values amount to 6.91 appm/FPY (inner target) and 8.14 appm/FPY (outer target), both reached on the 1st row and innermost sides (15th, 16th and 17th; 21st, 22nd and 23rd; inner and outer, respectively). The He-production distributions, as for the other components already assessed, highlight higher intensities, both with WCLL and HCPB, on the baffle region and external sides of both the targets and a symmetrical distribution with respect to the target central axis. In addition, comparing the maximum and minimum values, as well as the overall distributions, a very similar response in terms of He-production, can be outlined both with WCLL and HCPB.
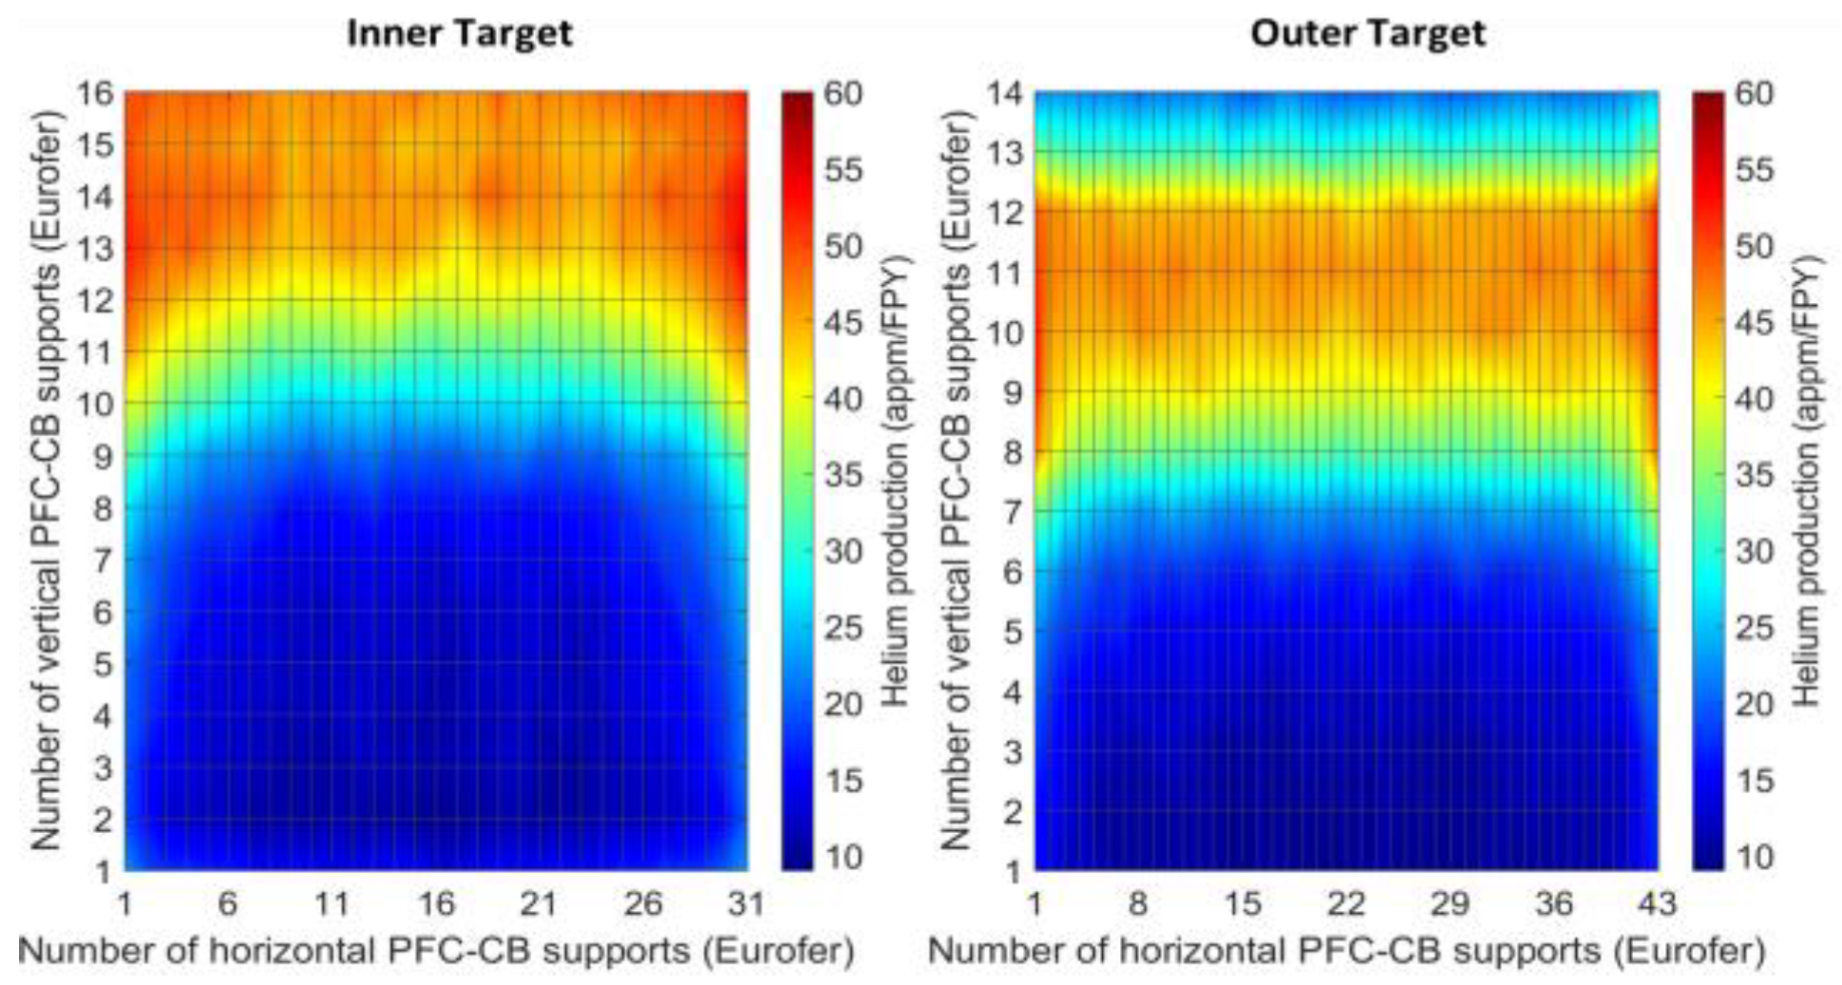
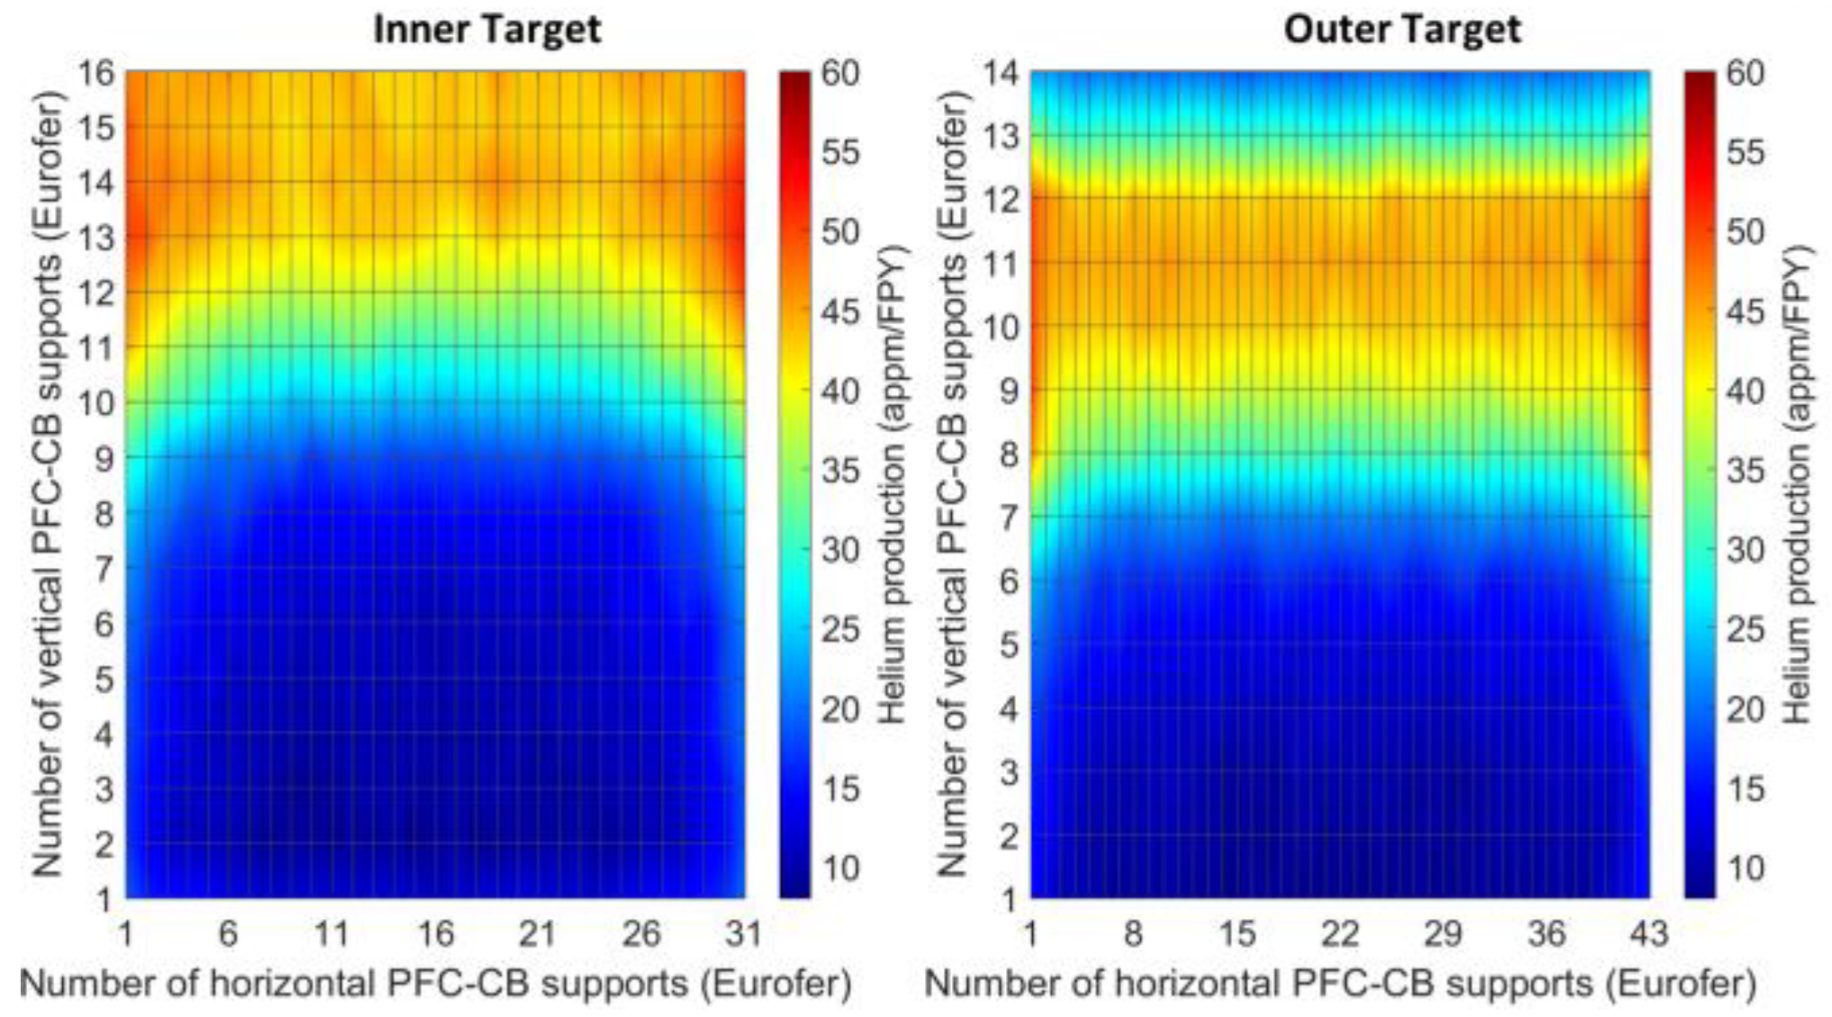
Figure 27 and
Figure 28 highlight the maps of the He-production rate (appm/FPY) distribution of Eurofer PFC-CB supports arranged on the inner and outer target, both for WCLL and HCPB, respectively. The maps of
Figure 27 (WCLL) lead to the following main conclusions: the absolute peak value amounts to 58.03 appm/FPY, reached in correspondence of the 13th row and external columns (1st and 31st) of the inner target array. The maximum value on the outer target is 57.15 appm/FPY and it is achieved in correspondence of the 11th row and external columns (1st and and 43rd) of the array. The minimum values amount to 10.24 appm/FPY (inner target) and 9.25 appm/FPY (outer target), reached respectively on the 2nd and 1st row and innermost edges (15th, 16th and 17th; 21st, 22nd and 23rd; inner and outer, respectively). The maps of
Figure 28 are referred to the HCPB case, and the following main considerations can be stated: the absolute peak value is achieved in correspondence of the 11th row and external columns (1st and 43rd) of the outer target, amounting to 55.81 appm/FPY. The maximum value on the inner target is 54.64 appm/FPY, achieved on the 13th row and external sides (columns 1st and 31st of the array). The lowest values amount to 8.83 appm/FPY (inner target) and 8.50 appm/FPY (outer target), reached respectively on the 2nd and 1st row, on the innermost columns (15th, 16th and 17th; 21st, 22nd and 23rd; inner and outer, respectively). Once again, the He-production distributions highlight higher intensities, both with WCLL and HCPB, on the baffle region and external sides of both the targets and a symmetrical distribution with respect to the target central axis. In addition, comparing the maximum and minimum values, as well as the overall distributions, a quite similar response in terms of He-production in Eurofer, ca be outlined both with WCLL and HCPB, although less evident than W-monoblocks and Cu/CuCrZr components.
3.3. Nuclear Loads and Thermal Power Deposition on PFCs during Operations: Comparison between WCLL and HCPB
A detailed assessment of the spatial distribution of the nuclear loads on the DEMO divertor targets during operations for both the BB cases under analysis, has been performed, and it is well described in the previous section.
This section is fully devoted to assessing the effects of the different blanket layouts on the nuclear load’s distribution of the DEMO divertor. In particular, the values of the nuclear heating density (W/cm
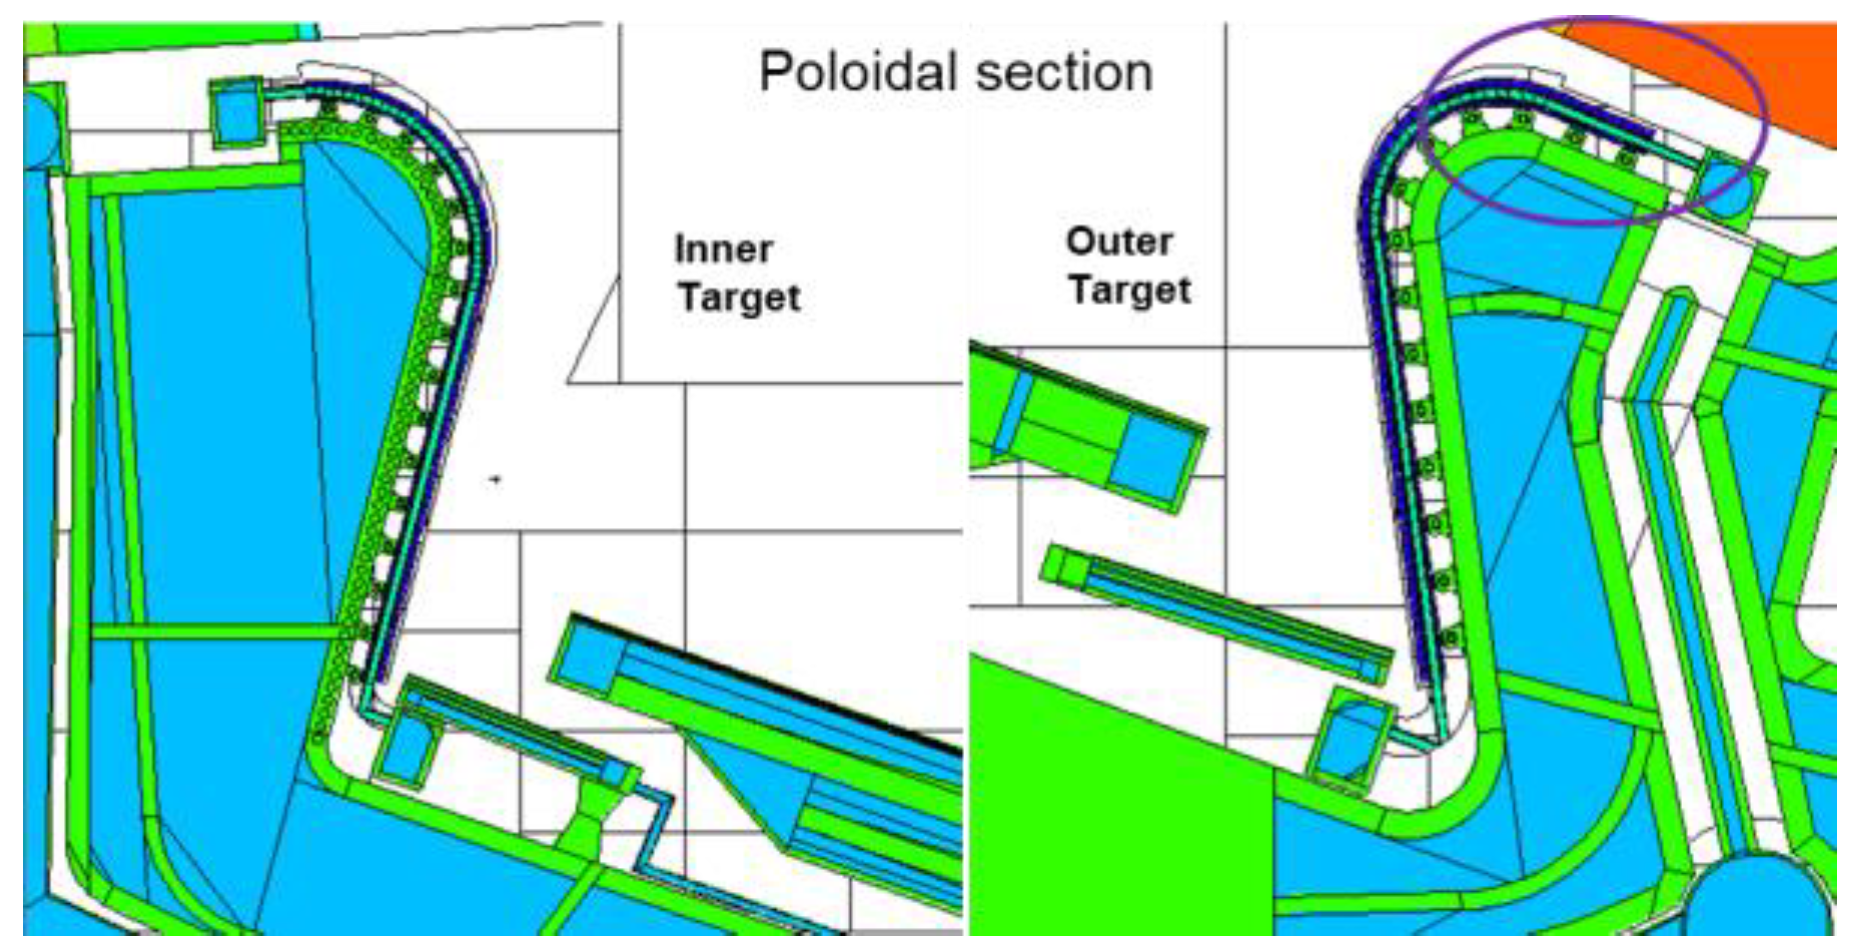
3), radiation damage (dpa/FPY) and He-production (appm/FPY) for W-monoblocks, Cu/CuCrZr elements, PFC-CB supports and CB are shown by means of 2D poloidal profiles as function of a curvilinear abscissa, which starts from the upper part of the targets (baffle region) and is directed towards the lower part (
Figure 10). In addition, the total nuclear power (MW) on PFCs and breakdown in each component has been performed, comparing the results between the two blanket concepts. Every 2D plot shows the poloidal profiles comparing both the external (highlighted in purple and red in the
Figure 7) and internal (black in
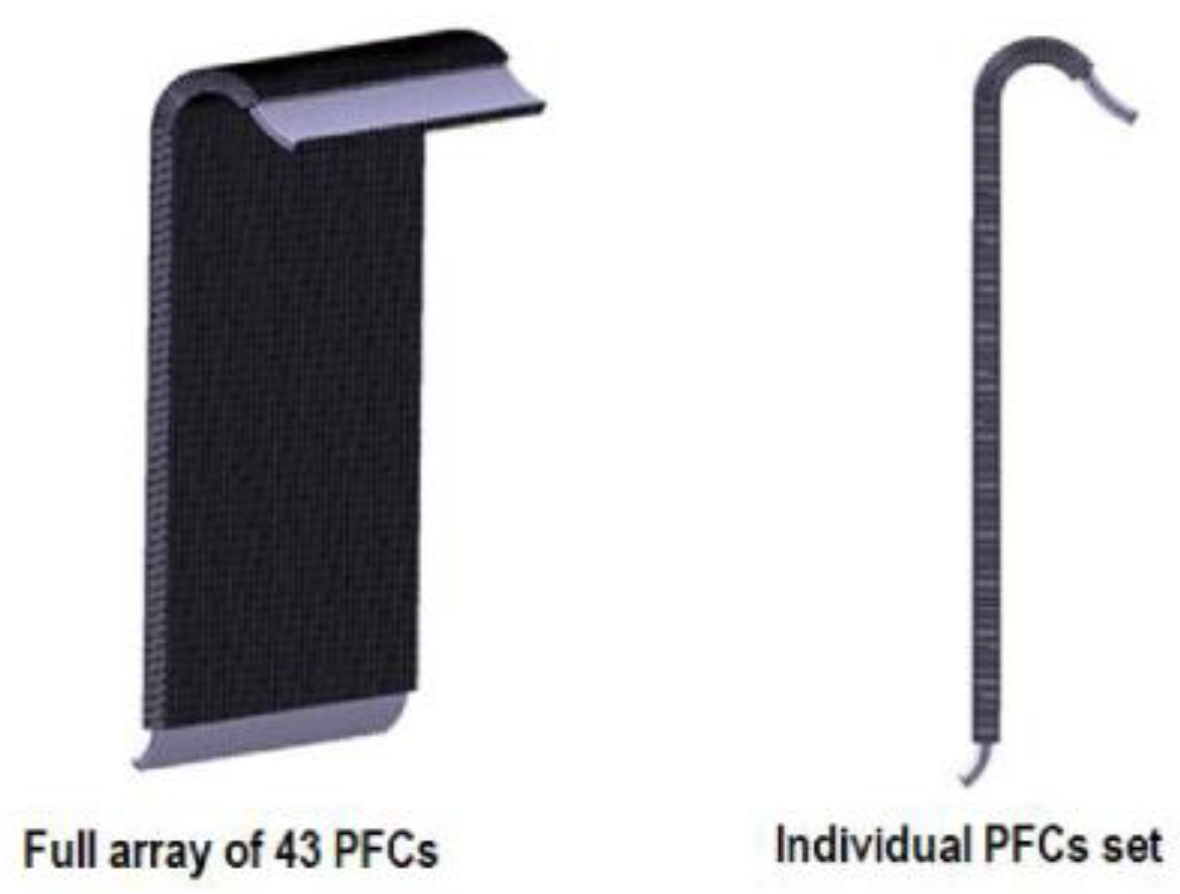
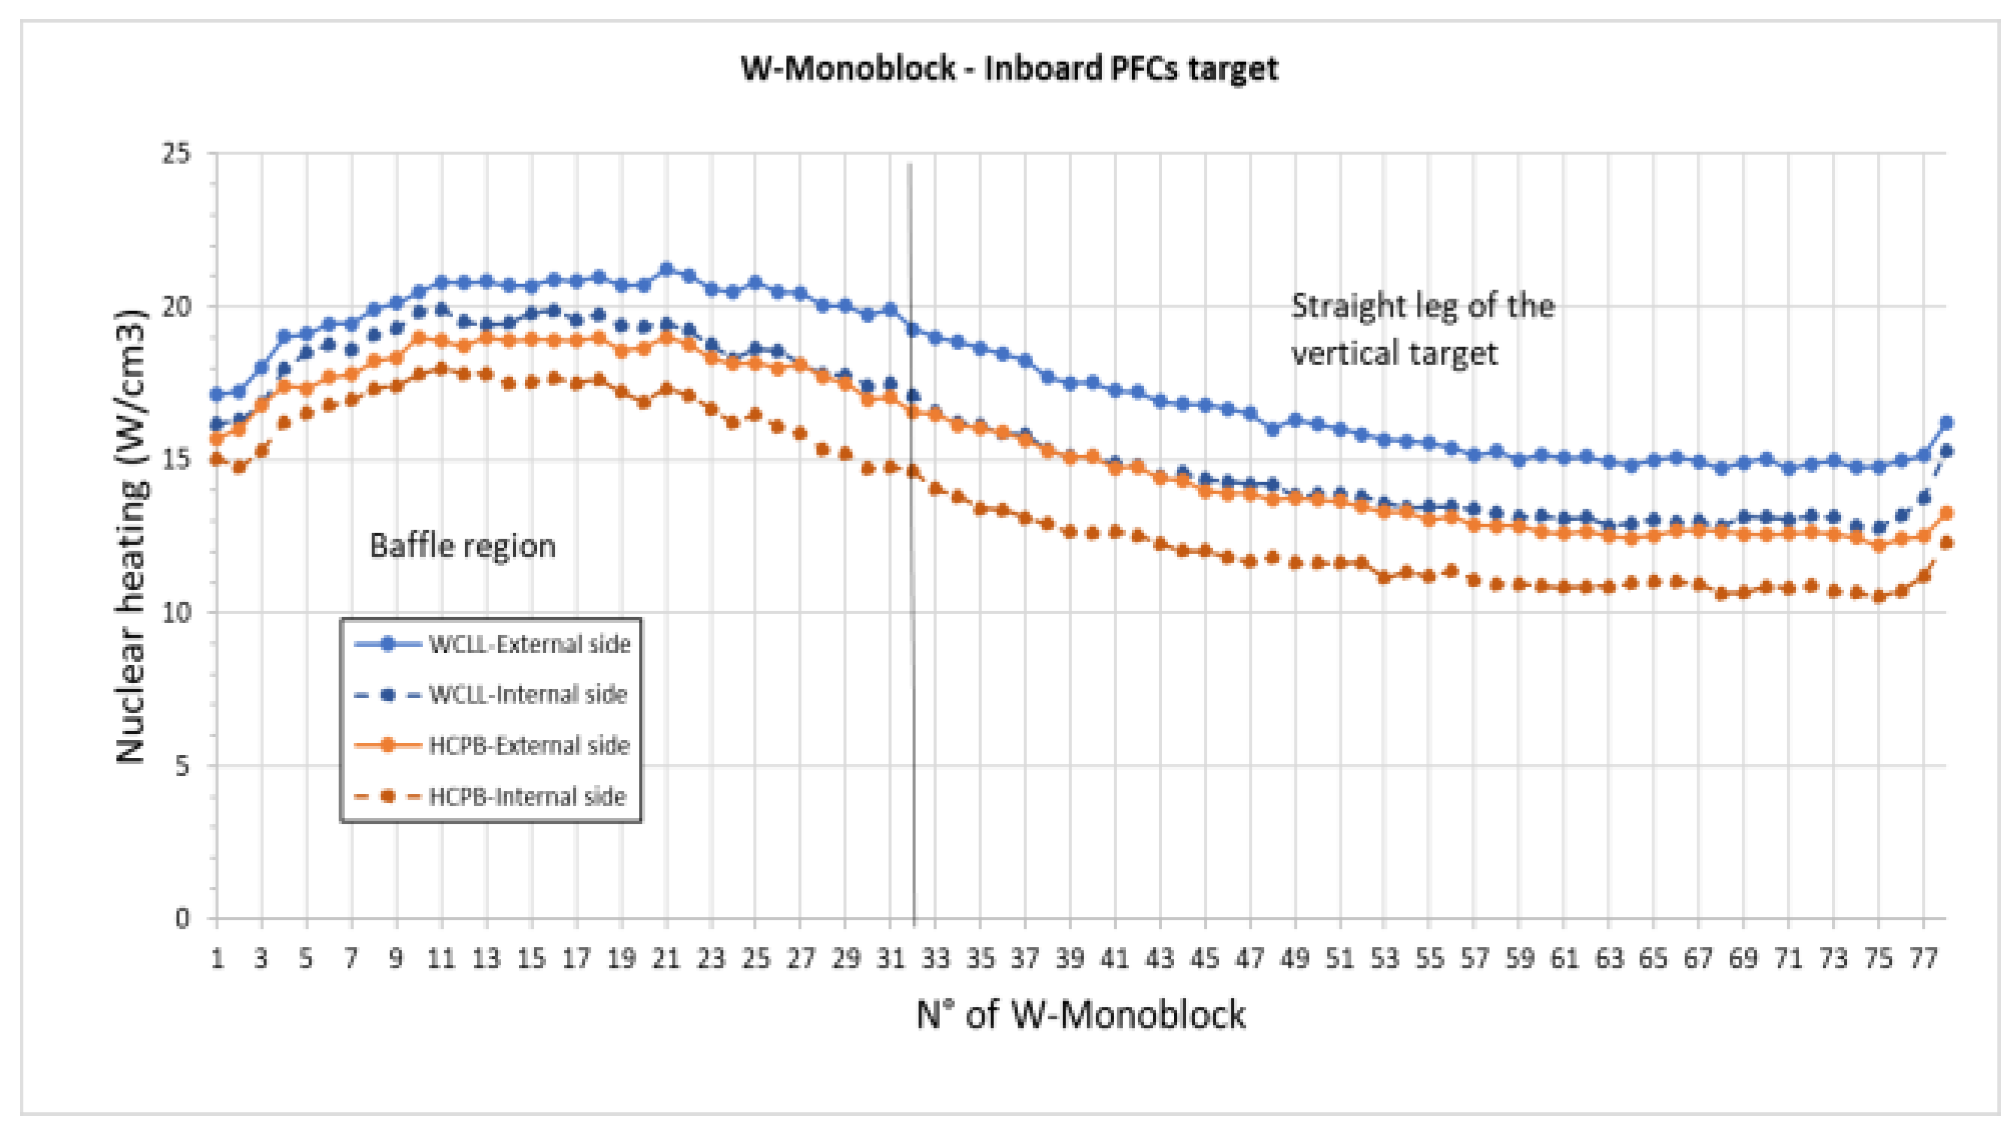
Figure 7) sides of the target loads, both for WCLL and HCPB blanket. Each point is representative of the nuclear load value on each component (W, Cu/CuCrZr and Eurofer support) along the profile. The number of components is 78 (IB) and 70 (OB) W-Monoblocks/Cu-Interlayers/CuCrZr pipe, 16 (IB) and 14 (OB) Eurofer supports. The poloidal profiles of nuclear heating density of W-monoblocks are shown in
Figure 32 and
Figure 33, for the inner and outer target, respectively.
If the comparison between WCLL and HCPB profiles of the inner target (
Figure 32), is considered, the following considerations can be stated: the nuclear heating density appears to be higher with the Water Cooled blanket than the Helium Cooled one. The difference between the profiles is around +10/20% for the W-monoblocks arranged on the baffle region (+11.6% comparing the corresponding peak values shown in
Table 6 and
Table 8), then increasing up to +20/30% on the straight leg of the vertical targets (+22.6% comparing the corresponding minimum values reported in
Table 6 and
Table 8). Regarding the comparison between the poloidal profiles of external and internal arrays (both for WCLL and HCPB) of the inner target (
Figure 32), the following statements can be supported: these plots clearly show a greater level of nuclear loads intensity on the components placed more externally on the targets, compared to the central ones. The differences between internal and external edges are more pronounced on the straight leg (e.g., about +20/40%), and more attenuated on the baffle region (e.g., around +5/15%). It should be noted that the differences between the profiles highlighted with the two comparisons are due to different reasons: considering the comparison between the two blankets, the variation mainly lies in the impact that the two different layouts (in terms of materials and design) have on the neutron spectra impinging on the target. In the second comparison, the difference is mainly due to the position of the components on the target and therefore to the view factor on the plasma, which is substantially independent of the type of blanket. These aspects are better discussed in the next section.
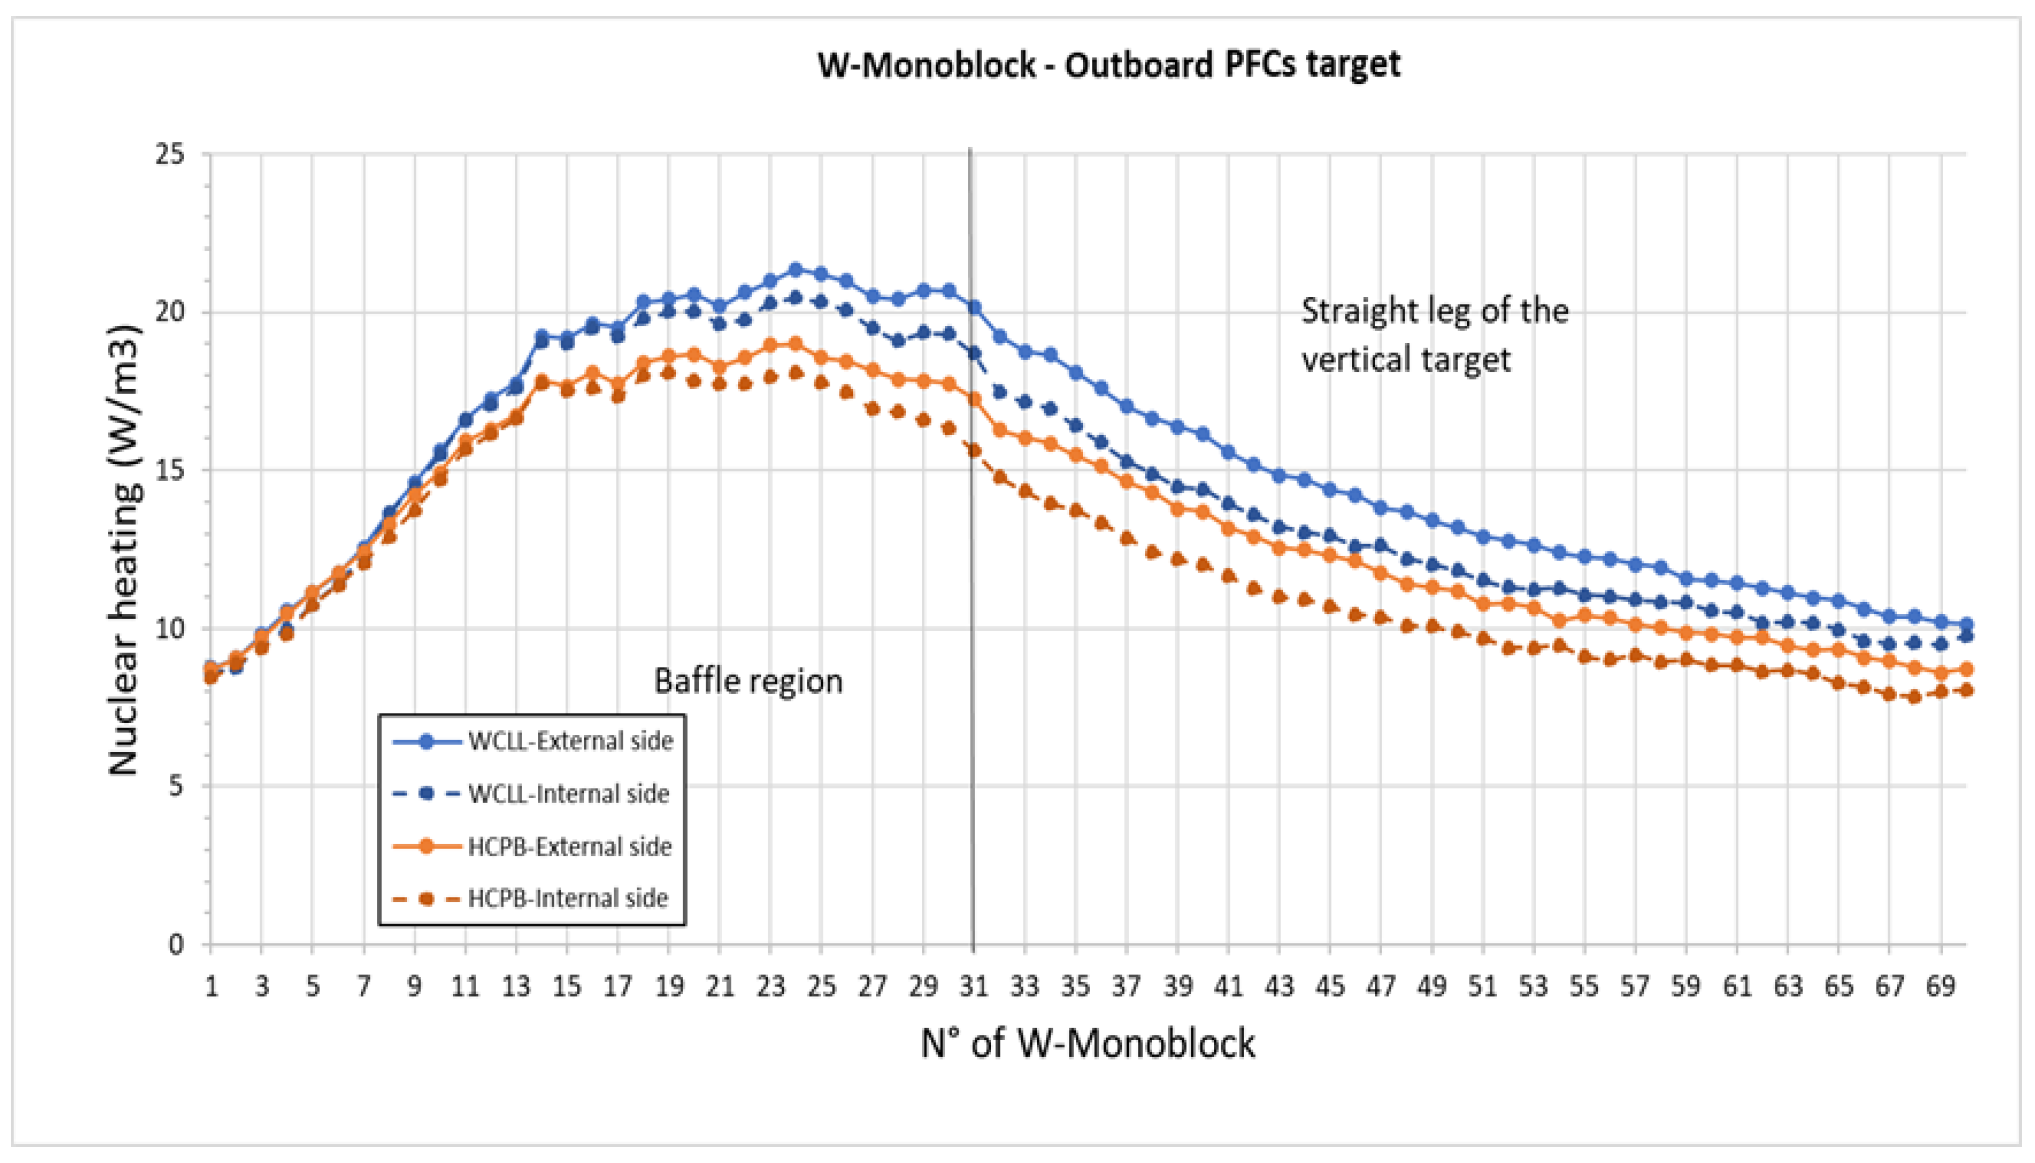
Nuclear heating density on W-monoblocks appears to be higher with WCLL than HCPB, also observing the outer poloidal profiles (
Figure 33). The difference between the profiles is around +10/20% for the W-monoblocks placed on the baffle region (+12.6% comparing the corresponding peak values shown in
Table 7 and
Table 9), then increasing up to +20/30% on the straight leg of the vertical targets (+6% comparing the corresponding minimum values reported in
Table 7 and
Table 9). The profiles are almost perfectly overlapped for the first W-monoblocks (1–7), i.e., in correspondence with the extremal part of the baffle region (highlighted in
Figure 31). Regarding the comparison between the poloidal profiles of external and internal arrays (both for WCLL and HCPB) of the outer target (
Figure 33), once again, the plots show a higher level of nuclear loads magnitude on the components placed more externally on the targets, compared to the central ones. The differences between internal and external edges are more pronounced on the straight leg (e.g., about +10/30%), and more attenuated on the baffle region (e.g., around +5/10%).
Compared to the inner target, the difference between external and internal profiles is generally smaller, especially in the baffle region where the solid and dashed lines are almost overlapped. The poloidal profiles of nuclear damage of W-monoblocks are shown in
Figure 34 and
Figure 35, for the inner and outer target, respectively. Nuclear damage on W-monoblocks is higher with WCLL than HCPB, as shown by the inner poloidal profiles of
Figure 34. The difference between the profiles is around +10/20% for the W-monoblocks placed on the baffle region (+14.8% comparing the corresponding peak values shown in
Table 6 and
Table 8), then increasing up to +20/30% on the straight leg of the vertical targets (+18.2% comparing the corresponding minimum values reported in
Table 6 and
Table 8). Regarding the comparison between the poloidal profiles of external and internal arrays (both for WCLL and HCPB) of the inner target (
Figure 34), once again, the plots show a higher level of nuclear loads magnitude on the components placed more externally on the targets, compared to the central ones. The differences between internal and external edges are more pronounced on the straight leg (e.g., about +10/35%), and more attenuated on the baffle region (e.g., around +5/10%). If the poloidal profiles related to the outer target (
Figure 35) are considered, the following assessment can be done: as is reasonable to expect nuclear damage is greater with WCLL than HCPB; once again the difference between the profiles is about +10/20% in correspondence of the baffle region (+12.5% comparing the peak values shown in
Table 7 and
Table 9), remaining substantially unvaried also in the remaining part of the target (+10.3% comparing the minimum values shown in
Table 7 and
Table 9). Regarding the comparison between the poloidal profiles of external and internal arrays (both for WCLL and HCPB) of the outer target (
Figure 35), once again, the plots show a higher level of nuclear loads magnitude on the components placed more externally on the targets, compared to the central ones. The differences between internal and external sides are more pronounced on the straight leg (e.g., about +10/40%), and strongly attenuated on the baffle region (e.g., less than +5%). Indeed, the solid and dashed lines are almost overlapped both in the inner target and especially in the outer target, in correspondence of the baffle region.
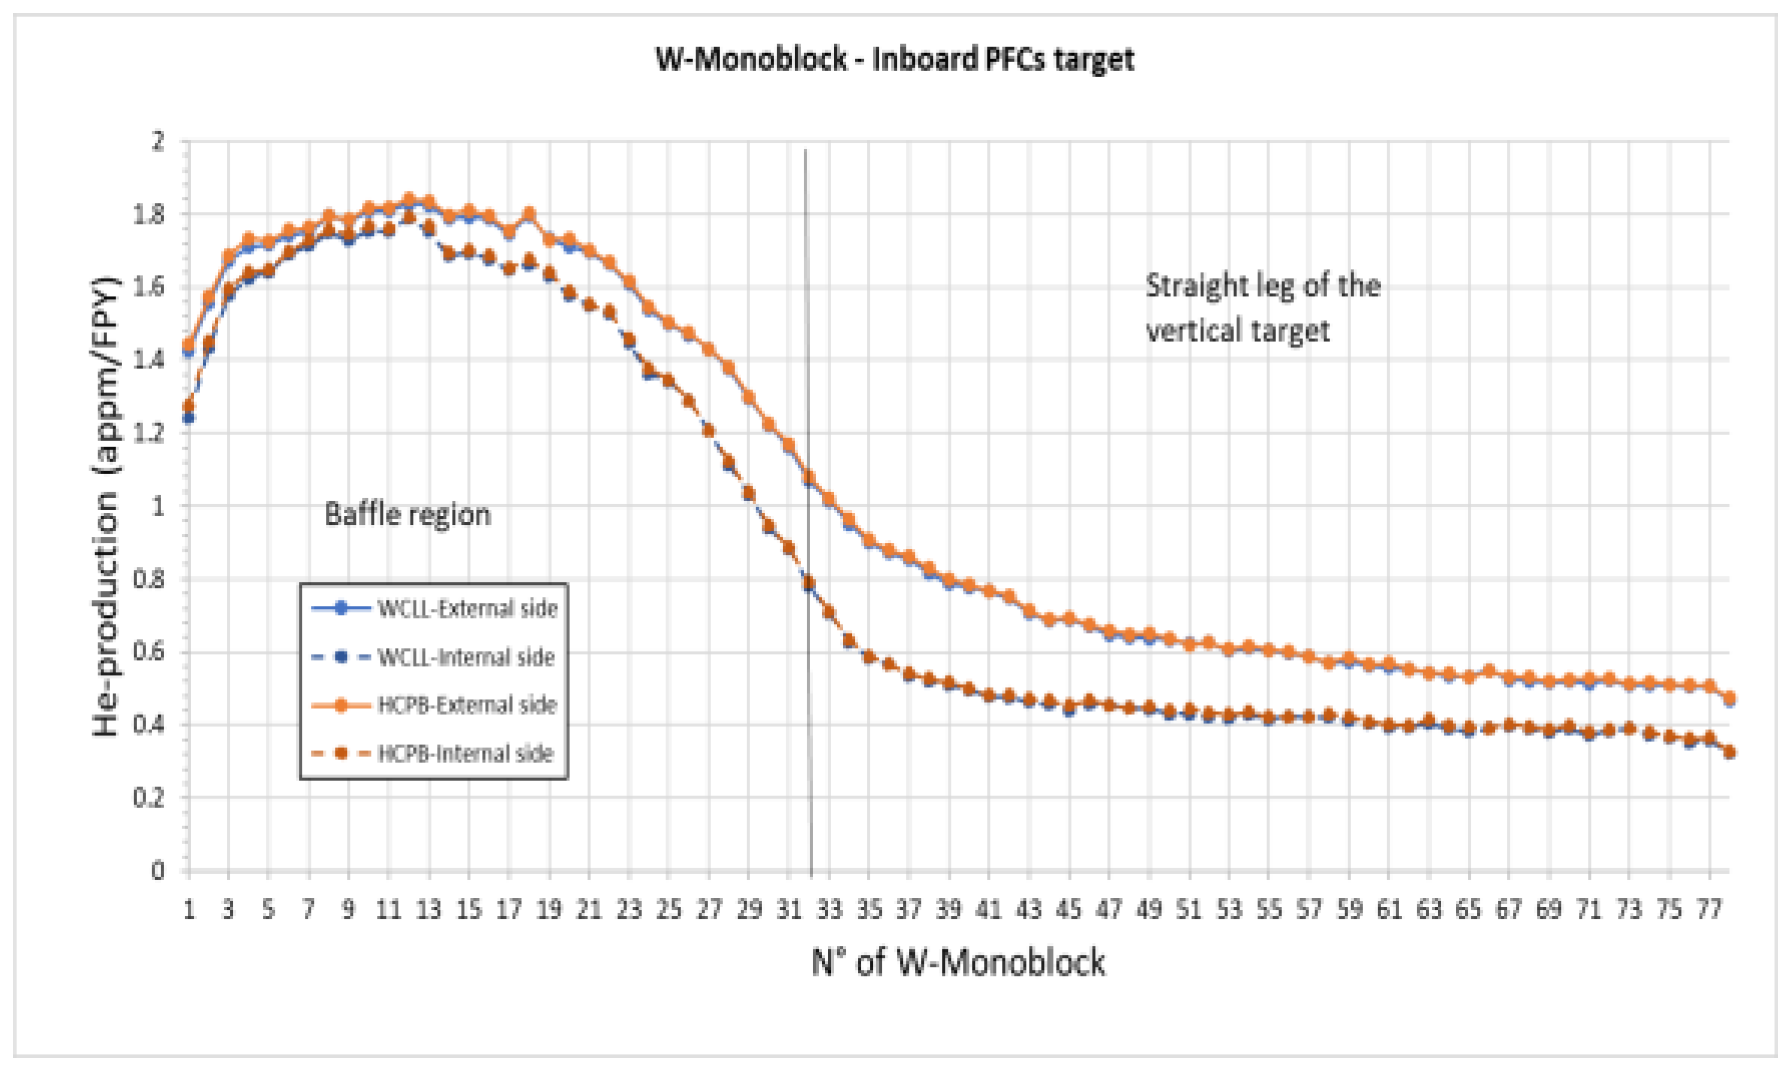
The poloidal profiles of He-production of W-monoblocks are shown in
Figure 36 and
Figure 37, for the inner and outer target, respectively. Compared to what has been noted for nuclear heating density and damage, He-production seems to be not significantly affected by the type of blanket, being the blue and orange lines essentially overlapped both for the inner and outer target (
Figure 36 and
Figure 37). This effect can be noted also looking at the spatial distribution maps of He-production on W, shown in the previous section, which appear very similar in terms of color scale. The reason for this is better discussed in the next section.
Regarding the comparison between the poloidal profiles of external and internal arrays (both for WCLL and HCPB) of the inner and outer target (
Figure 36 and
Figure 37), the plots show a higher level of nuclear loads intensity on the components placed more externally on the targets, compared to the central ones. The differences between internal and external sides are more pronounced on the straight leg (e.g., about +10/45% as range), and strongly attenuated on the baffle region (e.g., less than 5%). Indeed, the solid and dashed lines are almost overlapped both in the inner target and especially in the outer target, in correspondence of the baffle region.
The poloidal profiles of nuclear heating density on Cu/CuCrZr components are shown in
Figure 38 and
Figure 39, for the inner and outer target, respectively. If the comparison between WCLL and HCPB profiles of the inner target (
Figure 38) is considered, the following considerations can be done: the nuclear heating density appears to be higher with the Water Cooled blanket than the Helium Cooled one, as already highlighted for W-monoblocks.
The difference between the profiles is around +5/10% for the Cu/CuCrZr components placed on the baffle region (+7.7% comparing the corresponding peak values shown in
Table 6 and
Table 8), then increasing up to +15/20% on the straight leg of the vertical targets (+20.5% comparing the corresponding minimum values reported in
Table 6 and
Table 8). Regarding the comparison between the poloidal profiles of external and internal arrays (both for WCLL and HCPB) of the inner target (
Figure 38), the following statements can be assessed: these plots clearly show a more intense level of nuclear loads intensity on the components placed more externally on the targets, compared to the central ones. The differences between internal and external edges are more pronounced on the straight leg (e.g., about +15/20%), and more attenuated on the baffle region (e.g., around +5/15%).
The differences between the profiles highlighted with the two comparisons are due to different reasons: considering the comparison between the two blankets, the variation mainly lies in the impact that the two different layouts (in terms of materials and design) have on the neutron spectra impinging on the target. The second comparison points out a difference which is principally due to the position of the components on the target and therefore to the view factor on the plasma, which is substantially independent of the type of blanket. These aspects are better discussed in the next section.
Nuclear heating density on Cu/CuCrZr components appears to be higher with WCLL than HCPB, also looking at the outer poloidal profiles (
Figure 39). The difference between the profiles is around +5/15% for the Cu/CuCrZr components placed on the baffle region (+8.1% comparing the corresponding peak values shown in
Table 7 and
Table 9), then increasing up to +15/20% on the straight leg of the vertical targets (+19% comparing the corresponding minimum values shown in
Table 7 and
Table 9). The profiles are almost perfectly overlapped for the first Cu/CuCrZr components (1–7), i.e., in correspondence with the extremal part of the baffle region (highlighted in
Figure 31), well shielded by the outboard blanket segment. Regarding the comparison between the poloidal profiles of external and internal arrays (both for WCLL and HCPB) of the outer target (
Figure 39), once again, the plots show a greater level of nuclear loads magnitude on the components placed more externally on the targets, compared to the central ones. The differences between internal and external edges are more pronounced on the straight leg (e.g., about +15/20%), and more attenuated on the baffle region (e.g., around +5/10%). Compared to the inner target, the difference between external and internal profiles is generally smaller, especially in the baffle region where the solid and dashed lines are almost overlapped.
The poloidal profiles of nuclear damage of Cu/CuCrZr components are shown in
Figure 40 and
Figure 41, for the inner and outer target, respectively. Nuclear damage on Cu/CuCrZr is higher with WCLL than HCPB, as shown by the inner poloidal profiles of
Figure 40. The difference between the profiles is around +20/25% for the Cu/CuCrZr located on the baffle region (+19.7% comparing the corresponding peak values shown in
Table 6 and
Table 8), maintaining the same order of magnitude (+20/30%) on the straight leg of the vertical targets (+21.1% comparing the corresponding minimum values reported in
Table 6 and
Table 8). Regarding the comparison between the poloidal profiles of external and internal arrays (both for WCLL and HCPB) of the inner target (
Figure 40), once again, the plots show a more intense level of nuclear loads magnitude on the components placed more externally on the targets, compared to the central ones. The differences between internal and external edges are more pronounced on the straight leg (e.g., about +20/30%), and more attenuated on the baffle region (e.g., around +5/15%). If the poloidal profiles related to the outer target (
Figure 41) are considered, the following assessment can be made: as is reasonable to expect nuclear damage is greater with WCLL than HCPB; once again the difference between the profiles is about +10/20% in correspondence of the baffle region (+17.3% comparing the peak values shown in
Table 7 and
Table 9), remaining substantially unvaried also in the remaining part of the target (+10.9% comparing the minimum values shown in
Table 7 and
Table 9). Regarding the comparison between the poloidal profiles of external and internal arrays (both for WCLL and HCPB) of the outer target (
Figure 41), once again, the plots show a greater level of nuclear loads magnitude on the components placed more externally on the targets, compared to the central ones. The differences between internal and external sides are more pronounced on the straight leg (e.g., about +10/35%), and strongly attenuated on the baffle region (e.g., less than +5%). Indeed, the solid and dashed lines are almost overlapped both in the inner target and especially in the outer target, in correspondence of the baffle region.
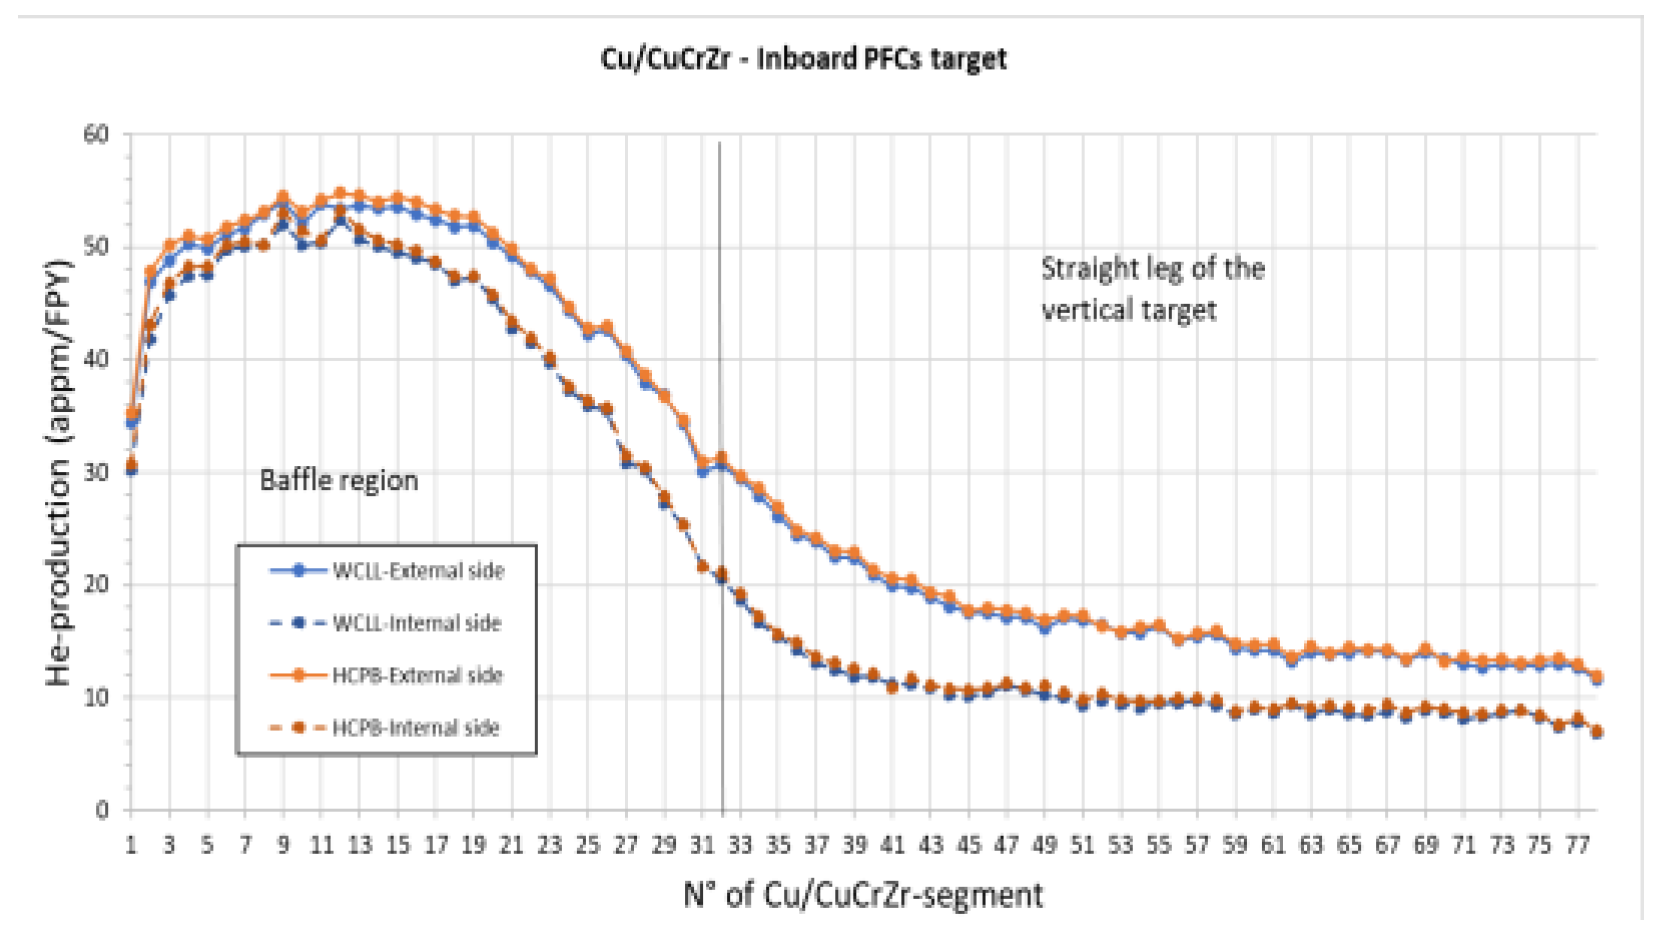
The poloidal profiles of He-production on Cu/CuCrZr components are shown in
Figure 42 and
Figure 43, for the inner and outer target, respectively. Once again, He-production appears to be not significantly affected by the type of blanket, being the blue and orange lines essentially overlapped both for the inner and outer target (
Figure 42 and
Figure 43). This effect can be noted also looking at the spatial distribution maps of He-production on Cu/CuCrZr, shown in the previous section, which show a very similar behavior in terms of colours scale. The reason why this effect occurs is better discussed in the next section. Regarding the comparison between the poloidal profiles of external and internal arrays (both for WCLL and HCPB) of the inner and outer target (
Figure 42 and
Figure 43), the plots show a higher level of nuclear loads intensity on the components placed more externally on the targets, compared to the central ones, as already shown in the previous case. The differences between internal and external sides are more pronounced on the straight leg (e.g., about +10/45% as range), and strongly attenuated on the baffle region (e.g., less than +5%). In this regard, the solid and dashed lines are almost overlapped both in the inner target and especially in the outer target, in correspondence of the baffle region.
The poloidal profiles of nuclear heating density on PFC-CB supports made of Eurofer are shown in
Figure 44 and
Figure 45, for the inner and outer target, respectively. If the comparison between WCLL and HCPB profiles of the inner target (
Figure 44) is considered, the following considerations can be assessed: the nuclear heating density appears to be higher with the Water Cooled blanket than the Helium Cooled one, as already highlighted for W-monoblocks and Cu/CuCrZr components. The difference between the profiles is around +5/15% for the supports placed on the baffle region (+13.0% comparing the corresponding peak values shown in
Table 6 and
Table 8), then increasing up to +15/25% on the straight leg of the vertical targets (+25.8% comparing the corresponding minimum values reported in
Table 6 and
Table 8). Regarding the comparison between the poloidal profiles of external and internal arrays (both for WCLL and HCPB) of the inner target (
Figure 44), the following statements can be assessed: these plots clearly show a higher level of nuclear loads intensity on the components placed more externally on the targets, compared to the central ones. The differences between internal and external edges are more pronounced on the straight leg (e.g., about +20/35%), and more attenuated on the baffle region (e.g., around +5/20%). Once again, considering the comparison between the two blankets, the difference mainly lies in the impact that the two different layouts (in terms of materials and design) have on the neutron spectra impinging on the target. The second comparison highlights a difference which is principally due to the position of the components on the target and therefore to the view factor on the plasma, which is substantially independent of the type of blanket. These aspects are better discussed in the next section.
Nuclear heating density on supports made of Eurofer appears to be higher with WCLL than HCPB, also looking at the outer poloidal profiles (
Figure 45). The variance between the profiles is around +0/10% for the supports positioned on the baffle region (+9.3% comparing the corresponding peak values shown in
Table 7 and
Table 9), then increasing up to +15/20% on the straight leg of the vertical targets (+21.0% comparing the corresponding minimum values shown in
Table 7 and
Table 9). The profiles are almost perfectly overlapped for the first supports (1–3), i.e., in correspondence with the extremal part of the baffle region (highlighted in
Figure 31), well shielded by the outboard blanket segment. Regarding the comparison between the poloidal profiles of external and internal arrays (both for WCLL and HCPB) of the outer target (
Figure 45), once again, the plots show a greater level of nuclear loads magnitude on the components placed more externally on the targets, compared to the central ones. The variances between internal and external edges are more pronounced on the straight leg (e.g., about +15/20%), and more attenuated on the baffle region (e.g., around +0/10%). Compared to the inner target, the variance between external and internal profiles is generally smaller, especially in the baffle region where the solid and dashed lines are almost overlapped.
The poloidal profiles of nuclear damage on PFC-CB supports made of Eurofer, are shown in
Figure 46 and
Figure 47, for the inner and outer target, respectively. Nuclear damage on Eurofer supports is higher with WCLL than HCPB, as shown by the inner poloidal profiles of
Figure 46. The variance between the profiles is around +15% for the supports positioned on the baffle region (+15.2% comparing the corresponding peak values shown in
Table 6 and
Table 8), increasing up to 15/30% on the straight leg of the vertical targets (+19.4% comparing the corresponding minimum values reported in
Table 6 and
Table 8). Regarding the comparison between the poloidal profiles of external and internal arrays (both for WCLL and HCPB) of the inner target (
Figure 46), once again, the plots show a more intense level of nuclear loads magnitude on the components placed more externally on the targets, compared to the central ones. The variances between internal and external edges are more pronounced on the straight leg (e.g., about +30/60%), and more attenuated on the baffle region (e.g., around +15/30%). If the poloidal profiles related to the outer target (
Figure 47) are considered, the following assessment can be made: as is reasonable to expect, nuclear damage is greater with WCLL than HCPB; once again the variance between the profiles is about +5/15% in correspondence of the baffle region (+13.2% comparing the peak values shown in
Table 7 and
Table 9), remaining substantially unchanged also in the remaining part of the target (+13.2% comparing the minimum values shown in
Table 7 and
Table 9). Regarding the comparison between the poloidal profiles of external and internal arrays (both for WCLL and HCPB) of the outer target (
Figure 47), once again, the plots highlight a greater intensity of nuclear loads level on the components placed more externally on the targets, compared to the central ones. The variances between internal and external sides are significantly higher on the straight leg (e.g., about +20/50%), and more attenuated on the baffle region (e.g., +5/15%).
Indeed, it can be noted how the solid and dashed lines are almost overlapped both in the inner target and especially in the outer target, in correspondence of the baffle region.
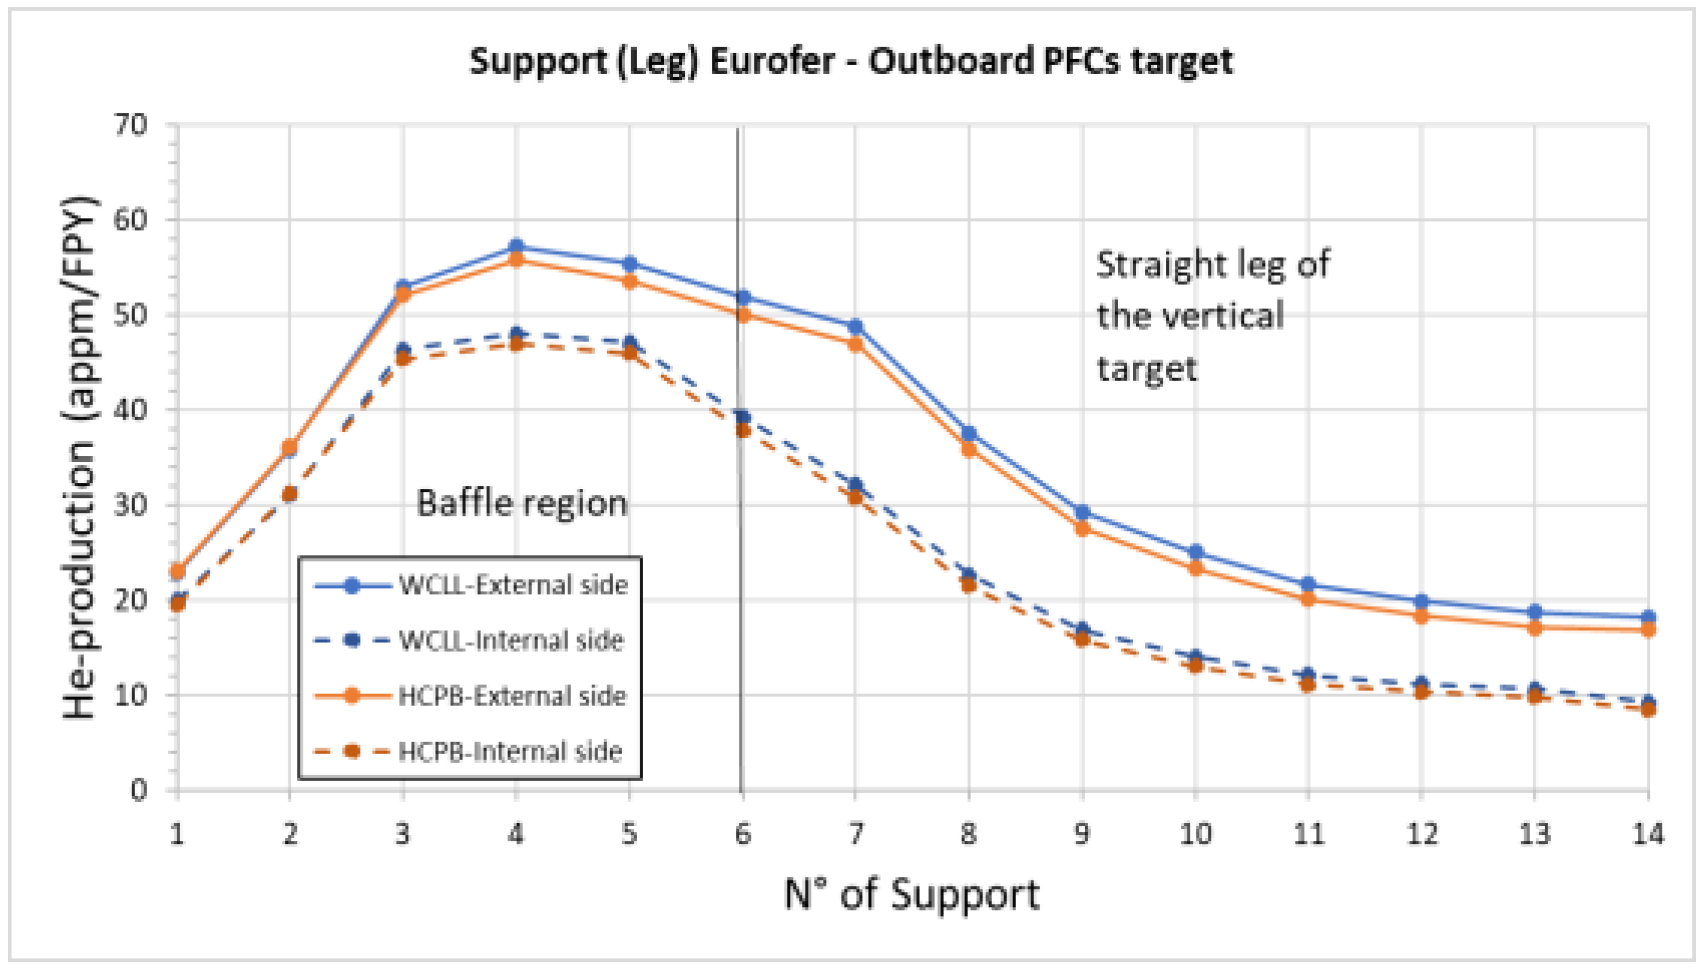
The poloidal profiles of He-production on PFC-CB supports made of Eurofer, are shown in
Figure 48 and
Figure 49, for the inner and outer target, respectively. Contrary to the previous cases (W-monoblocks and Cu/CuCrZr components), for the Eurofer supports, the difference between the profiles is not negligible, highlighting higher He-production values with the WCLL blanket compared to the HCPB one, both in the inner and outer target.
Looking at
Figure 48, the variance between the profiles is around +5/10% for the supports positioned on the inner baffle region (+6.2% comparing the corresponding peak values shown in
Table 6 and
Table 8), not varying the order of magnitude (+5/15%) on the straight leg of the inner vertical targets (+16.0% comparing the corresponding minimum values reported in
Table 6 and
Table 8). Regarding the comparison between the poloidal profiles of external and internal arrays (both for WCLL and HCPB) of the inner target (
Figure 48), once again, the plots show a more intense level of nuclear loads magnitude on the components placed more externally on the targets, compared to the central ones. The deviations between internal and external edges are more pronounced on the straight leg (e.g., about +40/70%), and more attenuated on the baffle region (e.g., around +15/30%). If the poloidal profiles related to the outer target (
Figure 49) are considered, the following assessment can be done: the difference between the profiles is about +0/5% in correspondence of the baffle region (+2.4% comparing the peak values shown in
Table 7 and
Table 9), remaining substantially unchanged (+5/10%) also in the remaining part of the target (+8.8% comparing the peak values shown in
Table 7 and
Table 9). Regarding the comparison between the poloidal profiles of external and internal arrays (both for WCLL and HCPB) of the outer target (
Figure 49), once again, the plots highlight a greater intensity of nuclear loads level on the components placed more externally on the targets, compared to the central ones. The variances between internal and external sides are significantly higher on the straight leg (e.g., about +30/90%), and more attenuated on the baffle region (e.g., +10/30%). The reason why this effect occurs is better discussed in the next section.
The poloidal profiles for the nuclear quantities of interest, on the first layer (Eurofer) of the inboard cassette body (CB) have been assessed, subdividing it into 56 spheres (or segment) both on the external and the innermost side (
Figure 50).
The purpose of this additional evaluation is the analysis of the shielding capabilities of the PFCs on the most outward part of the cassette body, as well as the nuclear loads distribution along the poloidal profiles of the CB, considering once again the impact of the different kind of blanket (WCLL and HCPB). Considering the nuclear heating profiles (
Figure 51), once again it is greater with the Water Cooled blanket than the Helium cooled one and in particular, the maximum values are in correspondence of the external edge baffle region: 8.47 W/cm
3 and 7.41 W/cm
3 for WCLL and HCPB, respectively, showing an increase of about 14.3% with WCLL.
The minimum values are 2.37 W/cm
3 (WCLL) and 1.90 W/cm
3 (HCPB), highlighting an increase of 24.7% with the water coolant, in correspondence with the lower and innermost part of the cassette body. Therefore, the WCLL shows higher nuclear heating loads than HCPB (+15/20% on the baffle region, +20/30% on the straight leg). As already noted, a greater intensity on the external edges than the innermost side (around +15% on the baffle region, +25/30% on the straight leg) is pointed out both for WCLL and HCPB cases. The nuclear damage profiles are shown in
Figure 52, highlighting greater values with the WCLL blanket than the HCPB. The peak values are in correspondence of the external edge baffle region: 4.49 dpa/FPY and 3.95 dpa/FPY for WCLL and HCPB, respectively, showing an increase of about 13.4% with WCLL. Considering that the cumulated damage limit in Eurofer (as mentioned in the previous sections) is 6 dpa, this implies that under these conditions the DEMO divertor cassette body could fulfill the expected lifetime of 1.5 FPY only with the HCPB blanket, on the contrary with the WCLL the lifetime expected may be lower (1.34 FPY). The minimum values are 0.61 dpa/FPY (WCLL) and 0.52 dpa/FPY (HCPB), showing an increase of 17.3% with the water coolant, in correspondence with the lower and innermost part of the cassette body. Therefore, the WCLL shows higher nuclear damage loads than HCPB (+15% on the baffle region, +15/20% on the straight leg). A more intense level on the external edges than the innermost side (around +20% on the baffle region, +40/50% on the straight leg) is observed both for WCLL and HCPB cases. The He-production of the first layer of the CB (see
Figure 53) appears to be considerably affected by the blanket typology, compared to the PFCs, where the He-production rate appears to be quite similar with both the blanket layouts. In this case, the maximum values are achieved in correspondence of the external edge baffle region: 79.34 appm/FPY (WCLL) and 66.82 appm/FPY (HCPB) pointing out an increase of about 19% with WCLL than HCPB. The lowest values are once again achieved on the lowest and innermost part of the CB layer: 9.91 appm/FPY and 8.83 appm/FPY for WCLL and HCPB respectively (+12.2% with WCLL). WCLL shows higher He-production rates than HCPB (+15% on the baffle region, +25/30% on the straight leg). A more intense level on the external edges than the innermost side (around +30% on the baffle region, +50/60% on the straight leg) is observed both for WCLL and HCPB cases.
The total nuclear power deposited in the 48 DEMO divertor cassettes components (PFCs, CB + liner and reflector plates), including a detailed breakdown for each PFC sub-component (W-monoblocks, Cu-interlayers, CuCrZr-pipe, Eurofer supports and cooling water) is shown in
Table 10, for both the blanket options under analysis. The total amounts to 174.8 MW with WCLL blanket and 148.6 MW with HCPB one (+18% using a water cooled blanket). In both cases, around 85% of the power is distributed in the structure of CB, liner and reflector plates and the remaining 15% inside the PFCs. This 15% is in turn evenly split between inboard and outboard targets (around 7% and 8%, respectively), of which 5% is the contribution of the W-monoblocks, and the rest is attributed to the other components. On average there is +15% with the WCLL compared to the HCPB blanket, for every divertor component, as already observed with the nuclear load’s maps and poloidal profiles (especially nuclear heating density and radiation damage).


 ,
, 


