Abstract
This paper presents experimental and numerical studies of the vertical stress distribution beneath the centerline of circular footings resting on sand. Vertical stress values due to circular load in medium-dense sand were measured using soil stress transducers. Reduced-scale laboratory model tests were carried out in a square-shaped test box, and vertical stresses were measured at the centerline of the circular footing at different depths of the sand. In order to determine the effect of footing width on vertical stress distribution, laboratory experiments were performed on circular footings of different diameters. In addition, a series of finite element analyses was carried out on the test model to validate the findings of the experimental study. In the numerical analysis, the sand was modeled as a non-linear elastoplastic material. The analyses were performed using the finite element method with two-dimensional axisymmetric and three-dimensional conditions. The results obtained from laboratory model tests and numerical analysis were compared with the vertical stress values obtained from the theoretical solution in the literature. Vertical stress distribution in horizontal planes at any depth from the footing base shows the same characteristic form in all methods. However, some differences were observed between experimental, numerical, and theoretical results and were discussed.
1. Introduction
The self-weight of the soil layers and the applied external loads cause stresses in the soil. Estimating the distribution and amount of these stresses in the soil is important to solve many problems in geotechnical engineering. These stresses depend on the soil properties, the intensity of the applied load, and the dimensions of the loaded area. The estimation of the stresses within a soil mass due to applied loads has concerned researchers for many years. Many approaches have been developed using the theory of elasticity to determine the stress distribution in soil. These approaches are similar, and the differences between them are the assumptions made to determine the elastic conditions of the soil.
Due to the complex structure of the soil, it is very difficult to make realistic stress–strain analyses. For this reason, analyses are usually performed with the assumption that the soil is isotropic and linearly elastic. Therefore, soil properties are defined by two parameters, elasticity modulus, E, and Poisson’s ratio, µ.
Boussinesq’s [1] equation is one of the most frequently used and practical equations, which is used to obtain the stress values in the soil due to external loads. This equation was originally developed to calculate the vertical stresses for a point load in a homogeneous, isotropic, weightless, linearly elastic half-space, and it is integrated over the footing area to calculate the stresses under a distributed load. It is often used when stresses and deformations in the soil due to loads applied from circular areas on the soil surface are applied by circular storage silos, foundations, and wheels.
Foster and Ahlvin [2] and Ahlvin and Ulery [3] carried out studies on the calculation of stress and deformations in a homogeneous and isotropic medium due to loads applied to circular areas. In these studies, simple equations required for calculations and influence diagrams and coefficient tables for use in equations are presented. For the solution of foundation engineering problems, it is very important to know the vertical stresses that occur in the soil due to external loads. The variation of vertical stresses under a uniform load applied to a circular area with respect to the radius of the loaded area and the depth from which the vertical stress value will be calculated is shown in Figure 1.
In Boussinesq’s [1] solution, vertical stress distributions are independent of the material properties. In addition, parameters such as the type of soil, density and consistency cannot be taken into account, and there is no difference between the stress distributions in soil types with different properties.
Westergaard [4] presented an equation for a vertical point load at the surface and discussed the stress functions for plane strain problems. Unlike the Boussinesq solution, the Poisson ratio of the soil medium is required as the material parameter in the Westergaard equations for stress calculations.
Although the soil medium is considered isotropic and homogeneous in the above-mentioned elastic solutions, most soils are neither isotropic nor homogeneous. Previous studies including laboratory experiments and numerical analyses on the subject have shown that the stress distribution in soils varies significantly depending on the material parameters of the soil. For that reason, it is required to find the vertical stress values experimentally and to compare these with numerical and theoretical solutions. When the previous studies on the vertical stress distribution in soils due to applied loads are examined, it is seen that not enough experimental studies have been performed.

Figure 1.
Vertical stress under a uniformly loaded circular area.
Figure 1.
Vertical stress under a uniformly loaded circular area.
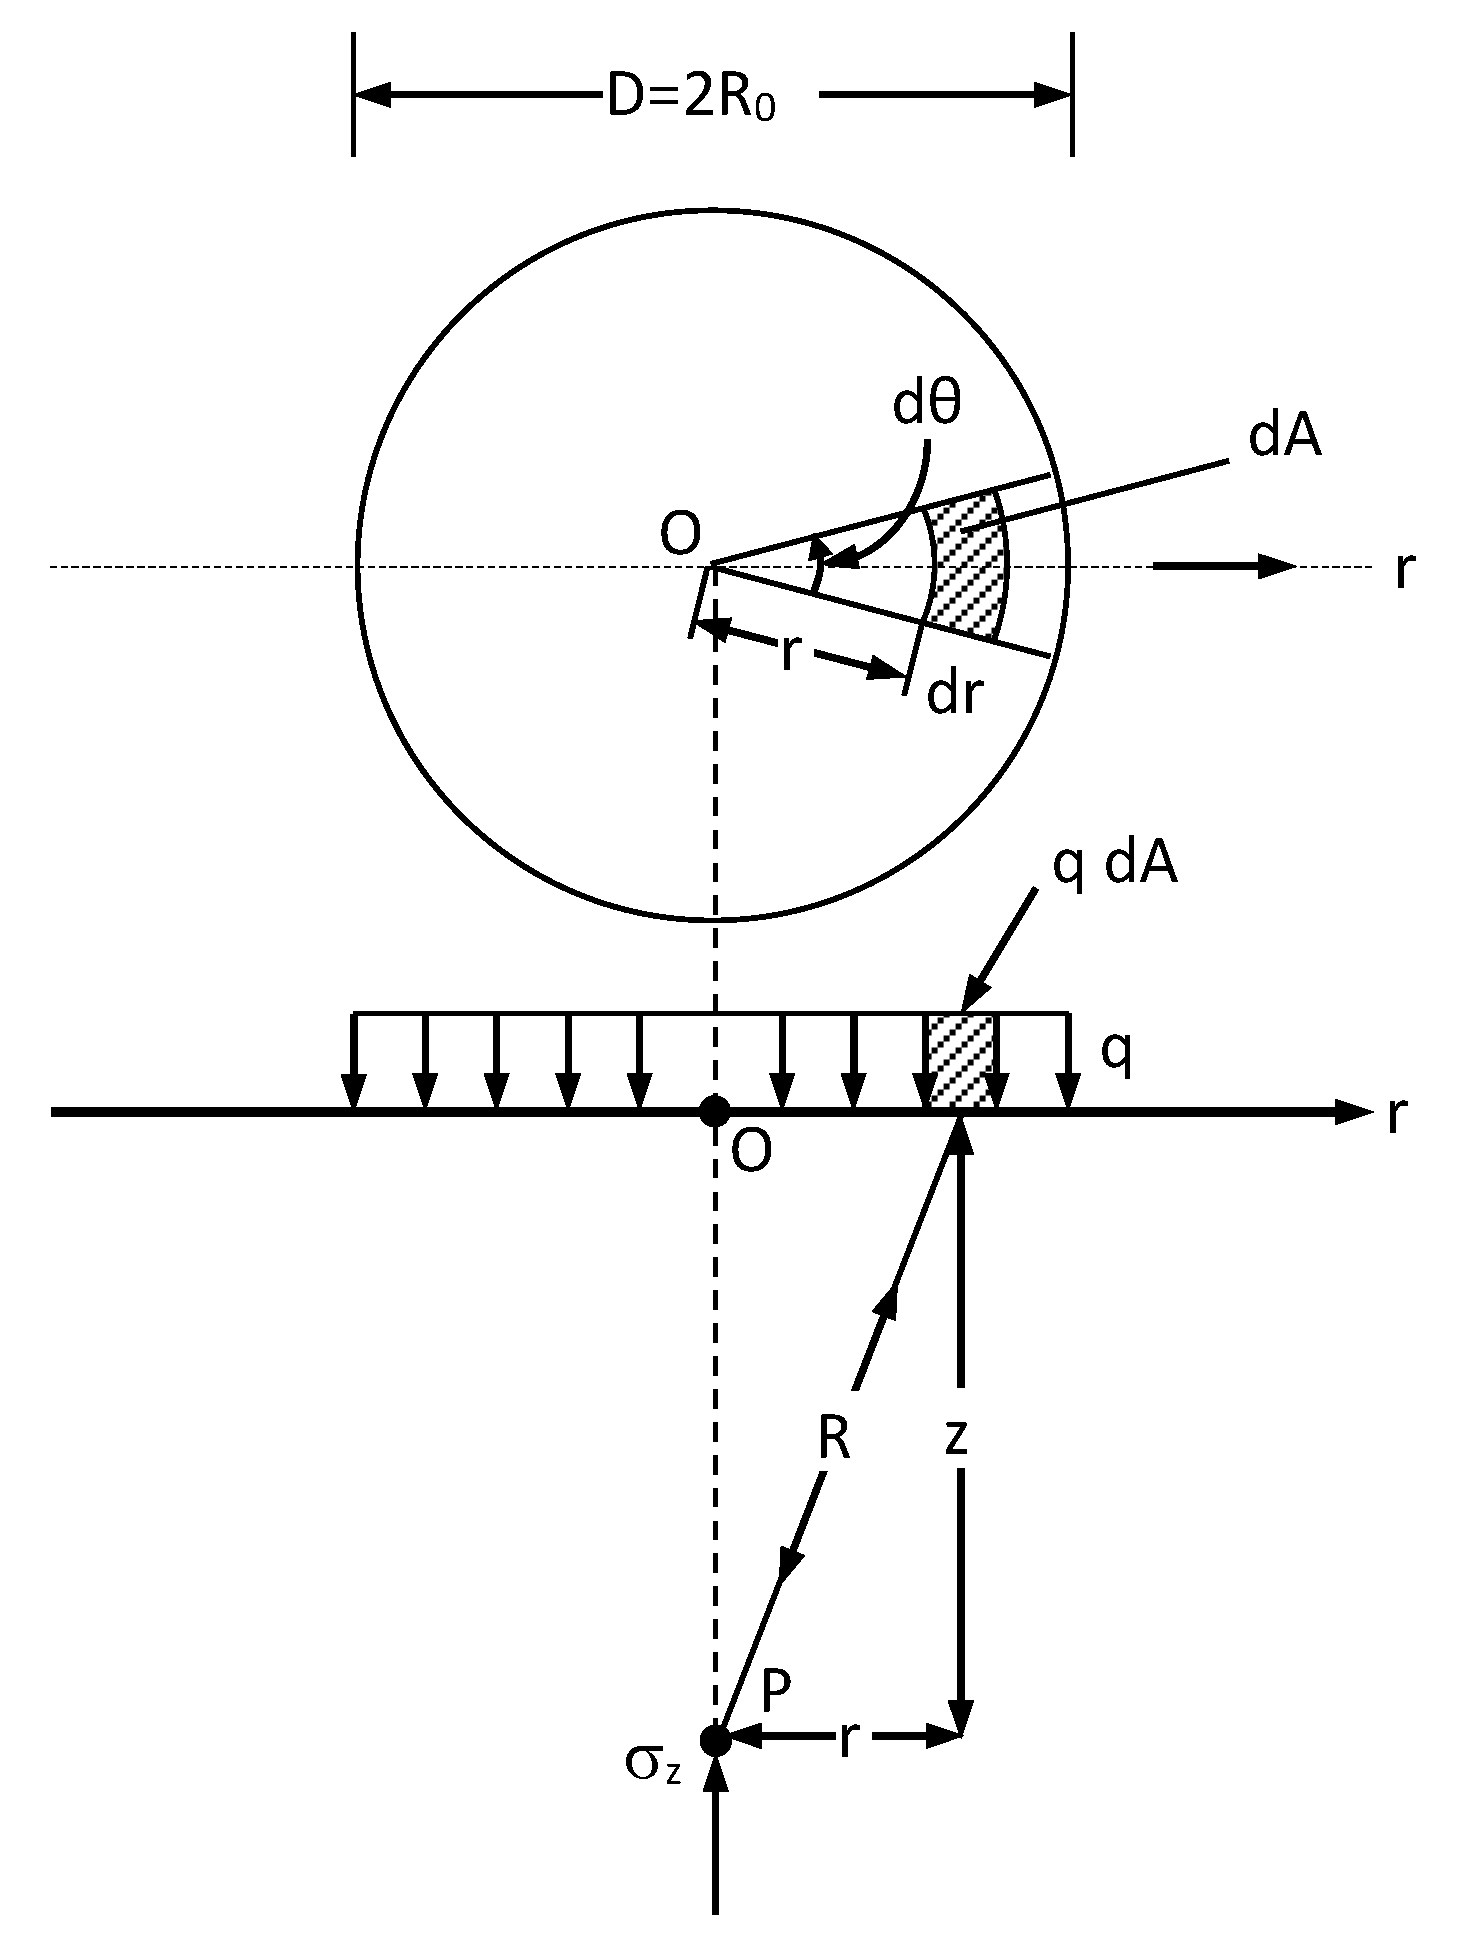
The vertical stress value at any depth of z under the centerline for a uniformly distributed load applied to a circular area is:
The study of Koegler and Scheidig [5] is considered to be one of the first experimental studies to determine the stress values in soils. In the study, laboratory model tests were carried out to obtain the stress distribution in the sand soil. For this purpose, a sand fill was loaded, and stresses at particular depths of horizontal planes were measured with instruments located at measurement depths. Koegler and Scheidig [5] compared the results obtained from the experimental study with the theoretical solutions and indicated that vertical stress distributions obtained from the experimental study beneath the loaded areas were in good agreement with the predictions from the Boussinesq equations [6].
In the experimental study carried out by Morgan and Gerard [7], vertical stresses were measured under model foundations resting on the sand, and it was observed that there was a general agreement with the stress values obtained by elastic solutions.
Burland et al. [8] examined factors such as non-homogeneity, non-linearity, and anisotropy that affect the vertical stress values and concluded that the Boussinesq solution gives a reasonably accurate vertical stress distribution under a uniformly loaded area for different soil conditions.
In the study by Balakrishna et al. [9], dimensionless equations are derived to calculate the vertical stress distribution under rigid circular foundations on sands using the elastoplastic approach. The resulting distribution was used to calculate stresses at various points using elastic theory. In the study, the obtained results are presented graphically and are compared with the distribution of Boussinesq.
Algin [10] algebraically formulated the vertical stress distribution below the origin of the linearly distributed Boussinesq loading case. In the study, the equation was evaluated to establish that the currently used equation of the uniformly loaded rectangular loading case is valid. This paper concludes that the formula that was developed is valid.
Lim [11] carried out a series of laboratory model tests to investigate Boussinesq’s theory on the vertical stress increment in the sandy soil mass caused by surface loading. The test results were compared with the theoretical values of Boussinesq. The theoretical stress values obtained by the Boussinesq method were always smaller than the test results under the footing, regardless of the depth. Outside of the footing, the values were greater than the stress measured only at the depth of the foundation width. It has been seen that the theoretical and experimental results are close to each other when the depth reaches two and three times the width of the footing. In the study, the measured vertical stress decreased as the applied load increased. These trends were confirmed to be valid for the considered range of the relative density of sand and/or width of the footing. According to the results obtained from the study, it has been seen that if the Boussinesq theory is used, more accurate values can be obtained by correcting the theoretical values using these results.
Keskin et al. [12] carried out an experimental investigation and compared the results with the numerical and theoretical results. They indicated that vertical stress distributions beneath the uniformly loaded rectangular area show the same characteristics in all methods.
By using Boussinesq displacement potential functions, Onah et al. [13] determined the vertical stress distribution and vertical displacements under the influence of a uniformly distributed load on a rectangular area, assuming that the soil medium is homogeneous, elastic, and semi-infinite. The results show that the strain–displacement relations for small displacement assumptions and Hooke’s generalized stress–strain laws for linear elastic, isotropic, homogeneous bodies are applied simultaneously to derive the vertical fields from the displacement fields.
Cicek et al. [14] carried out a study to obtain the vertical stress values beneath the center of continuous foundations resting on geotextile-reinforced soil. At the end of the study, it was observed that when the reinforcement is placed in the soil, the vertical stress values that occurred beneath the centerline of the footing decrease and there is a general agreement between the experimental results and the finite element analysis results at certain depths. However, they found that the vertical stress values obtained experimentally and numerically are different from the vertical stress values obtained theoretically.
Ateş and Şadoğlu [15] carried out an experimental study to measure the vertical stress increases in the soil due to the applied vertical surface loads. In the study, various tests were carried out with a model strip foundation under plane strain conditions in a reinforced cohesionless soil. They concluded that the relative density of sand is an effective parameter for the stress distribution in soils. However, methods based on the theory of elasticity give very inaccurate results in low relative density reinforced soils.
Gebremariam et al. [16] investigated the variation in vertical stresses under geosynthetic reinforced walls in a case study. The stress values measured in the field were compared with the theoretically predicted vertical stress values. In the comparison, Boussinesq and approximate 2V:1H methods were used as theoretical methods. As a result of the comparison, it was seen that the stress values obtained by using the 2V:1H method were more conservative for the design, but the stress values obtained by using the Boussinesq method were closer to the experimental stress values measured in the field.
Giwangkara et al. [17], in their study, investigated the vertical stress distribution under static loads using laboratory model experiments when natural crushed aggregate (NCA) and recycled concrete aggregate (RCA) materials are used as road base material. They stated that the vertical stress values obtained by laboratory model tests are different from the vertical stress values obtained theoretically using Boussinesq’s equations, and the material properties change the stress distribution behavior.
Frazee [18] considered the Boussinesq formula used in the determination of vertical stresses. In the study, new closed solutions are presented in the form of cartesian coordinate functions for different load cases.
Lu et al. [19] discussed the difficulties of using the Boussinesq method when bedrock is located under a compressible soil layer. In their study, an analytic method has been proposed to solve the plane strain problem under the influence of strip footings. The effects of soil layer thickness on vertical stress and displacements are discussed, and the obtained results are compared with the numerical analysis results.
In the study by Useche-Infane et al. [20], the results of a series of loading tests on a footing model resting on a sandy soil are presented. In the study, the vertical stress values in the soil under the applied loads were measured with a circular footing model. Sand was placed in a circular tank with a diameter of 60 cm and a height of 45 cm, and diaphragm load cells were used to measure the vertical stresses. In the measurements, the aim was to determine the effect of relative density on the vertical distribution of stresses in the sand. The stresses measured with the load cells were compared with the stress values estimated by the Boussinesq’s method, and the results were validated using a finite element model. According to the results obtained from the study, it has been seen that the vertical stress values obtained by the Boussinesq’s method are in an acceptable approximation to the stresses measured with the load cells.
A study was carried out by Singhai and Vikash [21] on the effect of elastic modulus on vertical stress distribution due to strip loading in elastic half-space. At the end of the study, it was shown that the elastic modulus of the soil has a significant effect on the vertical stress distribution and settlements.
The purpose of this paper is to present the results of experimental, theoretical, and numerical studies to determine the vertical stress distribution beneath the circular footings used, especially in silo-type structures. In previous studies, the parameters were not investigated sufficiently, and therefore, they should be investigated, determined and examined experimentally and numerically. In the experimental study, reduced-scale laboratory tests were conducted, pressure transducers were used to determine the vertical stress values occurring in the sand due to the circular load applied to the surface, and stress measurements were carried out at certain depths. The effect of the footing size, which cannot be taken into account in the theoretical formula, on the vertical stresses has been examined. While the same vertical stress values were obtained for the same depth/footing diameter ratios in the theoretical formula, this matter was examined experimentally, and the effect of footing diameter was revealed. In numerical analysis, the circular footing, which is generally modeled as two-dimensional axial symmetry, is modeled with three-dimensional conditions, and the difference is examined. In addition, the aim is to analyze the effect on vertical stress values by modeling different material models and boundary conditions. In the analysis, the soil was modeled as a non-linear elastoplastic material using the Drucker–Prager model available in the ANSYS [22] program, in two-dimensional axisymmetric and three-dimensional conditions. In addition, the hardening soil model available in the PLAXIS [23] program was used to investigate the effect of the material model on the vertical stresses in sand due to applied circular load. The results obtained from the experimental study and numerical analyses were compared with Boussinesq’s results.
2. Experimental Investigation
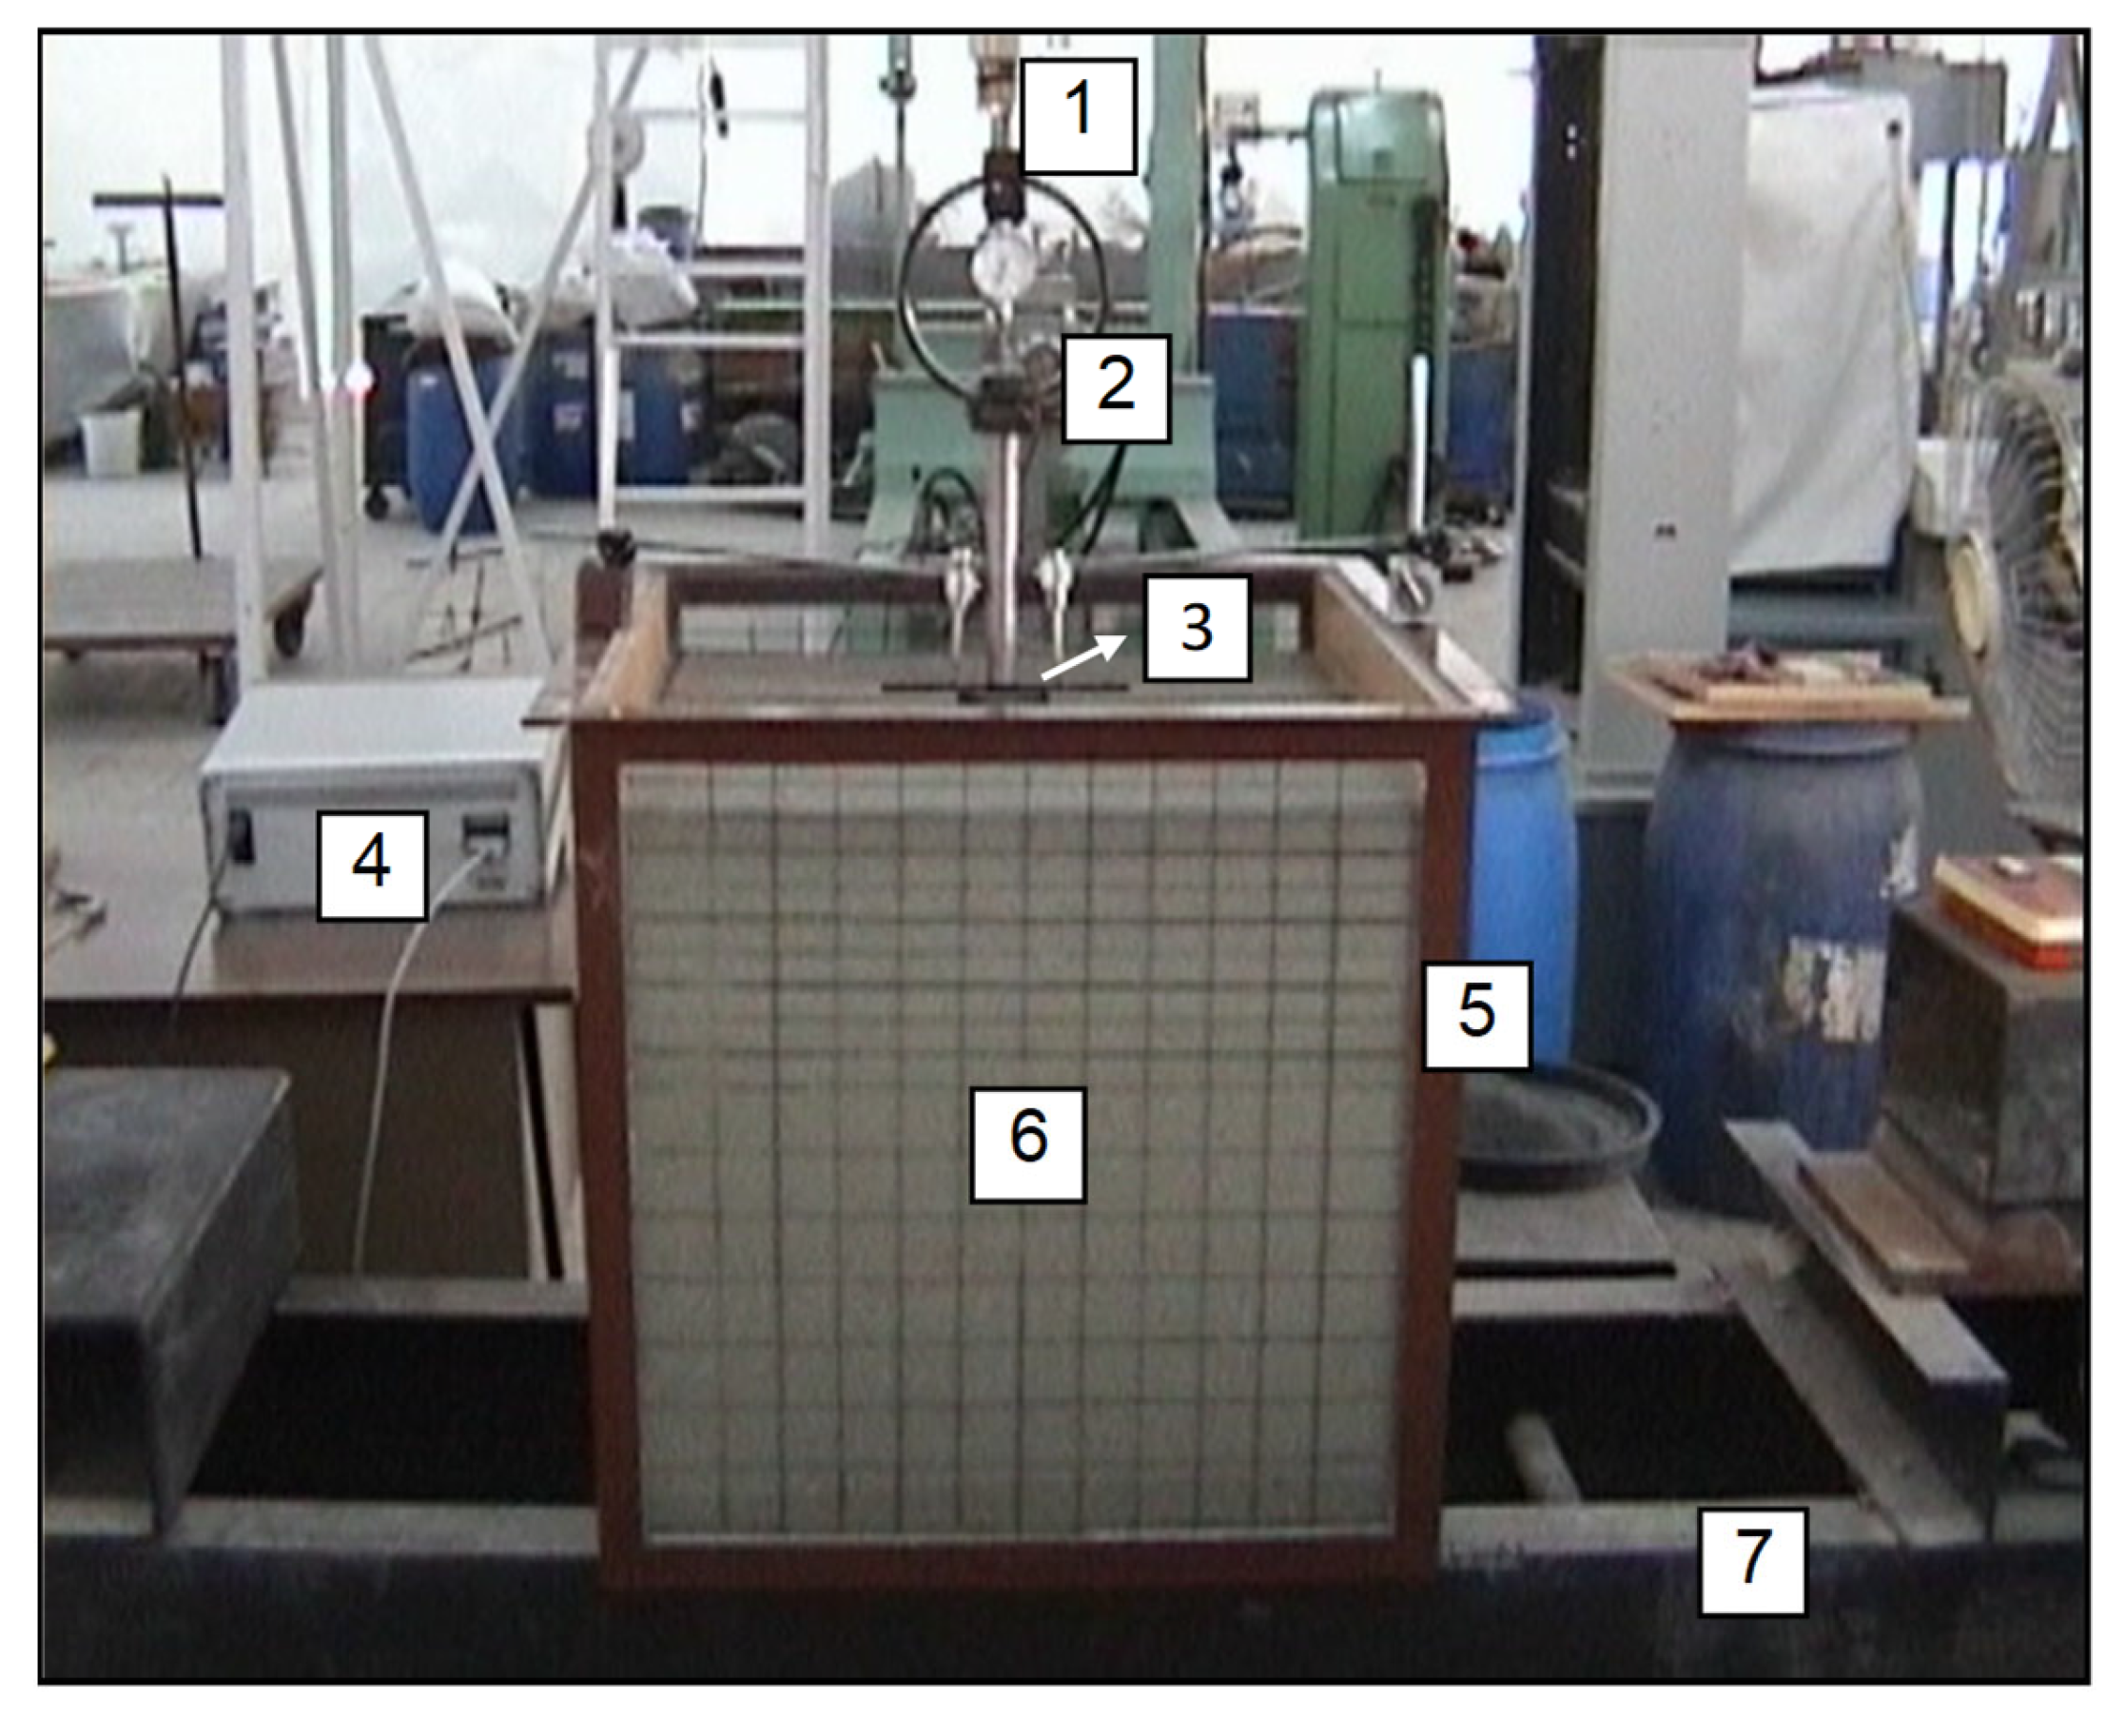
Model tests carried out within the scope of this study were conducted using the experimental setup designed in the Geotechnical Laboratory of Cukurova University Civil Engineering Department. The facility is shown in Figure 2. Vertical stress measurements at certain depths beneath the centerline of the circular footing were carried out in a reduced-scale, square-shaped test tank with a plan length of 0.7 m, a width of 0.7 m and a height of 0.7 m. In order to prevent lateral movements that may occur during the placement of the sand in the test box and the static loading of the circular footing, the bottom and vertical edges of the test box were stiffened by using angled sections. The front and back surfaces of the test box consist of 8 mm thick glass plate, and the side surfaces consist of 20 mm thick wooden plate. The inner walls of the tank have been smoothed to minimize the friction that may occur on the side surfaces.
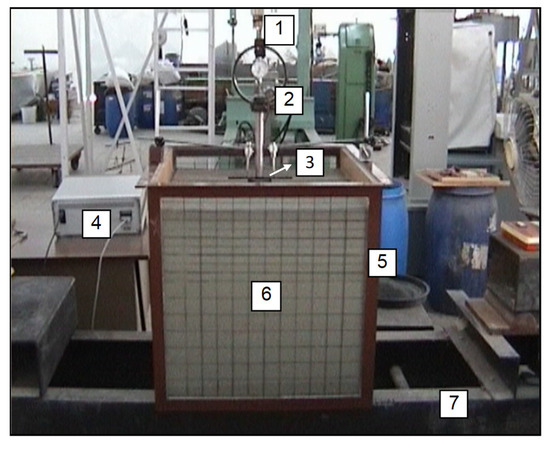
Figure 2.
Test set-up: (1) mechanical jack; (2) proving ring; (3) model plate; (4) datalogger; (5) steel profile; (6) sand bed; (7) reaction beam.
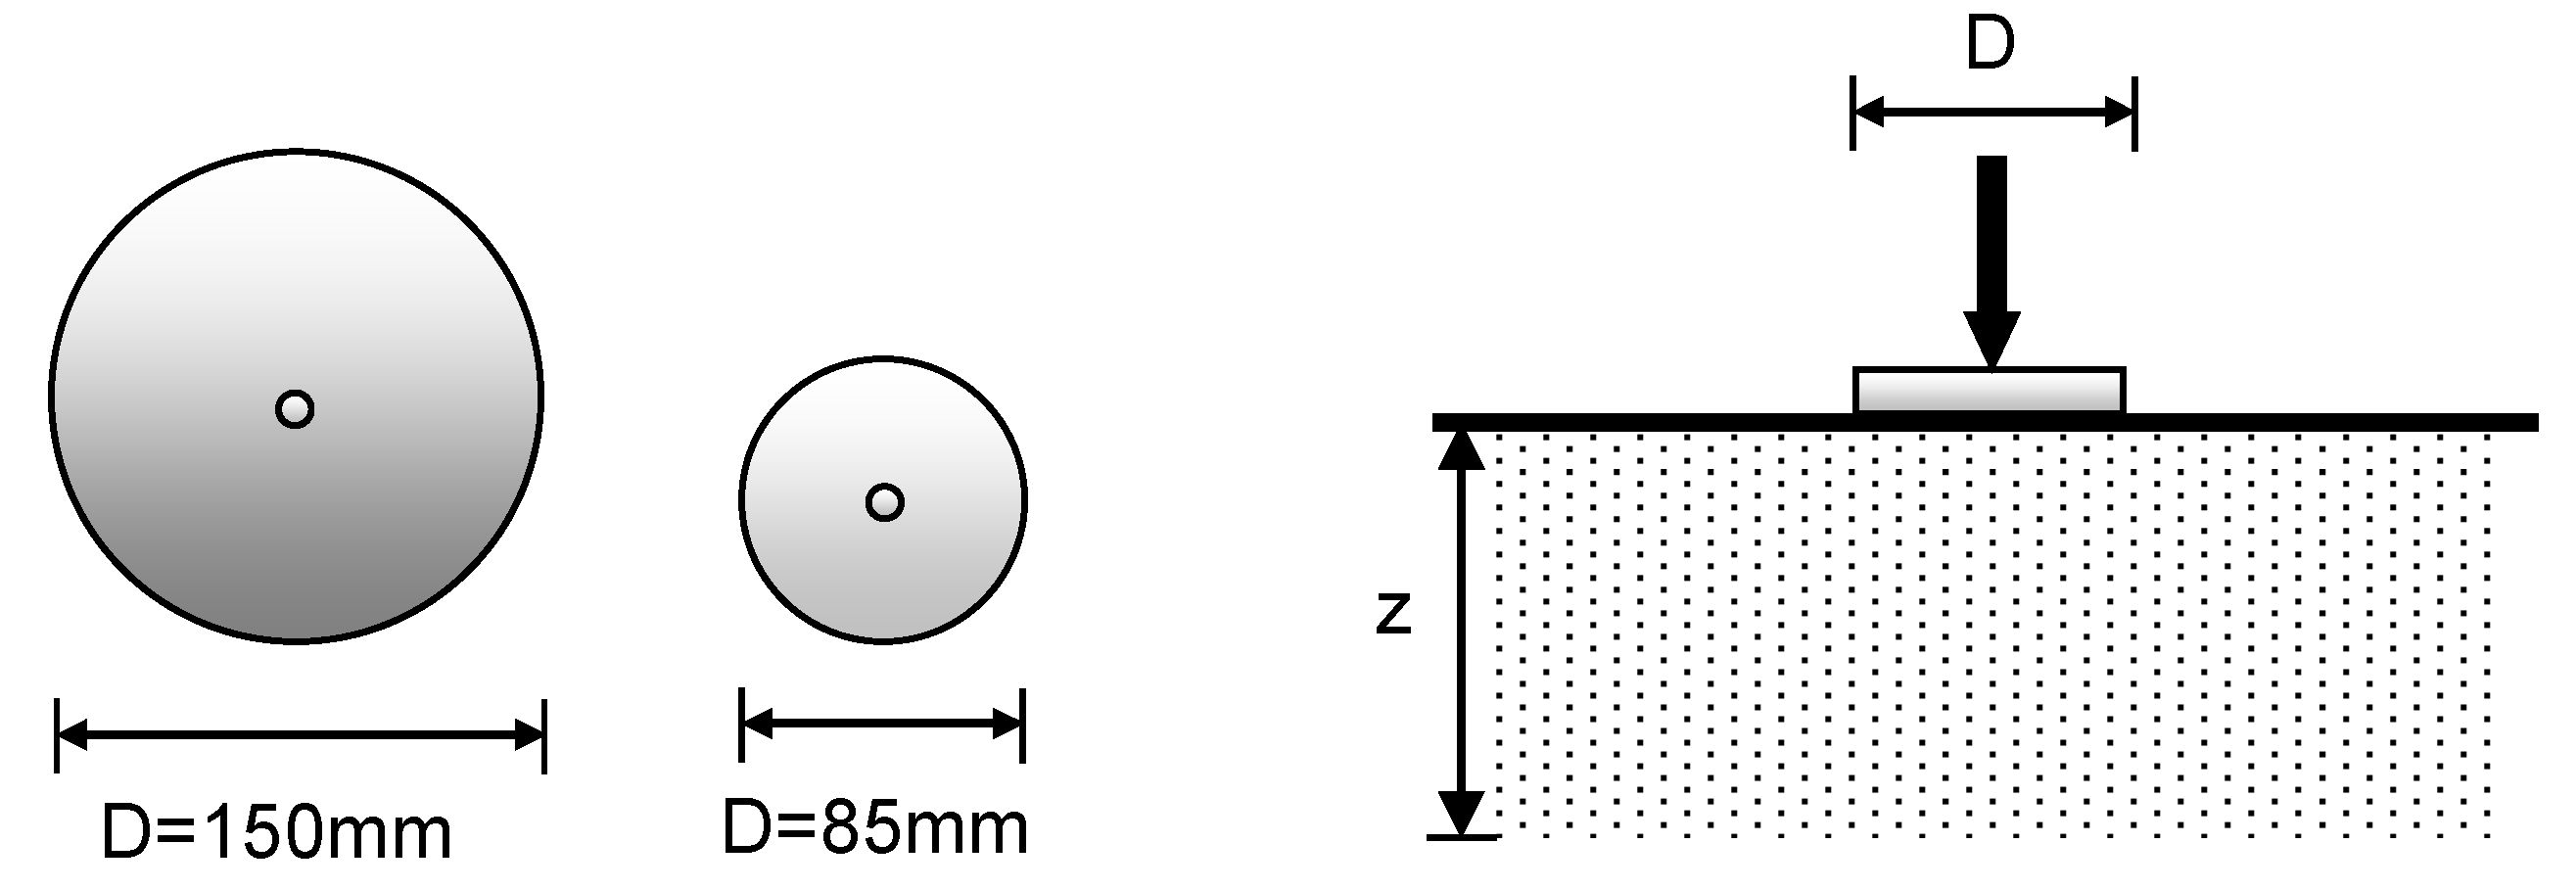
Static vertical loads were applied to the model circular footing resting on the sand, with a mechanical jack attached to a loading beam mounted on the test box. Static load values applied to the circular model footing were measured using a comparator and a load ring placed between the jack and the model footing. In the tests, model footings were loaded with a loading rate of 1 mm/min. Loading tests were carried out on circular rigid model footings made of steel material. The diameters of the model footings were 85 and 150 mm, and the thickness was 20 mm (Figure 3).
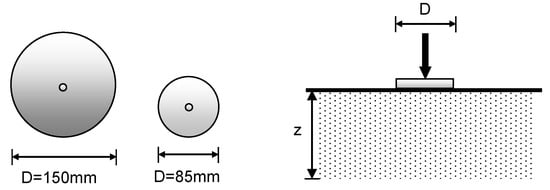
Figure 3.
Model footings and geometric parameters of model test.
The loads were transferred to the circular model footing by means of a bearing ball. This produces a hinge, which allows the footing to rotate freely as it approaches failure and eliminates any potential moment transfer from the loading system.
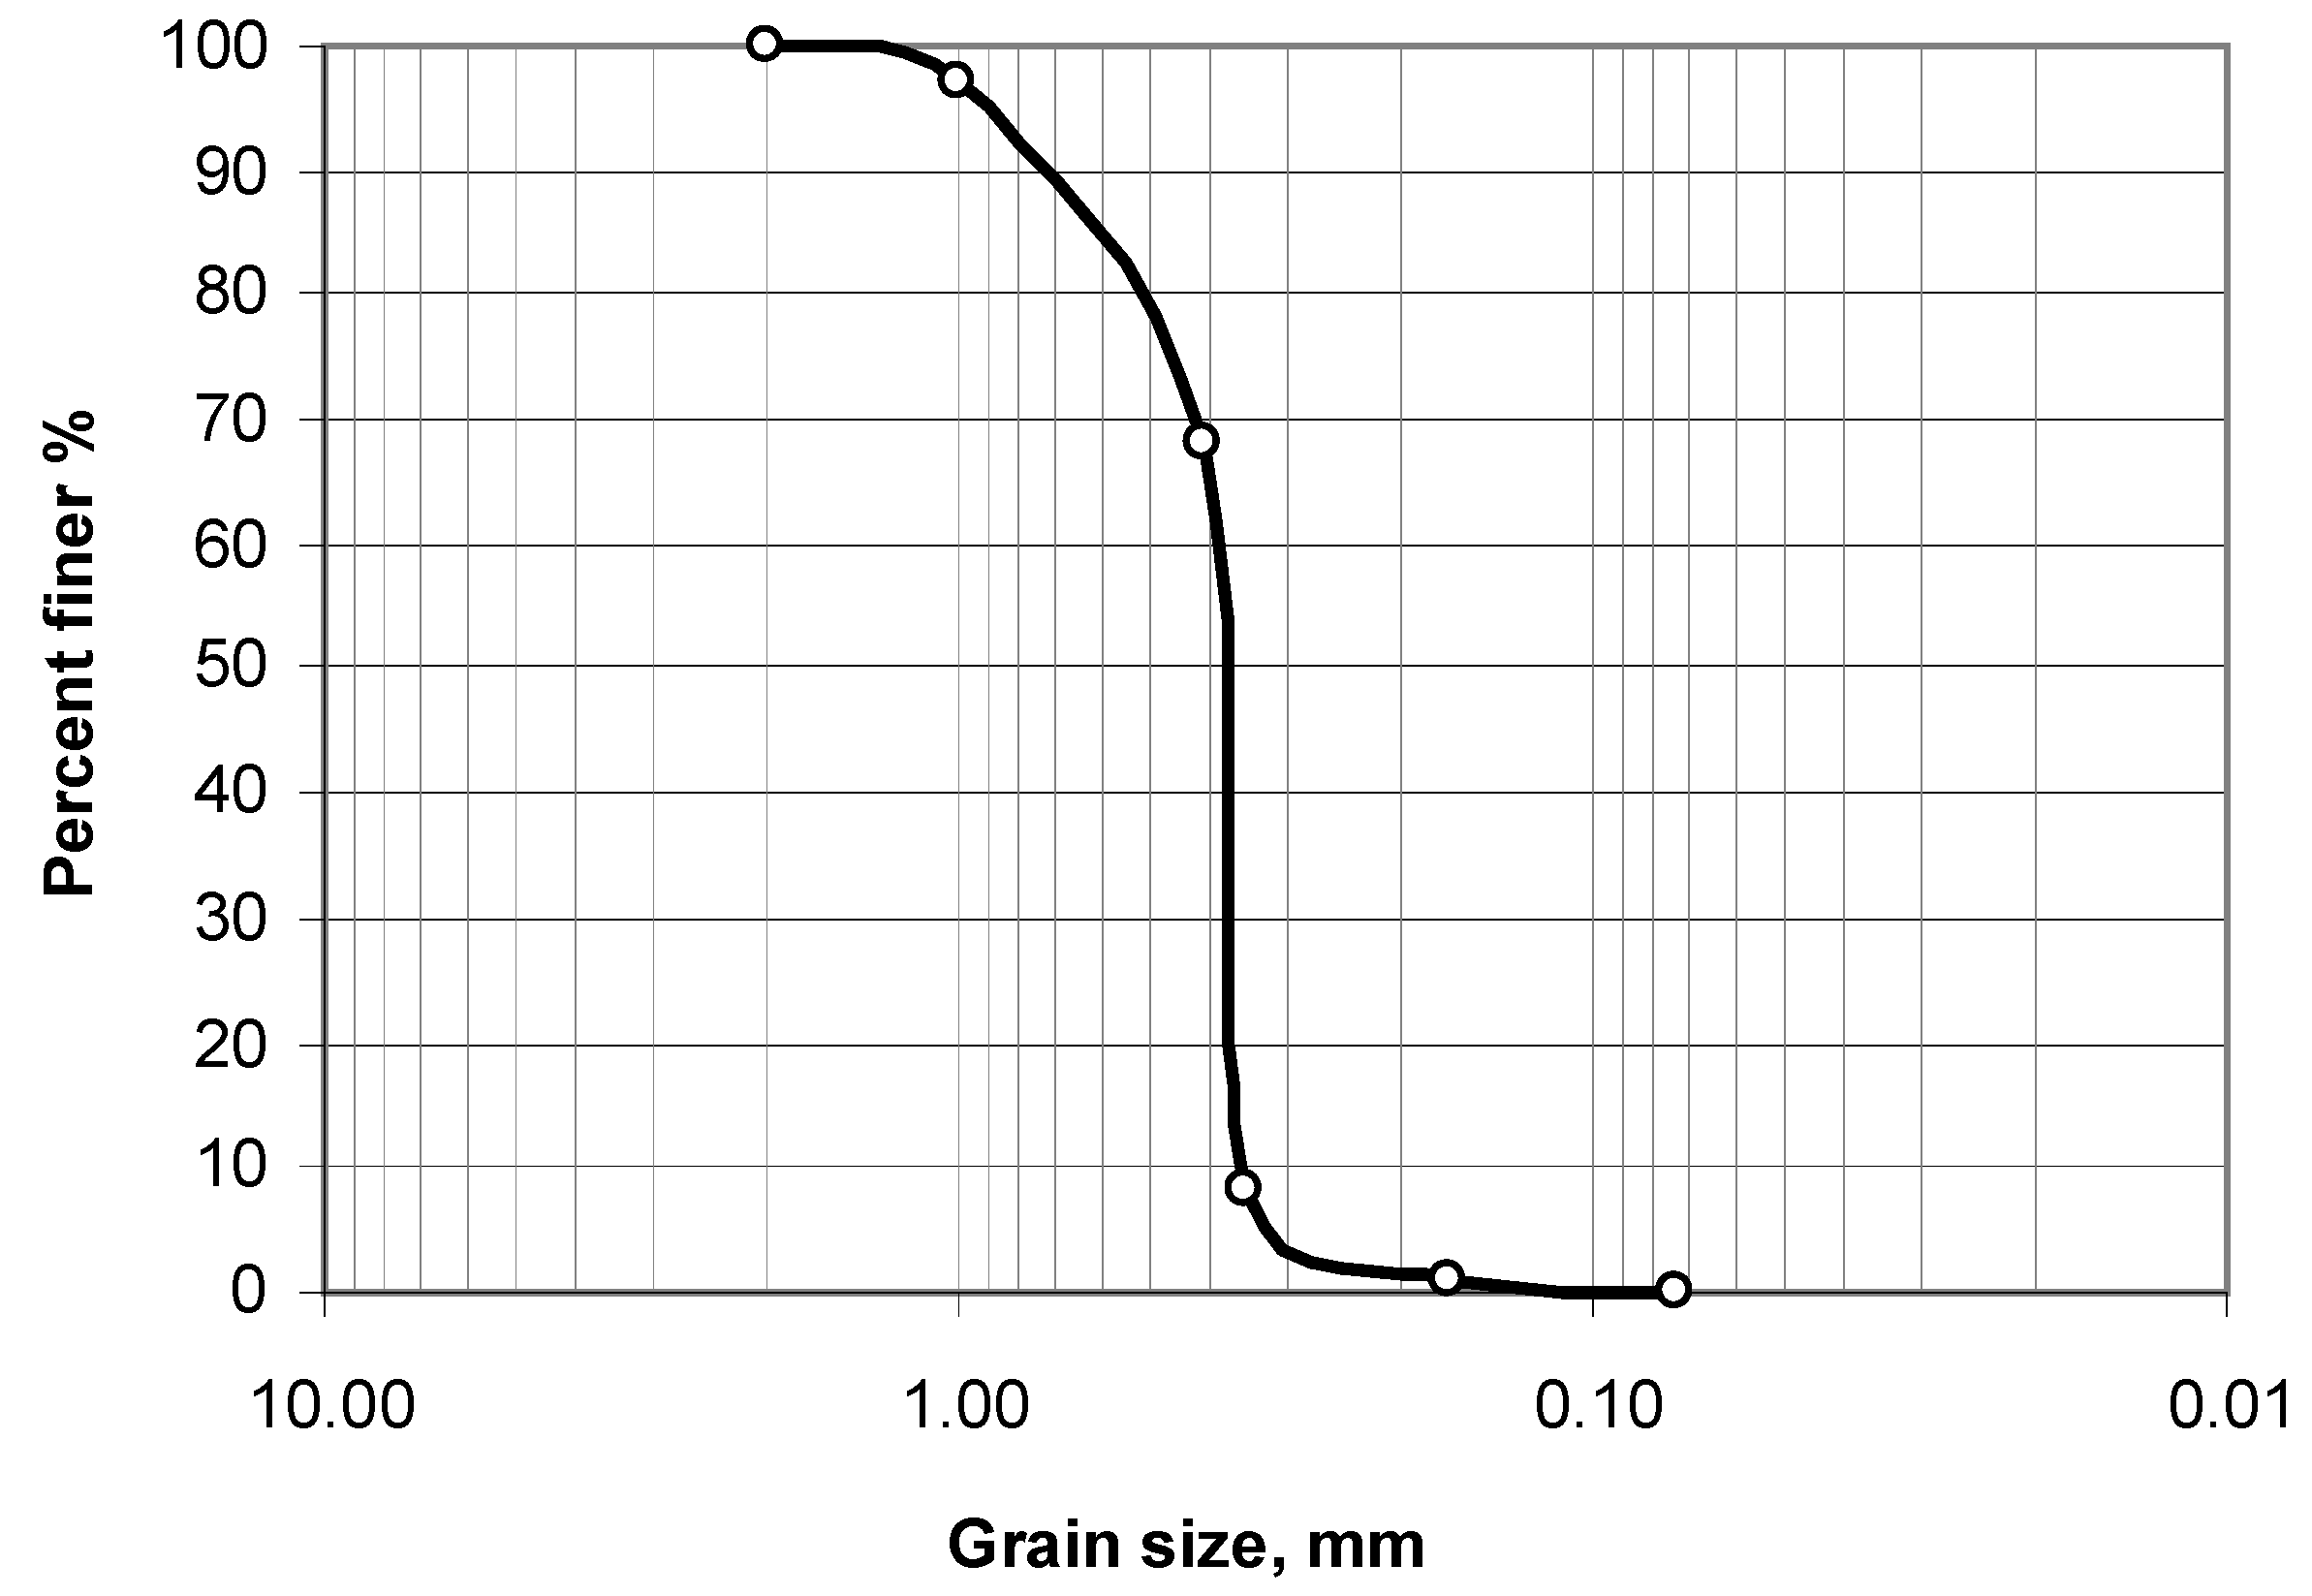
In the experimental study, uniform, clean and fine sand taken from the Seyhan riverbed was used as soil. After the sand material was subjected to pre-washing and sieving processes, it was dried in air, and a sieve analysis test was carried out to determine the particle size distribution in accordance with ASTM D422-63 [24]. It is shown in Figure 4. The classification of the sand material was determined as poorly graded sand (SP) according to the Unified Soil Classification System (USCS). In Table 1, the general physical properties of the sand used in the experiments are summarized.
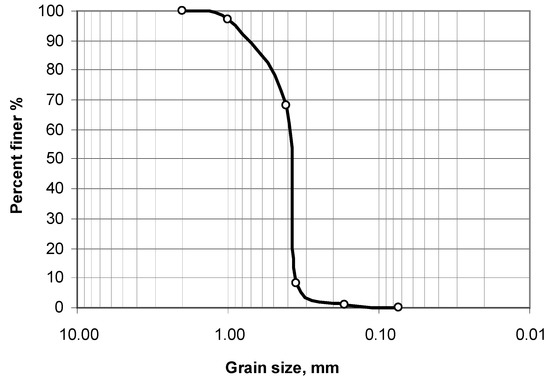
Figure 4.
Grain size distribution of the sand.

Table 1.
Properties of sand bed.
Sand material was placed in the test box in 25 mm thick layers up to the base level of the model footing. Each layer of sand was compacted to a predetermined depth by an electrically operated vibration device. In order to obtain uniform density during compaction and to prevent crushing of sand grains, a 13 × 13 cm sized and 2.0 cm thick plastic plate was mounted on the tip of the vibration compactor. The glass and wooden sides of the test box were scaled for convenience during the placement of the sand. After compacting each layer of sand, the next lift height was checked using scaled lines on the glass and wood plates of the test box. After the compaction process was completed and the sand bed was prepared, the areas beneath the circular model footing were leveled carefully. The leveling process was carried out in order to ensure full contact of the model footing with the sand and the applied load on the model footing to act vertically [25].
Care was taken to apply the same compression force to each sand layer during the compaction of the sand in the test box to have a uniform density. In the control tests performed on the compacted sand layers, it was determined that the difference between the densities was less than 1%. With the sand compaction technique applied in the experimental study, a uniform relative density of approximately 65% with a unit weight of 17.1 kN/m3 was achieved.
In order to determine the shear strength properties of the sand, which was compacted by layers in the test box, direct shear and consolidated-drained triaxial compression tests were carried out on the samples in accordance with ASTM D3080 [26]. The estimated internal friction angle was determined to be 41° at the same relative density used in the tests.
To measure the vertical stresses in sand due to the applied circular load, a 100 kPa capacity soil stress transducer was placed in predetermined locations beneath the center of the model footing before the sand bed preparation. The transducer calibrated in the sand before testing was connected to a data logger to measure the stresses. Vertical stresses beneath the center of each footing were measured at three various depths (1.0 D, 1.5 D, 2.0 D; D = diameter of footing). For each test, load-stress readings were taken using a measuring system.
3. Finite Element Analysis
The analysis of the vertical stress values beneath the centerline of the circular footings resting on the sand bed was carried out using the commercially available computer program ANSYS (version 10), which solves with the finite element method. ANSYS is a finite element modeling package program developed to analyze various engineering problems numerically. The ANSYS program allows for effective studies in different disciplines such as mechanics, linear or non-linear static, and dynamic structural analysis.
Within the scope of this study, two- and three-dimensional finite element analyses were carried out in order to support the results of the experimental study and to determine the vertical stress distribution in the sand bed subjected to load transferred from circular footing.
Two different models were used for the analyses: the 2D axisymmetric model (2DM) and the 3D model (3DM) with the same dimensions as the model tests setup used in the experimental study. In the numerical study, the aim was to analyze the effects of 2D and 3D conditions on vertical stress values by analyzing the test setup with 2D axial symmetry and 3D modeling. By using the axisymmetric model in analysis, modeling and analysis time can be greatly reduced compared to an equivalent 3DM.
There are material models such as Mohr–Coulomb, Von Mises, and Drucker–Prager for modeling the soil material numerically. These include the elastic and plastic model parameters such as E (elasticity modulus), µ (Poisson’s ratio), cohesion c, internal friction angle Ø, and dilatation angle, ψ. Among the mentioned methods, the Drucker–Prager criterion is frequently used in numerical analysis as one of the most suitable in terms of numerical efficiency. In this study, the Drucker–Prager elastoplastic criteria has been used to model sand behavior.
The Drucker–Prager material model in the ANSYS program, the required parameters of elasticity modulus, Poisson’s ratio, and shear strength of the sand were obtained by laboratory experiments performed on the samples taken from the sand in accordance with ASTM D7181-20 [27], and they are presented in Table 2.
Table 2.
Parameters of DP model.
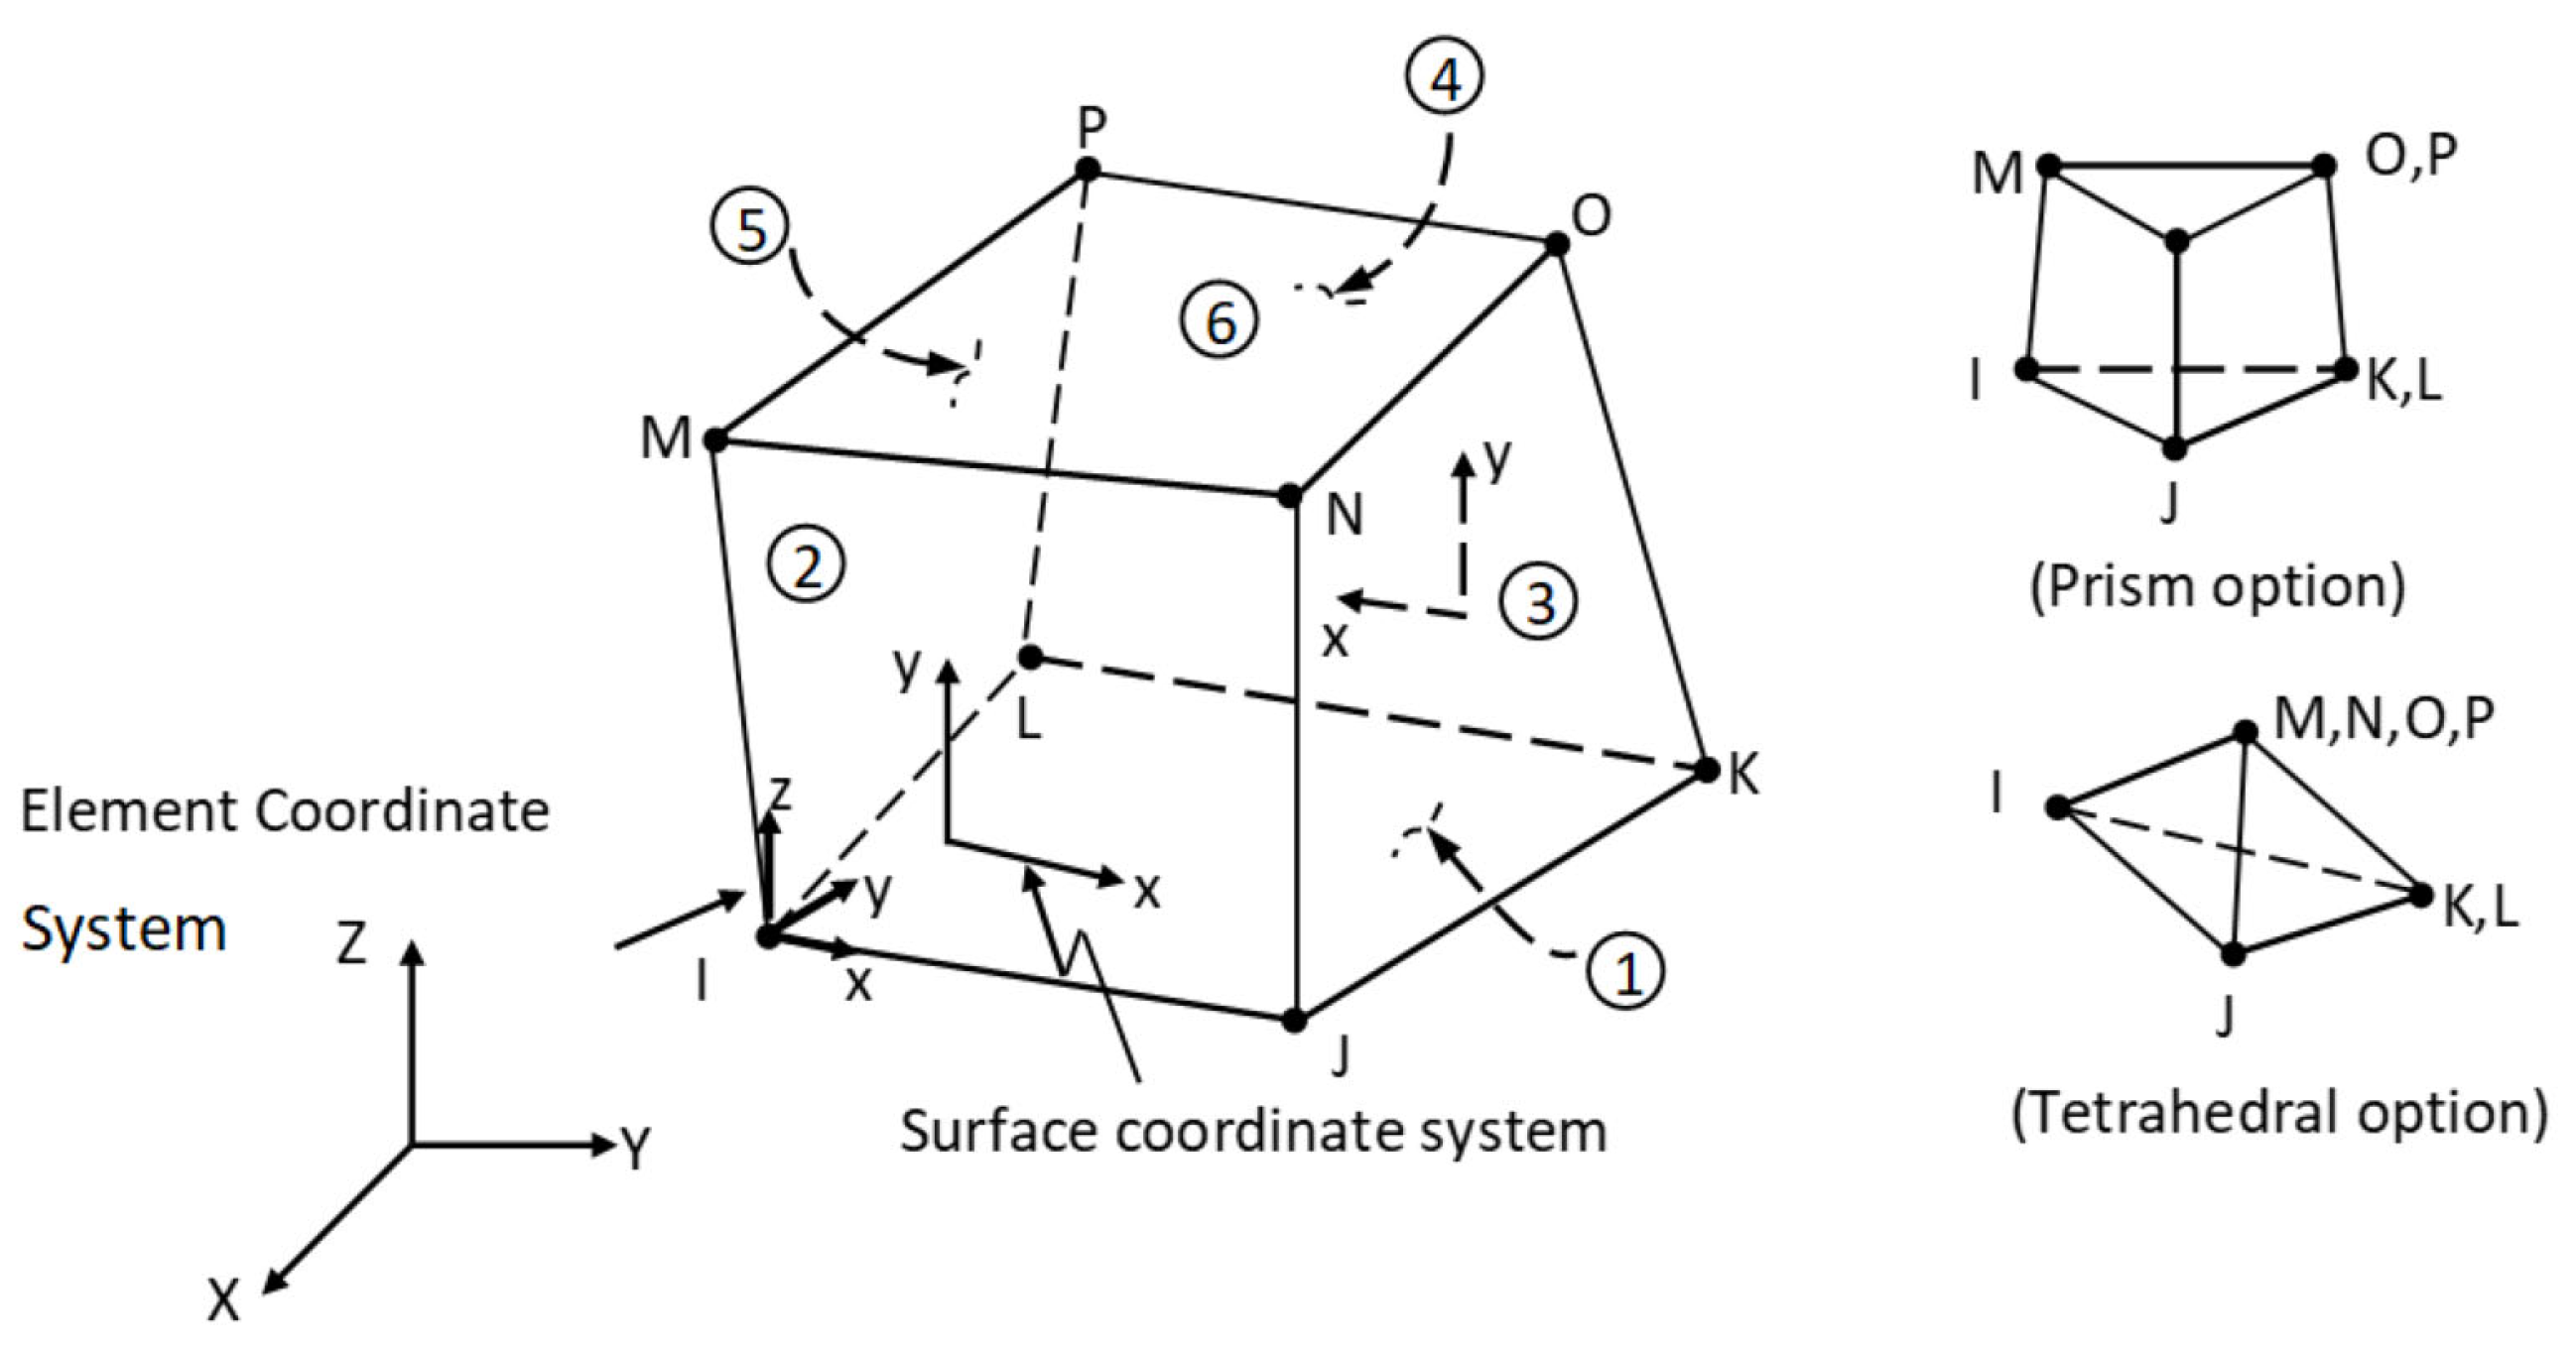
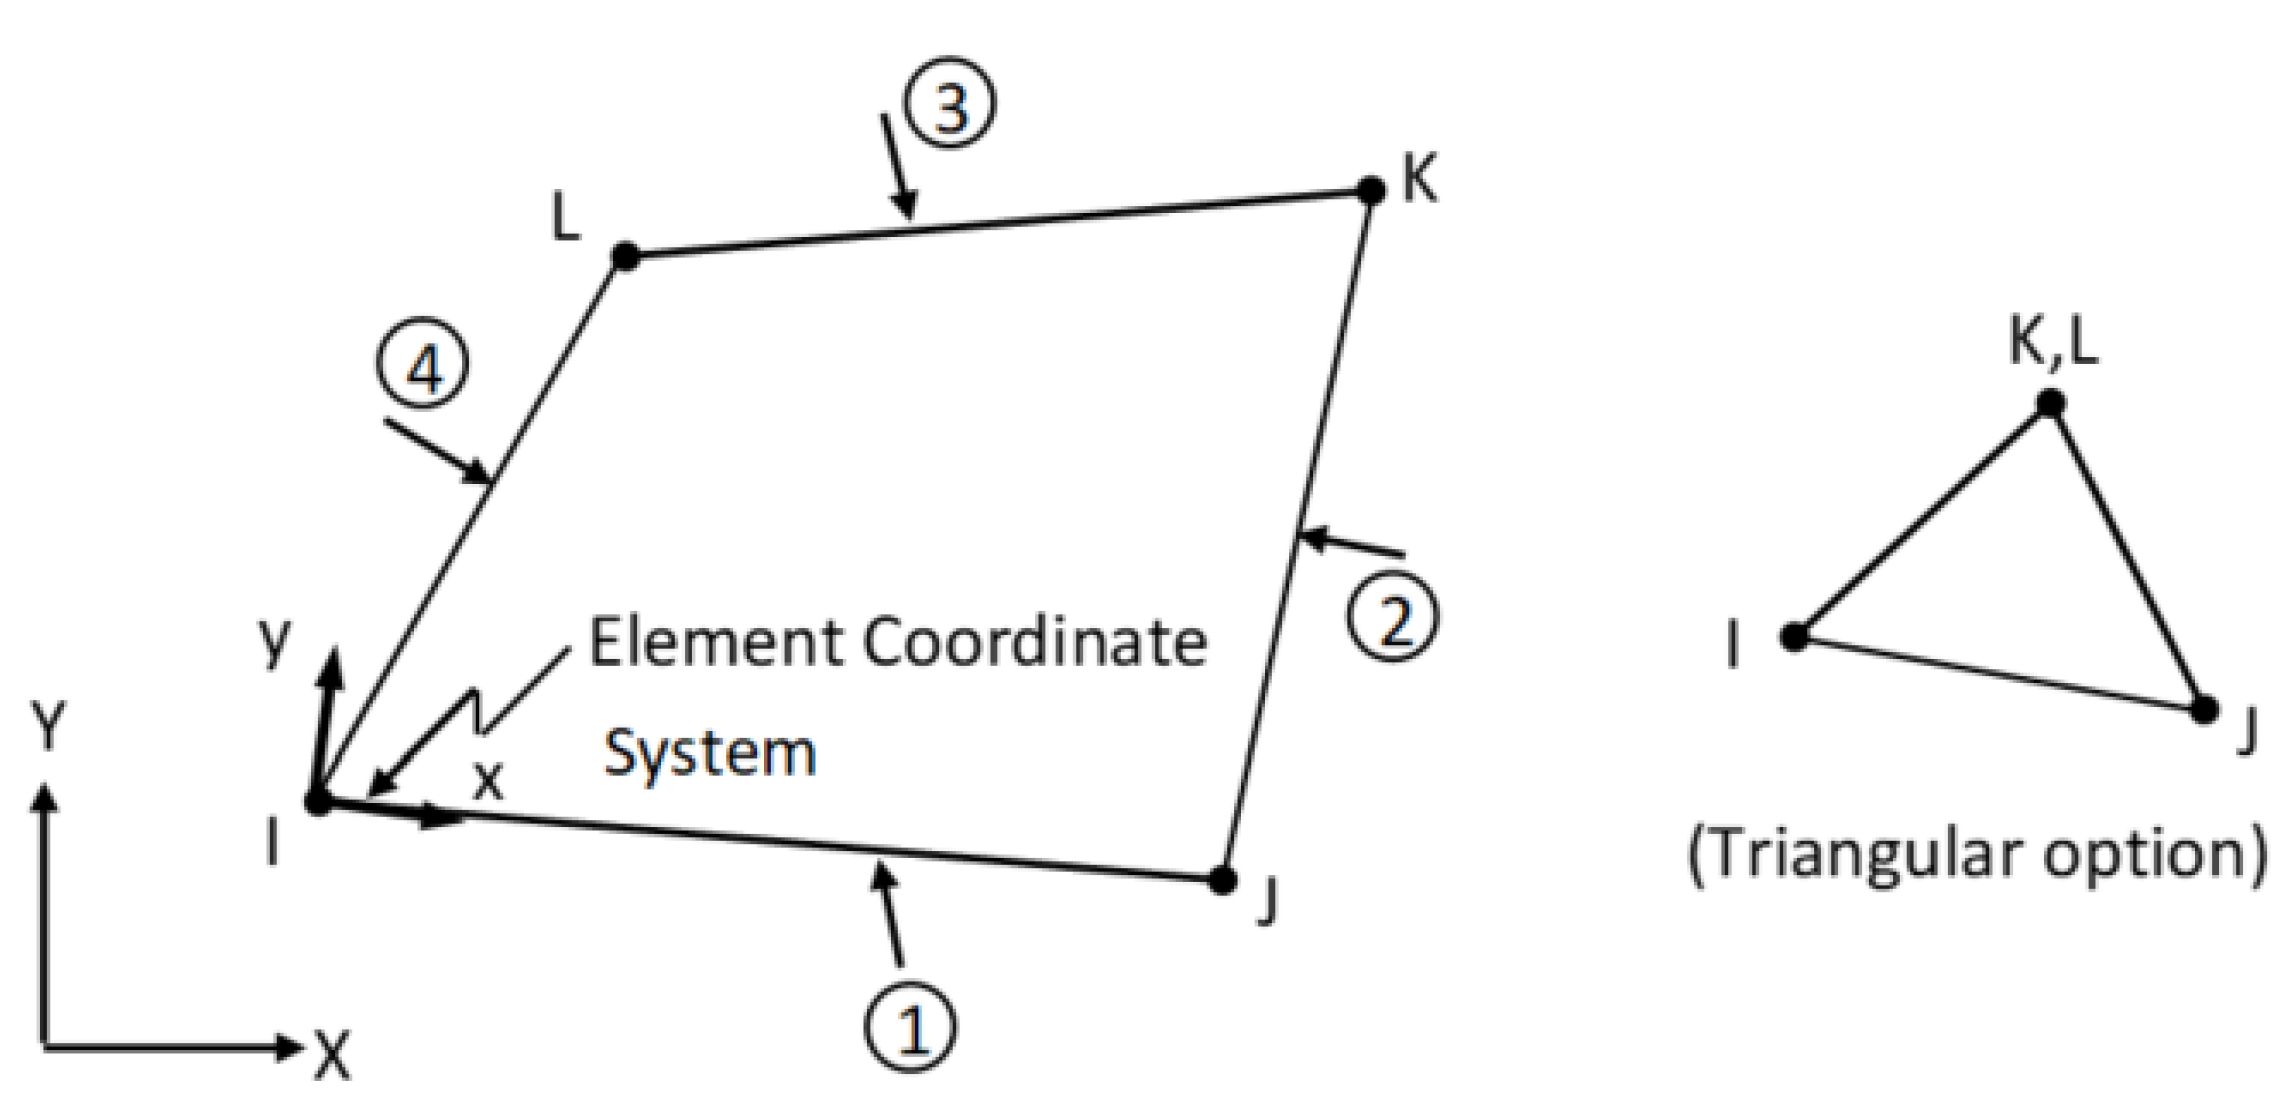
In the analyses, SOLID45 element type was used for the three-dimensional modeling of the soil-footing system (Figure 5). SOLID45 element type is defined by eight nodes with three degrees of freedom in the x, y, and z directions at each node. The element has plasticity, creep, swelling, stress stiffening, large deflection, and large strain capabilities.
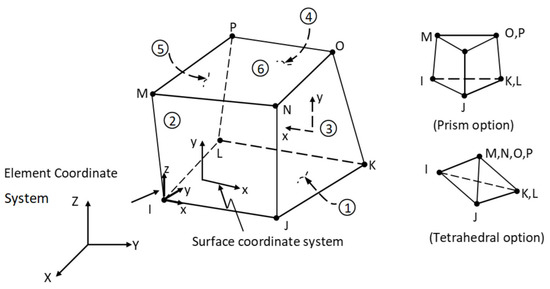
Figure 5.
SOLID45 geometry.
PLANE42 element type is used to model the soil-footing system in 2D modeling (Figure 6). The element is suitable for two-dimensional modeling, axial–symmetrical and plane–strain conditions. PLANE42 element type is defined by four nodes having two degrees of freedom in the nodal x and y directions at each node. The PLANE42 element type, similar to the SOLID45 element type, has the capabilities of plasticity, creep, swelling, stress hardening, large deflection, and large strain.
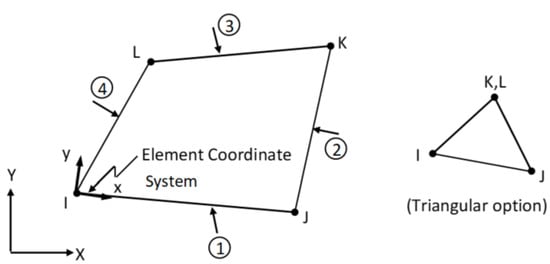
Figure 6.
PLANE42 geometry.
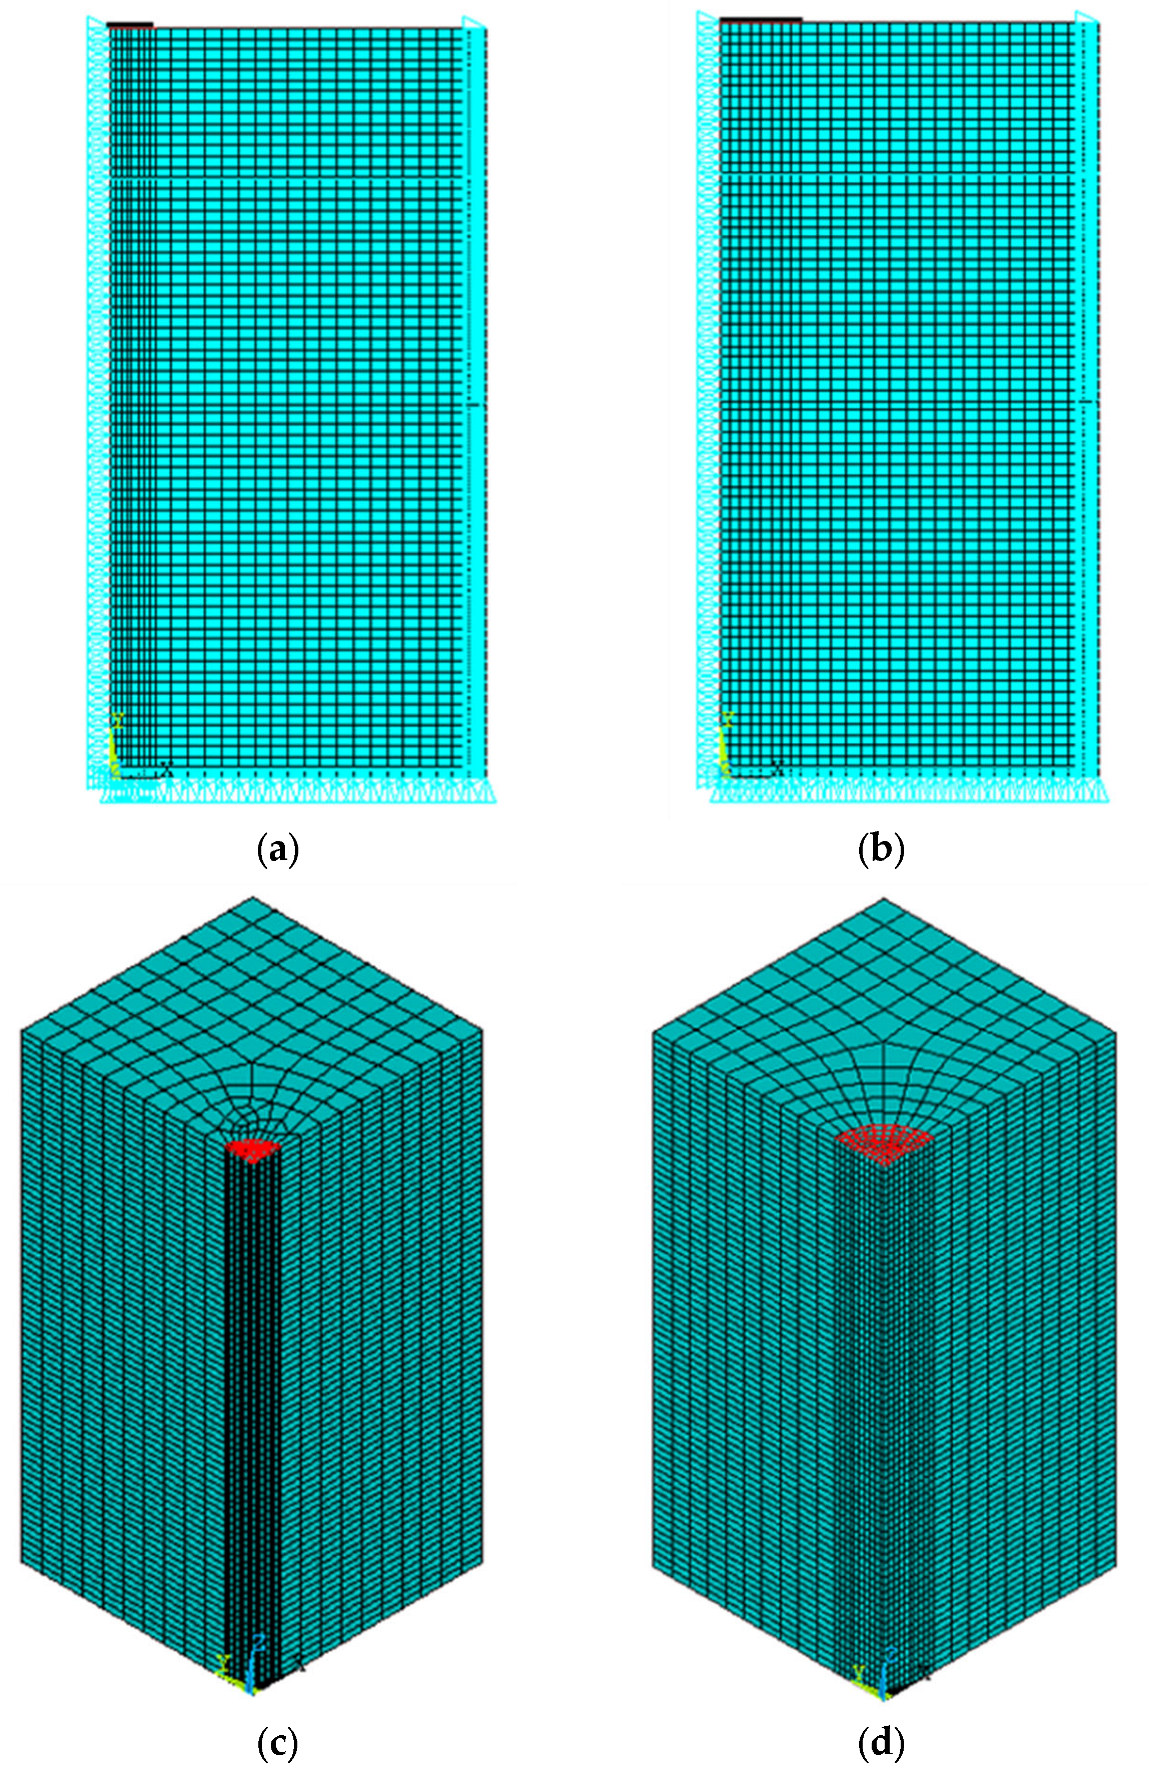
In the numerical study, mesh analyses were performed on the model in order to determine the effects of mesh geometry on the results. In the mesh analysis, it was seen that the geometry of the mesh can affect the vertical stress distribution in the sand beneath the circular footing. As a result of the analyses, a mesh geometry with the medium mesh option that does not affect the vertical stress distribution was selected, and this mesh geometry was used in the subsequent analyses. In the analysis, medium mesh size was used, and the mesh used in the study was formed by refining around the areas with the highest stresses located in the vicinity of the footing (Figure 7).
Circular area load with the same diameters of footing plates was placed centrally over the sand bed in the case of the circular footings. The loads were applied in steps, vertically to the soil and symmetrically to the axis, as in the model experiments. In the analysis, the boundary conditions are defined by limiting the displacement in the x and y directions. Accordingly, the y displacements in the x direction and the x displacements in the y direction are constrained.
In addition, the outer boundaries of the analyzed model are also restrained in the x and y directions. The hard layer underlying the sand layer was assumed to be a rigid boundary, and thus, the degrees of freedom in three directions were limited. The geometry, boundary conditions and finite element mesh of the analyzed model are presented in Figure 7.
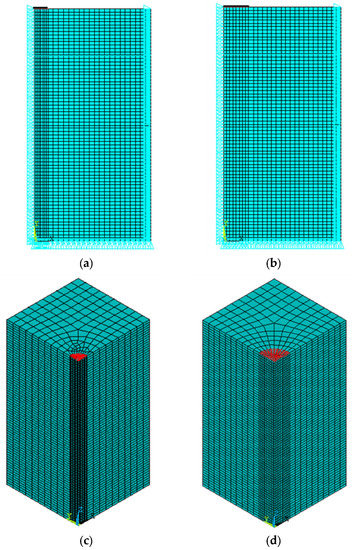
Figure 7.
The geometry of FEM, meshing, and boundary conditions: (a) D = 85 mm 2DM; (b) D = 85 mm 2DM; (c) D = 85 mm 2DM; (d) D = 85 mm 2DM.
Figure 7.
The geometry of FEM, meshing, and boundary conditions: (a) D = 85 mm 2DM; (b) D = 85 mm 2DM; (c) D = 85 mm 2DM; (d) D = 85 mm 2DM.
4. Results and Discussions
Two model footings were loaded at different load levels until failure, and the vertical stress values arisen in the sand at each load stage were measured at three depths (z = 1.0 D, z = 1.5 D and z = 2.0 D) using stress transducers. A large amount of data was collected from the tests. Due to space constraints in the manuscript, only selected results are presented. The vertical stress distribution obtained from the experimental studies was compared with the results of finite element analyses and Boussinesq’s solution. An additional parametric study was carried out to obtain vertical stress values at depths that could not be measured in laboratory experiments using the analyzed model. In the parametric study, vertical stress values were obtained for the footing diameter of 200 mm, and the results were compared with the theoretical method. In addition, two-dimensional analyses were carried out using the PLAXIS program in order to examine the boundary and the material model effects on the vertical stresses formed under the circular footing.
4.1. Comparison between the Results of Tests, Analysis and Boussinesq’s Solution
The variations in vertical stress with depths of z = 1.0 D, z = 1.5 D and z = 2.0 D beneath the centerline of the 85 mm diameter circular footing under the plate loading, q = 10 kN/m2, are shown in Table 3 and Figure 8.
Table 3.
Vertical stress values beneath the centerline of the 85 mm circular footing.

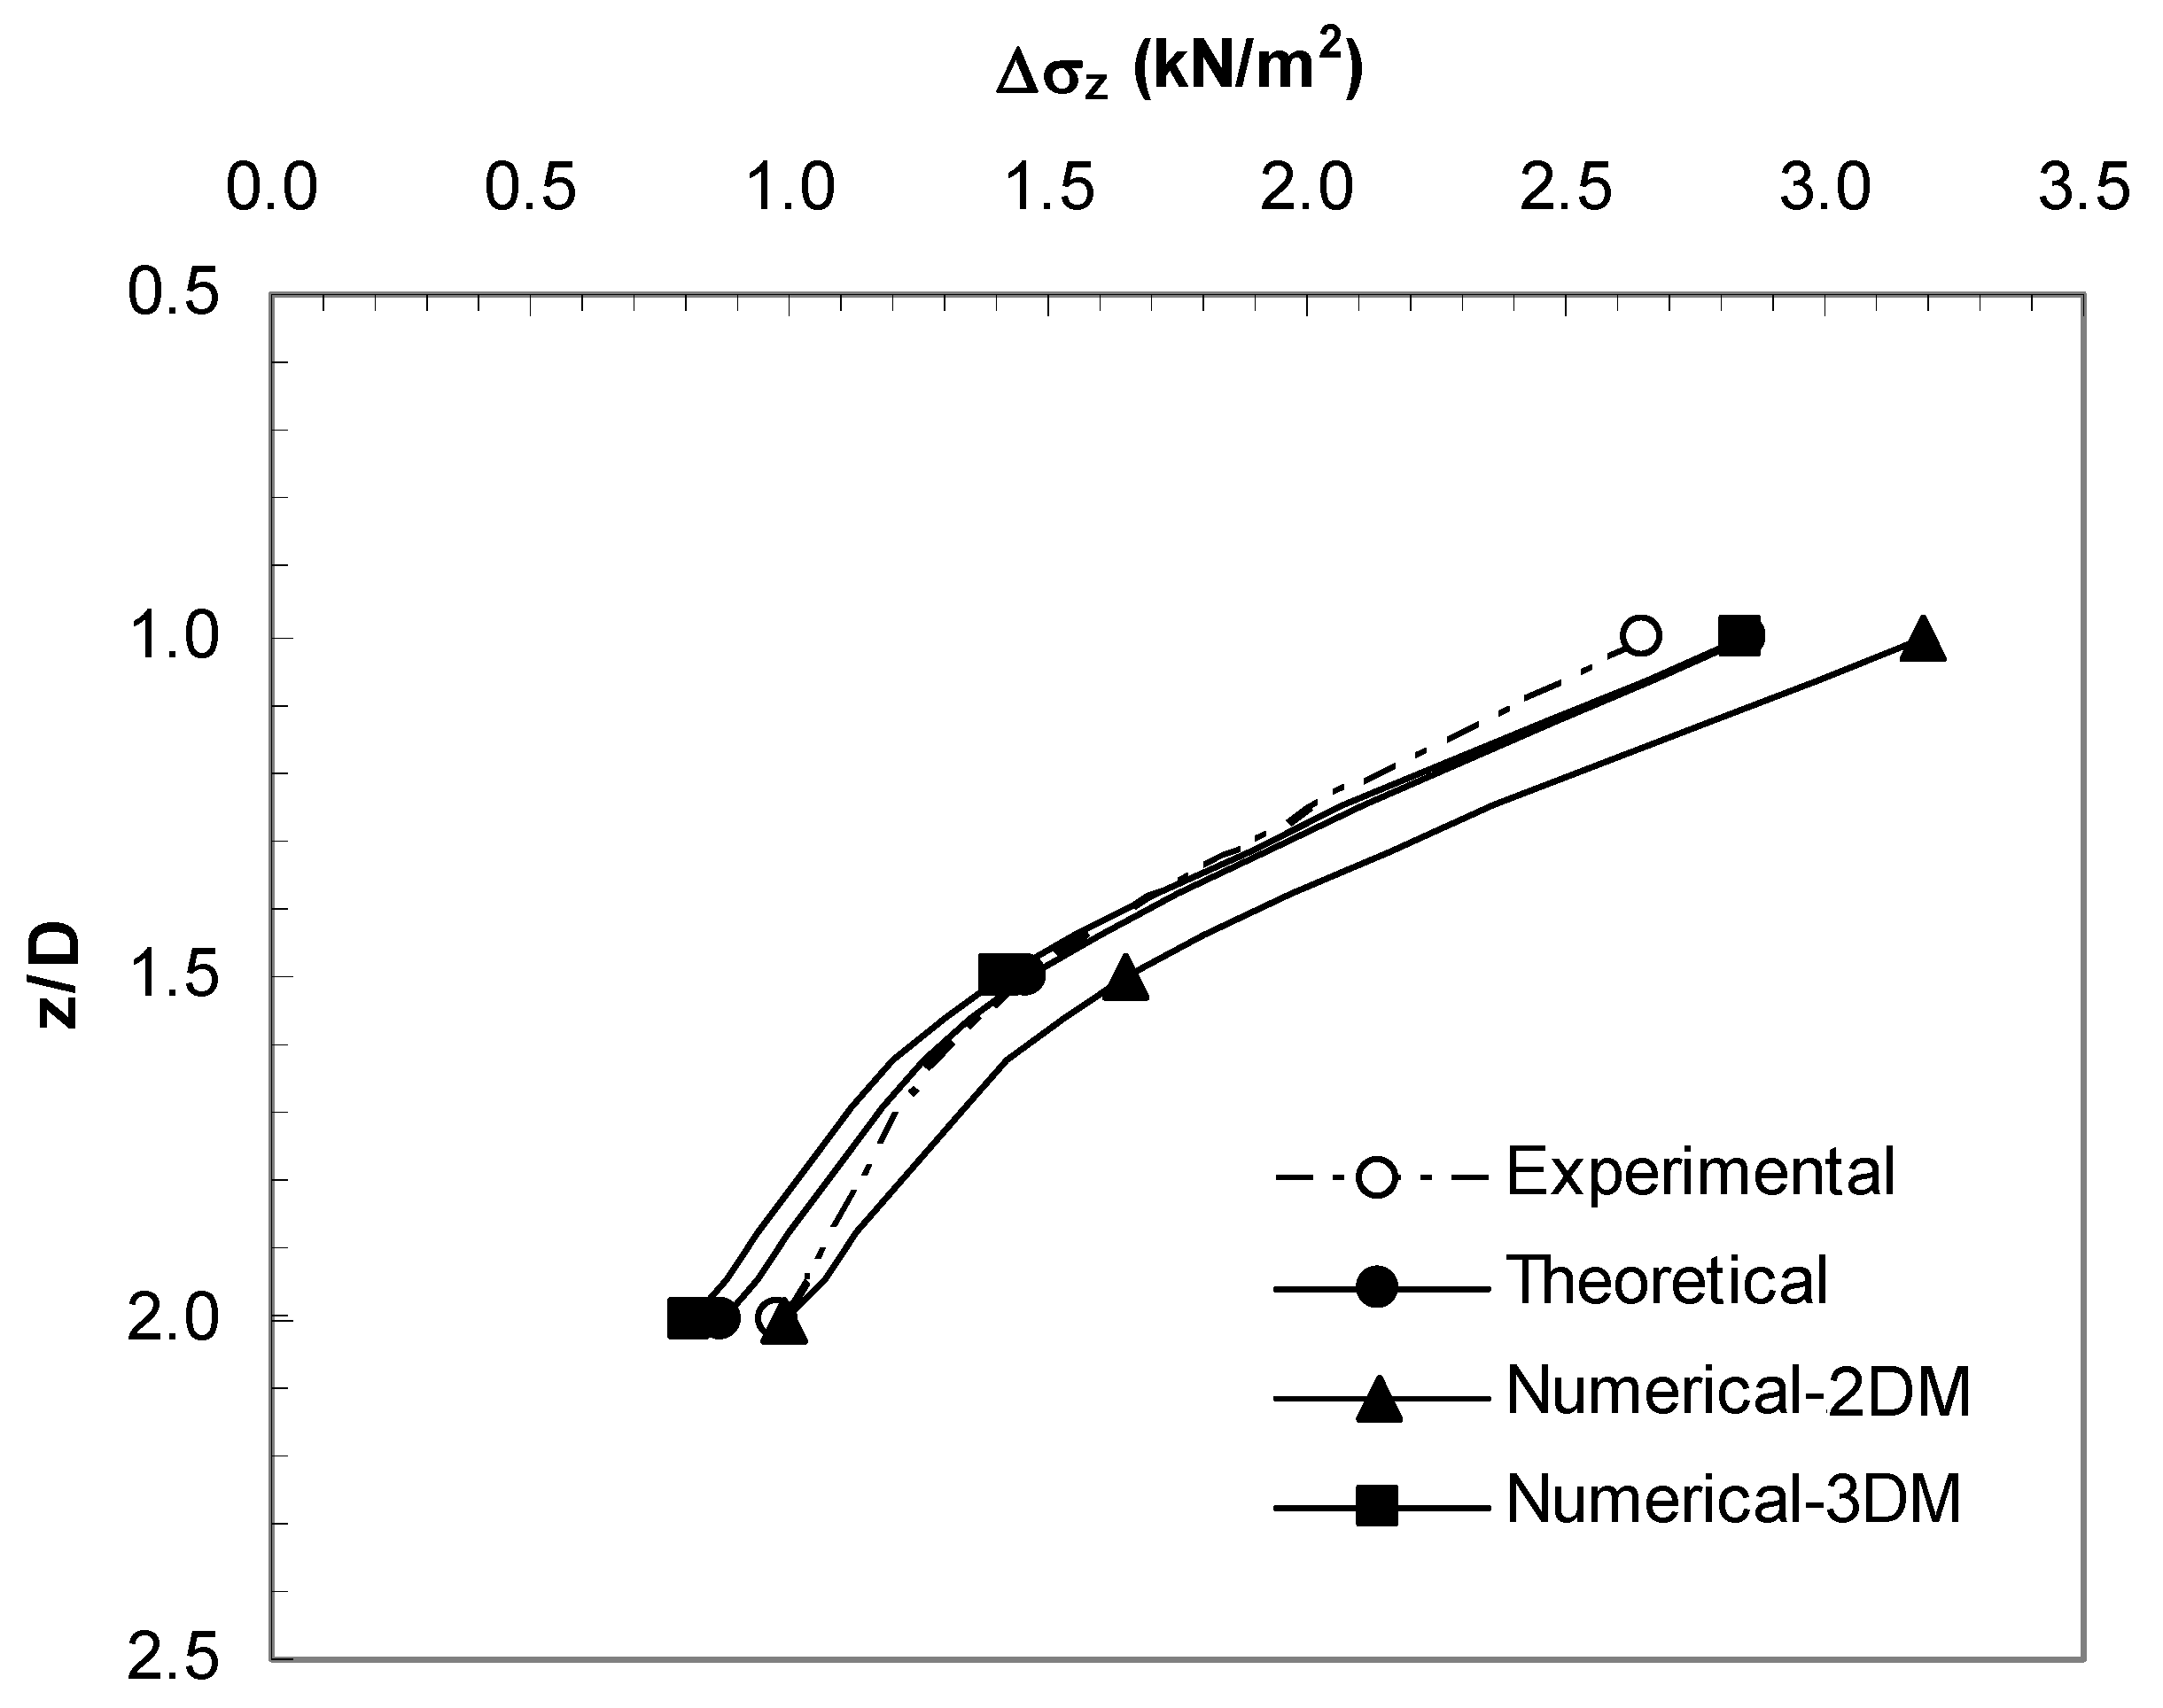
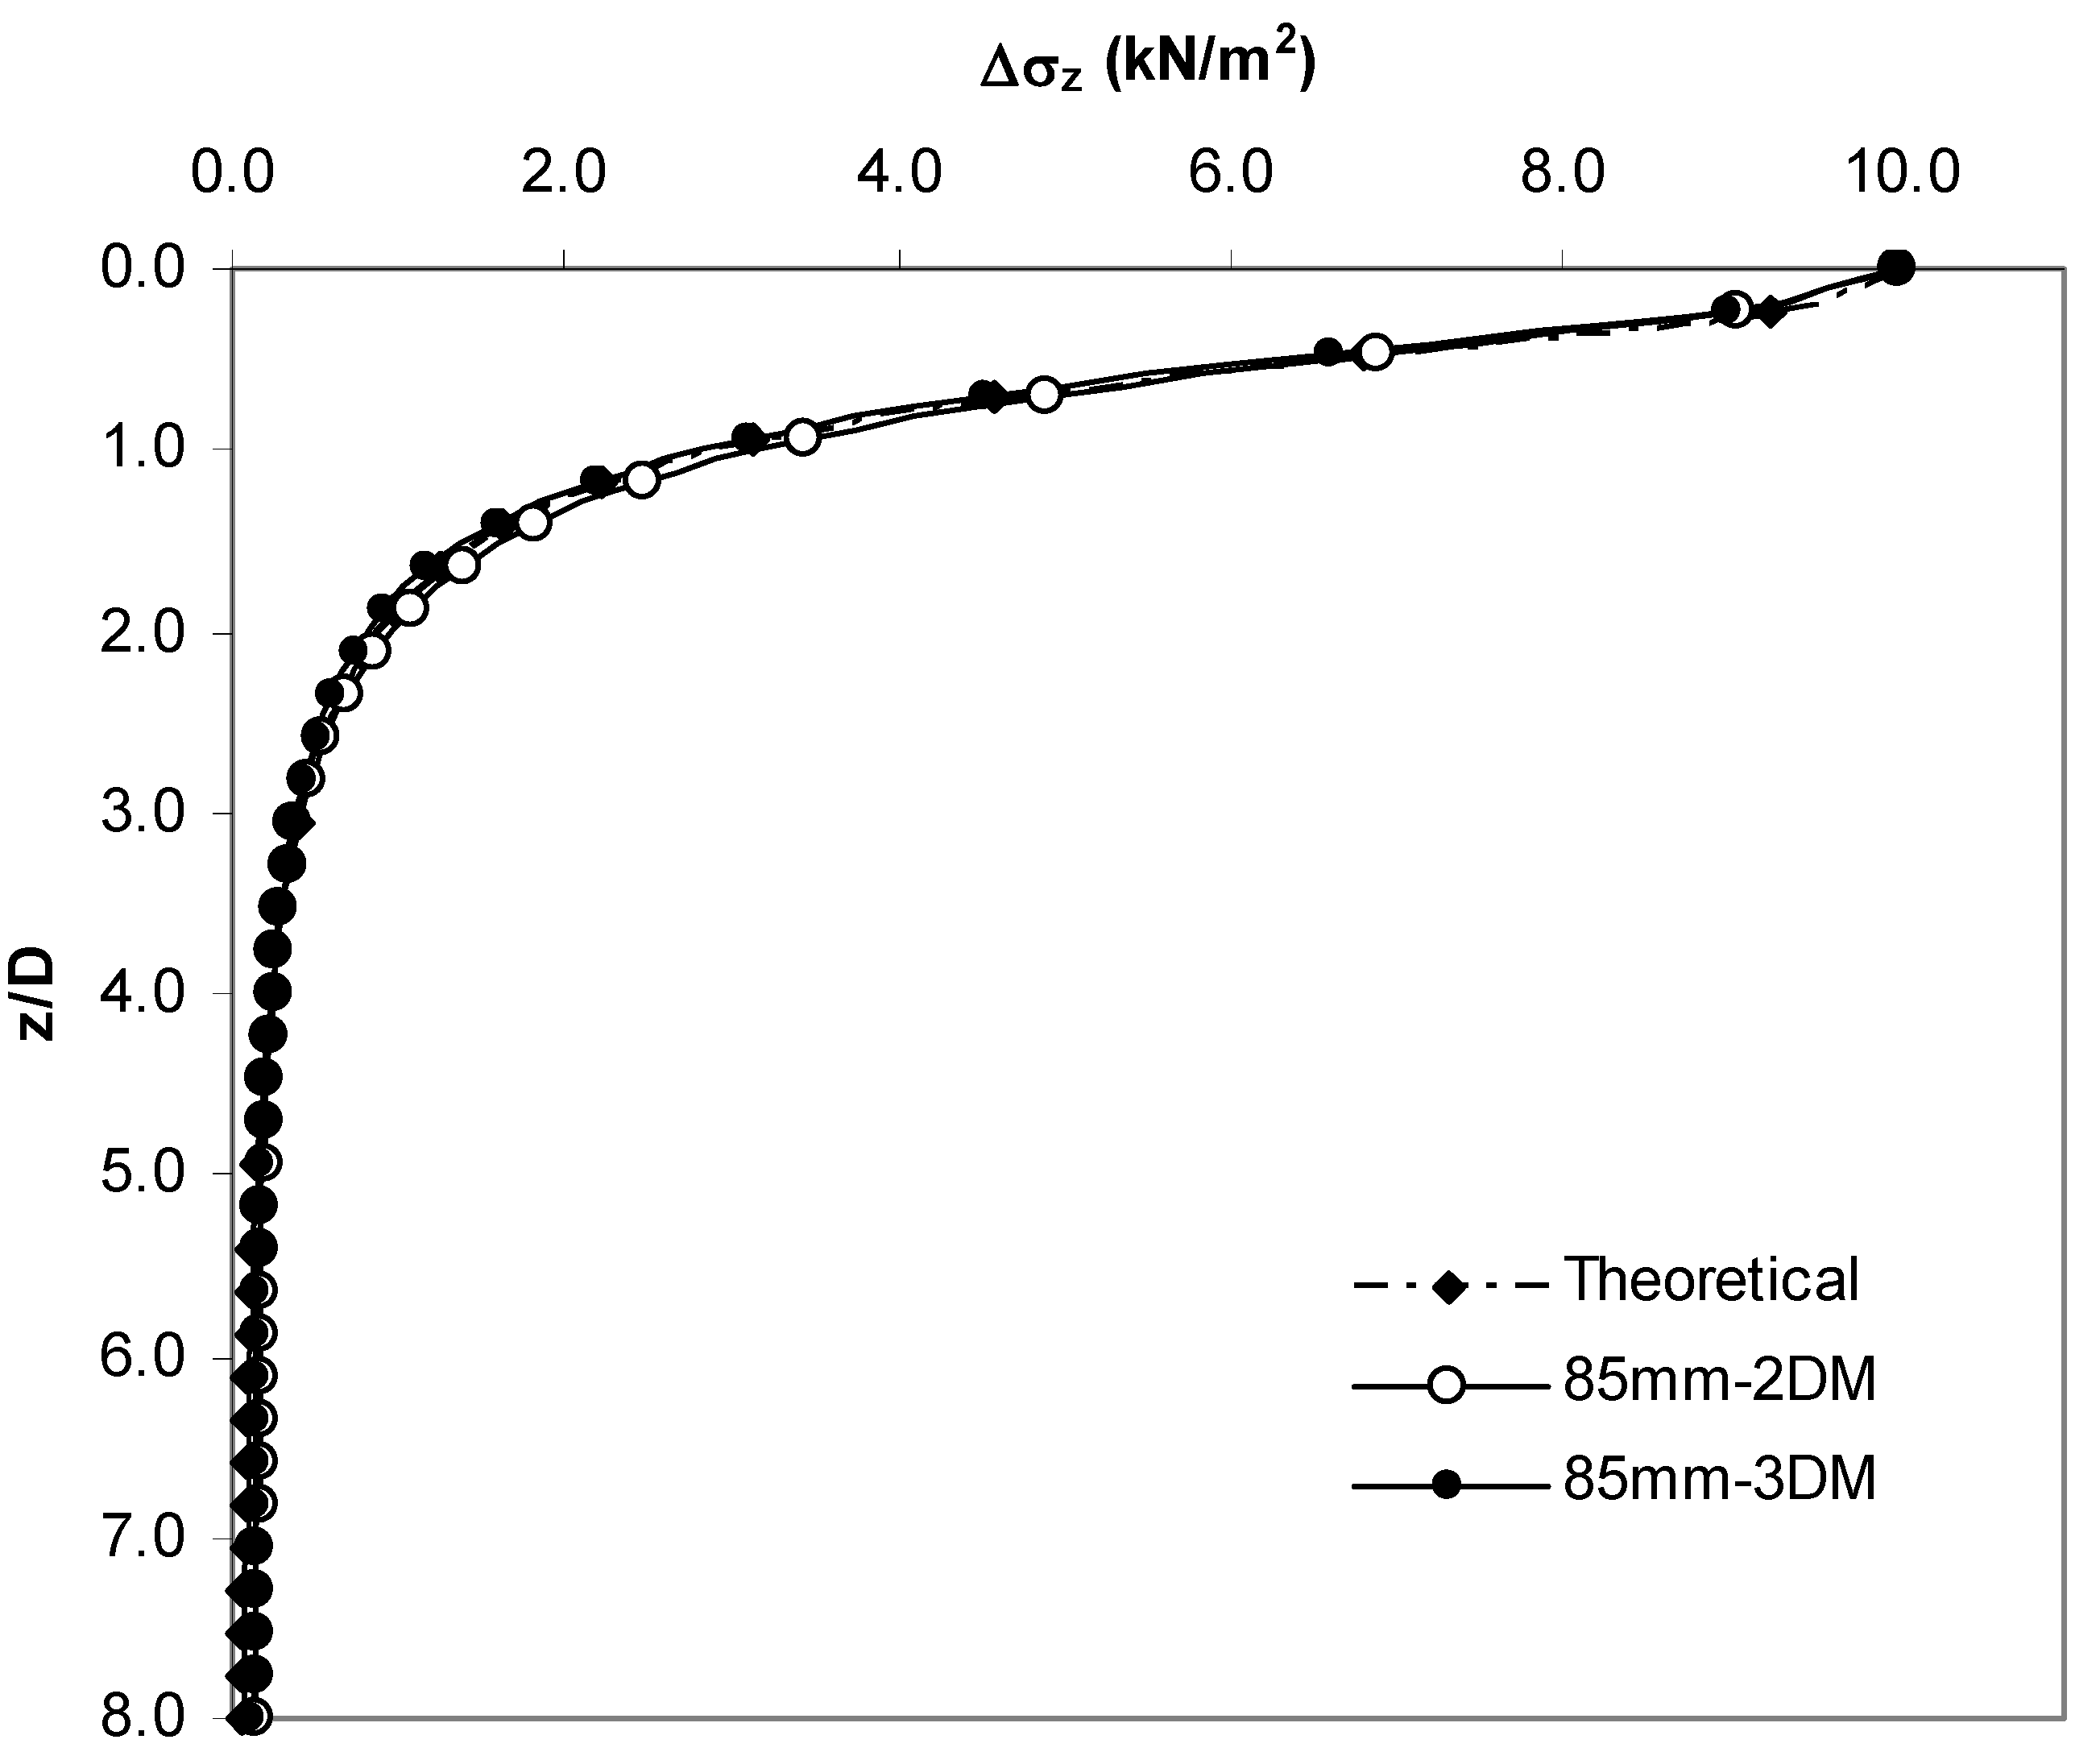
Figure 8.
Vertical stress distribution beneath the 85 mm circular footing.
From Table 3 and Figure 8, it can be seen that there is a difference of 7.5% at z = 1.0 D, 1.4% at z = 1.5 D, and about 13% at z = 2.0 D between experimental and theoretical results. When the numerical analysis results are evaluated, the vertical stress values in the 2D model are higher than the other methods at all depths, and there are 12%, 17% and 22% differences between the 2D and 3D model results at z = 1.0 D, z = 1.5 D and z = 2.0 D depths, respectively. The vertical stress values obtained from the 3D model are closer to both experimental and theoretical results compared to the 2D model.
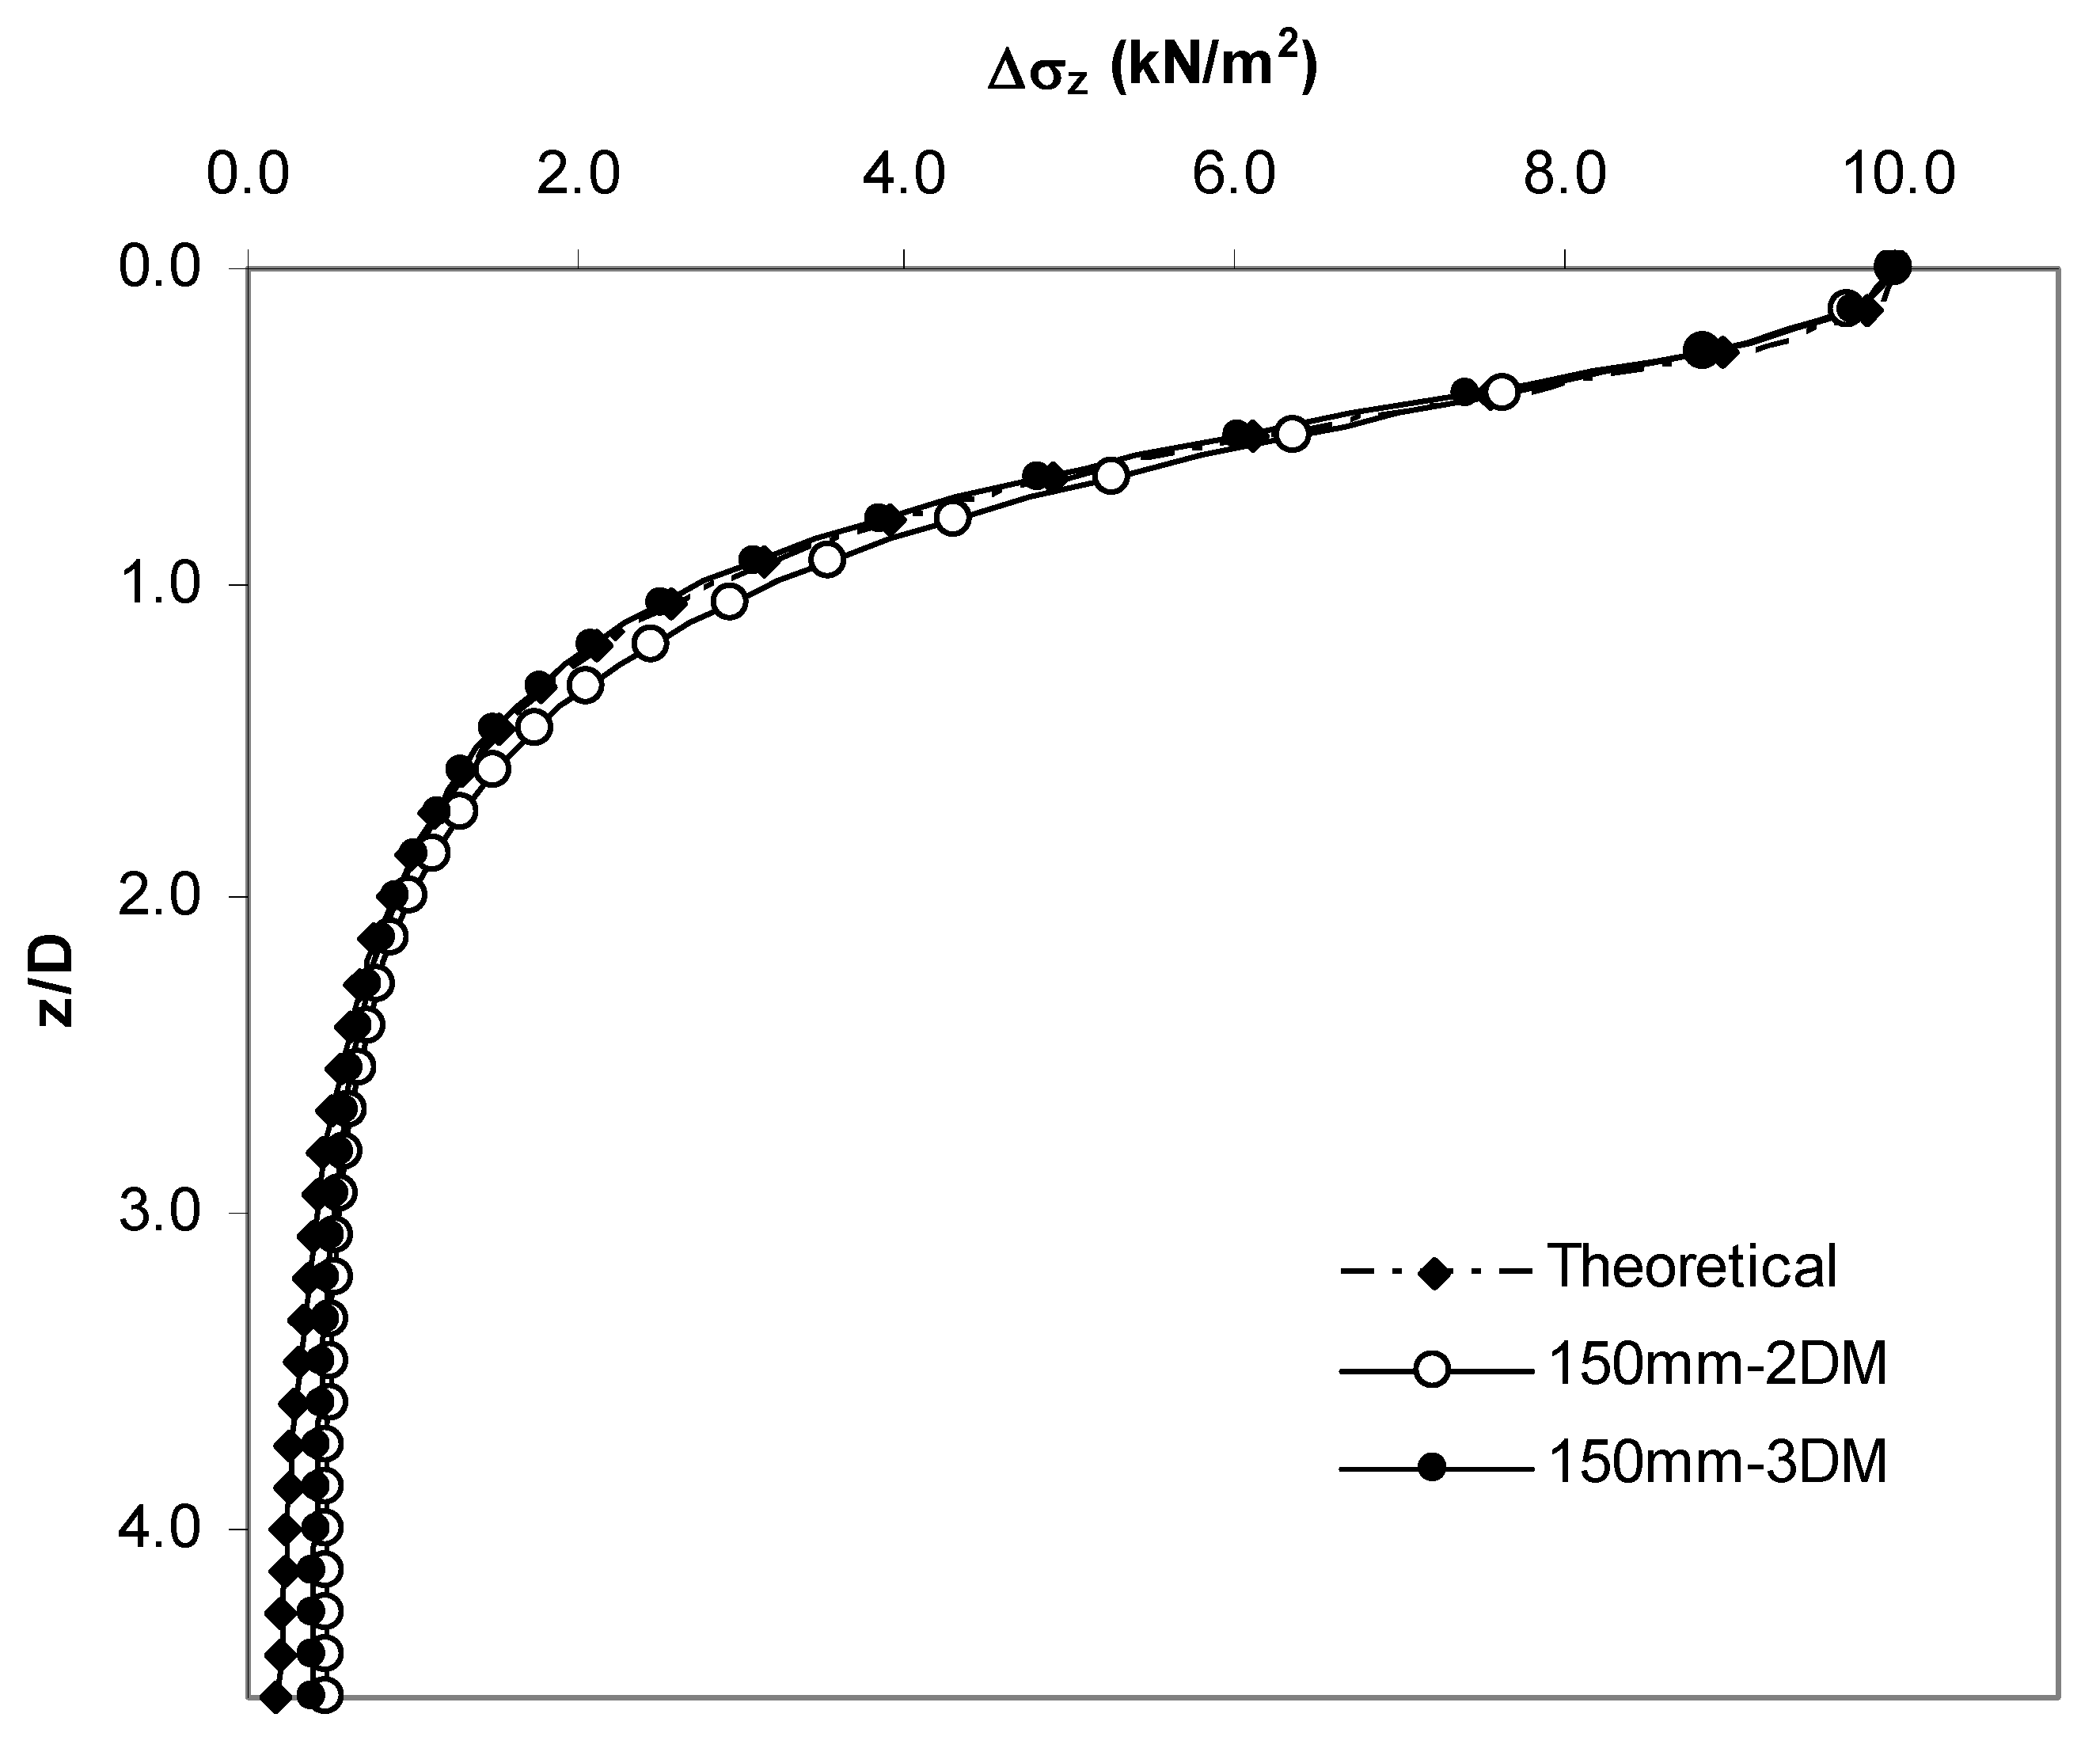
The vertical stress distribution obtained from the experimental, numerical and theoretical solutions for the plate loading, q = 10 kN/m2 beneath the center line of the 150 mm circular footing, is presented in Table 4 and Figure 9. As seen from Table 4 and Figure 9, the theoretical results do not change with the increase in the width of the foundation, and therefore, the difference between the experimental results and the theoretical results increases. There is a 12%, 11% and 14% difference between the experimental and theoretical results at z = 1.0 D, z = 1.5 D and z = 2.0 D depths, respectively. In addition, the differences between the results of the 2D model and 3D model are 12% at z = 1.0 D, 16% at z = 1.5 D, and 10% at z = 2.0 D depths. The numerical analysis results for this footing diameter are higher than the theoretical method results at all depths.
Table 4.
Vertical stress values beneath the centerline of the 150 mm circular footing.
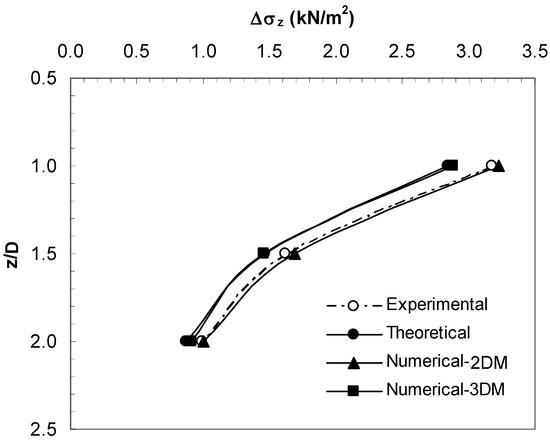
Figure 9.
Vertical stress distribution beneath the 150 mm circular footing.
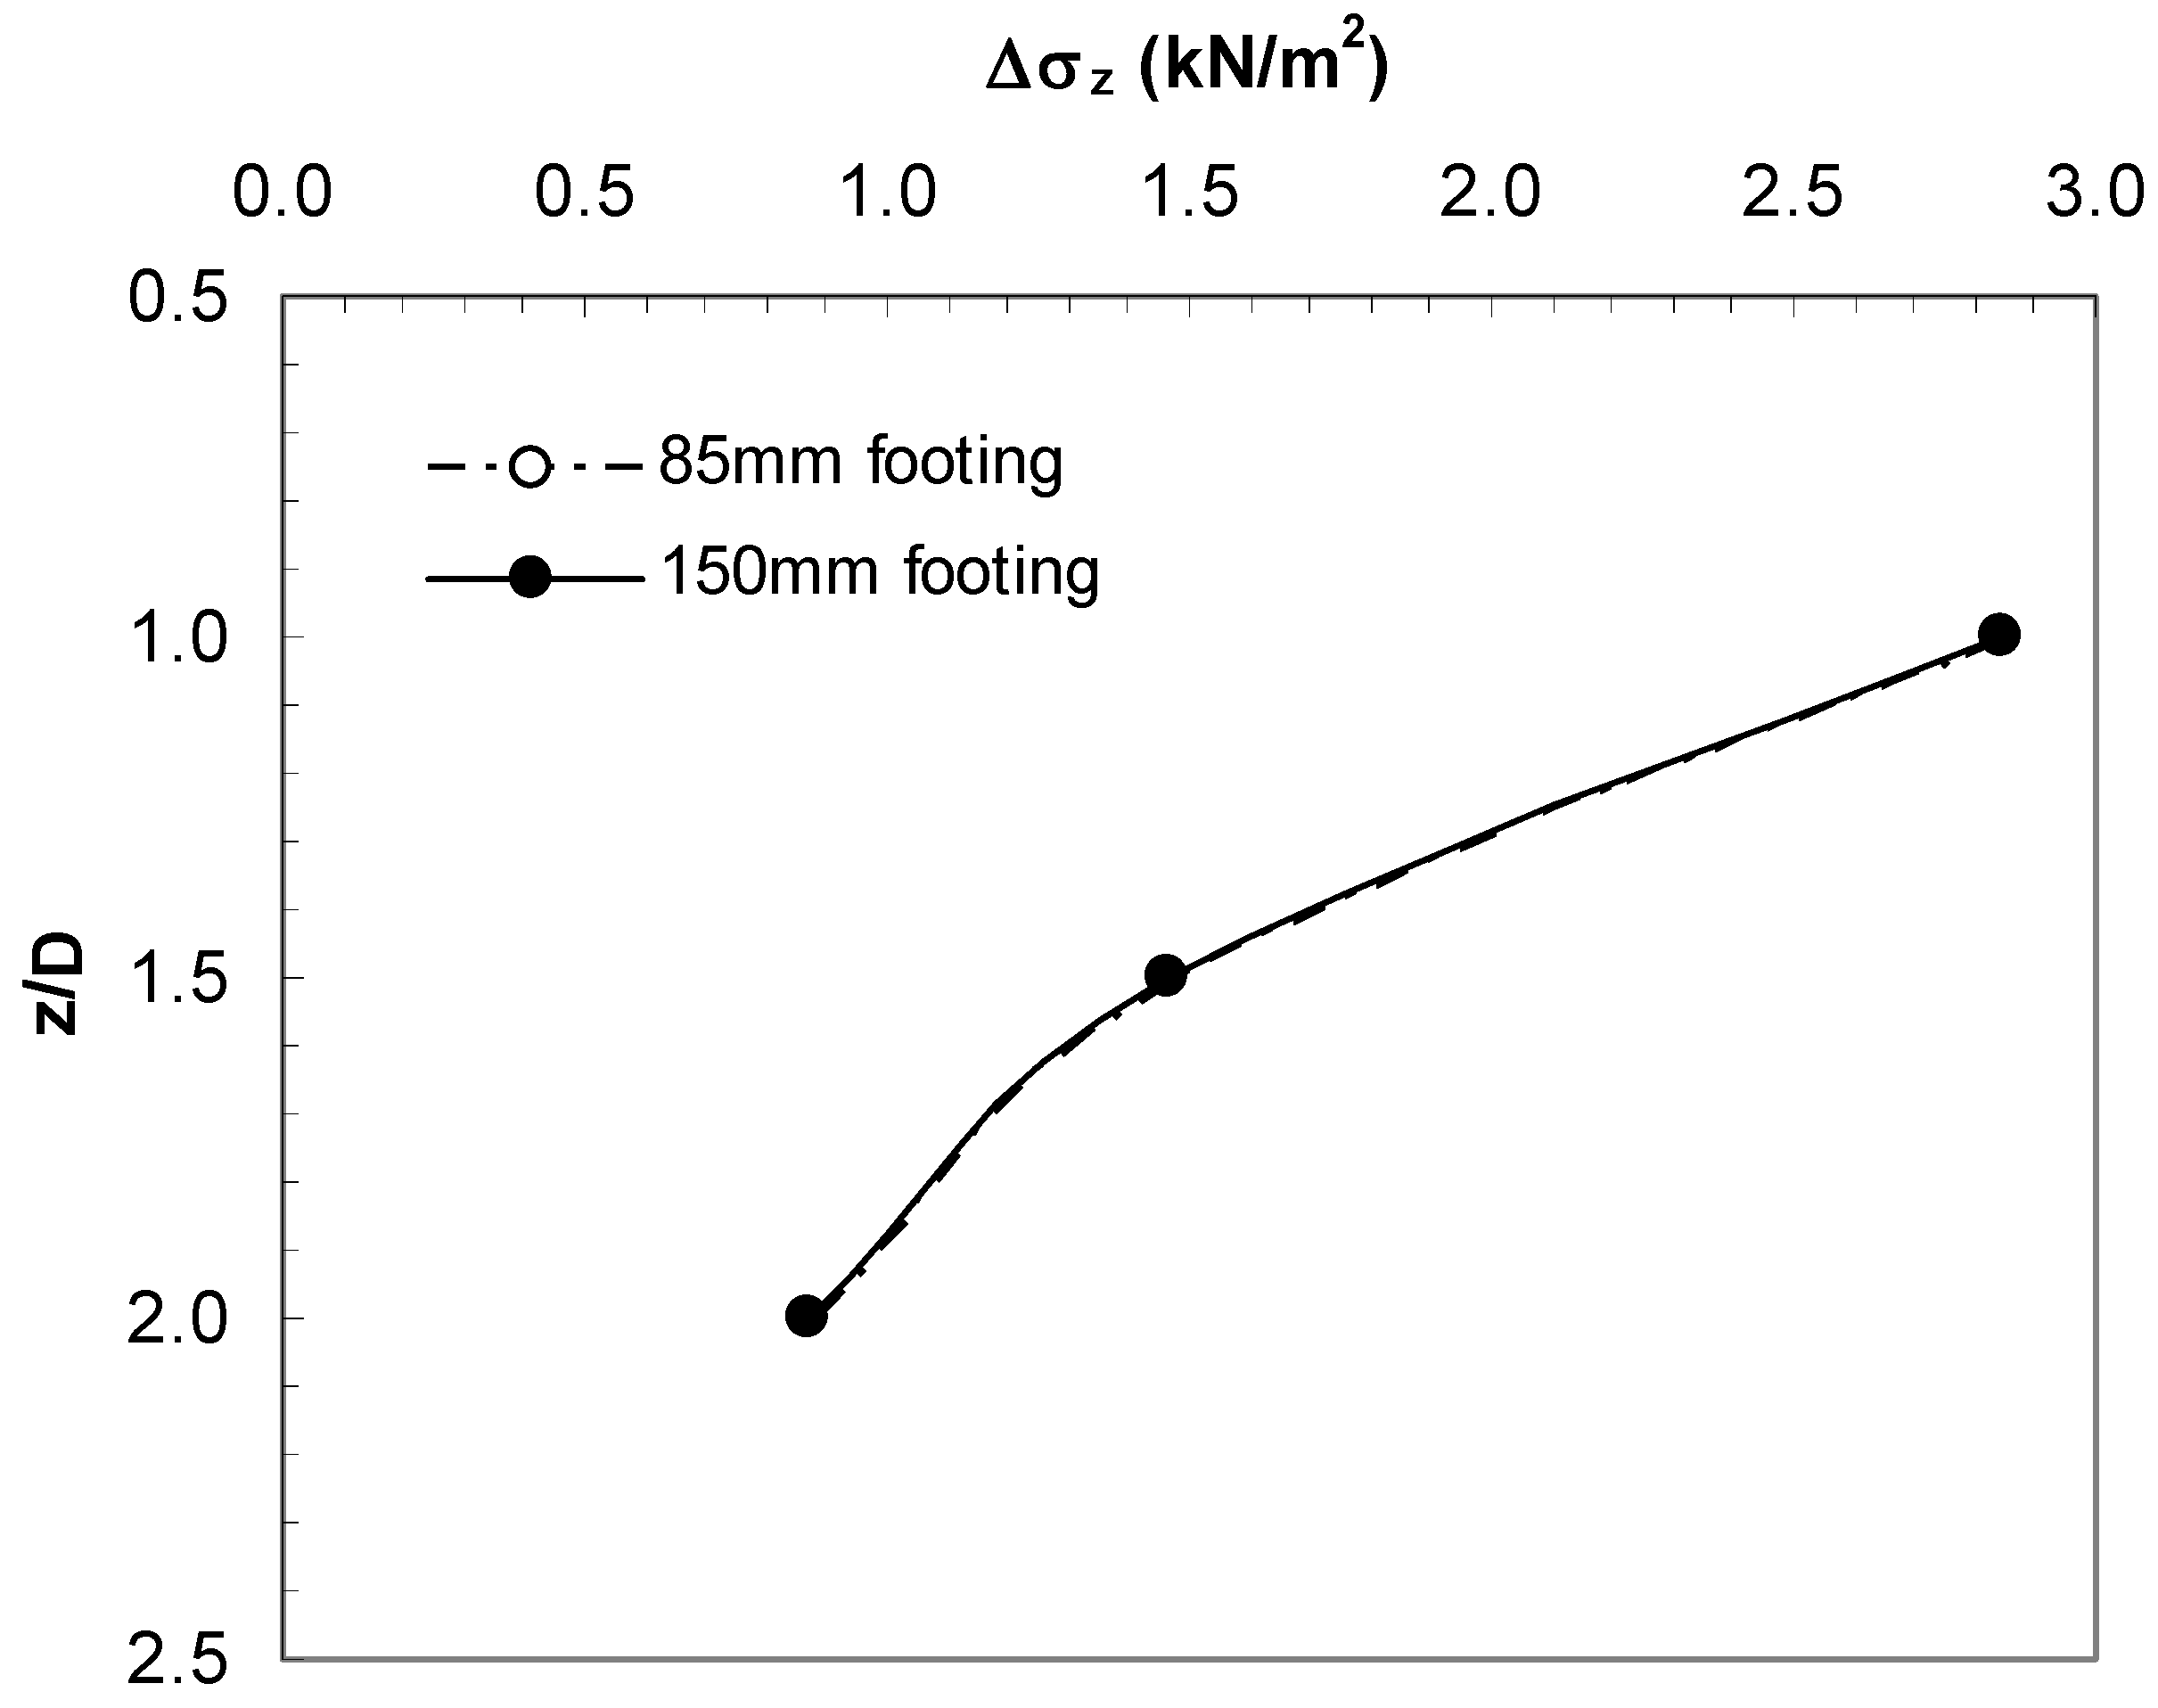
4.2. Effect of Footing Size
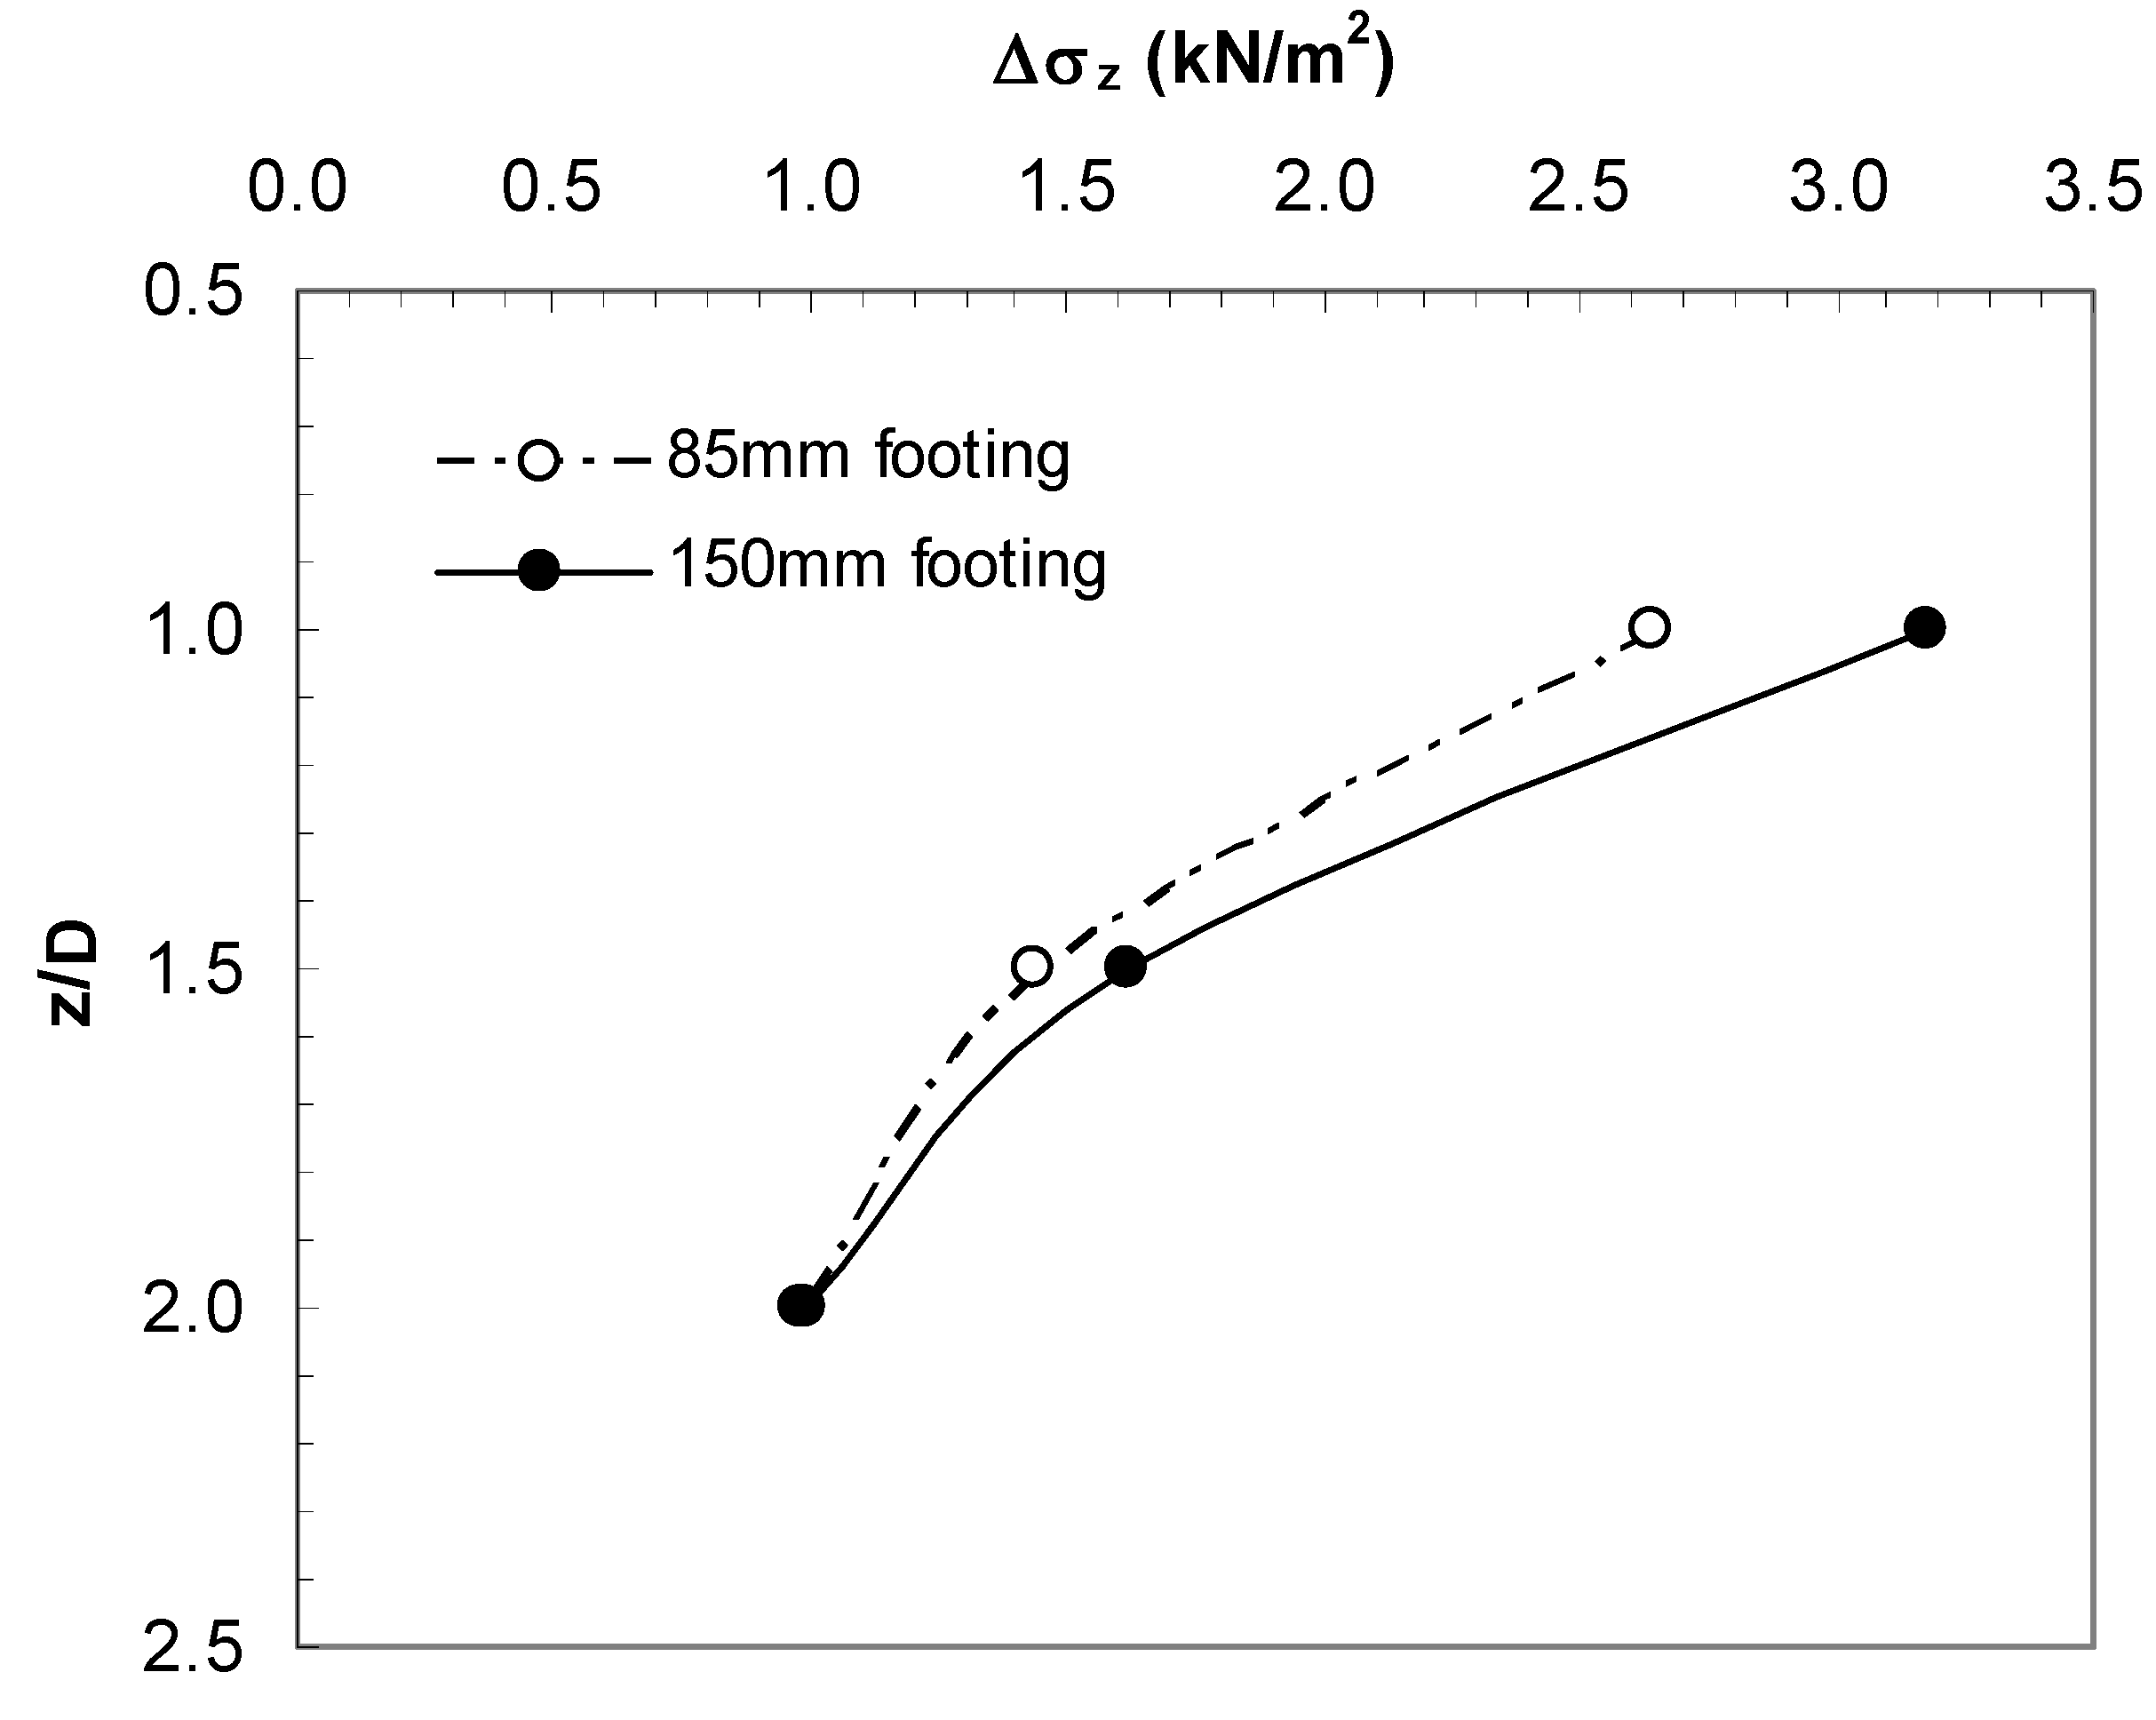
Two models of circular footings with different diameters were tested to evaluate whether the vertical stresses occurring below the centerline of the circular footing depend on the footing width, D. Vertical stress values obtained from the tests are compared in Figure 10. Figure 10 shows that at the same ratio of z/D, vertical stress values increase with increasing the diameter of the footing under the same plate load. As seen in Figure 10, measured stresses beneath the 150 mm circular footing are considerably higher than the stresses beneath the 85 mm circular footing, especially at shallow depths. According to the results of the model tests performed at different footing diameters, beneath the centerline of the 150 mm diameter circular footing, compared to the 85 mm diameter circular footing, higher vertical stress values were obtained at the rate of 20% at 1.0 D, 12.5% at 1.5 D and 1% at 2.0 D depths. It can be concluded that if two footings of various sizes subjected to the constant stress level are placed on the same sand with the same density, the vertical stresses beneath these two footings will be different. In other words, the larger footing produces a greater stress bulb than the smaller footing.
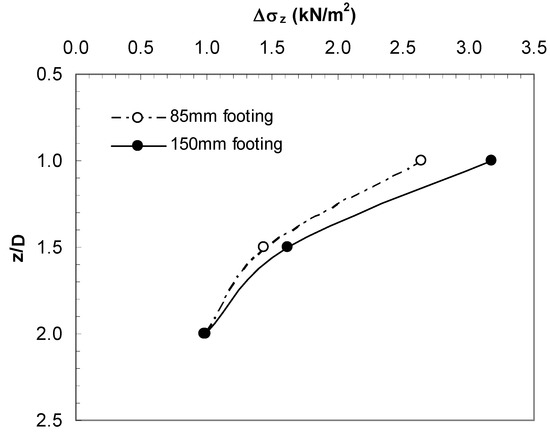
Figure 10.
Measured vertical stress values for circular footings.
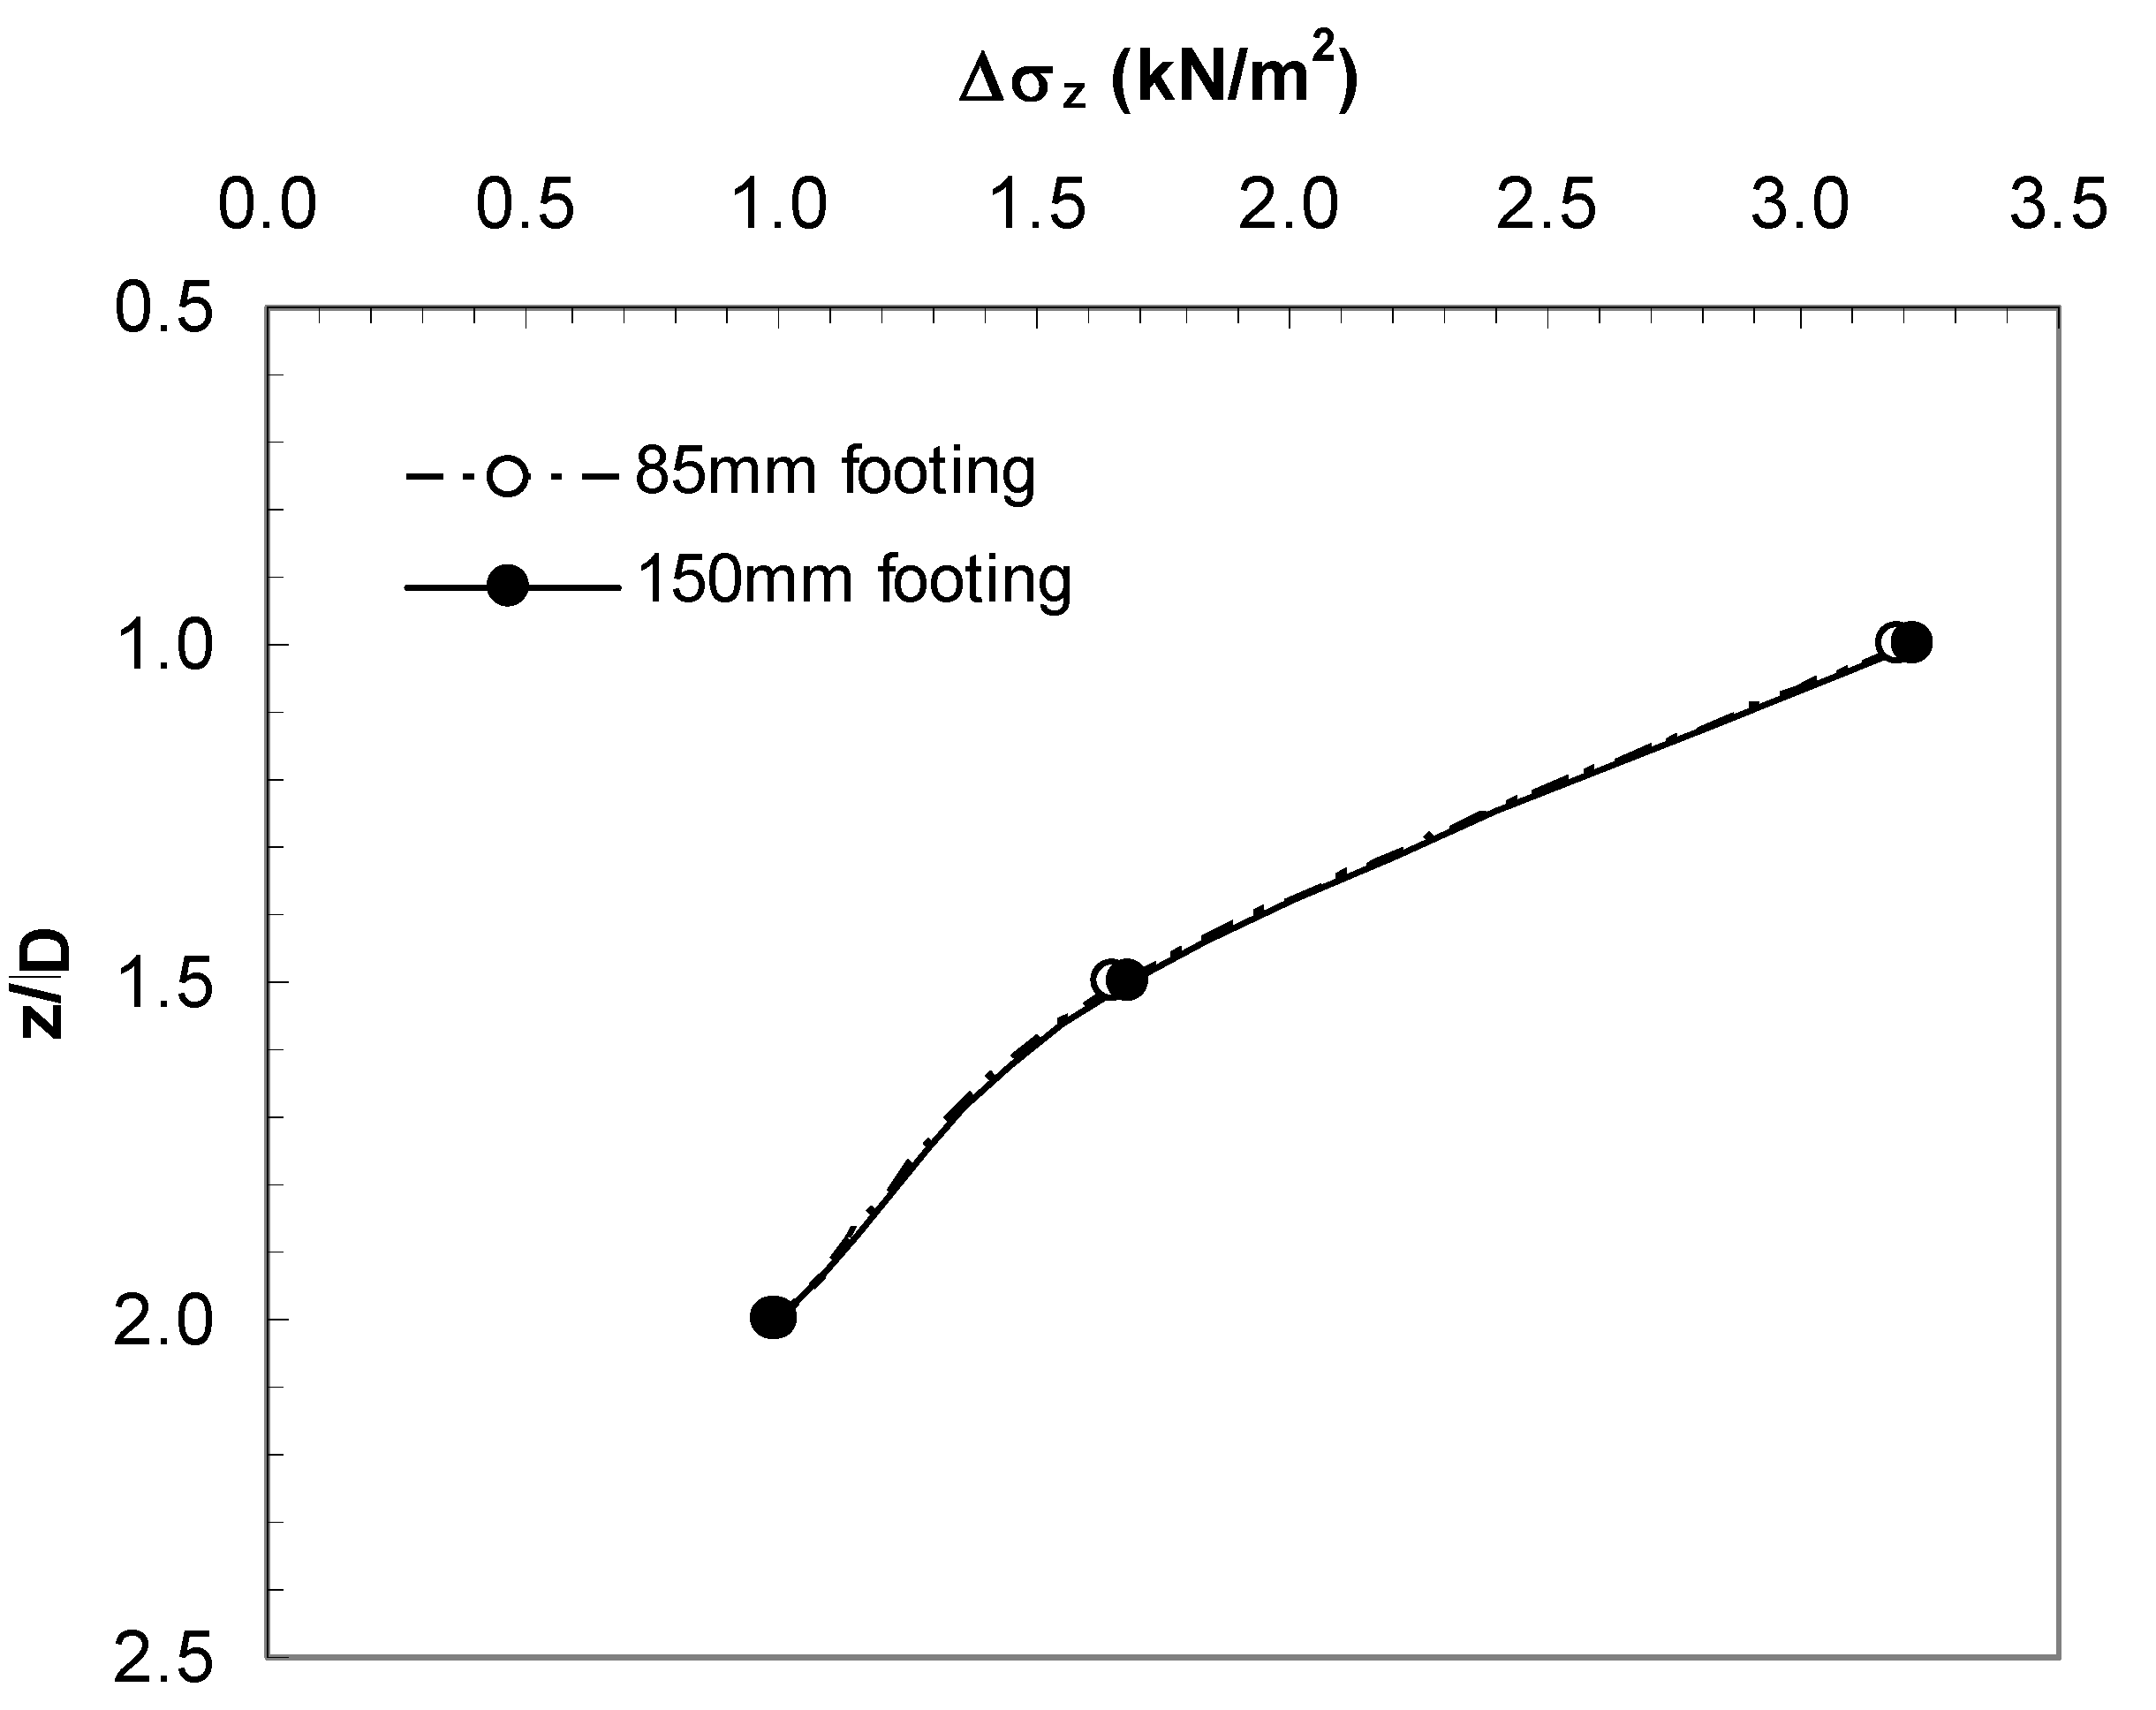
Figure 11, Figure 12 and Figure 13 present the vertical stress values obtained from 2DM, 3DM and theoretical analyses, respectively. As seen from Figure 11, although the vertical stresses under the 150 mm diameter footing are higher in the 2DM analysis, the amount of increase is quite low. There is a maximum difference of 2.4% between the vertical stress values obtained for 85 and 150 mm diameter footings.

Figure 11.
Vertical stress values obtained from 2DM analysis.
Figure 12 shows that vertical stress values below 150 mm circular footing in 3DM are up to 12% greater than stresses below 85 mm circular footing. As can be clearly seen in Figure 13, the size of the footing has no effect on the vertical stresses calculated with the Boussinesq method, as the formula does not consider the size of the footing.
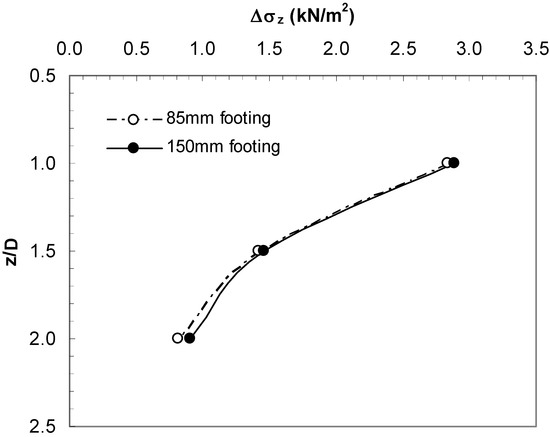
Figure 12.
Vertical stress values obtained from 3DM analysis.
Figure 12.
Vertical stress values obtained from 3DM analysis.

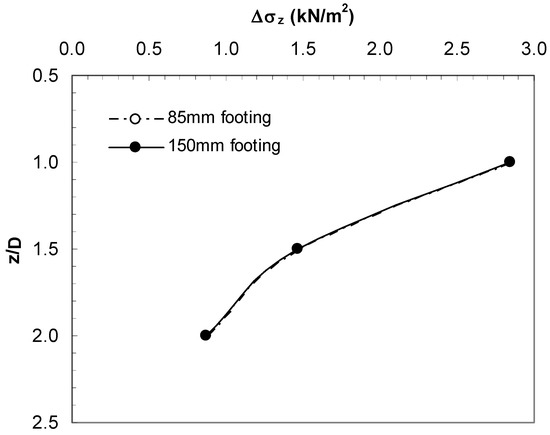
Figure 13.
Vertical stress values obtained from Boussinesq theory.
Figure 13.
Vertical stress values obtained from Boussinesq theory.
The effect of the foundation diameter on the vertical stresses can be explained as follows: As the foundation diameter increases, the area on which the load acts becomes larger, and this causes a greater number of sand grains to transfer the vertical stresses to the deeper soil layers under the foundation, especially in dense sands. This result is similar to the results obtained from the study by Cicek et al. [14]. As a result, a greater stress bulb is formed under the foundation, and at the same depth/foundation diameter ratios, greater stress values occur under the large foundation diameter. This also confirms the stress-dependent behavior of sand soils.
4.3. Effect of Material Model
A series of two-dimensional finite element analyses was carried out in order to examine the effect of the material model used in the numerical analysis on the vertical stress values due to external loads under circular footings on sand. For this purpose, vertical stress values under circular footings with 85 and 150 mm diameters were obtained with the PLAXIS program using the experimental setup dimensions. In the analyses, the elastoplastic hyperbolic model described as the hardening soil model (HS) was used to describe the non-linear sand behavior. When subjected to primary deviatoric loading, cohesionless soil shows a decreasing stiffness, and simultaneously, irreversible plastic strains develop. The observed relationship between the pressure and axial strain can be well approximated by a hyperbola as used in the variable elastic, hyperbolic model [28]. However, the HS model is far superior to the hyperbolic model, being capable of simulating non-linear, inelastic, stress-dependent material behavior. Limiting states of stress are described by means of the friction angle (Ø), the cohesion (c), and the dilatancy angle (ψ). In addition, the increase in soil stiffness with pressure is accounted for in all three stiffnesses used, i.e., the triaxial loading stiffness E50, the triaxial unloading/reloading stiffness Eur and the oedometer loading stiffness Eoed [29]. Soil parameters used in the numerical analysis obtained by consolidated-drained triaxial compression tests on sand are shown in Table 5.
Table 5.
Parameters of HS model.
The stress values obtained as a result of the analyses carried out to examine the effect of the material model on the vertical stresses are shown in Figure 14 and Figure 15. Figure 16 shows the vertical stress distribution beneath the footings. As seen from the figures, the vertical stress values obtained using the hardening soil material model in two-dimensional conditions are closer to the three-dimensional Drucker–Prager results than the two-dimensional Drucker–Prager results. When comparing the vertical stress values obtained with the HS and DP models in two-dimensional conditions for the 85 mm diameter footing, it is seen that the two-dimensional DP model results are approximately 17% greater at 1.0 D depth, 11% at 1.5 D depth, and 10% at 2.0 D depth than the HS model results. For the 150 mm diameter footing, it is seen that the two-dimensional DP model results are approximately 12%, 10% and 5% larger, respectively, at the same depths.
It can be said that the difference between the vertical stress values obtained with different material models may be due to the assumptions made in the soil models in question and the difference in the finite element mesh between the two computer programs. As it is known, sand soils are stress-dependent soils. Considering this feature of sand soils, it can be said that the hardening soil model can more realistically model the stress-dependent behavior of sand soils.

Figure 14.
Vertical stresses with HS and DP models (85 mm footing).
Figure 14.
Vertical stresses with HS and DP models (85 mm footing).
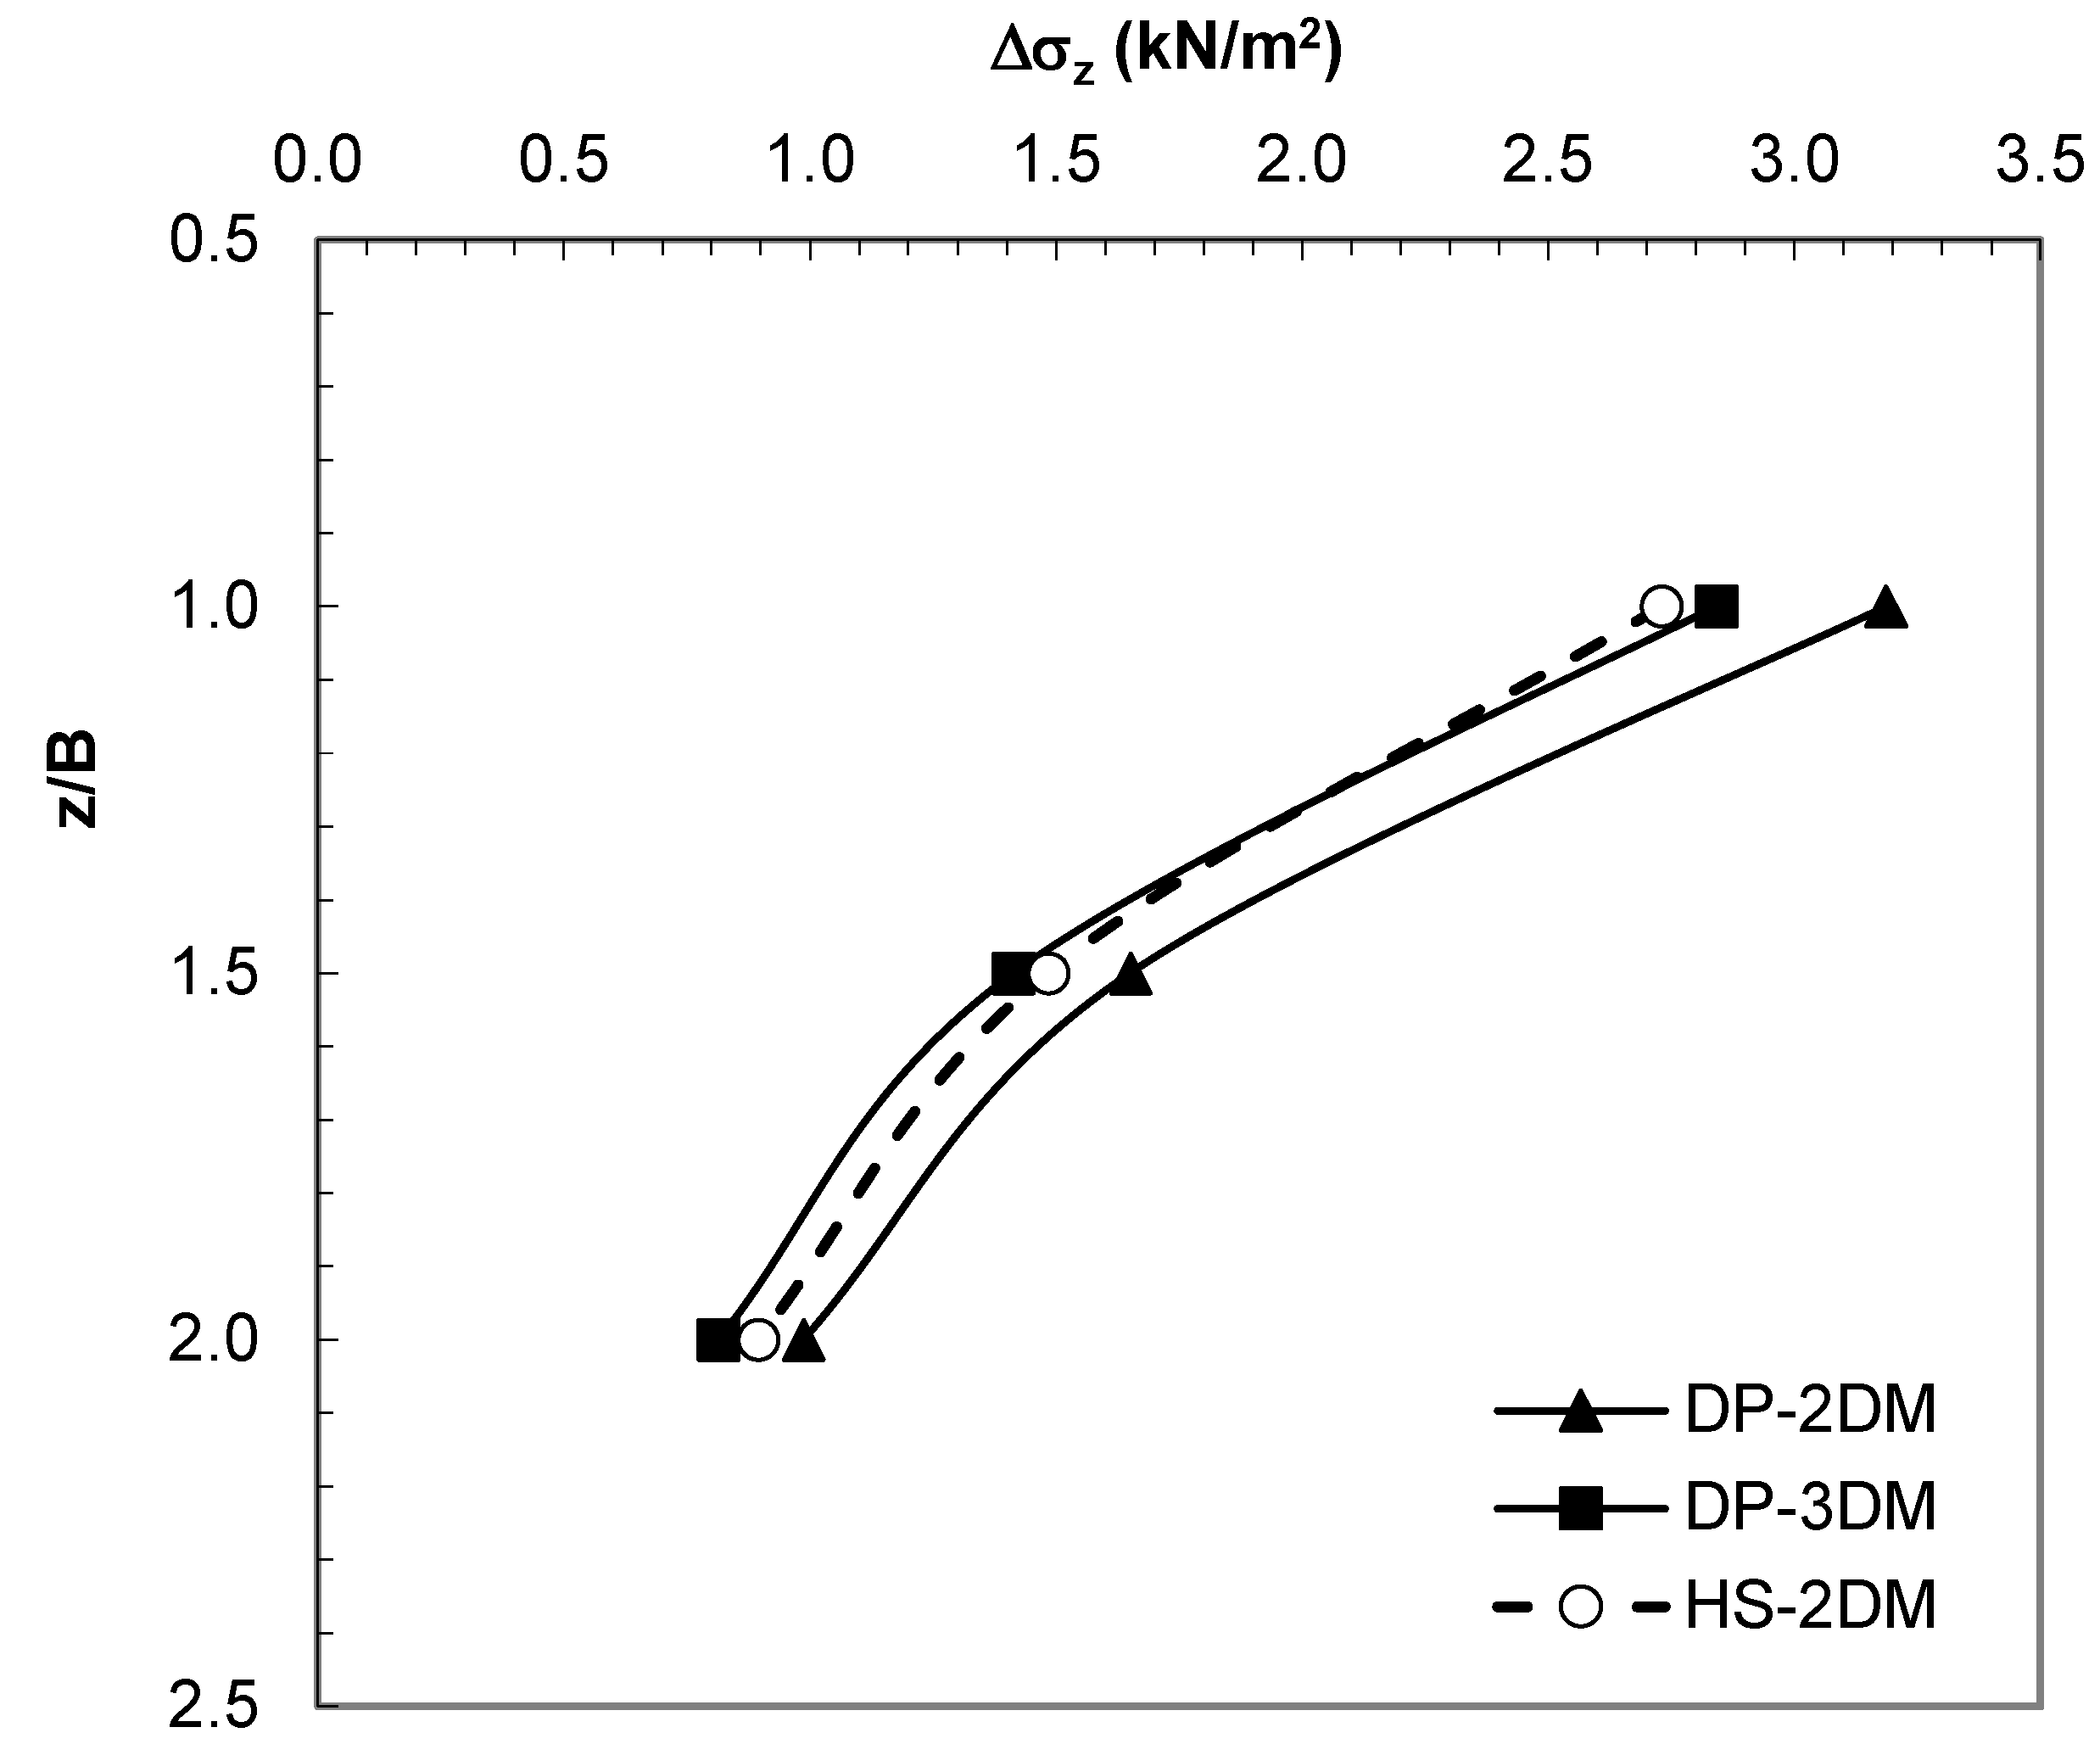

Figure 15.
Vertical stresses obtained with HS and DP models (150 mm footing).
Figure 15.
Vertical stresses obtained with HS and DP models (150 mm footing).
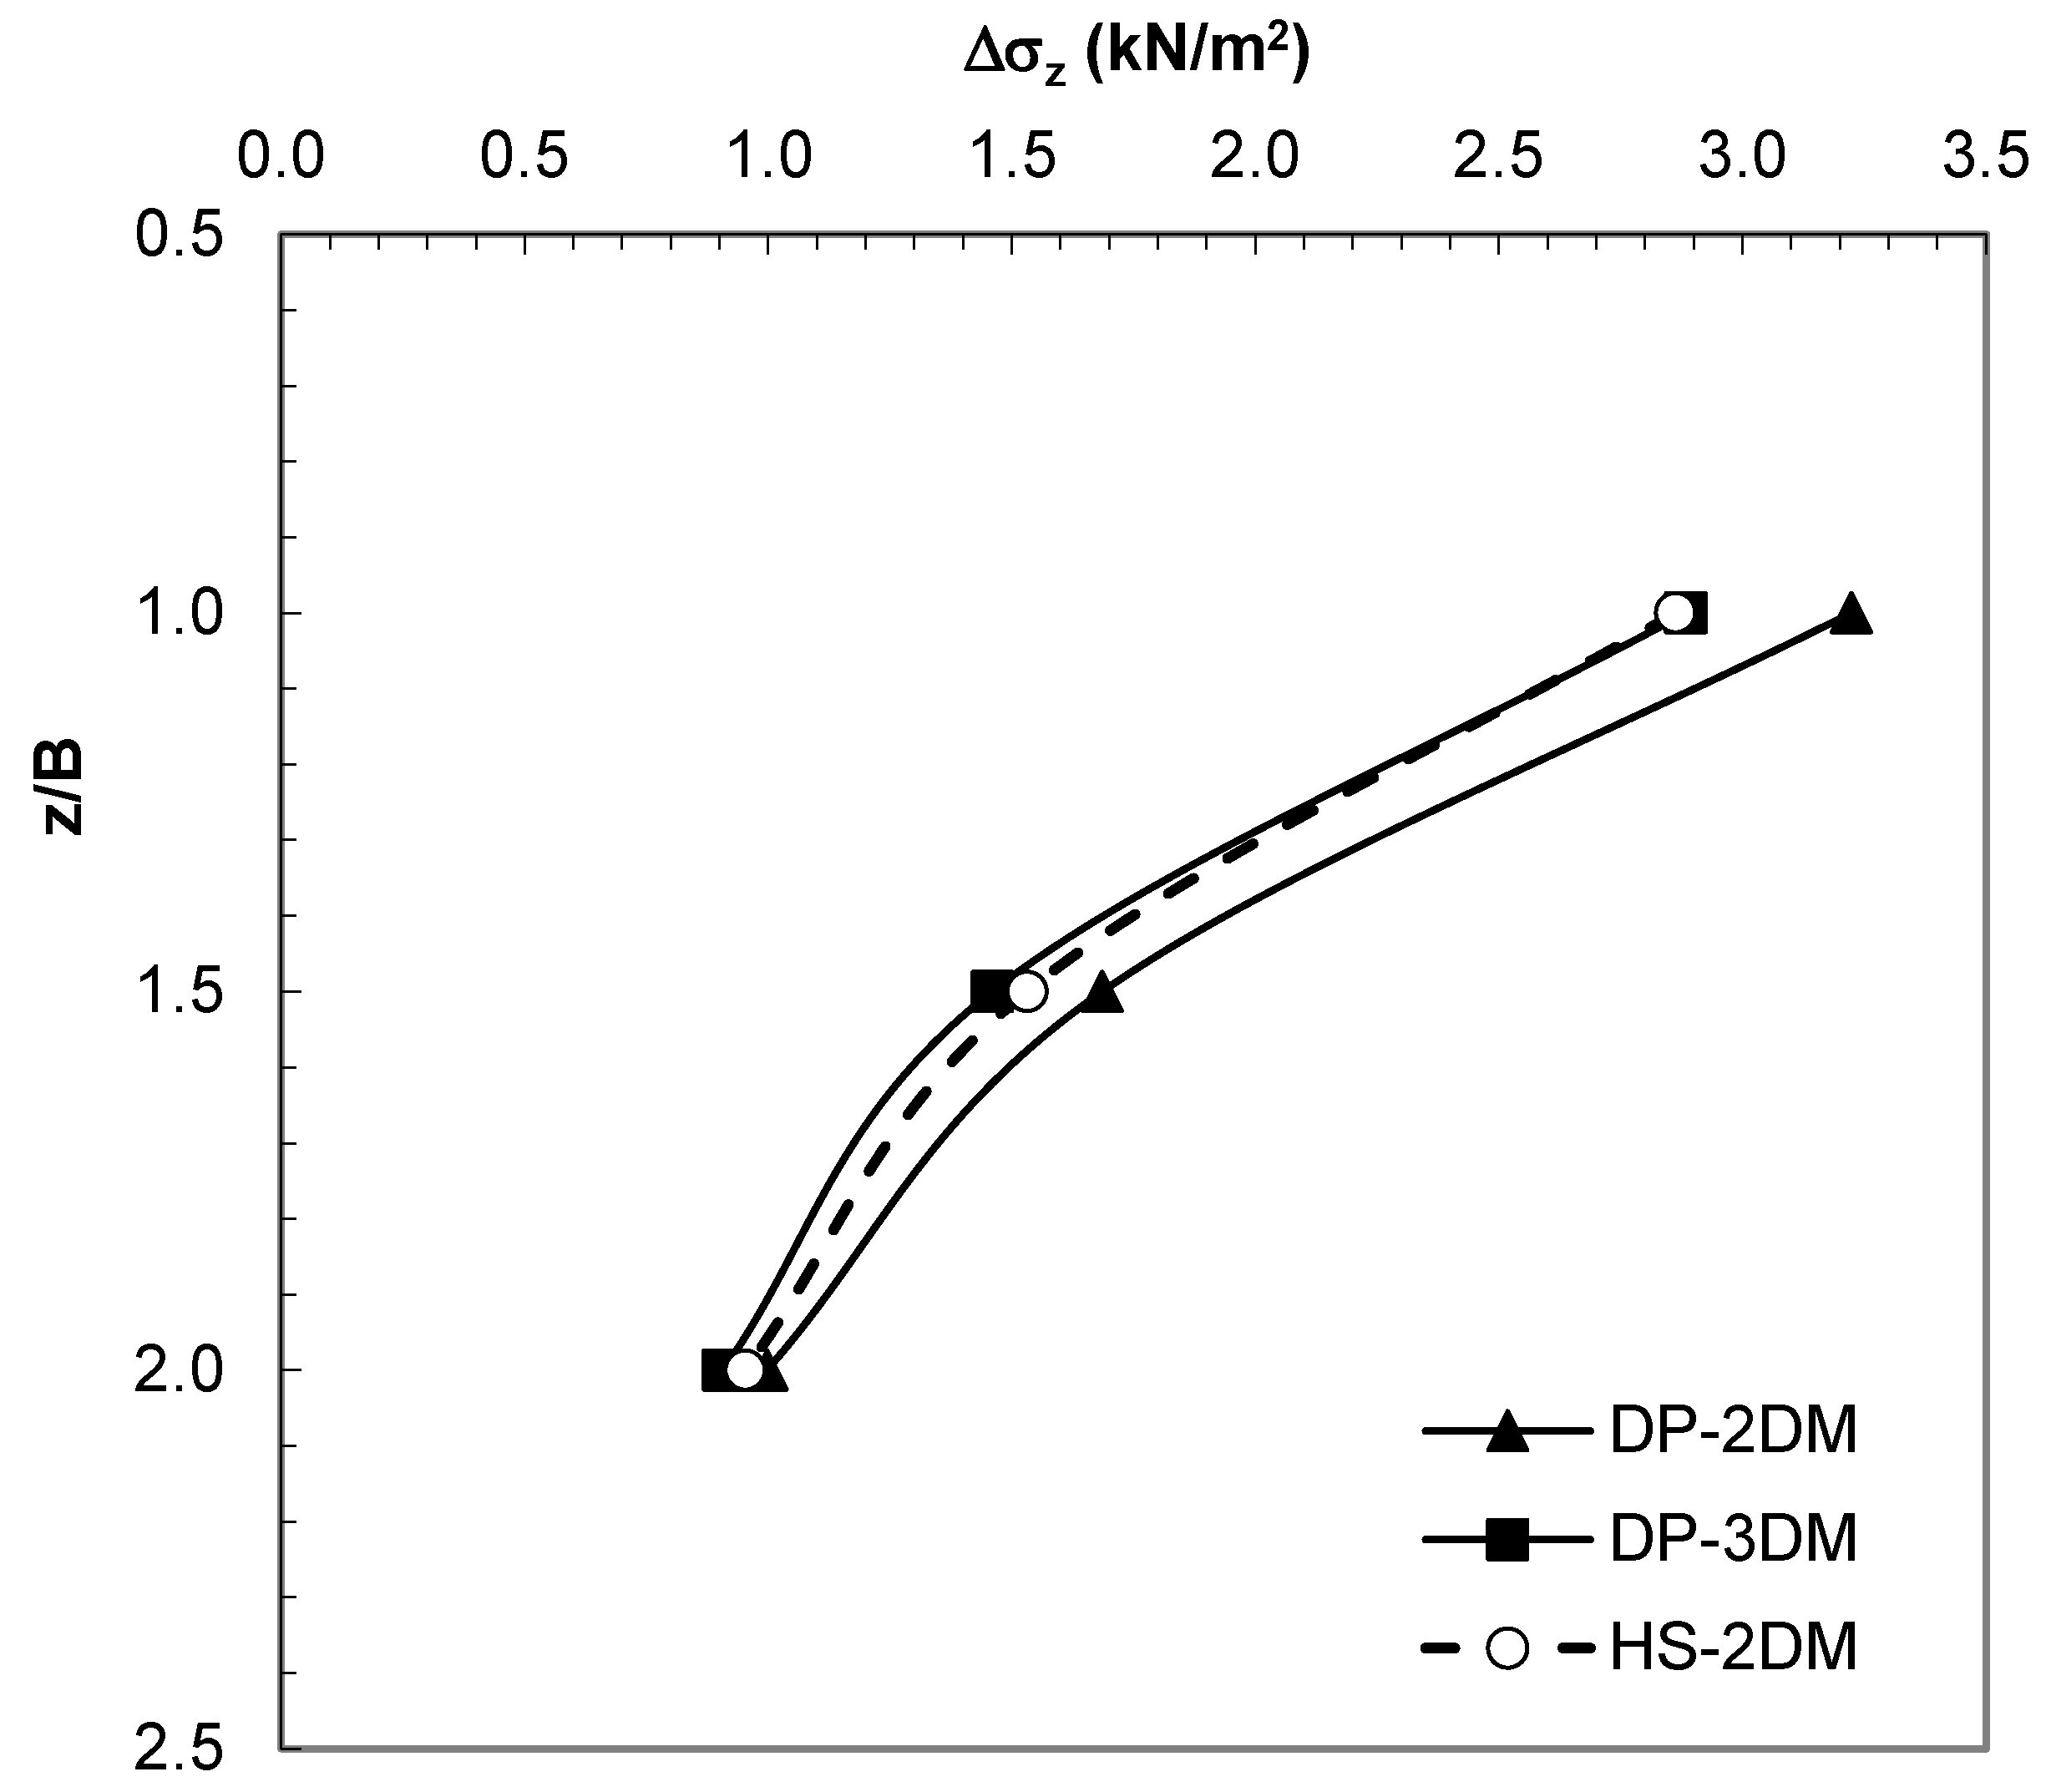
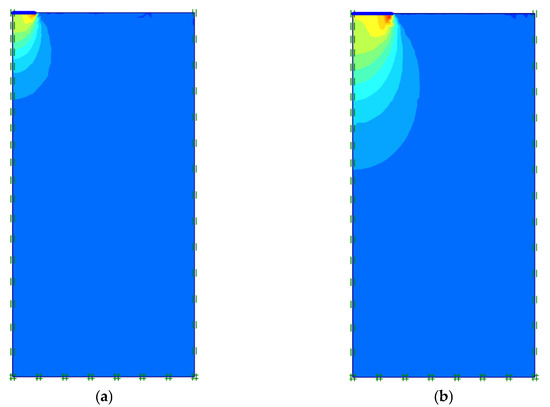
Figure 16.
Vertical stress distribution with HS model: (a) 85 mm; (b) 150 mm.
Figure 16.
Vertical stress distribution with HS model: (a) 85 mm; (b) 150 mm.

4.4. Analysis of Boundary Effects
In the study, the vertical stress values in the sand due to circular loads were obtained by using the experimental setup dimensions (70 × 70 × 70 cm) as the soil geometry in numerical analysis.
In order to determine whether the vertical stress values obtained are affected by the model geometry, a two-dimensional analysis of the boundary effect on the 150 mm circular foundation was performed using twice the dimensions of the test box (Figure 17 and Figure 18).
When Figure 17 is examined, it is seen that there is only less than 1% between the vertical stress values when the dimensions twice the model geometry are used. Considering the circular load values applied to the sand soil in the experiments, it can be said that the difference is negligible.
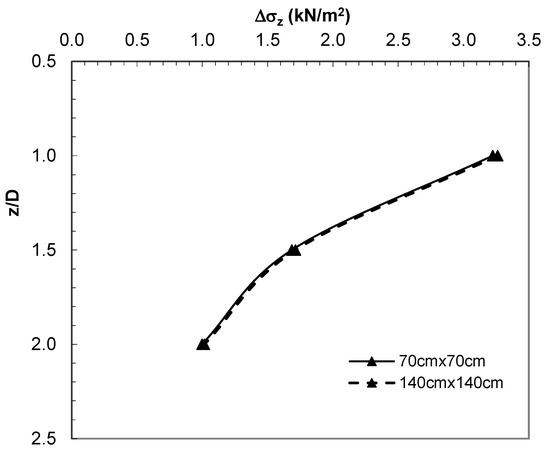
Figure 17.
Vertical stress values obtained from analysis of the boundary effect.
Figure 17.
Vertical stress values obtained from analysis of the boundary effect.
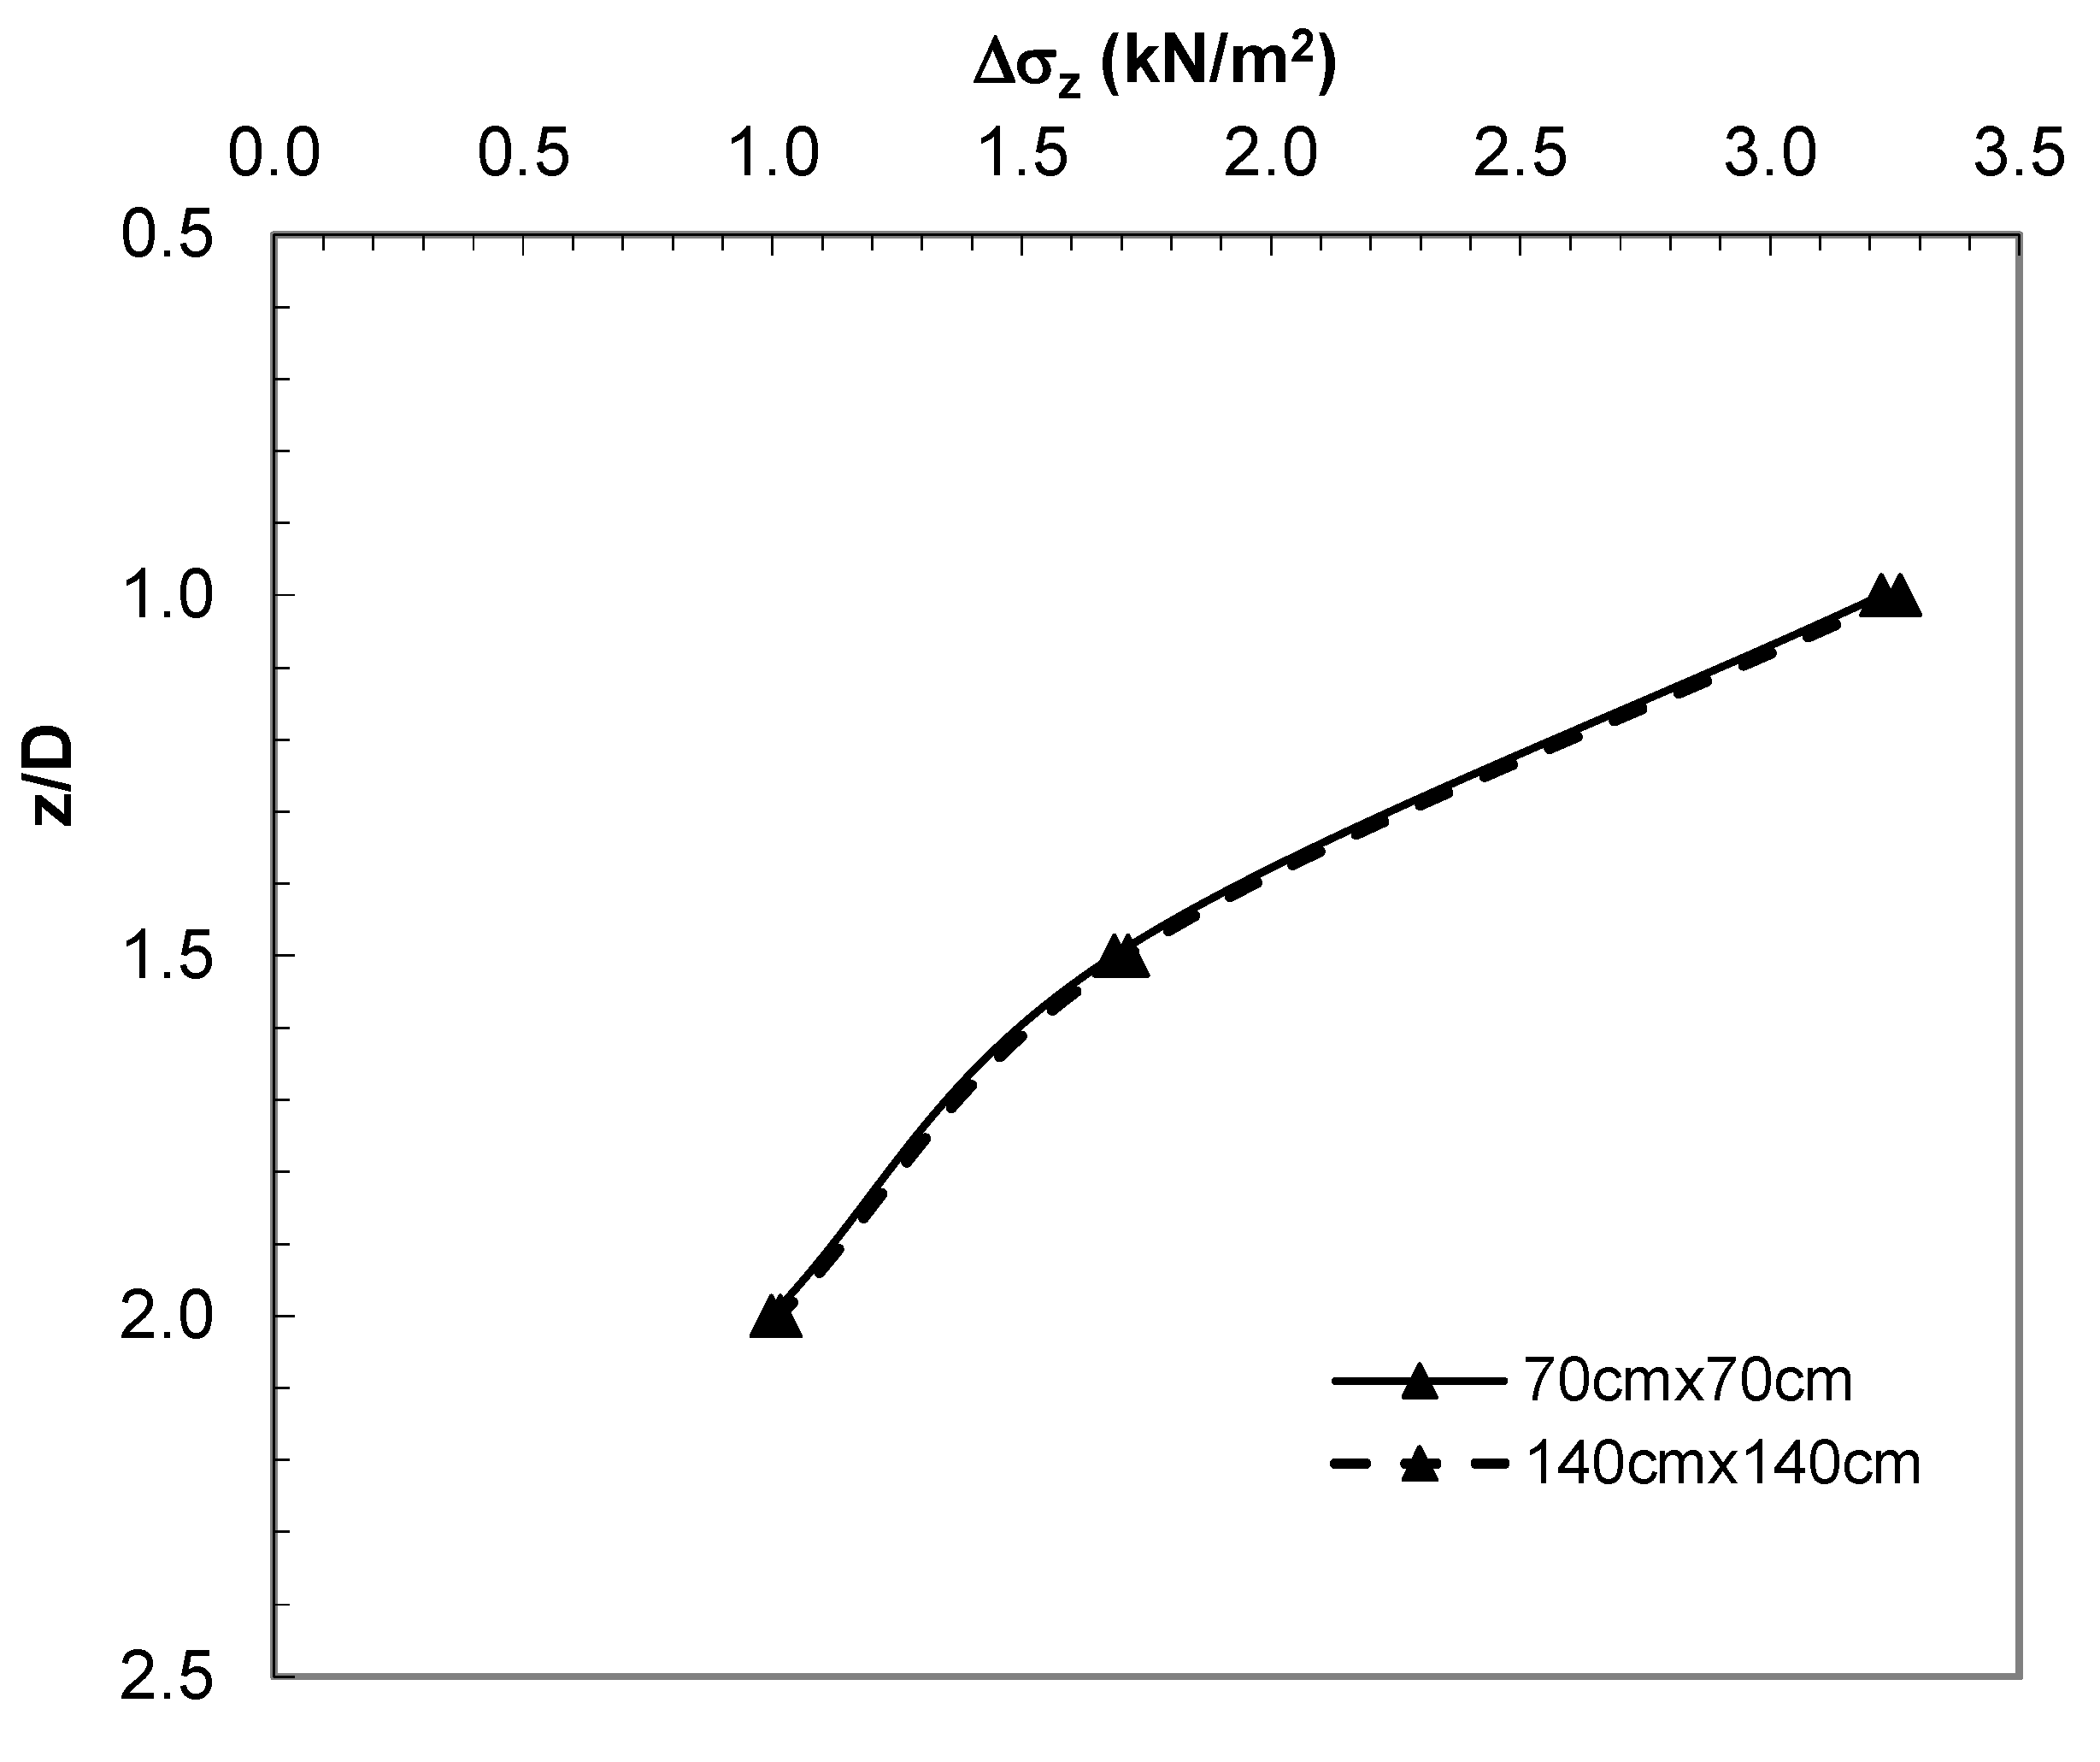
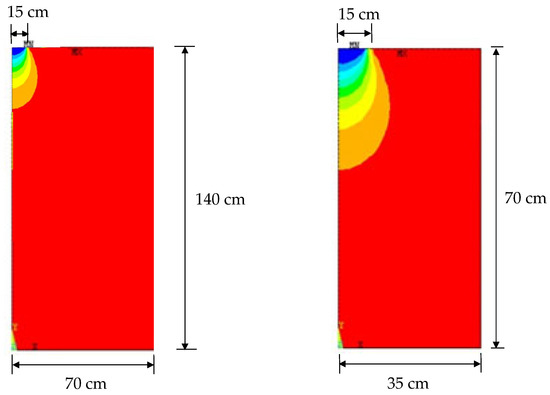
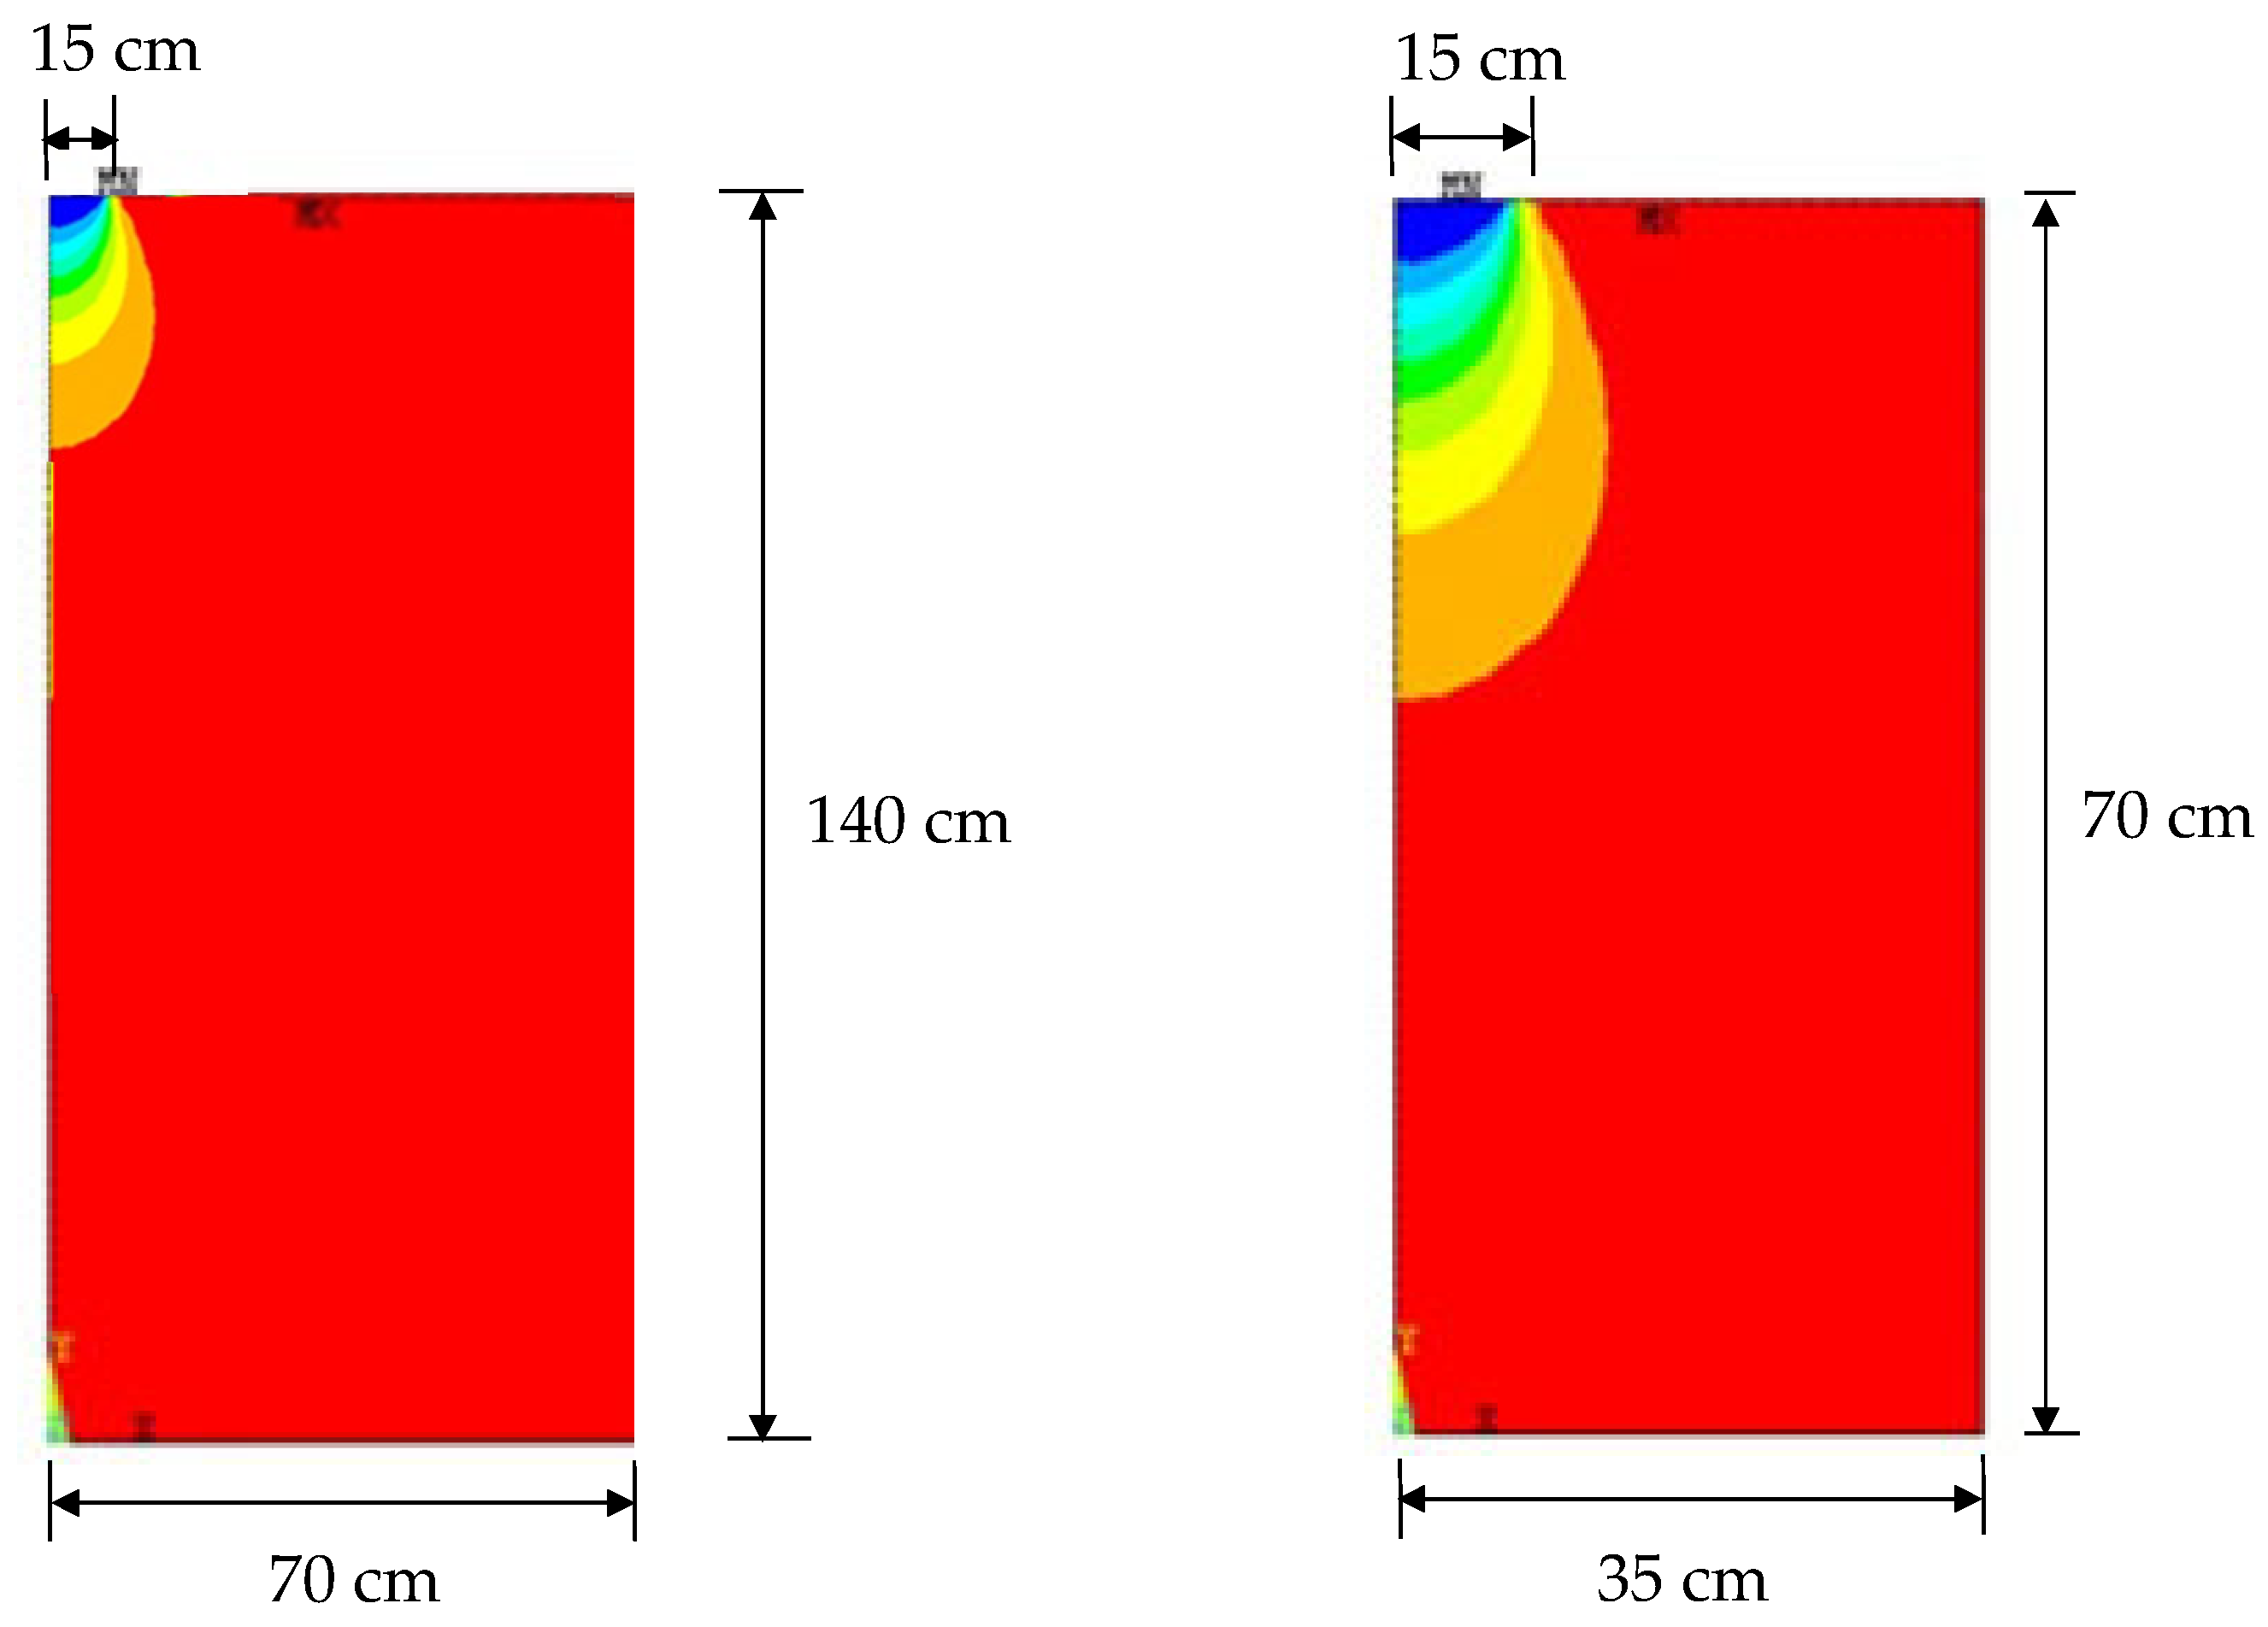
Figure 18.
Distribution of vertical stresses obtained from analysis of the boundary effect.
Figure 18.
Distribution of vertical stresses obtained from analysis of the boundary effect.
4.5. Parametric Study
In order to obtain vertical stress values at depths that could not be measured in model experiments, an additional parametric study was carried out with the finite element method, and the results were compared with the Boussinesq solution. Furthermore, a circular footing with a diameter of D = 200 mm was analyzed using 2DM and 3DM, and the vertical stresses were obtained.
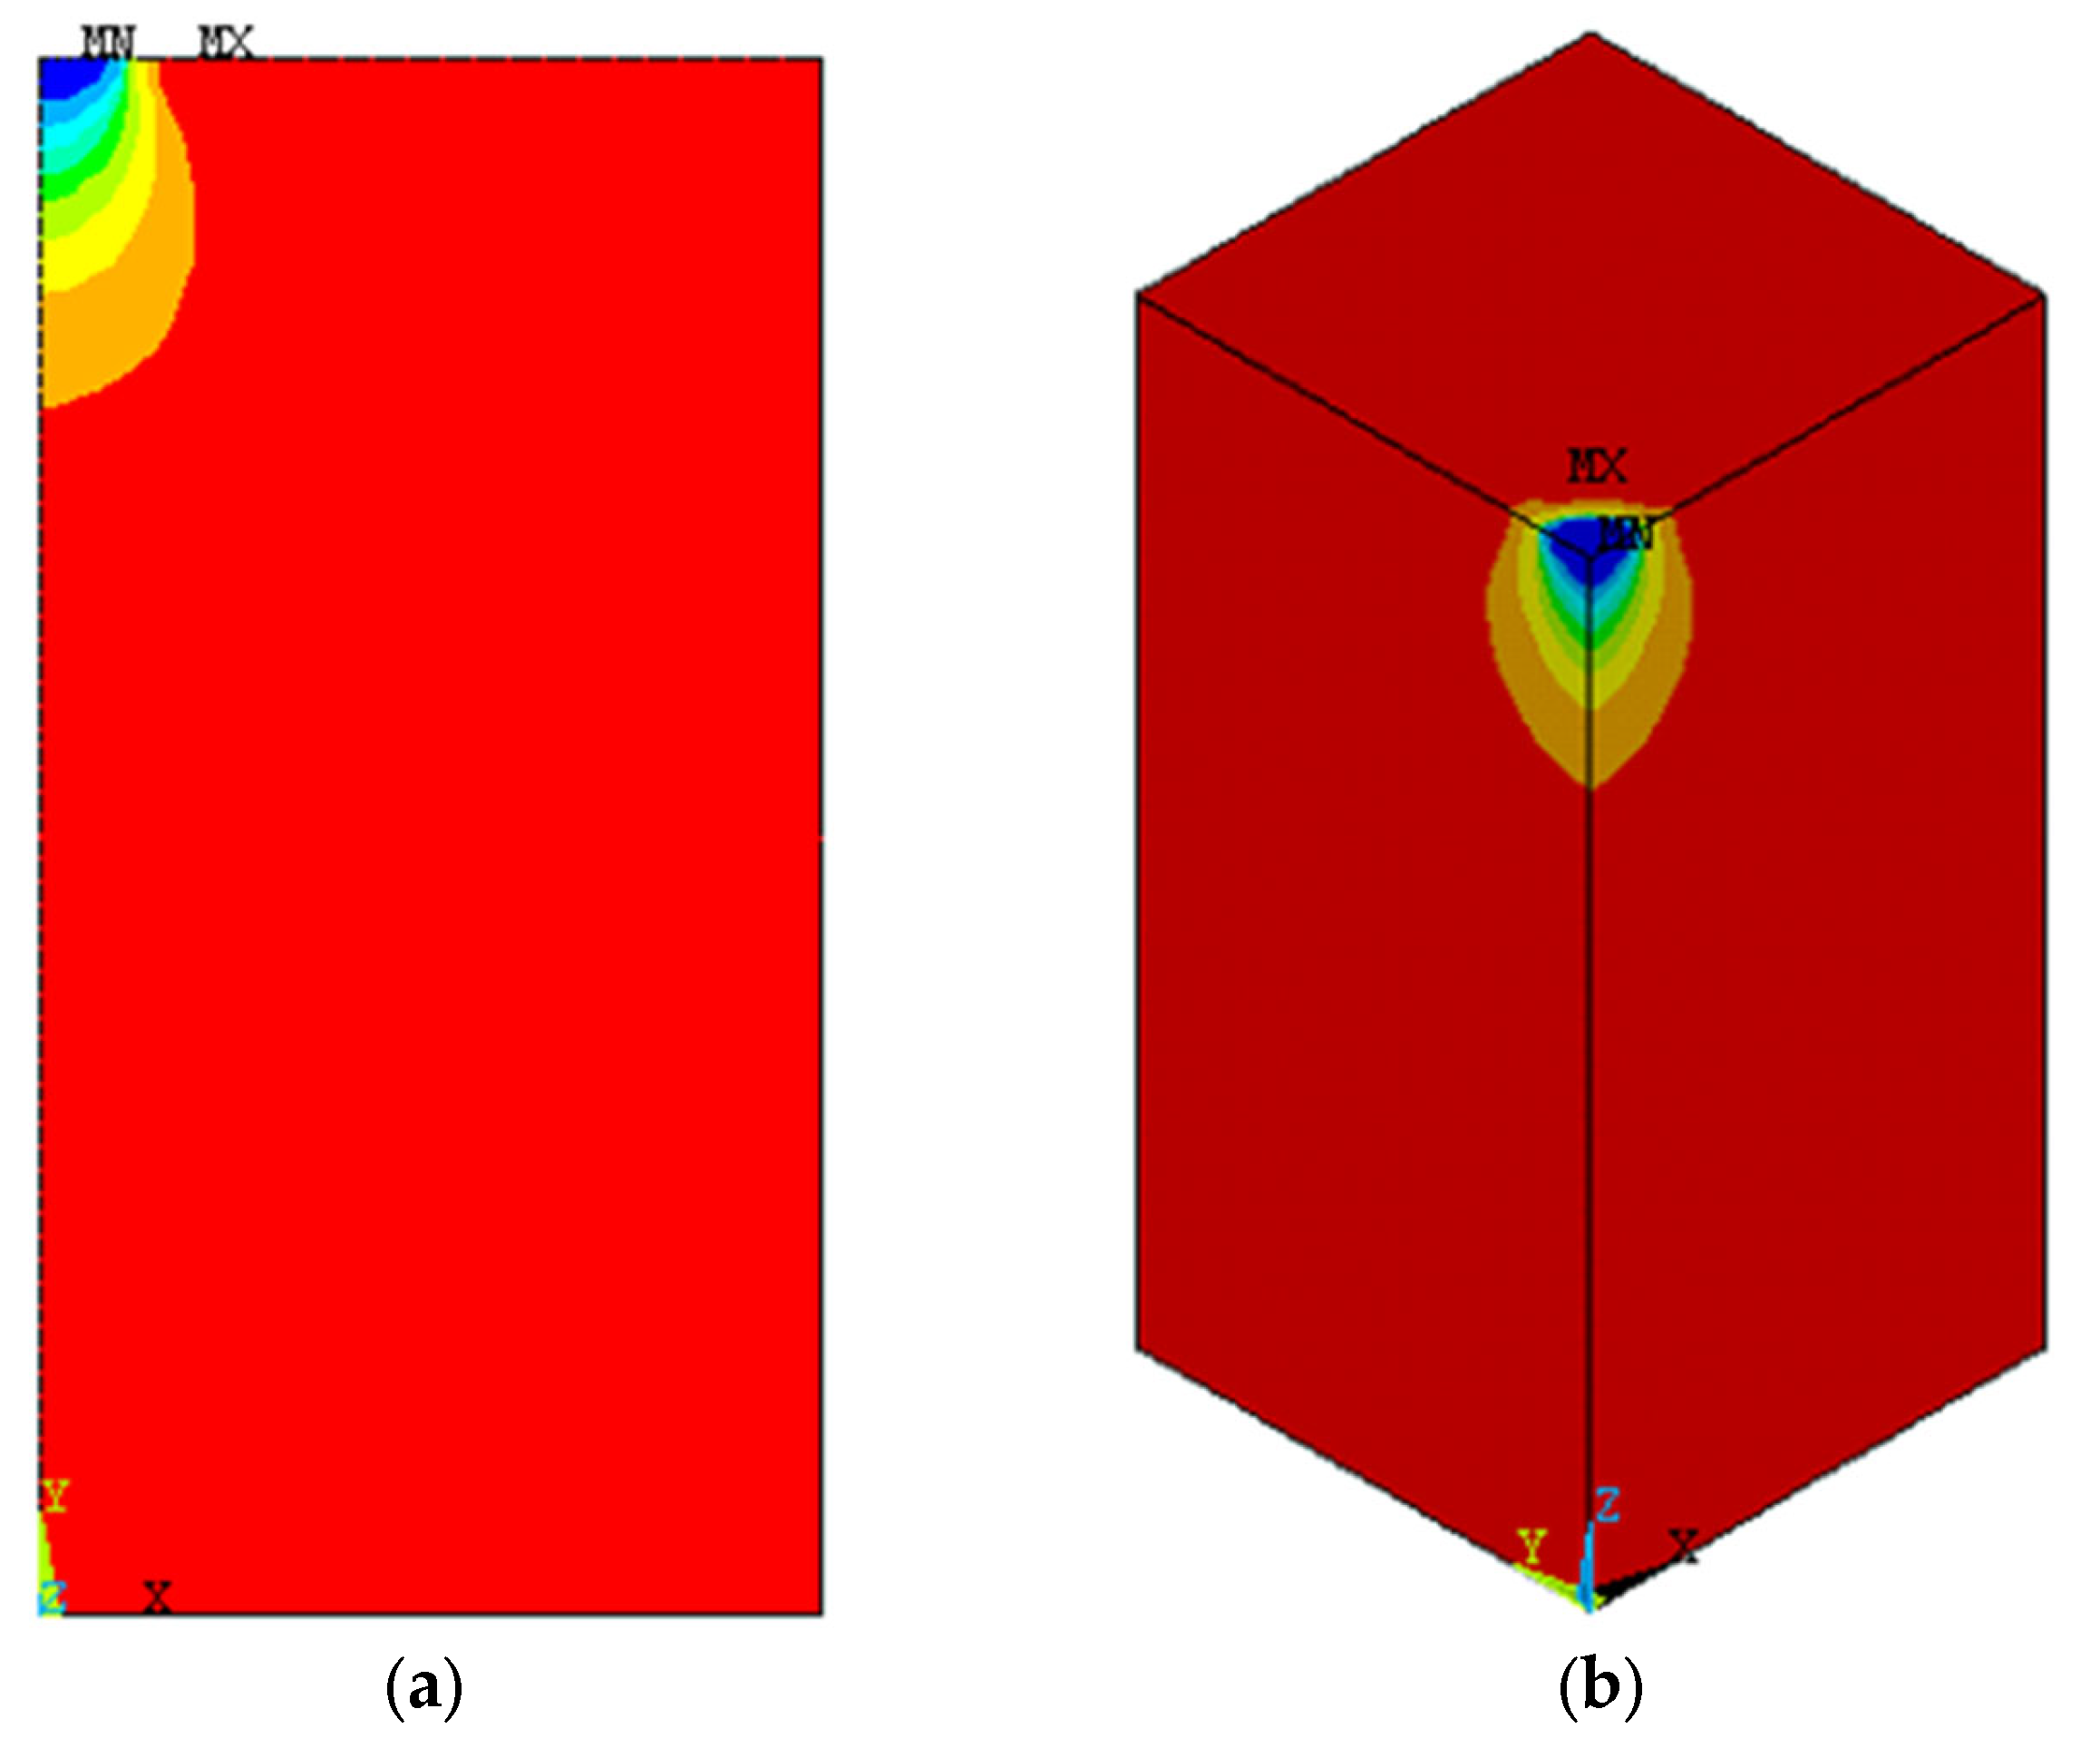
Figure 19 shows the vertical stresses beneath the center of the 85 mm circular footing at various depths. As seen in the figure, numerical analysis results are close to the results of Boussinesq’s method in both models, especially at shallow depths. Figure 20a,b show contours of vertical stress beneath the circular footing calculated using the finite element method for 2DM and 3DM, respectively.

Figure 19.
Vertical stress distribution (D = 85 mm).

Figure 20.
Vertical stresses beneath the 85 mm circular footing: (a) 2DM; (b) 3DM.
Figure 21 shows the vertical stresses beneath the center of the 150 mm circular footing. As seen in the figure, the results are more or less similar, but the results of 2DM are slightly higher than the 3DM and Boussinesq’s results. It can be concluded that Boussinesq’s results are close to the 3DM results at shallow depths and are considerably smaller, especially at depths greater than z = 2.0 D.

Figure 21.
Vertical stress distribution (D = 150 mm).
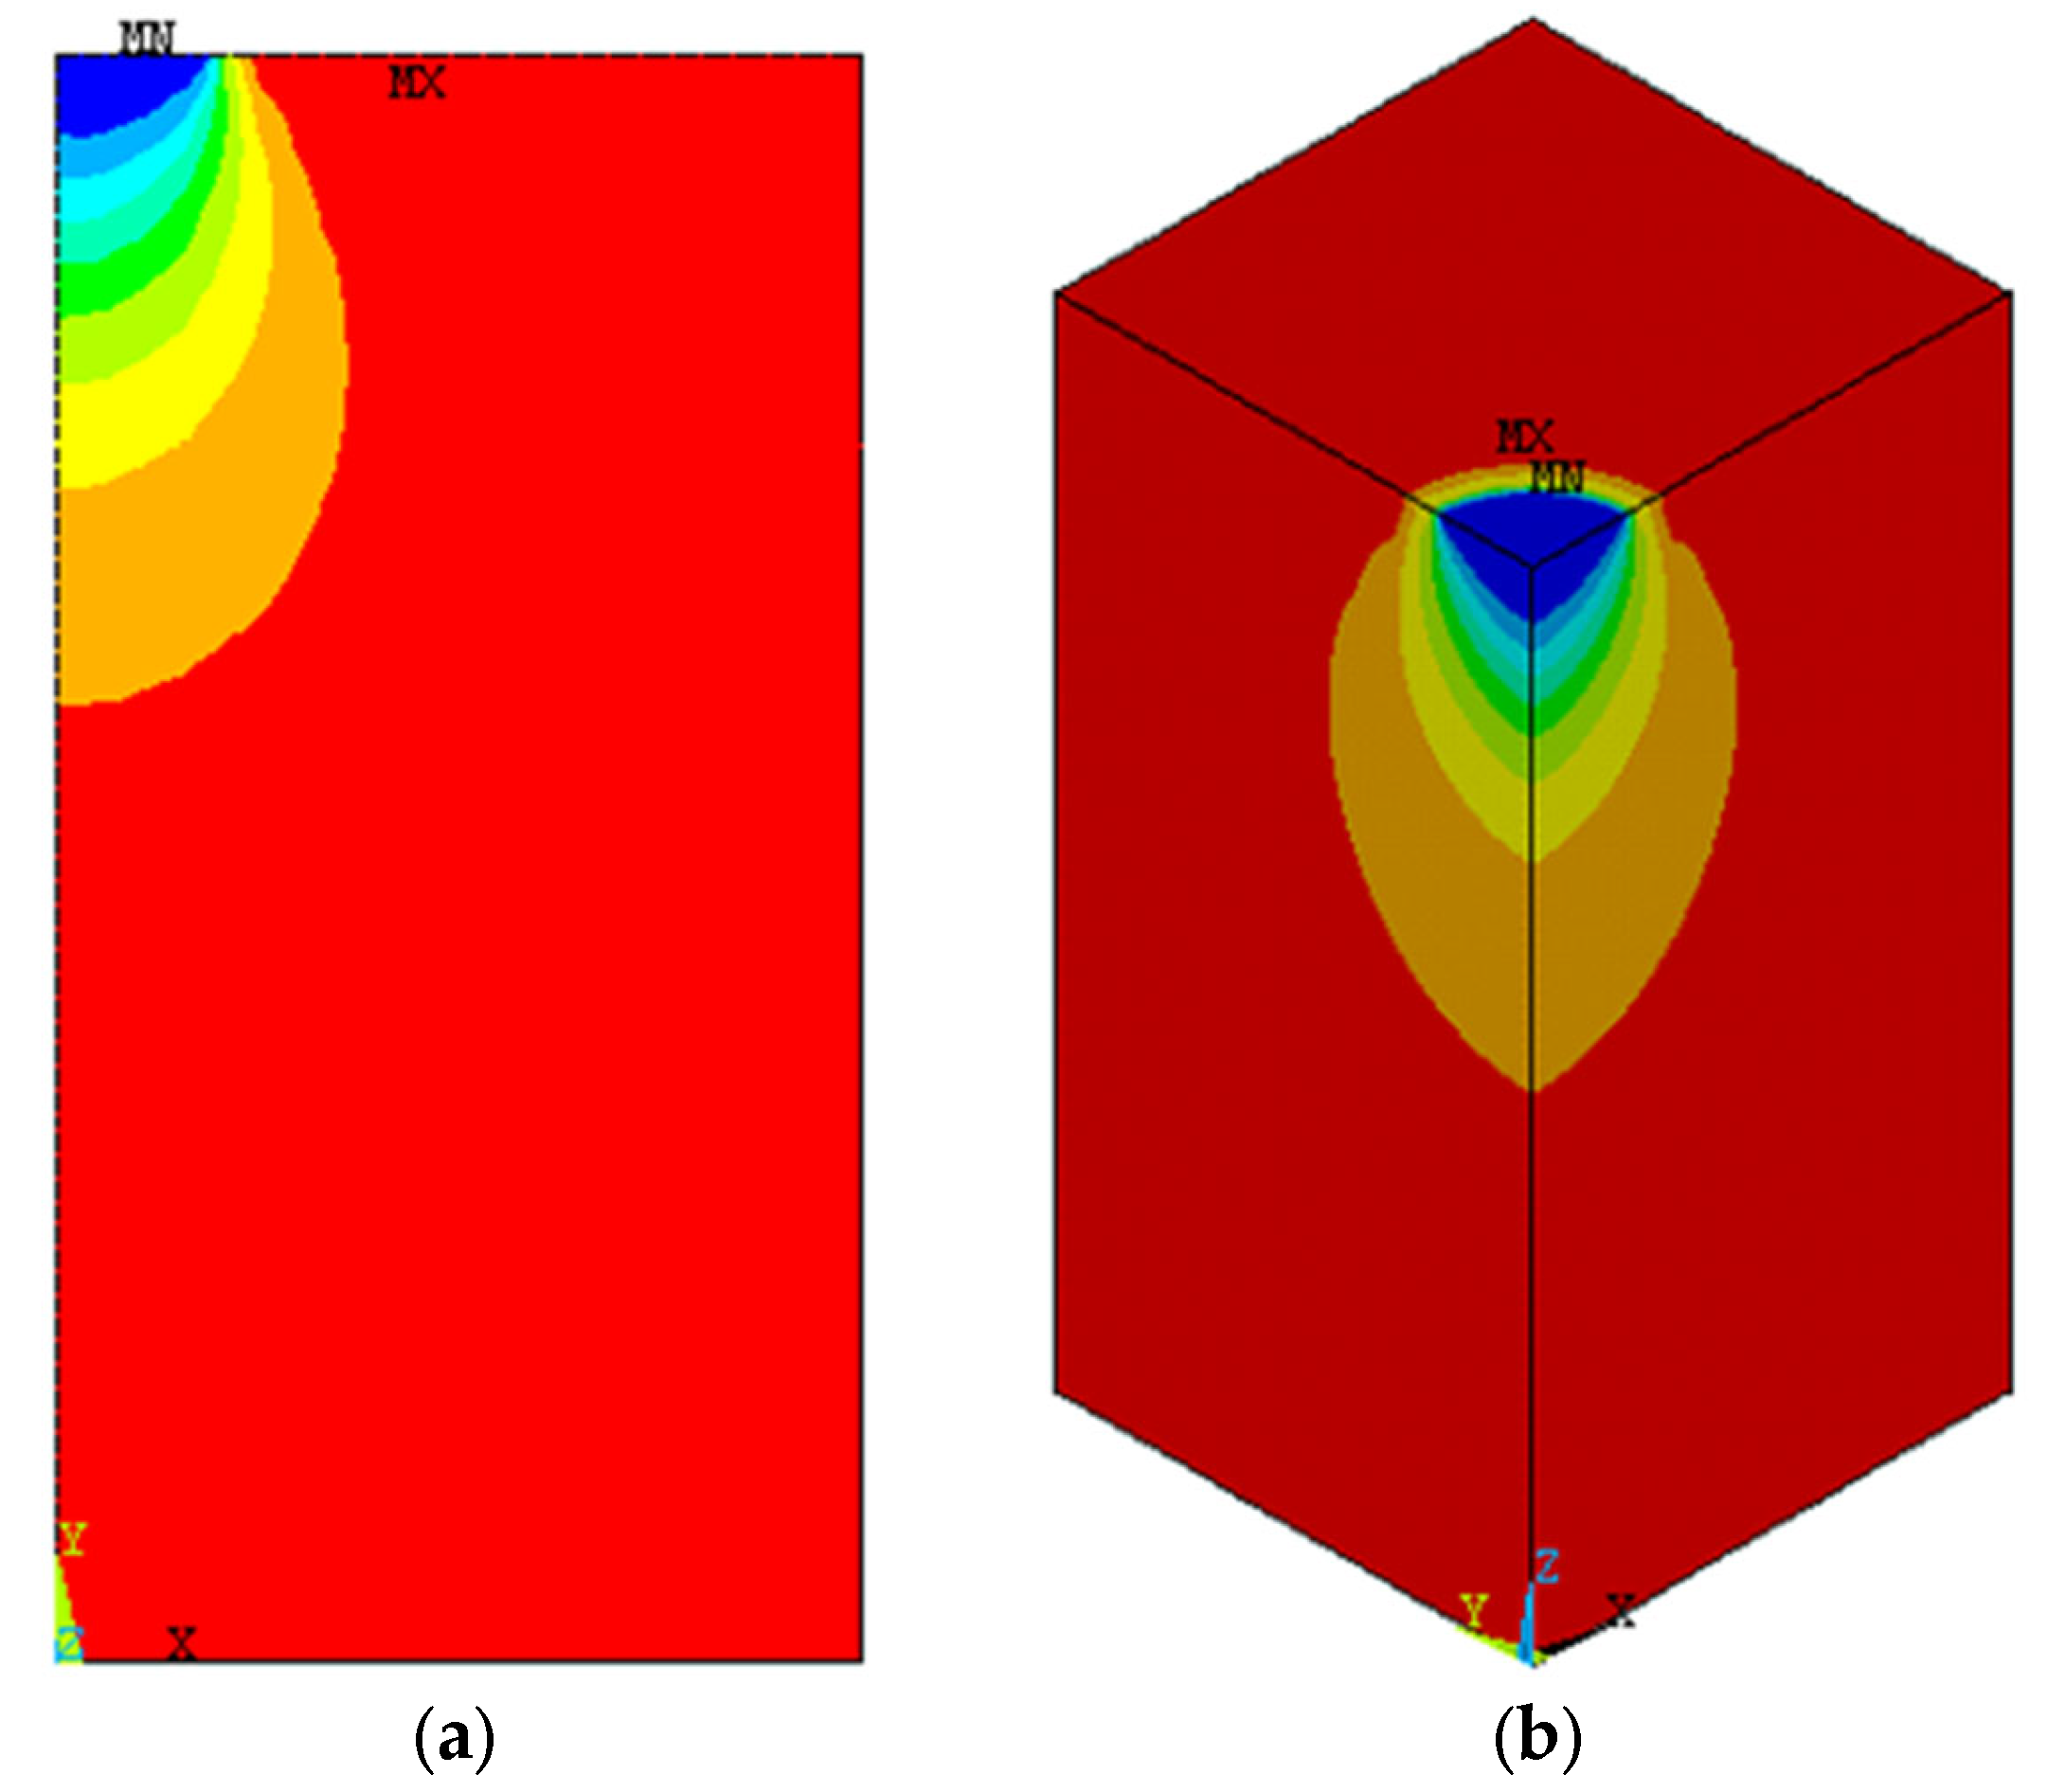
Figure 22a,b shows contours of vertical stress beneath the circular footing calculated using 2DM and 3DM, respectively.

Figure 22.
Vertical stresses beneath the 150 mm circular footing: (a) 2DM; (b) 3DM.
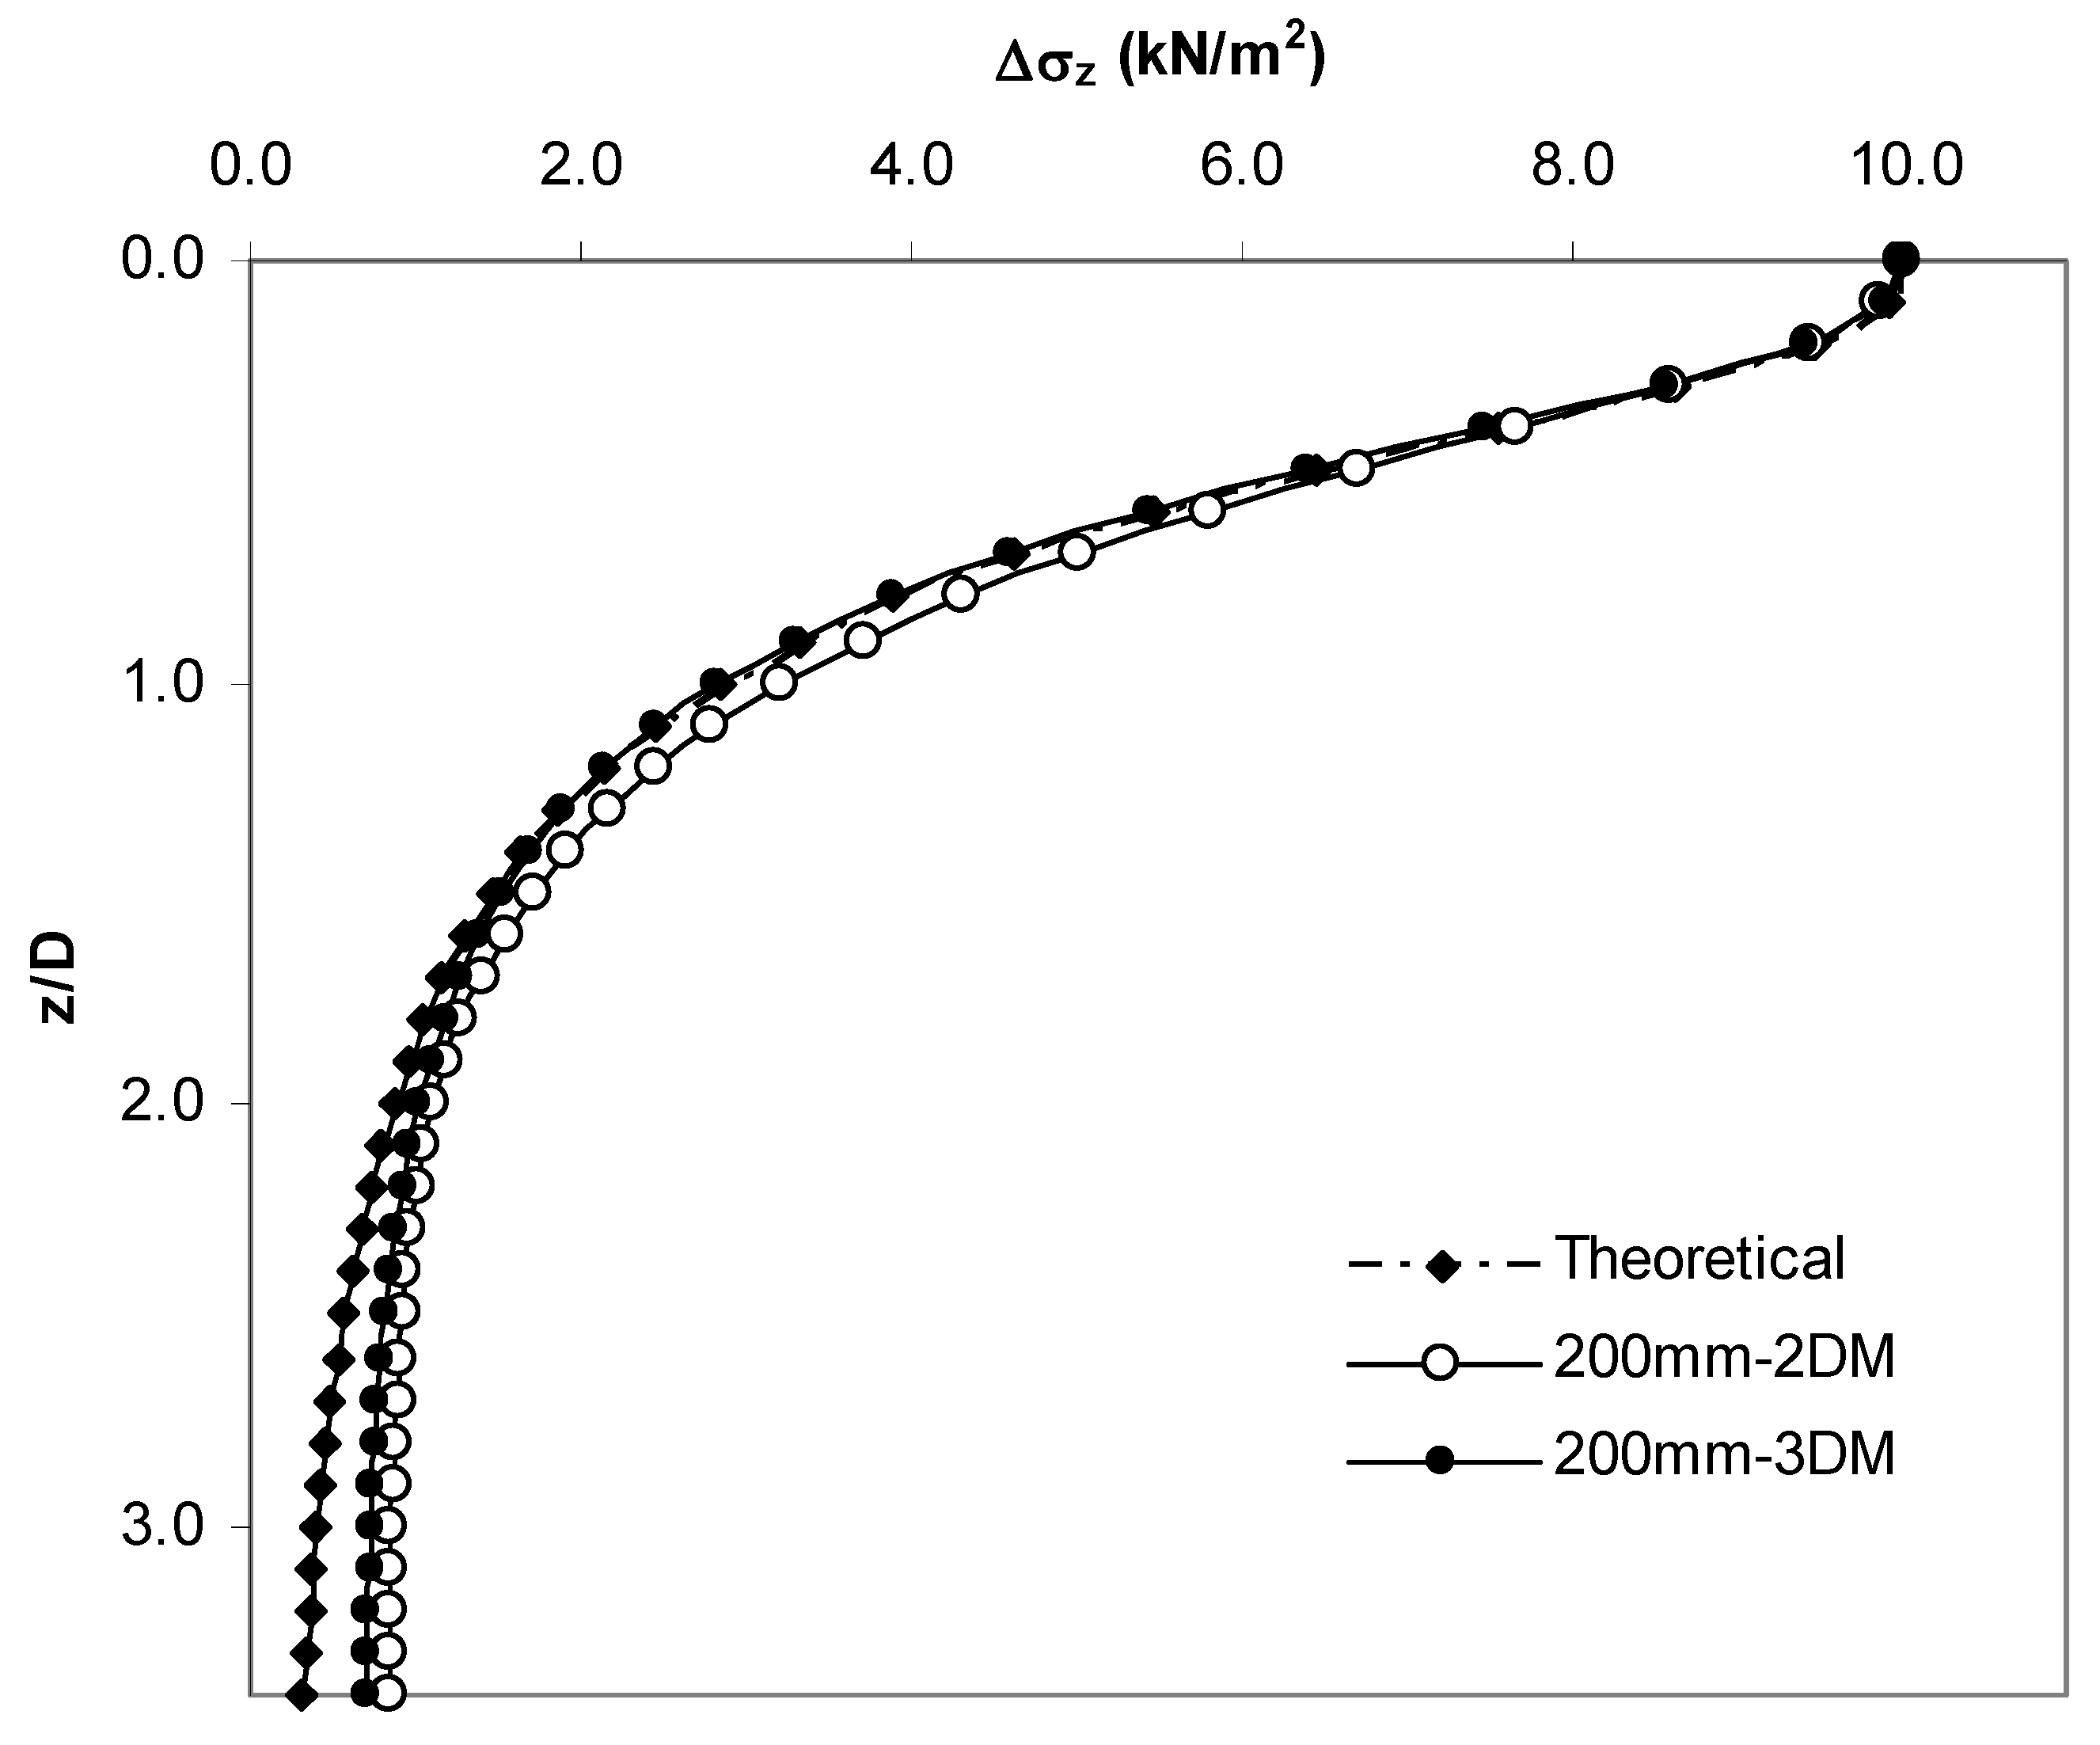
Figure 23 shows the vertical stresses beneath the center of the 200 mm circular footing. It can be seen that the behavior of the vertical stress distribution is similar to the results of the 150 mm footing. Boussinesq’s results show good agreement with the results of the 3DM at shallow depths and that they are considerably smaller at depths greater than z = 2.0 D. The results of the 2DM are higher than the results of the Boussinesq and 3DM at all depths.

Figure 23.
Vertical stress distribution (D = 200 mm).
5. Conclusions
The vertical stress distribution beneath the circular footings on sand were investigated experimentally and numerically. The obtained results were compared with Boussinesq’s solution. Based on the results of this research, the following main conclusions can be drawn:
- The vertical stress distribution in horizontal planes at depth z from the footing base shows the same characteristic form in all the methods presented in this study, and the vertical stresses beneath the centerline of the model footing decrease as the depth increases.
- Experimental results obtained from the laboratory tests show that the zone where the measured vertical stress value is 10% of the applied load is approximately 2.0 D (two times the footing diameter), and this is consistent with numerical and theoretical solutions.
- Test results show that at the same ratio of z/D, vertical stress values increase with increasing the diameter of the footing under the same plate load, especially at shallow depths. It can be concluded that if two footings of various sizes subjected to the constant stress level are placed on the same sand with the same density, the vertical stresses beneath these two footings will be different. In other words, the larger footing produces a greater stress bulb than the smaller footing. The bigger footing produces a larger stress bulb than the smaller footing does. This behavior is observed in numerical analyses of both 2DM and 3DM but not in Boussinesq’s solution because it does not take into account the footing size.
- According to the results of the model tests performed at different footing diameters for the same applied stress, beneath the center line of the 150 mm diameter circular footing, compared to the 85 mm diameter circular footing, higher vertical stress values were obtained at the rate of 20% at 1.0 D, 12.5% at 1.5 D and 1% at 2.0 D depth.
- Considering the results of the numerical analysis performed at different footing diameters for the same applied stress, the vertical stress values were obtained beneath the centerline of the 150 mm diameter circular footing, up to 2.4% higher in the 2D model and up to 12% in the 3D model, compared to the 85 mm diameter circular footing.
- Differences of up to 13% were observed between the vertical stress values obtained by the experimental and Boussinesq method.
- Based on the numerical results from the parametric study, it appears that the 2DM results are greater than the 3DM results at all depths for three circular footings of different diameters.
- According to the results obtained from the parametric study, Boussinesq and numerical results give relatively close values up to 2.0 D depth, while the Boussinesq method gives lower vertical stress values than the numerical results at depths greater than 2.0 D.
- The vertical stress values obtained from 2DM and 3DM analyses are tolerably different from each other, and they both give conservative results. Because of the difficulty of the 3D modeling and because it normally takes a longer time to solve, it can be concluded that the 2D axisymmetric model can be suggested to be sufficiently appropriate in the solution of vertical stress increment problems.
- As a result of the analyses carried out to determine the effect of the material model on the vertical stresses, it was determined that the two-dimensional HS model results were quite close to the three-dimensional DP results and were approximately 5–17% lower than the two-dimensional DP model results depending on the footing diameter and measurement depth.
Author Contributions
Conceptualization, project administration, supervision: M.S.K.; writing—review and editing, and writing—original draft: S.B.; methodology, data curation, software, validation, and formal analysis: M.L. All authors have read and agreed to the published version of the manuscript.
Funding
This research received no external funding.
Institutional Review Board Statement
Not applicable.
Informed Consent Statement
Not applicable.
Data Availability Statement
Not applicable.
Conflicts of Interest
The authors declare no conflict of interest.
References
- Boussinesq, J. Application des Potentiels a L’etude de L’equilbre et du Movement des Solids Elastiques; Gauthier-Villars: Paris, France, 1885. [Google Scholar]
- Foster, C.R.; Ahlvin, R.E. Stresses and deflections induced by a uniform circular load. In Proceedings of the Thirty-Third Annual Meeting of the Highway Research Board, Washington, DC, USA, 12–15 January 1954; Volume 33, pp. 467–470. [Google Scholar]
- Ahlvin, R.E.; Ulery, H.H. Tabulated values for determining the complete pattern of stresses, strains, and deflections beneath a uniform circular load on a homogeneous half space. In Proceedings of the 41st Annual Meeting of the Highway Research Board, Washington, DC, USA, 8–12 January 1962; Volume 342, pp. 1–13. [Google Scholar]
- Westergaard, H.M. A problem of elasticity suggested by a problem in soil mechanics, soft material reinforced by numerous strong horizontal sheets. In Mechanics of Solids; Newyork-Mac Millan: New York, NY, USA, 1938; pp. 268–277. [Google Scholar]
- Koegler, D.P.; Scheidig, A. Baugrund und Bauwerk; Ernst und Shon: Berlin, Germany, 1938. [Google Scholar]
- Charles, J.A. The depth of influence of loaded areas. Geotechnique 1996, 46, 51–61. [Google Scholar] [CrossRef]
- Morgan, J.R.; Gerrard, C.M. Behavior of sands under surface loads. J. Soil Mech. Found. Div. 1971, 97, 1675–1699. [Google Scholar] [CrossRef]
- Burland, J.B.; Broms, B.B.; De Mello, V.F.B. Behaviour of foundations and structures. In Proceedings of the 9th International Conference on Soil Mechanics and Foundation Engineering, Tokyo, Japan, 10–15 July 1977; pp. 495–538. [Google Scholar]
- Balakrishna, C.K.; Murthy, B.S.; Nagaraj, T.S. Stress distribution beneath rigid circular foundations on sands. Int. J. Numer. Anal. Methods Geomech. 1992, 16, 65–72. [Google Scholar] [CrossRef]
- Algin, H.M. Stresses from linearly distributed pressures over rectangular areas. Int. J. Numer. Anal. Methods Geomech. 2000, 24, 681–692. [Google Scholar] [CrossRef]
- Lim, J.S. An Experimental investigation of Boussinesq’s theoretical value of vertical stress increment in sandy soil mass caused by surface strip loading. KSCE J. Civ. Eng. 2004, 20, 5–15. [Google Scholar]
- Keskin, M.S.; Laman, M.; Baran, T. Experimental determination and numerical analysis of vertical stresses under square footings resting on sand. Turk. J. Civ. Eng. 2008, 19, 1263–1279. [Google Scholar]
- Onah, H.N.; Mama, B.O.; Nwoji, C.U.; Ike, C.C. Boussinesq displacement potential functions method for finding vertical stresses and displacement fields due to distributed load on elastic half space. Electron. J. Geotech. Eng. 2017, 22, 5687–5709. [Google Scholar]
- Cicek, E.; Guler, E.; Yetimoglu, T. Stress distribution below a continuous footing on geotextile-reinforced soil. Int. J. Geomech. 2018, 18, 06018005. [Google Scholar] [CrossRef]
- Ateş, B.; Şadoglu, E. Vertical stress distribution in reinforced sandy soil in plane strain conditions. Turk. J. Civ. Eng. 2020, 31, 9967–9985. [Google Scholar]
- Gebremariam, F.; Tanyu, B.F.; Christopher, B.; Leshchinsky, D.; Han, J.; Zornberg, J.G. Evaluation of vertical stress distribution in field monitored GRS-IBS structure. Geosynt. Int. 2020, 27, 414–431. [Google Scholar] [CrossRef]
- Giwangkara, G.G.; Mohamed, A.; Nor, H.M.; Khalid, N.H.A. The analysis of stress distribution on the physical model of road base layer. Int. J. Integr. Eng. 2020, 12, 348–355. [Google Scholar]
- Frazee, G.R. New formulations of Boussinessq solution for vertical and lateral stresses in soil. Pract. Period. Struct. Des. Constr. 2021, 26, 06021001. [Google Scholar] [CrossRef]
- Lu, A.Z.; Zhang, N.; Liu, Y.; Sha, X. Analytic solutions for stress and displacement of a compressible soil layer above bedrock. Int. J. Geomech. 2021, 21, 04021232. [Google Scholar] [CrossRef]
- Useche-Infante, D.; Aiassa-Martínez, G.; Arrúa, P.; Eberhardt, M. Scale model to measure stress under circular footings resting on sand. Int. J. Geotech. Eng. 2018, 15, 877–886. [Google Scholar] [CrossRef]
- Singhai, S.; Vikash, G. Uncertainties in vertical stress distribution in spatially varying random elastic half-space. Int. J. Geomech. 2022, 22, 04022035. [Google Scholar] [CrossRef]
- ANSYS Inc. ANSYS-Engineering Analysis System V10; ANSYS Inc.: Canonsburg, PA, USA, 2006. [Google Scholar]
- Brinkgreeve, R.J.B. (Ed.) Plaxis User Manual, 2D Version8; Delft University of Technology & PLAXIS: Delft, The Netherlands, 2002. [Google Scholar]
- ASTM D422-63; Standard Test Method for Particle Size Analysis of Soils. American Standard for Testing Materials: West Conshohocken, PA, USA, 2002.
- Keskin, M.S. Stress Analysis of Soils with Various Methods. Master’s Thesis, Cukurova University, Adana, Turkey, 2004. [Google Scholar]
- ASTM D3080; Standard Test Method for Direct Shear Test of Soils under Consolidated Drained Conditions (1985 Annual Book of ASTM Standards, Sect. 4, Vol. 04.08. Soil and Rock Building Stones). American Society for Testing and Materials: West Conshohocken, PA, USA, 2011.
- ASTM D7181-20; Standard Test Method for Consolidated Drained Triaxial Compression Test for Soil. American Standard for Testing Materials: West Conshohocken, PA, USA, 2020.
- Duncan, M.; Chang, C.Y. Nonlinear analysis of stress and strain in soils. J. Soil Mech. Found. Div. 1970, 96, 1629–1653. [Google Scholar] [CrossRef]
- Dickin, E.A.; Laman, M. Uplift response of strip anchor in cohesionless soil. Adv. Eng. Softw. 2007, 38, 618–625. [Google Scholar] [CrossRef]

Disclaimer/Publisher’s Note: The statements, opinions and data contained in all publications are solely those of the individual author(s) and contributor(s) and not of MDPI and/or the editor(s). MDPI and/or the editor(s) disclaim responsibility for any injury to people or property resulting from any ideas, methods, instructions or products referred to in the content. |
© 2023 by the authors. Licensee MDPI, Basel, Switzerland. This article is an open access article distributed under the terms and conditions of the Creative Commons Attribution (CC BY) license (https://creativecommons.org/licenses/by/4.0/).