Article

Hilbert–Huang-Transform-Based Seismic Intensity Measures for Rocking Response Assessment

by
Kosmas E. Bantilas
,
Ioannis E. Kavvadias
,
Magdalini Tyrtaiou
and
Anaxagoras Elenas
*
Department of Civil Engineering, Institute of Structural Statics and Dynamics, Democritus University of Thrace, 67100 Xanthi, Greece
*
Author to whom correspondence should be addressed.
Appl. Sci. 2023, 13(3), 1634; https://doi.org/10.3390/app13031634
Submission received: 17 December 2022 / Revised: 19 January 2023 / Accepted: 24 January 2023 / Published: 27 January 2023
(This article belongs to the Special Issue Seismic Assessment and Design of Structures: Volume 2)

Abstract

:
Structures that can uplift and rock under severe seismic excitations present remarkable stability without exhibiting damage. As such, rocking-response-based structural systems constitute a promising design practice. Due to the high nonlinearity of the rocking response, the seismic performance of this class of structures should be evaluated probabilistically. From this point of view, in the present study, the performance of 12 novel HHT-based intensity measures (IMs) in describing the seismic behavior of typical rocking viaducts was assessed based on optimal IM selection criteria. To this end, a comparative evaluation of the performance between the proposed and 26 well-known conventional IMs was presented. Moreover, bivariate IMs were also considered, and seismic fragilities were provided. Finally, the classification of the seismic response was conducted using discriminant analysis, resulting in a reliable and rapid estimation of the maximum seismic demand. Based on the results, it is evident that HHT-based IMs result in an enhanced estimation of the seismic performance of the examined structural system.

1. Introduction

During intense seismic excitations, modern earthquake-resistant structures are expected to respond inelastically. Although this practice is commonly accepted and adopted by the current seismic design codes [1], it may lead to significant losses related to potential rehabilitation in the case of excessive damage occurrence [2]. Since the 1960s, two alternative earthquake-resistant design practices have emerged: seismic isolation and rocking-based structural systems [3]. Structures that can uplift and rock under seismic excitations present remarkable displacement capacities without exhibiting damage. Due to negative stiffness, their response differs substantially from fixed-base or seismic isolated structures [4,5].
The stability of rigid blocks standing free on rigid ground has been a subject of study since Housner’s seminal work [6], in which the factors influencing the rocking response under horizontal excitations were identified. Since then, various rocking-based systems have been investigated, and their unique properties have been highlighted [7,8,9,10,11,12,13,14,15,16,17,18,19,20,21,22]. Along with theoretical studies, rocking-based seismic isolation has been implemented in bridge construction technology [23,24,25,26].
Small changes in structural and ground motion characteristics significantly affect the rocking response. Given the uncertainties regarding the characteristics of seismic excitations, the probabilistic treatment of rocking response emerged [27,28]. Several studies have focused on the seismic fragility assessment of rocking structural systems [29,30,31,32,33,34,35,36]. Additionally, the performance of numerous intensity measures (IMs) in estimating the dynamic response of freestanding blocks and frames has been investigated in order to reduce the variability introduced by seismic excitations [37,38,39,40,41]. It has emerged that rocking motion is strongly governed by size–frequency-scaled phenomena [6,10], which means that it is affected both by the amplitude and the frequency content of the seismic excitation. Even though numerous conventional intensity measures (IMs) present high correlation with the seismic performance of nonrocking oscillators [42,43,44,45,46,47], only a limited number of them capture the size–frequency effect of the rocking response [31,32].
Due to this fact, a robust signal-processing procedure based on the Hilbert–Huang Transform (HHT) [48,49] which qualitatively and quantitatively describes the amplitude and frequency properties of a signal over time is adopted in this study to introduce novel ground motion IMs. HHT-based IMs have been proven promising alternatives, over conventional ones, in the seismic response prediction of reinforced concrete building structures [50,51,52,53,54]. Considering the high nonlinearity of the rocking response and the probabilistic basis of seismic design, seismic response uncertainty reduction is of great importance. As such, in the present research, the performance of conventional and HHT-based IMs in predicting the seismic response of a typical rocking bridge is comparatively evaluated based on optimal IM selection criteria. Fragility analysis is performed using the most optimal bivariate IMs, and analytical expressions are proposed. Finally, discriminant analysis is utilized to provide a reliable and rapid estimation of the maximum seismic demand [55].

2. Methods

2.1. Intensity Measures

2.1.1. HHT-Based IMs

HHT is a powerful signal processing technique used to analyze complex, nonstationary, and nonlinear data sets, such as earthquake ground motion records [48]. The whole process results in the amplitude–frequency–time distribution of the signal.
The HHT algorithm is a two-step procedure consisting of (a) the empirical mode decomposition (EMD) and (b) the Hilbert spectral analysis (HSA). Performing the EMD algorithm, the original signal X(t) is decomposed into a finite set of intrinsic mode functions (IMFs) as follows:
X ( t ) = j = 1 n c j ( t ) + r n
where n is the number of IMF, cj(t) the IMF of mode j, and rn the residual, which is a monotonic function. Subsequently, the Hilbert transform yj(t) is applied to each IMF:
y j ( t ) = p π c j ( τ ) t τ dt
where p refers to the Cauchy principal value. Thus, the analytical signal zj(t) of an IMF is defined as
z j ( t ) = c j ( t ) + y j ( t ) i = a j ( t ) e i θ j ( t )
where aj(t) and θj(t) are the instantaneous amplitude and phase, respectively, defined as follows:
a j ( t ) = c j 2 ( t ) + y j 2 ( t )   and   θ j ( t ) = tan 1 ( y j ( t ) / c j ( t ) )
The instantaneous frequency fj(t) of each IMF is derived as follows:
f j ( t ) = 1 2 π d θ j ( t ) d t
Finally, the initial signal can be reformed as follows:
X ( t ) = j = 1 n a j ( t ) cos ( 2 π f j ( t ) dt )
In the present study, similar to Tyraiou et al. [50,51,52], 12 new HHT-based ground motion IMs are proposed. Primarily, the first parameter is defined by the volume VHHT of each spectrum given by the following equation:
V HHT = 0 f max 0 t max E ( f , t ) dt df
where E(f, t) = a2(f, t) signifies the instantaneous energy, which corresponds to the instantaneous frequency f at a time equal to t, and fmax and tmax are the maximum instantaneous frequency and the total duration of the analytical signal, respectively.
The upper surface SHHT of each Hilbert spectrum is considered as the second IM, defined as follows:
S HHT = 0 f max 0 t max 1 + ( E ( f , t ) f ) 2 + ( E ( f , t ) t ) 2 dt df
Moreover, as additional parameters, the maximum and mean values of instantaneous energy and their ratio are considered:
A max , HHT = max ( E ( f , t ) )
A mean , HHT = mean ( E ( f , t ) )
A ratio , HHT = A mean , HHT A max , HHT
Subsequently, the volume VPos,HHT, as well as the upper surface SPos,HHT of the segment of Hilbert spectrum above the horizontal plane that intersects with the point of mean amplitude are also evaluated:
V Pos , HHT = 0 f max 0 t max E ( f , t ) dt df   where   E E mean
S Pos , HHT = 0 f max 0 t max 1 + ( E ( f , t ) f ) 2 + ( E ( f , t ) t ) 2 dt df   where   E E mean
Finally, the following additional IMs are defined as a combination of the aforementioned parameters:
A HHT = V HHT S HHT
S A mean = S HHT A mean , HHT
V A mean = V HHT A mean , HHT
V A max = V HHT A max , HHT
A pos , HHT = V pos , HHT S pos , HHT

2.1.2. Conventional IMs

The present study aims to evaluate and compare the capability of conventional and HHT-based IMs to predict the seismic demands of a typical rocking bridge. To this end, a set of 26 conventional IMs is considered herein. The examined conventional IMs are classified into four distinct categories: amplitude, duration, frequency, and energy-based parameters [56]. Among the amplitude-based IMs, PGV presents a high correlation with the seismic responses of rocking systems of large sizes [41]. Moreover, rocking overturn is primarily affected by the frequency content of the excitation, given that the ground acceleration meets the uplift criterion [31]. Furthermore, energy-based IMs affect the overall rocking response (finite rotations and overturn) as long as it describes both the frequency content and the amplitude characteristics of the signal [31]. Finally, Giouvanidis and Dimitrakopoulos [39] provide clear evidence about the relation between duration-based parameters and rocking response amplification. Definitions, descriptions, and references of the conventional IMs are listed in Table 1.

2.2. Dynamics of Rocking Frames

For this study, the rigid rocking frame modeling assumption is adopted [10]. The examined typical rocking viaduct is depicted in Figure 1. Since rocking initiation depends on ground acceleration, the examined system is assumed to remain inactive until the uplift criterion is fulfilled. The uplift condition derived from the static equilibrium depends on the slenderness α of the rocking pier and ground acceleration αg. The following equation gives the minimum acceleration value required to uplift the examined system:
| α g | g tan α
After the uplift of rocking piers, the equation of motion is expressed as follows [10]:
θ ¨ = p ^ 2 [ sin ( sgn ( θ ) α θ ) + α g g cos ( sgn ( θ ) α θ ) ]
where sgn() is the signum function of the ground acceleration and p ^ the frequency parameter, defined as follows:
p ^ = g I ¯ o R 1 + 2 γ 1 + 4 γ / I ¯ o
where R is the semi-diagonal length of the piers, γ = mb/Nmc is the relative mass of the deck, mb is the mass of the deck, N is the number of rocking piers, mc is the mass of the rocking pier, I ¯ o = I o / ( m c R 2 ) , and I o is the rotational inertia of the pier about the pivot point. For rectangular rocking piers, I ¯ o = 4 / 3 .
During the rocking response, energy dissipation is instantaneous and occurs only at impact instants when the rocking rotation of the piers reverses the sign. In the case of rocking frames, the impulse–momentum theorem yields the coefficient of restitution (COR) as follows [10]:
COR = θ ˙ + θ ˙ = 1 2 sin 2 α 1 + 4 γ I ¯ o + 4 γ
where θ ˙ and θ ˙ + are the rotational velocities before (−) and after (+) impact, respectively.
In the present study, the dynamic response of a typical rocking bridge is numerically evaluated by the time integration of the equation of motion (Equations (19)–(22)) in Matlab R2018, adopting the Runge–Kutta integration scheme (ode45).

2.3. Fragility Analysis

Fragility analysis refers to a computational scheme that evaluates the conditional probability (P) of the seismic demand (D) exceeding the capacity (C) of the structure for a given ground motion intensity measure (IM) level (Equation (23)). Both the seismic demand and structural capacity are commonly expressed in terms of an engineering demand parameter (EDP).
P = P ( D C | IM )
The seismic fragility of rocking-based systems is derived by the appropriate combination of the rocking overturn probability (POv) and the probability of developing a finite rocking rotation without overturning occurrence (PFR), using the total probability theorem (Equation (24)) [31]. It is noteworthy that rocking initiation is omitted since it is determined by the seismic motion acceleration level (Equation (19)).
P ( D C | IM ) = P Ov + ( 1 P Ov ) P FR
Excluding the overturning cases, the probability (PFR) is calculated by the following equation:
P FR = Φ ( ln ( S d / S c ) β D | IM 2 )
where Φ is the cumulative distribution function of the standard normal distribution, Sc denotes the median value of the capacity associated with a predefined limit state, and βD|IM expresses the seismic demand uncertainties conditioned on the IM.
The dependency between the median seismic demand and an IM is expressed as follows [72]:
S d = a ( IM ) b
where a and b are the seismic demand model coefficients.
The above parameters correspond to the linear regression coefficients between the IM values and the corresponding seismic demands (di) in logarithmic space. The uncertainty introduced in the probabilistic seismic demand model (PSDM) is expressed as the dispersion of the median demand, which is defined by the logarithmic standard deviation of the model:
β D | IM ( ln ( d i ) ln ( a ( IM ) b ) ) 2 N 2
For the estimation of the probability of rocking overturn (POv), the problem should be treated as a categorical one. Therefore, the data should be grouped into nonoverturned and overturned data. In this study, the maximum likelihood estimator (MLE) approach is adopted in order to estimate the overturning vulnerability function parameters optimally (mean μ and standard deviation σ) [73,74]. The following expression gives the maximum likelihood function L:
L = j = 1 m p j z j ( 1 p j ) 1 z j
where zj is a parameter of the binomial distribution, pj is the collapse probability of a certain IM level, m is the number of IM values, and Π denotes a product of all ΙΜ values. Assuming lognormal cumulative distribution for the overturning probability, Equation (28) results in the following:
L = j = 1 m Φ ( ln x j μ σ ) z j ( 1 Φ ( ln x j μ σ ) ) 1 z j
The statistical moments μ ^ and σ ^ are calculated by the maximization of the likelihood function L:
{ μ ^ , σ ^ } = max μ , β j = 1 m ( n j z j ) Φ ( ln x j μ σ ) z j ( 1 Φ ( ln x j μ σ ) ) n j z j
The response data are processed according to Figure 2 in order to derive the vulnerability curves.
In order to reduce the seismic demand uncertainty (βD|IM), vector IMs are also examined [75,76]. Considering a bivariate IM, the median seismic demand is expressed as follows:
S d = a ( IM 1 ) b 1 ( IM 2 ) b 2
where a, b1, and b2 are coefficients of the demand model.
Moreover, in the case of rocking overturn fragility, the components of the bivariate IM are combined as follows:
ln ( IM ) = λ 1 + λ ln ( IM 1 ) + 1 1 + λ ln ( IM 2 )
where λ is estimated throughout the MLE procedure.

2.4. Optimal Intensity Measures

The identification of an optimal IM is crucial in seismic vulnerability assessment. Therefore, the selection of an appropriate IM should be based on criteria presented in the literature to assess seismic performance reliably. An optimal IM is distinguished by formal criteria such as efficiency, practicality, and proficiency [77,78]. An efficient IM reduces the dispersion of the demands about the median. An efficient IM implies lower standard deviations in both finite rocking response (Equation (27)) and rocking overturn (Equation (30)). As such, adopting an efficient IM results in superior fragility curves. The coefficient of determination from the linear regression analysis (Rr2) can be considered as an additional criterion to evaluate the performance of an IM in predicting structural damage [42]. Practicality, measured by the regression parameter b in the PSDM, indicates the grade of the direct correlation between an IM and the seismic demands. Finally, proficiency is a complex measure defined as the ratio of the logarithmic standard deviation (Efficiency) to the regression’s slope (Practicality).

2.5. EDP-Limit States

As long as performance criteria have to be clearly identified, a proper engineering demand parameter (EDP) should describe the earthquake-induced damage to structures qualitatively and quantitatively. In the examined structural system, the absolute maximum developed title angle |θmax| normalized to the critical overturning rotation (α) should be adopted as an EDP.
EDP = | θ max | α
Performance-based earthquake engineering relies on the definition of acceptable performance levels of a structural response for predefined seismic levels. In this context, to perform vulnerability analysis, it is crucial to express capacity limit states (LSs) in terms of an EDP. By adopting a proper EDP, various performance objectives can be easily identified. Similar to Bantilas et al. [30], the rocking response is distinguished into three performance levels in the present study, as shown in Table 2. The first performance level (LS1) corresponds to slight rocking. In this performance level, the examined structural systems benefit from uplift, while the overturning potential is negligible [32]. The second (LS2) corresponds to moderate rocking rotations which may lead to local damage due to the impact of the rocking piers on the ground. Finally, the third (LS3) corresponds to rocking overturn.

2.6. Discriminant Analysis

In compliance with performance-based earthquake engineering (PBEE), in which the seismic performance is evaluated by introducing response levels, statistical tools that reliably classify the seismic demand into predefined damage classes can be implemented for rapid seismic response assessment. Among the plethora of possible techniques for data classification, Discriminant Analysis (DA) [55] is one of the most commonly used. DA creates a set of equations that perfectly discriminate between the dependent variable’s categories. Despite its simplicity, DA produces robust, decent, and interpretable classification results [45].

3. Results

3.1. Fragility Analysis

For the scope of this study, a set of 100 natural strong ground motion records [79] has been used to perform the time history analysis of the examined structural system. The selected excitations cover a wide range of intensities and, consequently, structural damage.
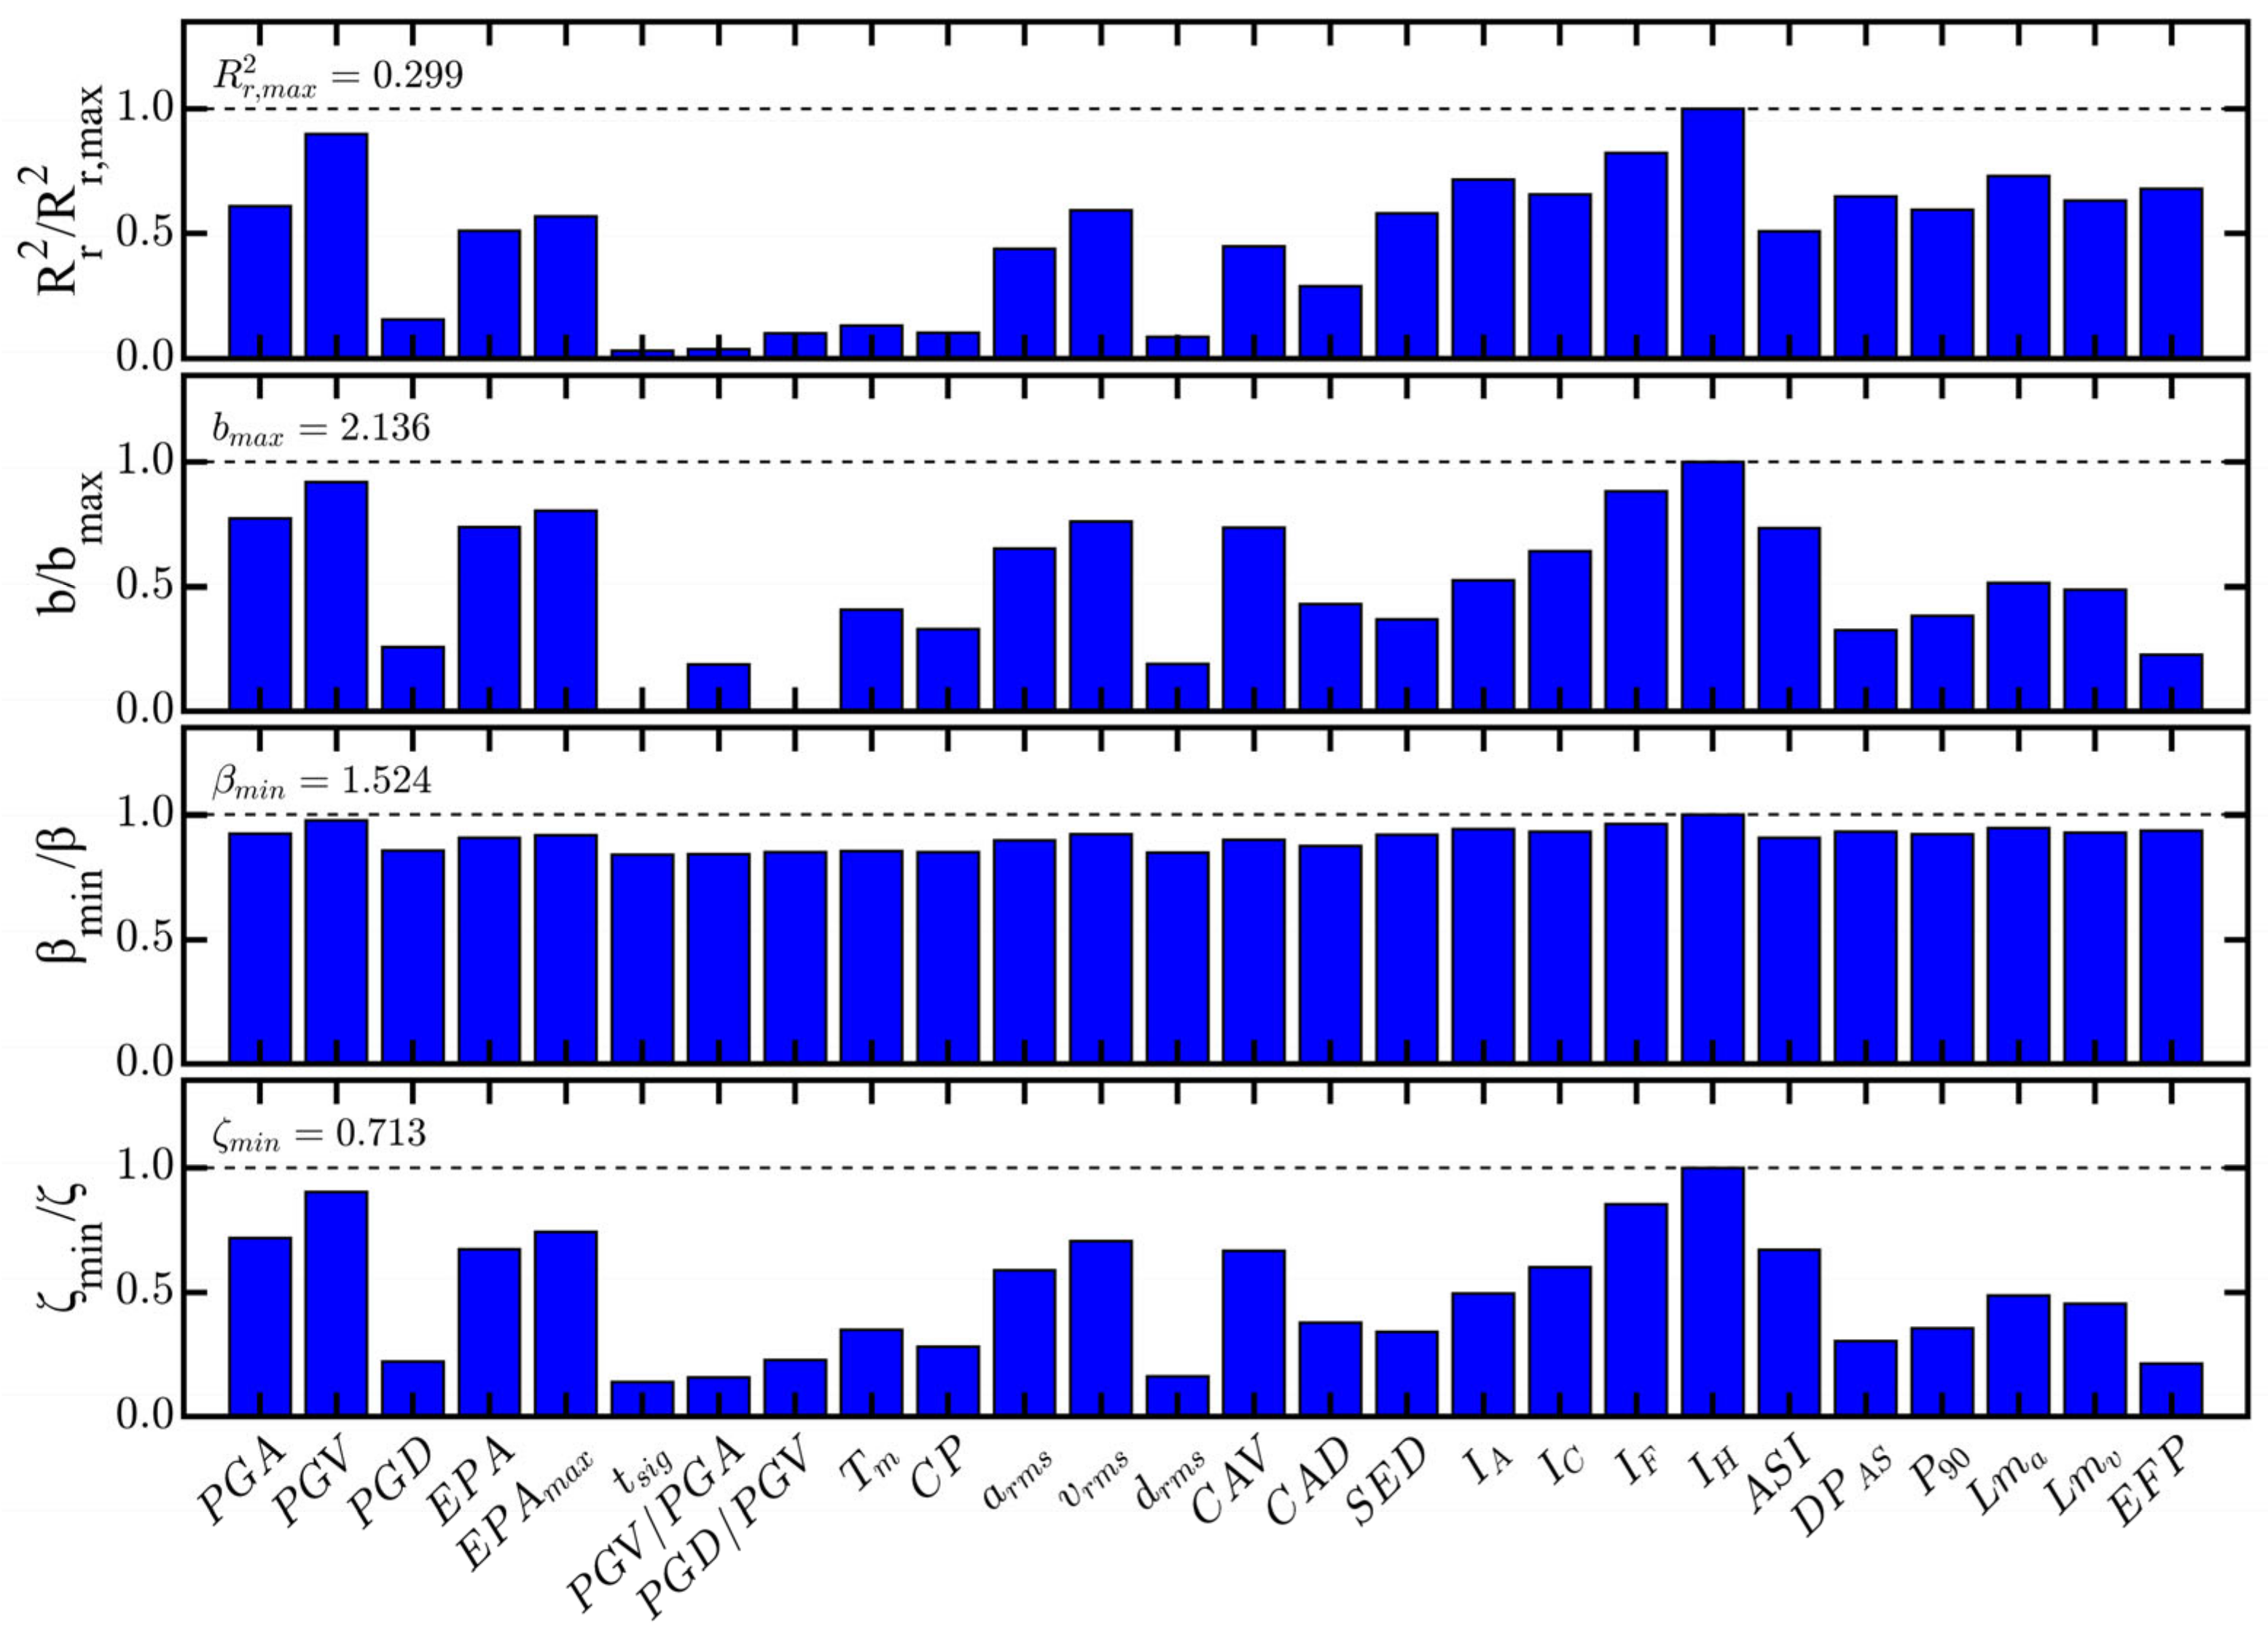
The parameters of the PSDMs using the conventional and the proposed HHT-based IMs are presented in Figure 3 and Figure 4, respectively. Specifically, the coefficient of determination Rr2, the linear regression coefficient b, the standard deviation βD|IM, and the parameter ζ are reported. The parameters provided in every subfigure are adequately normalized to the value of the best-performing IM to visualize the relative performance between the examined IMs. A more optimal IM is characterized by higher normalized values given a performance criterion.
Regarding the conventional IMs, Housner’s Intensity (IH), followed by PGV, are the most optimal IMs to develop PSDMs considering every performance criterion. Although PGA level determines rocking initiation, it moderately affects the rocking response. It is evident that PGA governs the dynamic response of free-standing rigid blocks of small size, while larger-size blocks are mainly affected by velocity-based IMs [38]. Considering the dimensions of the examined structural system and the equivalence between rocking frames and single blocks, the moderate performance of PGA was expected. It should be noted that the height of the equivalent single block of the examined rocking frame is 2Heq = 14.6m. Conventional IMs present a varying perforce, while in the case of HHT-based IMs, AHHT outperforms every criterion examined. It can be noted that the performance of AHHT is similar to the most optimal conventional IMs. Especially in terms of the efficiency criterion, both IMs present almost identical values.
Except for the finite rocking response, the estimation of the collapse probability is of particular interest. To this end, the standard deviation σ obtained by the MLE is presented in Figure 5 and Figure 6 for the conventional and the examined HHT-based IMs, respectively. Interestingly, although the IH and AHHT outperform in predicting the finite rocking response, this is not the case in rocking overturn. Based on the standard deviation criterion, IF and APos,HHT are the proper IMs to estimate the probability of collapse. It has to be mentioned that the optimal IMs in the case of rocking overturn estimation present a satisfactory performance in finite rocking prediction and vice versa. Specifically, regarding the conventional IMs, IH and PGV, which are the most optimal IMs regarding the finite rocking estimation, are the second and the fifth most optimal IMs in the case of rocking overturn estimation, respectively. Moreover, IF, which is the best IM in rocking overturn estimation, is the third most optimal in the case of finite rocking prediction. Considering the proposed IMs, APos,HHT, which outperforms in the case of finite rocking response estimation, is clearly the second most optimal for estimating the rocking overturn. On the other hand, APos,HHT, given its performance in terms of proficiency criterion, is the second most optimal IM to be used for the PSDM.
Despite the performance criteria that an optimal IM should fulfil, regarding its interdependency with the seismic demands, hazard computability is of significant importance [39]. The combination of fragility and hazard analysis consists of the components of risk assessment. As long as the modern PBEE implies the definition of performance criteria and the estimation of each annual rate of exceedance (risk estimation), the adoption of a hazard-computable IM is necessary [29]. From this point of view, only a limited number of IMs can be deployed in fragility analysis in order to be used in risk assessment. Thus, hazard maps should be constructed in terms of IMs that optimally describe the rocking response.
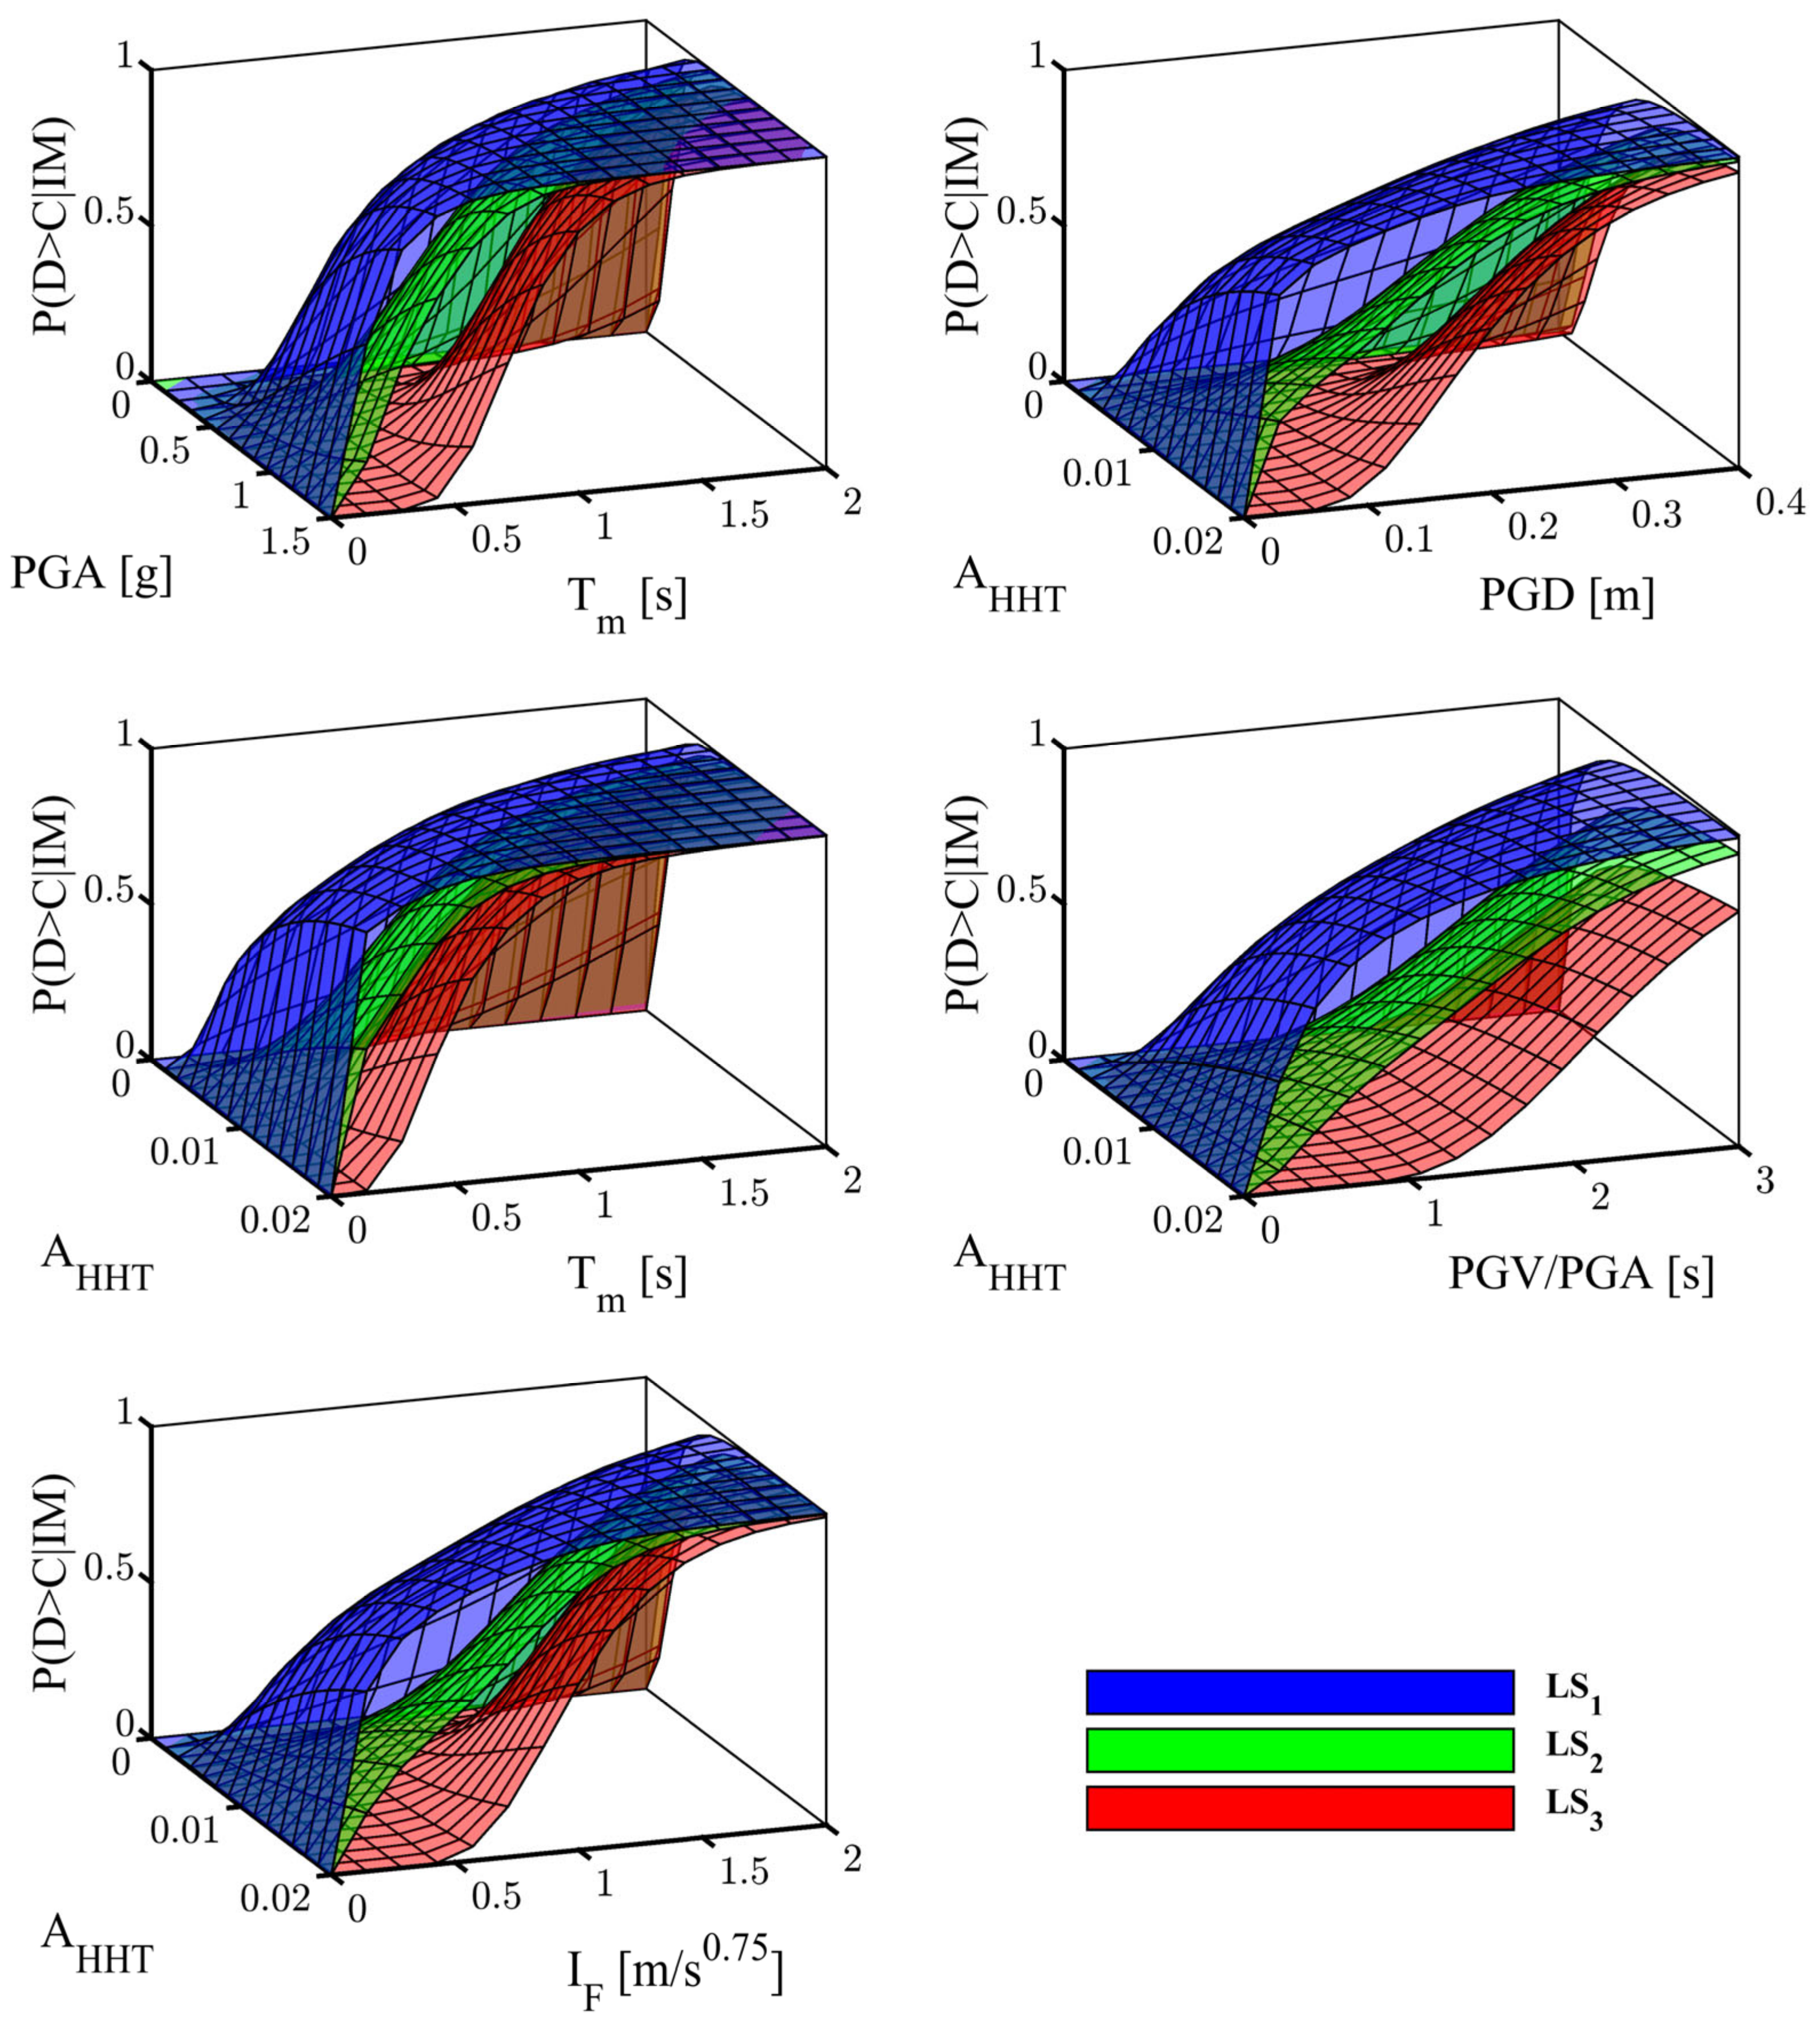
In order to reduce the seismic demand uncertainty, bivariate IMs are also examined. Specifically, a thorough investigation has been conducted in which all possible couples of IMs are examined. In Table 3, the parameters of the PSDM (Equation (31)) and the rocking overturn fragility (Equations (30) and (32)) of the five most optimal combinations are listed. In four out of five cases, combining the HHT-based parameter AHHT with a conventional IM resulted in enhanced performance compared to any univariate IM. It has to be noted that the combination of a frequency parameter, in our case, Tm, with an acceleration amplitude one, such as PGA, has emerged as an optimal bivariate IM in past studies [31,32]. The parameter λ denotes the influence of each component of the bivariate IM on the collapse probability regarding Equation (32). It should be mentioned that a value λ = 1 implies an equal effect by both components. In special cases where λ = 0 or λ→∞, the probability of collapse is defined only by the second and the first component of the bivariate IM, respectively. Based on the values listed in Table 3, among the most optimal vector-valued IMs, the overturning fragility primarily depends on the second component. In most cases, the rocking overturn is governed by frequency-based IMs (Tm, PGV/PGA), which are known for their moderate to high correlation with the rocking response. On the other hand, the regression slope parameters b1 and b2 express the grade of direct correlation of each IM component on the finite rocking response estimation. Interestingly, in four out of five most optimal bivariate IMs, their first components present higher interdependencies with the developed finite rocking rotations.
Subsequently, the fragility surfaces of the bivariate IMs listed in Table 3 are provided in Figure 7. Obviously, in the first limit state (LSI), which corresponds to a stable rocking response with negligible overturning potential, the inclination of the fragility surfaces is mainly affected by the first component of each bivariate IM. Meanwhile, in the case of the third limit state (LSIII), the inclination of the fragility curves is driven by the second IM component.

3.2. Discriminant Analysis

In the present study, the discriminant analysis is performed by adopting four classes. The classes are defined to agree with the limit states, which are stated in Section 2.5. The only difference is that for rocking rotations θ/α > 0.5, two classes are determined; the former corresponds to large rocking rotations without overturning (θ/α < 1) and the latter to rocking overturn. The description of the four classes is listed in Table 4. This way, the discriminant functions are appropriately calculated according to the data. In order to evaluate the contribution of the proposed HHT-based IMs in describing the rocking response, discriminant analyses are performed, taking into account two sets of features. The first model consists of all the conventional IMs (Model 1), while in the second one, the proposed IMs are also included (Model 2). The discriminate analysis performance verification is performed using 90% of the total data as the train set, while the remaining 10% is the test set.
The average performance metrics of the classification analysis are presented in Table 5 for both the train and test sets. Based on the confusion matrix, the accuracy, precision, recall, and F1 score are calculated. [80]. Accuracy is the ratio of correctly predicted observations to the total ones. On the other hand, precision is the percentage of correctly predicted positive observations to the total predicted positive observations. The correctly predicted positive observations divided by the actual observations of a specific class defines the recall metric. Finally, the F1 score is a complex metric that combines precision and recall. In Table 5, the performance metrics of both models are provided comparatively. Where the values inside the parentheses are referred to as Model 2, based on these metrics, it is obvious that the HHT-based IMs should be combined with conventional IMs to classify the examined structural system’s seismic response reliably. This fact is especially highlighted by the classifier’s performance in the test set.

4. Conclusions

In the present study, the performance of 12 novel HHT-based IMs in describing the seismic response of typical rocking viaducts is assessed based on optimal IM selection criteria. To this end, a comparative evaluation of the performance between the proposed IM and 26 well-known conventional IMs is presented. Among the proposed IMs, the most optimal ones perform similarly to the conventional ones in describing the rocking rotations and the probability of collapse. Since adopting any of the most optimal IMs introduces considerable uncertainty in fragility assessment, multivariate IMs should be considered. Therefore, all possible bivariate IMs are examined, and fragility curves are provided based on the five most optimal IMs. It is noteworthy that most optimal bivariate IMs consist of one HHT-based parameter. Subsequently, a classification of the seismic response was conducted using discriminant analysis to provide a reliable and rapid estimation of the maximum seismic demand. Based on the performance measures of the classification problem, it is evident that HHT-based IMs result in an enhanced estimation of the seismic performance of the examined structural system.
Rocking-based structural systems can be represented by equivalent rocking blocks [11]. Based on the promising results of this study, the performance of the proposed HHT-based IMs on different rocking structural systems should be further evaluated in future research. Moreover, the rigidity assumption regarding rocking piers leads to a conservative estimation of the seismic response [8]. As such, a more sophisticated model that incorporates the beneficial effect of elasticity could also be adopted.

Author Contributions

Conceptualization, A.E.; methodology, K.E.B., I.E.K., M.T. and A.E.; software, K.E.B., I.E.K., M.T. and A.E.; validation, K.E.B., I.E.K. and A.E.; formal analysis, K.E.B., I.E.K., M.T. and A.E.; investigation, K.E.B., I.E.K., M.T. and A.E.; resources K.E.B., I.E.K., M.T. and A.E.; data curation, I.E.K., K.E.B., M.T. and A.E.; writing—original draft preparation, K.E.B. and I.E.K.; writing—review and editing, K.E.B., I.E.K., M.T. and A.E.; visualization, K.E.B., I.E.K., M.T. and A.E.; supervision, A.E.; project administration, K.E.B. and I.E.K. All authors have read and agreed to the published version of the manuscript.

Funding

This research received no external funding.

Institutional Review Board Statement

Not applicable.

Informed Consent Statement

Not applicable.

Data Availability Statement

The data that support the findings of this study are available from the corresponding author upon reasonable request.

Conflicts of Interest

The authors declare no conflict of interest.

References

  1. Elnashai, A.S.; Di Sarno, L. Fundamentals of Earthquake Engineering; Wiley: New York, NY, USA, 2008; p. 347. [Google Scholar]
  2. Flenga, M.G.; Favvata, M.J. Fragility curves and probabilistic seismic demand models on the seismic assessment of RC frames subjected to structural pounding. Appl. Sci. 2021, 11, 8253. [Google Scholar] [CrossRef]
  3. Liu, R.; Palermo, A. Controlled rocking, dissipative controlled rocking and multi-hierarchical activation: Numerical analysis and experimental testing. In Proceedings of the 7th European Congress on Computational Methods In Applied Sciences and Engineering, Crete Island, Greece, 5–10 June 2016. [Google Scholar]
  4. Makris, N. A half-century of rocking isolation. Earthq. Struct. 2014, 7, 1187–1221. [Google Scholar] [CrossRef]
  5. Chatzikonstantinou, N.; Makarios, T.K.; Athanatopoulou, A. Integration Method for Response History Analysis of Single-Degree-of-Freedom Systems with Negative Stiffness. Buildings 2022, 12, 1214. [Google Scholar] [CrossRef]
  6. Housner, G.W. The behavior of inverted pendulum structures during earthquakes. Bull. Seismol. Soc. Am. 1963, 53, 403–417. [Google Scholar] [CrossRef]
  7. Oliveto, G.; Calio, I.; Greco, A. Large displacement behaviour of a structural model with foundation uplift under impulsive and earthquake excitations. Earthq. Eng. Struct. Dyn. 2003, 32, 369–393. [Google Scholar] [CrossRef]
  8. Acikgoz, S.; DeJong, M.J. The rocking response of large flexible structures to earthquakes. Bull. Earthq. Eng. 2014, 12, 875–908. [Google Scholar] [CrossRef]
  9. Vassiliou, M.F.; Truniger, R.; Stojadinović, B. An analytical model of a deformable cantilever structure rocking on a rigid surface: Development and verification. Earthq. Eng. Struct. Dyn. 2015, 44, 2775–2794. [Google Scholar] [CrossRef]
  10. Makris, N.; Vassiliou, M.F. Planar rocking response and stability analysis of an array of free-standing columns capped with a freely supported rigid beam. Earthq. Eng. Struct. Dyn. 2013, 42, 431–449. [Google Scholar] [CrossRef]
  11. Giouvanidis, A.I.; Dimitrakopoulos, E.G. Seismic performance of rocking frames with flag-shaped hysteretic behavior. J. Eng. Mech. 2017, 143, 04017008. [Google Scholar] [CrossRef]
  12. Makris, N.; Aghagholizadeh, M. The dynamics of an elastic structure coupled with a rocking wall. Earthq. Eng. Struct. Dyn. 2017, 46, 945–962. [Google Scholar] [CrossRef]
  13. Bachmann, J.A.; Vassiliou, M.F.; Stojadinović, B. Dynamics of rocking podium structures. Earthq. Eng. Struct. Dyn. 2017, 46, 2499–2517. [Google Scholar] [CrossRef]
  14. Bantilas, K.E.; Kavvadias, I.E.; Vasiliadis, L.K. Seismic response of elastic multidegree of freedom oscillators placed on the top of rocking storey. Earthq. Eng. Struct. Dyn. 2021, 50, 1315–1333. [Google Scholar] [CrossRef]
  15. Bantilas, K.E.; Kavvadias, I.E.; Vasiliadis, L.K. Analytical investigation of the seismic response of elastic oscillators placed on the top of rocking storey. Bull. Earthq. Eng. 2021, 19, 1249–1270. [Google Scholar] [CrossRef]
  16. Karam, G.; Mazen, T. Rocking blocks stability under critical pulses from near-fault earthquakes using a novel energy based approach. Appl. Sci. 2020, 10, 5924. [Google Scholar] [CrossRef]
  17. Li, S.; Tsang, H.H.; Lam, N. Seismic protection by rocking with superelastic tendon restraint. Earthq. Eng. Struct. Dyn. 2022, 51, 1718–1737. [Google Scholar] [CrossRef]
  18. Lagomarsino, S. Seismic assessment of rocking masonry structures. Bull. Earthq. Eng. 2015, 13, 97–128. [Google Scholar] [CrossRef]
  19. Buzov, A.; Radnić, J.; Grgić, N.; Baloević, G. Effect of the Drum Height on the Seismic Behaviour of a Free-Standing Multidrum Column. Adv. Mater. Sci. Eng. 2018, 2018, 5729068. [Google Scholar] [CrossRef] [Green Version]
  20. Stiros, S.C. Monumental articulated ancient Greek and Roman columns and temples and earthquakes: Archaeological, historical, and engineering approaches. J. Seismol. 2020, 24, 853–881. [Google Scholar] [CrossRef]
  21. Huang, B.; Günay, S.; Lu, W. Seismic assessment of freestanding ceramic vase with shaking table testing and performance-based earthquake engineering. J. Earthq. Eng. 2022, 26, 7956–7978. [Google Scholar] [CrossRef]
  22. Ko, K.W.; Ha, J.G.; Kim, D.S. Analytical evaluation and experimental validation on dynamic rocking behavior for shallow foundation considering structural response. Earthq. Eng. Eng. Vib. 2022, 21, 37–51. [Google Scholar] [CrossRef]
  23. He, X.; Unjoh, S. Development of rocking isolation bearing system (RIBS) to control excessive seismic responses of bridge structures. Earthq. Eng. Struct. Dyn. 2022, 51, 369–392. [Google Scholar] [CrossRef]
  24. Beck, J.L.; Skinner, R.I. The seismic response of a reinforced concrete bridge pier designed to step. Earthq. Eng. Struct. Dyn. 1973, 2, 343–358. [Google Scholar] [CrossRef]
  25. Sharpe, R.D.; Skinner, R.I. The seismic design of an industrial chimney with rocking base. Bull. N. Z. Natl. Soc. Earthq. Eng. 1983, 16, 98–106. [Google Scholar] [CrossRef]
  26. Wada, A.; Qu, Z.; Motoyui, S.; Sakata, H. Seismic retrofit of existing SRC frames using rocking walls and steel dampers. Front. Archit. Civ. Eng. China 2011, 5, 259. [Google Scholar] [CrossRef]
  27. Yim, C.S.; Chopra, A.K.; Penzien, J. Rocking response of rigid blocks to earthquakes. Earthq. Eng. Struct. Dyn. 1980, 8, 565–587. [Google Scholar] [CrossRef]
  28. Bachmann, J.A.; Strand, M.; Vassiliou, M.F.; Broccardo, M.; Stojadinović, B. Is rocking motion predictable? Earthq. Eng. Struct. Dyn. 2018, 47, 535–552. [Google Scholar] [CrossRef]
  29. Psycharis, I.N.; Fragiadakis, M.; Stefanou, I. Seismic reliability assessment of classical columns subjected to near-fault ground motions. Earthq. Eng. Struct. Dyn. 2013, 42, 2061–2079. [Google Scholar] [CrossRef] [Green Version]
  30. Bantilas, K.E.; Kavvadias, I.E.; Vasiliadis, L.K.; Elenas, A. Seismic fragility and intensity measure investigation for rocking podium structures under synthetic pulse-like excitations. Earthq. Eng. Struct. Dyn. 2021, 50, 3441–3459. [Google Scholar] [CrossRef]
  31. Kavvadias, I.E.; Vasiliadis, L.K.; Elenas, A. Seismic response parametric study of ancient rocking columns. Int. J. Archit. Herit. 2017, 11, 791–804. [Google Scholar] [CrossRef]
  32. Dimitrakopoulos, E.G.; Paraskeva, T.S. Dimensionless fragility curves for rocking response to near-fault excitations. Earthq. Eng. Struct. Dyn. 2015, 44, 2015–2033. [Google Scholar] [CrossRef]
  33. Solarino, F.; Giresini, L. Fragility curves and seismic demand hazard analysis of rocking walls restrained with elasto-plastic ties. Earthq. Eng. Struct. Dyn. 2021, 50, 3602–3622. [Google Scholar] [CrossRef]
  34. Liu, P.; Xue, W.; Pang, H.; Zhang, Y.M.; Chen, H.T.; Yang, W.G. Seismic overturning fragility analysis for freestanding building contents subjected to horizontal bidirectional floor motions. Soil Dyn. Earthq. Eng. 2020, 161, 107414. [Google Scholar] [CrossRef]
  35. Diamantopoulos, S.; Fragiadakis, M. Modeling, fragility and risk assessment of ancient freestanding columns and colonnades. Eng. Struct. 2023, 275, 115273. [Google Scholar] [CrossRef]
  36. Bakhtiary, E.; Gardoni, P. Probabilistic seismic demand model and fragility estimates for rocking symmetric blocks. Eng. Struct. 2016, 114, 25–34. [Google Scholar] [CrossRef]
  37. Pappas, A.; Sextos, A.; Da Porto, F.; Modena, C. Efficiency of alternative intensity measures for the seismic assessment of monolithic freestanding columns. Bull. Earthq. Eng. 2017, 15, 1635–1659. [Google Scholar] [CrossRef] [Green Version]
  38. Kavvadias, I.E.; Papachatzakis, G.A.; Bantilas, K.E.; Vasiliadis, L.K.; Elenas, A. Rocking spectrum intensity measures for seismic assessment of rocking rigid blocks. Soil Dyn. Earthq. Eng. 2017, 101, 116–124. [Google Scholar] [CrossRef]
  39. Giouvanidis, A.I.; Dimitrakopoulos, E.G. Rocking amplification and strong-motion duration. Earthq. Eng. Struct. Dyn. 2018, 47, 2094–2116. [Google Scholar] [CrossRef]
  40. Lachanas, C.G.; Vamvatsikos, D.; Dimitrakopoulos, E.G. Statistical property parameterization of simple rocking block response. Earthq. Eng. Struct. Dyn. 2022, 52, 394–414. [Google Scholar] [CrossRef]
  41. Sieber, M.; Vassiliou, M.F.; Anastasopoulos, I. Intensity measures, fragility analysis and dimensionality reduction of rocking under far-field ground motions. Earthq. Eng. Struct. Dyn. 2022, 51, 3639–3657. [Google Scholar] [CrossRef]
  42. Elenas, A. Correlation between seismic acceleration parameters and overall structural damage indices of buildings. Soil Dyn. Earthq. Eng. 2000, 20, 93–100. [Google Scholar] [CrossRef]
  43. Elenas, A.; Meskouris, K. Correlation study between seismic acceleration parameters and damage indices of structures. Eng. Struct. 2001, 23, 698–704. [Google Scholar] [CrossRef]
  44. Alvanitopoulos, P.F.; Andreadis, I.; Elenas, A. Neuro-fuzzy techniques for the classification of earthquake damages in buildings. Measurement 2010, 43, 797–809. [Google Scholar] [CrossRef]
  45. Elenas, A. Seismic-Parameter-Based Statistical Procedure for the Approximate Assessment of Structural Damage. Math. Probl. Eng. 2014, 2014, 916820. [Google Scholar] [CrossRef]
  46. Elenas, A. Interdependency between seismic acceleration parameters and the behavior of structures. Soil Dyn. Earthq. Eng. 1997, 16, 317–322. [Google Scholar] [CrossRef]
  47. Kostinakis, K.; Athanatopoulou, A.; Morfidis, K. Correlation between ground motion intensity measures and seismic damage of 3D R/C buildings. Eng. Struct. 2015, 82, 151–167. [Google Scholar] [CrossRef]
  48. Huang, N.; Shen, Z.; Long, S.R.; Wu, M.C.; Shih, H.H.; Zheng, Q.; Yen, N.; Tung, C.C.; Liu, H.H. The empirical mode decomposition and the Hilbert spectrum for nonlinear and non-stationary time series analysis. Proc. R. Soc. A Math. Phys. Eng. Sci. 1998, 454, 903–995. [Google Scholar] [CrossRef]
  49. Wang, Q.; Geng, P.; Chen, J.; He, C. Dynamic discrimination method of seismic damage in tunnel portal based on improved wavelet packet transform coupled with Hilbert-Huang transform. Mech. Syst. Signal Process. 2023, 188, 110023. [Google Scholar] [CrossRef]
  50. Tyrtaiou, M.; Elenas, A. Novel Hilbert spectrum-based seismic intensity parameters interrelated with structural damage. Earthq. Struct. 2019, 16, 197–208. [Google Scholar]
  51. Tyrtaiou, M.; Elenas, A. Seismic Damage Potential Described by Intensity Parameters Based on Hilbert-Huang Transform Analysis and Fundamental Frequency of Structures. Earthq. Struct. 2020, 18, 507–517. [Google Scholar]
  52. Tyrtaiou, M.; Elenas, A.; Andreadis, I.; Vasiliadis, L. Hilbert-Huang Transform-Based Seismic Intensity Parameters for Performance-Based Design of RC-Framed Structures. Buildings 2022, 12, 1301. [Google Scholar] [CrossRef]
  53. Alvanitopoulos, P.F.; Andreadis, I.; Elenas, A. Interdependence between damage indices and ground motion parameters based on Hilbert–Huang transform. Meas. Sci. Technol. 2019, 21, 025101. [Google Scholar] [CrossRef]
  54. Chen, G.; Yang, J.; Liu, Y.; Kitahara, T.; Beer, M. An energy-frequency parameter for earthquake ground motion intensity measure. Earthq. Eng. Struct. Dyn. 2022, 52, 271–284. [Google Scholar] [CrossRef]
  55. Cramer, D. Advanced Quantitative Data Analysis; McGraw-Hill Education: London, UK, 2003. [Google Scholar]
  56. Kramer, S.L. Geotechnical Earthquake Engineering; Prentice-Hall: Upper Saddle River, NJ, USA, 1996. [Google Scholar]
  57. Meskouris, K. Structural Dynamics: Models, Methods, Examples; Ernst & Sohn: Berlin, Germany, 2000. [Google Scholar]
  58. ATC 3-06 Publication. Tentative Provisions for the Development of Seismic Regulations for Buildings; US Government Printing Office: Washington, DC, USA, 1978. [Google Scholar]
  59. Trifunac, M.D.; Brady, A.G. A study on the duration of strong earthquake ground motion. Bull. Seismol. Soc. Am. 1975, 65, 581–626. [Google Scholar]
  60. Rathje, E.M.; Abrahamson, N.A.; Bray, J.D. Simplified frequency content estimates of earthquake ground motions. J. Geotech. Geoenviron. Eng. 1998, 124, 150–159. [Google Scholar] [CrossRef]
  61. Housner, G.; Jennings, P.C. Generation of artificial earthquakes. J. Eng. Mech. Div. 1964, 90, 113–150. [Google Scholar] [CrossRef]
  62. Vanmarcke, E.H.; Lai, S.S.P. Strong-motion duration and RMS amplitude of earthquake records. Bull. Seismol. Soc. Am. 1980, 70, 1293–1307. [Google Scholar]
  63. Cabãnas, L.; Benito, B.; Herráiz, M. An approach to the measurement of the potential structural damage of earthquake ground motions. Earthq. Eng. Struct. Dyn. 1997, 26, 79–92. [Google Scholar] [CrossRef]
  64. Arias, A. A Measure of Earthquake Intensity; MIT Press: Cambridge, MA, USA, 1970. [Google Scholar]
  65. Ang, A.H.S. Reliability bases for seismic safety assessment and design. In Proceedings of the 4th U.S. National Conference on Earthquake Engineering, Earthquake Engineering Research Institute, Palm Springs, CA, USA, 20–24 May 1990. [Google Scholar]
  66. Fajfar, P.; Vidic, T.; Fischinger, M. A measure of earthquake motion capacity to damage medium-period structures. Soil Dyn. Earthq. Eng. 1990, 9, 236–242. [Google Scholar] [CrossRef]
  67. Housner, G.W. Spectrum intensities of strong-motion earthquakes. In Symposium on Earthquakes and Blast Effects on Structures; Earthquake Engineering Research Institute: Los Angeles, CA, USA, 1952. [Google Scholar]
  68. Von Thun, J.; Roehm, L.; Scott, G.; Wilson, J. Earthquake ground motions for design and analysis of dams. In Earthquake Engineering and Soil Dynamics II–Recent Advances in Ground-Motion Evaluation; Geotechnical Special Publication; ASCE: New York, NY, USA, 1988. [Google Scholar]
  69. Araya, R.; Saragoni, G.R. Earthquake accelerogram destructiveness potential factor. In Proceedings of the 8th World Conference on Earthquake Engineering, EERI, San Francisco, CA, USA, 21–28 July 1984. [Google Scholar]
  70. Jennings, P.C. Engineering seismology. In Earthquakes: Observation, Theory and Interpretation; Kanamori, H., Boschi, E., Eds.; Italian Physical Society: Varenna, Italy, 1982; pp. 138–173. [Google Scholar]
  71. Dimitrakopoulos, E.G.; Kappos, A.J.; Makris, N. Dimensional analysis of yielding and pounding structures for records without distinct pulses. Soil Dyn. Earthq. Eng. 2009, 29, 1170–1180. [Google Scholar] [CrossRef] [Green Version]
  72. Giovenale, P.; Cornell, A.C.; Esteva, L. Comparing the adequacy of alternative ground motion intensity measures for the estimation of structural responses. Earthq. Eng. Struct. Dyn. 2004, 33, 951–979. [Google Scholar] [CrossRef]
  73. Baker, J.W. Efficient analytical fragility function fitting using dynamic structural analysis. Earthq. Spectra 2015, 31, 579–599. [Google Scholar] [CrossRef]
  74. Shinozuka, M.; Feng, M.Q.; Kim, H.K.; Kim, S.H. Nonlinear static procedure for fragility curve development. J. Eng. Mech. 2000, 126, 1287–1295. [Google Scholar] [CrossRef] [Green Version]
  75. Baker, J.W.; Cornell, C.A. A vector-valued ground motion intensity measure consisting of spectral acceleration and epsilon. Earthq. Eng. Struct. Dyn. 2005, 34, 1193–1217. [Google Scholar] [CrossRef]
  76. Gehl, P.; Seyedi, D.M.; Douglas, J. Vector-valued fragility functions for seismic risk evaluation. Bull. Earthq. Eng. 2013, 11, 365–384. [Google Scholar] [CrossRef] [Green Version]
  77. Luco, N.; Cornell, C. Structure-specific scalar intensity measures for near-source and ordinary earthquake motions. Earthq. Spectra 2007, 23, 357–392. [Google Scholar] [CrossRef] [Green Version]
  78. Padgett, J.E.; Nielson, B.G.; DesRoches, R. Selection of optimal intensity measures in probabilistic seismic demand models of highway bridge portfolios. Earthq. Eng. Struct. Dyn. 2008, 37, 711–725. [Google Scholar] [CrossRef]
  79. Pacific Earthquake Engineering Research Centre (PEER). Strong Motion Database. 2016. Available online: http://ngawest2.berkeley.edu/ (accessed on 12 November 2022).
  80. Duda, R.O.; Hart, P.E.; Stork, D.H. Pattern Classification, 2nd ed.; John Wiley and Sons: New York, NY, USA, 2000. [Google Scholar]
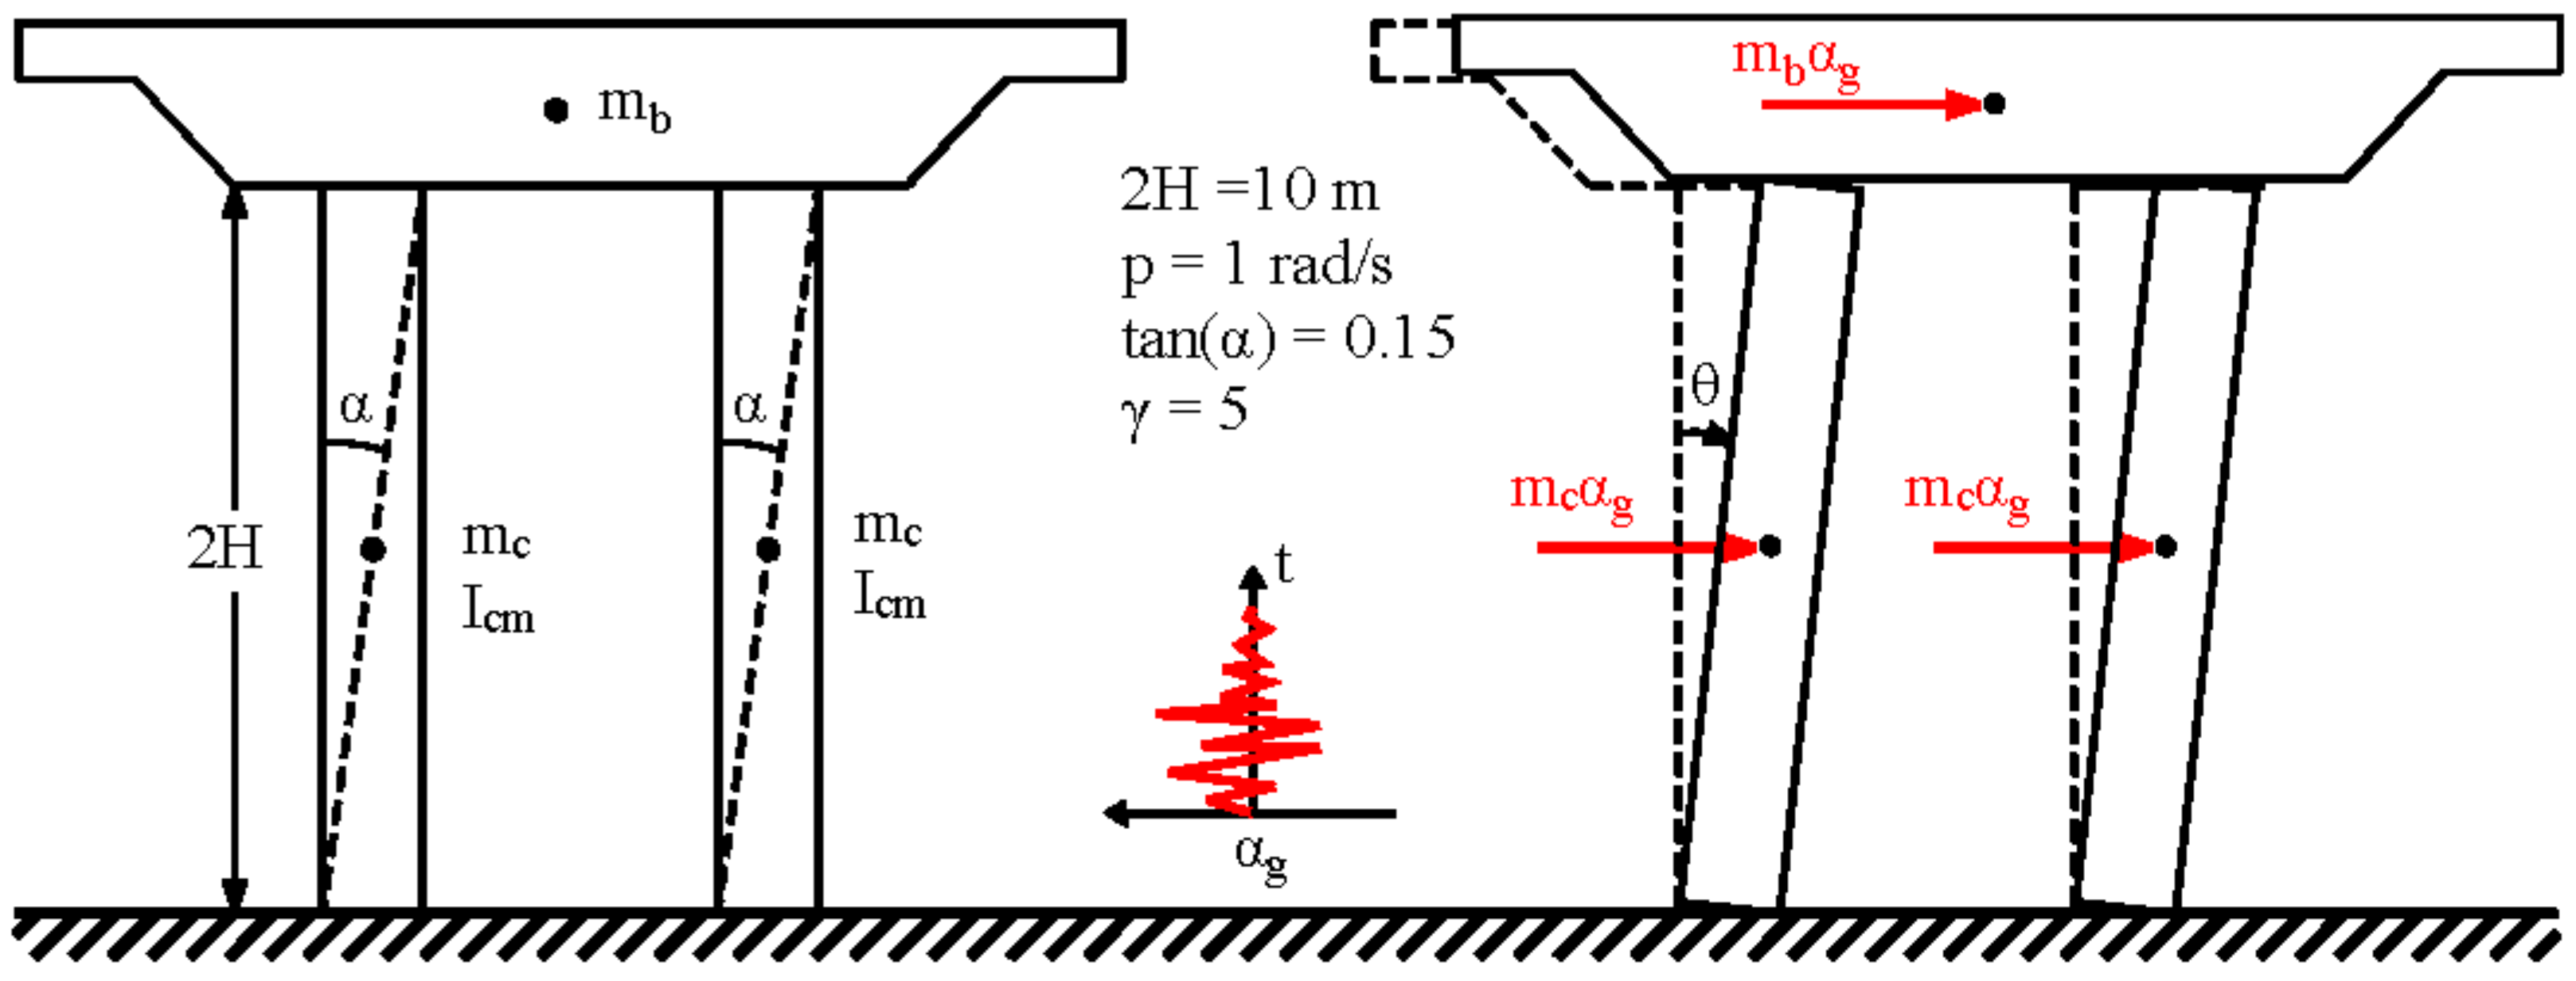
Figure 1. Examined rocking frame.
Applsci 13 01634 g001
Figure 2. Computational scheme of vulnerability analysis: (a) time history analyses results, (b) PSDM of the finite rocking responses, and (c) MLE for overturning probability parameters.
Applsci 13 01634 g002
Figure 3. Performance evaluation of conventional IMs in developing PSDM.
Applsci 13 01634 g003
Figure 4. Performance evaluation of the proposed HHT-based IMs in developing PSDM.
Applsci 13 01634 g004
Figure 5. Performance evaluation of conventional IMs in predicting the rocking overturn.
Applsci 13 01634 g005
Figure 6. Performance evaluation of proposed HHT-based IMs in predicting the rocking overturn.
Applsci 13 01634 g006
Figure 7. Fragility surfaces using vector-value IMs.
Applsci 13 01634 g007
Table 1. Conventional IMs.
CategorySeismic ParameterDescription
Amplitude-BasedPGAPeak Ground Acceleration[57]
PGVPeak Ground Velocity[57]
PGDPeak Ground Displacement[57]
EPAEffective Peak Acceleration[58]
EPAmaxmaximum EPA[58]
Duration-BasedtsigStrong motion duration[59]
Frequency-BasedPGV/PGAPeriod parameter[56]
PGD/PGVPeriod parameter[39]
TmMean Period[60]
CPCentral Period[61]
Energy-BasedarmsAcceleration’s Root Mean Square[62]
vrmsVelocity’s Root Mean Square[62]
drmsDisplacement’s Root Mean Square[62]
CAVCumulative Absolute Velocity[63]
CADCumulative Absolute Displacement[63]
SEDSpecific Energy Density[57]
IAArias Intensity[64]
ICCharacteristic Intensity[65]
IFFajfar–Vidic–Fischinger Intensity[66]
IHHousner Intensity[67]
ASIAcceleration Spectrum Intensity[68]
DPASAraya–Saragoni Destructiveness Potential[69]
P90Seismic Power of Jennings[70]
LmaCharacteristic length scale of acceleration[71]
LmvCharacteristic length scale of velocity[31]
EFPEnergy–Frequency Parameter[54]
Table 2. Adopted performance levels for rocking response.
Limit Statemax|/αPerformance LevelDescription
LS10.10Slight RockingRocking initiation
LS20.50Moderate RockingLocal damage due to impact
LS3Rocking OverturnCollapse
Table 3. Proposed bivariate fragility surface parameters.
IMsPSDMMLE
ab1b2βD|IMμσλ
PGA—Tm0.582.281.871.49−0.060.190.49
AHHT—PGD5.541.370.531.48−1.980.290.64
AHHT—Tm5.211.380.921.48−1.140.220.40
AHHT—PGV/PGA6.121.410.591.51−2.480.270.59
AHHT—IF2.971.011.191.440.260.320.13
Table 4. Adopted classification of the EDP.
Classes1234
Description0 < θ/α ≤ 0.100.10 < θ/α ≤ 0.500.5 < θ/α ≤ 1θ/α > 1
Table 5. Average performance measures of the discriminant analysis.
SetAccuracyRecallPrecisionF1 Score
Train0.96 (0.97)0.92 (0.96)0.95 (0.96)0.93 (0.96)
Test0.75 (0.85)0.75 (0.85)0.79 (0.85)0.76 (0.85)
Disclaimer/Publisher’s Note: The statements, opinions and data contained in all publications are solely those of the individual author(s) and contributor(s) and not of MDPI and/or the editor(s). MDPI and/or the editor(s) disclaim responsibility for any injury to people or property resulting from any ideas, methods, instructions or products referred to in the content.