Article

Effects of a Home-Based Foot–Ankle Exercise Program with Educational Booklet for Foot Dysfunctions in People with Diabetic Neuropathy: Results of the FOCA-II Randomized Controlled Clinical Trial

by
Érica Q. Silva
1,
Jady L. Veríssimo
1,
Jane S. S. P. Ferreira
1,
Ronaldo H. Cruvinel-Júnior
1,
Renan L. Monteiro
1,2,
Eneida Y. Suda
1,3 and
Isabel C. N. Sacco
1,*
1
Department of Physical Therapy Speech and Occupational Therapy, School of Medicine, University of Sao Paulo, Sao Paulo 05360-160, Brazil
2
Department of Biological Science and Health, Federal University of Amapá, Macapá 68903-419, Brazil
3
Postgraduate Program in Physiotherapy, Universidade Ibirapuera, Sao Paulo 04661-100, Brazil
*
Author to whom correspondence should be addressed.
Appl. Sci. 2023, 13(3), 1423; https://doi.org/10.3390/app13031423
Submission received: 29 December 2022 / Revised: 13 January 2023 / Accepted: 17 January 2023 / Published: 20 January 2023
(This article belongs to the Special Issue Diabetic Foot)

Abstract

:
Exercise rehabilitation and education are important strategies for preventing the progression of diabetic neuropathy-related musculoskeletal deficits. The purpose of this randomized controlled trial was to investigate the effect of an 8-week home-based foot–ankle exercise program using an educational booklet on clinical outcomes (foot muscle strength and functionality; functional balance; diabetic neuropathy symptoms and severity; tactile and vibratory sensitivities; plantar pressure distribution; and foot–ankle, knee, and hip biomechanics during gait). Fifty participants with neuropathy were randomly allocated into an intervention group (59.1 ± 6.4 years, 23.5 ± 4.8 kg/m2, males = 6, females = 19) that performed the exercises for 8 weeks and a control group (56.5 ± 9.4 years, 22.9 ± 3.6 kg/m2, males = 5, females = 20) that received usual care recommendations. Generalized estimating equation method and intention-to-treat approaches were adopted. No significant differences were found for any clinical outcome after 8 weeks. Heel contact area increased in the intervention group compared to controls (p = 0.043, mean difference = 2.7 cm) and heel peak pressure was increased in controls compared to intervention (group effect p = 0.020, mean difference = −64.16 kPa) at 8 weeks. Controls showed increased joint moments for the hip at heel strike (p = 0.007) and for the knee and hip at push off over 8 and 16 weeks (p < 0.001 and p = 0.009, respectively). Although the intervention is easy to perform and showed a good adherence (72%), home-based foot–ankle exercise programs are unlikely to sufficiently modify the main risk factors related to foot ulcers and to change foot–ankle kinematics and kinetics.

1. Introduction

One in every three people worldwide needs or will need rehabilitation at some point in their lives [1]. There was a 63% increase in the need for rehabilitation in primary care settings worldwide in the last 30 years, particularly addressing chronic musculoskeletal conditions [1]. Diabetes is pointed out as the fourth-most common cause of disability globally [1], and approximately 131 million people are affected by diabetes-related lower-extremity complications [2,3,4,5,6,7,8,9,10] including 105.6 million with diabetic peripheral neuropathy (DPN) [11]. Although disease-modifying medications for improving glycemic control are the first-line approach for reducing the incidence of DPN, several factors risk reduction strategies, including exercise rehabilitation and education program, which can be second-line approaches for preventing the build-up and progression of DPN-related musculoskeletal and sensorial deficits [12,13]. A structured therapeutic exercise targeting the lower extremities may be a strategy for treatment of DPN-related complications [14,15,16,17,18,19].
Supervised foot-related exercise therapy (individual or group) is well-documented in the literature [14,16,17,18,20,21,22,23,24,25,26,27] and the International Guidelines of Prevention of Diabetic Foot includes this approach as part of the self-management plan to modify risk factors in people with DPN [28]. The main effects of supervised foot-related exercises are improving the plantar pressure distribution during gait [14,16,22,27], foot–ankle range of motion (ROM) [16,20,25], foot–ankle strength [17,18], DPN symptoms and sensitivity [16,18], and walking speed [23,25,29]. All beneficial changes that were report in the literature are not retained at follow-up [14]; therefore, health professionals are encouraged to incorporate information/communication-based technologies that enhance home-based exercise as an alternative treatment as they can improve patient adherence to treatment and even reduce waiting time at rehabilitation services. However, the extent to which this approach fulfills the expectations of people with DPN and helps them to exercise at home is still to be determined.
A few home-based exercise clinical trials and/or controlled studies have shown positive results for people with DPN, such as reduced DPN symptoms [21], foot pain [15], and peak pressure during gait [24]. However, its effects on the foot–ankle ROM and strength, gait biomechanics, and functionality in people with DPN is still unclear. A feasibility study from the current clinical trial showed that home-based exercises were adhered to (77.7%) and positive changes in clinical and biomechanical measures were seen, such as improved DPN severity and ROM of the midfoot during gait [30]. Considering the scenario described before, we have delineated the following theoretical hypothesis: the home-based exercise program based on an educational booklet will reduce the DPN symptoms and severity, increase foot strength and functionality status, gain functional balance, improve vibratory and tactile plantar sensitivities, and produce beneficial biomechanical modifications, such as a redistribution of forefoot and rearfoot peak pressures and an increase in the foot-ankle range of motion.
Therefore, the aim of this randomized controlled trial was to investigate the effects of an 8-week home-based physiotherapeutic foot–ankle exercise program using an educational booklet on DPN severity and symptoms. The second goal was to investigate the effects of this intervention on tactile and vibration sensitivities, foot muscle strength, plantar pressure distribution, foot–ankle kinematics, and lower limbs kinematics and kinetics during gait at 8 and 16 weeks.

2. Methods

2.1. Study Design and Setting

The FOCA-II was a superiority two-arm, randomized controlled trial that was registered at ClinicalTrials.gov (NCT04008745; registered on 2 July 2019). The protocol was published elsewhere [31]. The Ethics Committee of the School of Medicine of the University of São Paulo approved this trial and the informed consent form that participants signed (Research protocol No. CAAE: 90331718.4.0000.0065, approved 10 May 2019).
Participants with diabetes and DPN were randomly allocated to the control group or intervention group (IG). Participants in the control group did not receive any specific intervention besides usual care recommendations [28]. Participants in the IG performed an 8-week home-based foot-related exercise program that was included in an educational booklet [32]. Participants from both groups were assessed at baseline, 8 weeks (end of intervention), and 16-week follow-up at the Biomechanics Laboratory of the Physical Therapy Department of the University of Sao Paulo.

2.2. Participants and Recruitment

We recruited fifty participants with type 1 or 2 diabetes and DPN, which were classified by IWGDF at risk 1 or 2, between 23 April 2019 and 26 November 2021, from the Department of Endocrinology of the Hospital das Clinicas (see Table 1 for details on demographic data of participants). The eligibility criteria were as follows: (1) adults (18 to 65 years), (2) both sexes, (3) with DPN confirmed by a fuzzy decision support system (score ≥ 2) [9], and (4) who were able to walk independently.
We have not included participants in the study if they had: (1) a unhealed ulcer for at least 6 months and/or an active ulcer; (2) any surgical procedure to the foot–ankle, knee or hip; (3) arthroplasty and/or orthosis of lower limbs; (4) diagnostic of neurological diseases outside of diabetes aetiology; (5) inability to give consistent information or dementia; (6) received any physiotherapy or offloading devices (including shoes or insoles) throughout the intervention period; (7) presented a diagnostic of major vascular complications and/or severe retinopathy.
The principal investigator explained every step of the assessment and follow-up, possible risks, and that no compensation or benefits were to be expected to each eligible participant.

2.3. Blinding, Randomization, and Allocation

An independent researcher prepared the randomization using Clinstat software (University of York, York, UK) [33] and allocated the participants to groups at a 1:1 ratio. The randomization codes were generated in blocks of 4 to 8 to prevent researchers from predicting allocation. The randomization sequence generated was kept in opaque and sealed envelopes numbered sequentially. The random allocation was performed after acquiring baseline data by the principal investigator (EQS). All outcomes’ assessors (RHCJ and JLV) were blinded to block sizes and group codes. Due to the nature of the study (physical therapy intervention based on exercises), it was not possible to blind the principal investigator (EQS) responsible for delivering the intervention. In addition, the participants could also be blinded to the exercise intervention. The trial statistician was also blind to treatment allocation until the main analysis was accomplished.

2.4. Treatment Arms

Control group participants received the usual care, including treatment that were advised by the health team, foot self-care guidelines based on the International Working Group on the Diabetic Foot (IWGDF) [28], and pharmacological treatment. The IWGDF foot self-care guidelines were adapted for this trial and, with the addition of some educational orientations, were printed on a booklet delivered to all participants. The usual care orientations were explained to the participants by the principal investigator during the baseline session, and weekly calls were used to check adherence to the recommended care.
Participants in the IG received the usual care in addition to a home-based foot–ankle exercise program oriented by an educational booklet [32]. The program consisted of three warm-up exercises and six exercises for improving the motion of the interphalangeal, metatarsophalangeal, and ankle joints, as well as increasing strength in the foot–ankle muscles (extrinsic and intrinsic).
The program Intensity was controlled by parameters of the training according to the participant’s effort and needs, such as number of sets and repetitions [34]. Thus, the participants evolved regarding the difficulty level based on a perceived effort scale. The participants were motivated to record the difficulty and effort level and number of repetitions of each exercise in a table within the booklet. The session duration was approximately 30 min for 8 weeks, totaling 24 sessions. For more details on the exercise program and booklet, check the full protocol published elsewhere [31].
The principal investigator (EQS) delivered the first session face to face at the outpatient clinic of the Biomechanics Laboratory to describe the use of the booklet, to ensure the correct execution of the exercises, and to deliver to the IG participants a kit with tools for executing the exercise program (cotton balls, a pencil, and a massage ball). The next sessions (8 weeks, 3 times a week, in total 23 sessions) were performed at home with the supervision of the principal investigator through weekly calls.

2.5. Outcome Measures

The first primary outcome was DPN symptoms, measured using the Brazilian version of the Michigan Neuropathy Screening Instrument questionnaire (MNSI) [35]. The sum of the scores ranged from 0 to 13, with the greater scores indicating worse DPN. The second primary outcome was DPN severity measured by the Decision Support System for Classification of Diabetic Polyneuropathy [9](www.usp.br/labimph/fuzzy, accessed on 28 December 2022). Scores ranged from 0 to 10, with greater values representing a more severe DPN.
Secondary outcomes comprised DPN-related and biomechanical variables. The clinical variables were: (1) tactile sensitivity by the 10 g monofilament at four plantar areas [36], and (2) vibration perception using a 128 Hz tuning fork at the first metatarsophalangeal joint [37].
The biomechanical variables included plantar pressure parameters and joint kinetics and kinematics during gait, as well as toes and hallux strength. Toes and hallux isometric muscle strength were measured orthostatically by a pressure plate (emed q-100; Novel GmbH, Munich, Germany), following the protocol of Mickle et al. (2008) [38]. The toes and hallux maximum force (N) was normalized by the participant’s body weight and analyzed using a standard mask from novel Multimask software v.9.35 (Novel GmbH). Contact area, pressure–time integral, and peak pressure were collected by the pressure plate at 100 Hz. The participants were asked to walk barefoot three times over the platform at a comfortable speed. Seven plantar areas (heel, midfoot, medial forefoot, central forefoot, lateral forefoot, hallux, and toes) were assessed by a geometrical mask using the novel Multimask software v.9.35 (Novel GmbH, Munich, Germany) [39].
Hip, knee, and foot–ankle kinematics and kinetics during gait were also secondary outcomes. We used 42 reflective markers (diameter = 9.5 mm) placed on both lower limbs of the participant following the Plug-In Gait and Oxford Foot Model [40] setup protocols and were tracked by 8 infrared cameras at 100 Hz (VERO; Vicon Motion System Ltd., Oxford, UK). To calculate the net joint moments, we acquire ground reaction forces by a force platform (AMTI OR-6-1000) at 1 kHz. Kinematic and ground reaction force data were sampled and synchronized by an A/D board (192 kHz, 24 bits; Lock Control Box; Vicon Motion System Ltd.). Participants walked barefoot five times over the force platform at a self-selected speed. Gait speed was checked between assessments (baseline, 8 weeks, and 16 weeks) by two photo cells (Model Speed Test Fit; Cefise, Nova Odessa, Brazil) in order to make sure it stayed the same throughout the study assessments.
Force data were processed using a zero-lag low-pass Butterworth fourth-order filter with cutoff frequency of 50 Hz. Gait kinematics data were processed using a zero-lag second-order low-pass filter with cutoff frequency of 6 Hz. The net moments of the ankle, knee, and hip in the sagittal plane were calculated using the bottom-up inverse dynamics method. Gait kinematics (angles) and kinetics (joint moments and power) variables were calculated with the open-source Python package pyCGM2 (www.pycgm2.github.io, accessed on 28 December 2022) (Python Software Foundation, USA) using the Vicon Plug-In Gait protocol and Oxford Foot Model.

2.6. Sample Size and Statistical Analysis

The sample size was calculated in a free software—GPower v. 3.1 (Heinrich-Heine-University of Dusseldorf, Germany) [41]. For this calculation, we adopted the following parameters: a statistical power of 80%, an alpha of 5%, a moderate effect size (0.26); we based our calculations on the DPN symptoms (primary outcome) and ankle sagittal ROM during gait (secondary outcome). The calculated sample sizes were 32 and 40 participants for DPN symptoms and ankle ROM, respectively. Assuming a potential loss to follow-up of 20%, a sample size of 48 participants was needed to identify between-group differences.
SPSS v.23.0 (IBM, USA) was used for the statistical analyses, adopting a 5% significance level. Primary and secondary outcome analyses were based on the intention-to-treat approach and the generalized estimating equation method. Q–Q graphs were plotted to verify the adequacy (normality) of each model. The outcomes were modelled using a binary (linear or gamma with log link) and ordinal logistic model. All pairwise analysis post hoc tests were based on Bonferroni correction.

3. Results

The flowchart of participant recruitment, attendance at follow-up assessment visits, and reasons for dropout are presented in Figure 1. Twelve participants dropped-out from the study (24% in total, control group = 5 (20%), IG = 7 (28%)) and the adherence to the intervention was 72% (Figure 1). No adverse events were reported in relation to the intervention. Some participants in both groups did not attend to the 8- and 16-week follow-up visits due to the COVID-19 pandemic (Figure 1). Table 1 shows that the IG and control group were similar for the most important prognostic indicators.
After 8 weeks, IG showed no significant interaction or group effects for DPN-related outcomes, despite the time effect found in DPN severity that ended up resulting in no differences in the Bonferroni post hoc tests (Table 2). Between-group analysis showed that the heel contact area was significantly increased for the IG compared to the control group (interaction effect p = 0.043). At 8 weeks, there was a group effect showing a significantly increased peak pressure at the heel among the control group participants compared to IG (group effect p = 0.020) (Table 3).
A significant interaction effect was observed after 8 weeks for hip flexor moment at heel strike that was higher in the control group compared to IG (interaction effect p = 0.010) (Table 4). Within-group analysis showed that control group participants reduced the hip flexor moment at 16 weeks compared to 8 weeks (time effect p = 0.007) (Figure 2A). A within-group analysis also revealed a greater hip extensor moment at push off and knee flexor moment at push off at 16 weeks compared to baseline and 8 weeks for the control group (time effect p < 0.001 and p = 0.009, respectively) (Figure 2B).

4. Discussion

The objective of FOCA-II trial was to examine the effectiveness of a 8-week home-based foot–ankle exercise program based on an educational booklet. Overall, 8 weeks of intervention compared to the usual care did not result in any improvement in the primary outcomes (DPN severity and symptoms). Concerning the secondary outcomes, after 8 weeks, the IG participants compared to the control group showed an increase in the heel contact area, in the control group participants compared to IG were observed an increase in the peak pressure at the heel and in the hip flexor moment, and there were important changes in the hip extensor and knee flexor moments during gait in the control group between weeks 8 and 16.
Although the DPN-related outcomes’ changes to the participants post-intervention were disappointing, a recent randomized trial that investigated the effect of a 12-week group-based foot–ankle exercise program did not find any changes in DPN symptoms but observed changes in vibration sensitivity [25]. Two trials using a home-based foot–ankle and lower limb exercise program found significant improvements in DPN symptoms [16,42], but others did not show improvements in vibration sensitivity [19]. Therefore, the evidence for the effectiveness of home-based foot-related exercises in clinical DPN-related parameters remains unclear, even with this new evidence provided by our study. Thus, further studies using different training modalities (group-based, face-to-face, home-based, and one-on-one training) are warranted to determine if exercises targeting DPN musculoskeletal deficits could favorably change clinical outcomes (symptoms and sensitivity).
Our intervention failed to prove its effectiveness for increasing foot strength. Other trials developed using home-based foot–ankle exercises did not assess foot strength [16,21,42,43], making it difficult to conclude if the modality of the intervention is the reason for the lack of effect, especially considering Monteiro et al.’s (2022) [25] results, which used group face-to-face training and no differences were reported. Changes in foot strength following different modalities were found for a 12-week face-to-face program [18], 12-week group-based program focusing on balance training [29], and 12-week mixed (face-to-face and home-based) intervention [23]. Thus, the shorter duration of our program (8 weeks) and modality of the intervention (home-based) might be explaining the lack of effect. Further studies are required to improve the body of evidence for foot-strengthening programs.
Plantar pressure during gait did not change over time. It is well established that plantar pressure monitoring is of paramount importance in people with DPN because high peak pressure is a well-established risk factor for ulcers [44]. Our study revealed a positive outcome in the IG participants after the intervention, showing a significant between-group increase in the contact area during gait; whereas there was a negative outcome for the control group participants, in which the peak pressure at the heel increased after 8 weeks. Fayed et al. (2016) [22] found an increase in the heel contact area as a result of an 8-week face-to-face program of lower limb and foot–ankle exercises in persons with DPN. This finding might support the hypothesis of an improved foot rollover in the IG participants in our study, as the exercises may have interfered with the subtalar motion that influences the progression of the contact of the sole of the foot to the floor during stance, thus changing the contact area [7]. Furthermore, the increased peak pressure observed in the control group deserves special attention because this may reflect a worsening in the foot rollover functioning, likely due to musculoskeletal and biomechanical impairments related to DPN.
Although the lack of effect on the plantar pressure distribution in our study is discouraging, an intervention program similar to ours in duration (8 weeks) and intervention modality (home-based) also did not observe any improvement in plantar pressure parameters or ankle ROM [45]. The ankle and first metatarsophalangeal (MTP) joints ROM were found to be inversely related to peak pressure and pressure–time integral to in people with diabetic neuropathy [46]. Previous studies that observed a reduction in the pressure-loading parameters after the exercise program also observed improvements in the ankle and first MTP joints ROM [16,20,47]. Therefore, as we did not find any improvement in the ankle and first MTP ROM, it is reasonable that we did not find more changes in pressure-loading parameters either.
The results from a feasibility study originated from this FOCA-II trial have shown a significant improvement in the ROM of the hallux relative to forefoot (1st MTP joint) and a decrease in the maximum forefoot relative to hindfoot (midfoot motion) dorsiflexion during gait in the IG [30]. However, unfortunately, the final trial results did not confirm these findings. Overall, the control group increased the hip flexor moment at heel strike compared to IG at 8 weeks and increased the hip extensor moment and knee flexor moment at push off compared to baseline, suggesting a different walking strategy after 8 and 16 weeks. People with DPN present smaller ankle and hip extensor moments at push off [48], greater hip [7] and knee flexor moments at push off, and a higher hip flexor moment at heel strike [48]. In particular, the hip flexor and knee flexor moments alterations were stressed in the control group after 8 and 16 weeks compared to the IG. The findings from the hip flexor at heel strike and extension moments at push off might suggest the existence of a hip strategy that is more optimally suited to propel the body forward at the end of the stance phase and the end of the swing phase/heel strike compared to the ankle joint [49], which has been described as less capable of dealing with the mechanical demands of walking in people with DPN [10,50]. It seems that the exercise program preserved the gait biomechanics of IG participants for 16 weeks, preventing the worsening of their condition, as evidenced both by the gait strategy adopted and by the change in the heel peak pressure.
The exercise program has some strengths that should be highlighted: (1) it was easy to implement and perform, mainly due to the short duration of the exercise session and booklet support; (2) it showed a good adherence among participants (72%), mostly because it did not require weekly visits with a physiotherapist; and (3) it provided educational content regarding DPN’s deficits and self-care guidelines. Future studies should determine the sufficient and effective dose and forms of exercise to increase foot–ankle mobility and strength, improve gait biomechanical parameters, and reduce pressure-loading parameters.
This study had some limitations regarding the RCT methodology; due to the nature of the study (physical therapy intervention based on exercises), it was not possible to blind the principal investigator and the participants. In addition, modality and structure of the exercise program is also a limitation: it was a relatively short intervention period for major musculoskeletal and biomechanical changes, there was limited control over the exercise intensity, and only six exercises were included in the booklet. Furthermore, performing home-based and unsupervised exercises hampered the monitoring of exercise performance, which could have influenced the musculoskeletal and biomechanical outcomes. We did not monitor the glycated hemoglobin and glycemia throughout the stud, which might have influenced the DPN-related outcomes. The clinical goal of this trial was to improve participants’ self-management, which involves the perception of what “good health” is, which, in turn, depends on the education level of the participant [51]. Therefore, having 40% of the participants with a lower level of education could have biased the results.
We emphasize that, based on the findings, the home-based program is recommended for people with mild-to-moderate DPN (risk 1 and 2 IWGDF category), without active foot ulcers or a history of foot ulcers; in addition, it requires a substantive level of education of the participants to understand the information in the booklet. However, all the results presented and discussed previously may be subject to modifications due to the limitations of this study, which should make the reader cautious when interpreting the findings of this RCT.

5. Conclusions

Although the intervention is easy to perform and showed a good adherence (72%), the 8-week home-based foot–ankle exercise program based on an educational booklet plus usual foot care is unlikely to be sufficient to improve the main modifiable risk factors related to foot ulcers. However, it seems to preserve the gait kinetics and pressure distribution pattern of the participants in the IG for 16 weeks, preventing the worsening of their condition. The effects of a home-based foot–ankle exercise in improving DPN-related outcomes and musculoskeletal and biomechanical deficits might not be as unequivocal as we hypothesized.

Author Contributions

Conceptualization, É.Q.S. and I.C.N.S.; methodology, É.Q.S., J.L.V., J.S.S.P.F., R.H.C.-J., R.L.M., and I.C.N.S.; formal analysis, É.Q.S. and I.C.N.S.; investigation, É.Q.S., J.L.V., J.S.S.P.F., R.H.C.-J., R.L.M., E.Y.S., and I.C.N.S.; resources, É.Q.S., J.L.V., J.S.S.P.F., R.H.C.-J., R.L.M., E.Y.S., and I.C.N.S.; data curation, É.Q.S., J.L.V., J.S.S.P.F., R.H.C.-J., and R.L.M.; writing—original draft preparation, É.Q.S., J.L.V., J.S.S.P.F., R.H.C.-J., R.L.M., E.Y.S., and I.C.N.S.; writing—review and editing, É.Q.S., J.L.V., J.S.S.P.F., R.H.C.-J., R.L.M., E.Y.S., and I.C.N.S.; supervision, I.C.N.S.; project administration, I.C.N.S.; funding acquisition, I.C.N.S. All authors have read and agreed to the published version of the manuscript.

Funding

This research was funded by National Council for Scientific and Technological Development, Brazil (CNPq) (28/2018 FOCA Trial 407252/2018-5). EQS and JV were funded by Agency Coordination of Improvement of Higher Education Personnel (CAPES, financial code 001). RC, JF, and RM were funded by Sao Paulo Research Foundation (FAPESP) (2021/00807-8, 2019/02522-0, 2017/17848-3, respectively). ICNS is a fellow of the CNPq (Process: 304124/2018-4). The funders do not have any role in the study and do not have any authority over any study activity or in the decision to submit the report for publication.

Institutional Review Board Statement

The study was conducted according to the guidelines of the Declaration of Helsinki and approved by the Ethics Committee of the School of Medicine of the University of São Paulo (Research protocol No. CAAE: 90331718.4.0000.0065, approved 10 May 2019).

Informed Consent Statement

Informed consent was obtained from all participants involved in the trial.

Data Availability Statement

Data are owned by the Laboratório de Biomecânica do Movimento e Postura Humana (LaBiMPH) of Departamento de Fisioterapia, Fonoaudiologia e Terapia Ocupacional da Faculdade de Medicina da Universidade de São Paulo, São Paulo, Brazil. Rua Cipotânea, 51. Requests to use, share, and disseminate such data must be sent to [email protected].

Acknowledgments

The authors acknowledge Marcos Duarte from the Universidade Federal do ABC for all support with the Phython programming. Additionally, we acknowledge Ana Claudia Latronico Xavier and the Endocrinology departament of the Hospital das Clínicas, Faculdade de Medicina, Universidade de São Paulo for all their support in the recruitment of the participants throughout the trial.

Conflicts of Interest

The authors declare no conflict of interest.

References

  1. Cieza, A.; Causey, K.; Kamenov, K.; Hanson, S.W.; Chatterji, S.; Vos, T. Global Estimates of the Need for Rehabilitation Based on the Global Burden of Disease Study 2019: A Systematic Analysis for the Global Burden of Disease Study 2019. Lancet 2020, 396, 2006–2017. [Google Scholar] [CrossRef] [PubMed]
  2. Andersen, H.; Gjerstad, M.D.; Jakoben, J. Atrophy of Foot Muscles A Measure of Diabetic Neuropathy. Diabetes Care 2004, 27, 2382–2385. [Google Scholar] [CrossRef] [PubMed] [Green Version]
  3. Boulton, A.J.M. The Diabetic Foot: From Art to Science. Diabetologia 2004, 47, 1343–1353. [Google Scholar] [CrossRef] [PubMed]
  4. Bus, S.A.; Yang, Q.X.; Wang, J.H.; Smith, M.B.; Wunderlich, R.; Cavanagh, P.R. Intrinsic Muscle Atrophy and Toe Deformity in the Diabetic Neuropathic Foot. Diabetes Care 2002, 25, 1444–1450. [Google Scholar] [CrossRef] [PubMed] [Green Version]
  5. Ijzerman, T.H.; Schaper, N.C.; Melai, T.; Meijer, K.; Willems, P.J.B.; Savelberg, H.H.C.M. Lower Extremity Muscle Strength Is Reduced in People with Type 2 Diabetes, with and without Polyneuropathy, and Is Associated with Impaired Mobility and Reduced Quality of Life. Diabetes Res. Clin. Pract. 2011, 95, 345–351. [Google Scholar] [CrossRef] [Green Version]
  6. Martinelli, A.R.; Montavani, A.M.; Nozabieli, A.J.L.; Ferreira, D.M.A.; Barela, J.A.; Camargo, M.R.; Fregonesi, C.E.P.T. The Foot Muscle Strength and Ankle Mobility for the Gait Parameters in Diabetic Neuropathies. Foot 2013, 23, 17–21. [Google Scholar] [CrossRef]
  7. Sacco, I.C.N.; Picon, A.P.; Macedo, D.O.; Butugan, M.K.; Watari, R.; Sartor, C.D. Alterations in the Lower Limb Joint Moments Precede the Peripheral Neuropathy Diagnosis in Diabetes Patients. Diabetes Technol. Ther. 2015, 17, 405–412. [Google Scholar] [CrossRef]
  8. Sawacha, Z.; Guarneri, G.; Avogaro, A.; Cobelli, C. A New Classification of Diabetic Gait Pattern Based on Cluster Analysis of Biomechanical Data. J. Diabetes Sci. Technol. 2010, 4, 1127–1138. [Google Scholar] [CrossRef] [Green Version]
  9. Watari, R.; Sartor, C.; Picon, A.; Butugan, M.; Amorim, C.; Ortega, N.; Sacco, I. Effect of Diabetic Neuropathy Severity Classified by a Fuzzy Model in Muscle Dynamics during Gait. J. Neuroeng. Rehabil. 2014, 11, 11. [Google Scholar] [CrossRef] [Green Version]
  10. Williams, D.S.B.; Brunt, D.; Tanenberg, R.J. Diabetic Neuropathy Is Related to Joint Stiffness during Late Stance Phase. J. Appl. Biomech. 2007, 23, 251–260. [Google Scholar] [CrossRef]
  11. Zhang, Y.; Lazzarini, P.A.; McPhail, S.M.; van Netten, J.J.; Armstrong, D.G.; Pacella, R.E. Global Disability Burdens of Diabetes-Related Lower-Extremity Complications in 1990 and 2016. Diabetes Care 2020, 43, 964–974. [Google Scholar] [CrossRef]
  12. Selvarajah, D.; Kar, D.; Khunti, K.; Davies, M.J.; Scott, A.R.; Walker, J.; Tesfaye, S. Diabetic Peripheral Neuropathy: Advances in Diagnosis and Strategies for Screening and Early Intervention. Lancet Diabetes Endocrinol. 2019, 7, 938–948. [Google Scholar] [CrossRef] [PubMed] [Green Version]
  13. Van Netten, J.J.; Sacco, I.C.N.; Lavery, L.A.; Monteiro-Soares, M.; Rasmussen, A.; Raspovic, A.; Bus, S.A. Treatment of Modifiable Risk Factors for Foot Ulceration in Persons with Diabetes: A Systematic Review. Diabetes Metab. Res. Rev. 2020, 36, e3271. [Google Scholar] [CrossRef] [PubMed] [Green Version]
  14. Allet, L.; Armand, S.; Aminian, K.; Pataky, Z.; Golay, A.; de Bie, R.A.; de Bruin, E.D. An Exercise Intervention to Improve Diabetic Patients’ Gait in a Real-Life Environment. Gait Posture 2010, 32, 185–190. [Google Scholar] [CrossRef]
  15. Cruvinel Júnior, R.H.; Ferreira, J.S.S.P.; Beteli, R.I.; Silva, É.Q.; Veríssimo, J.L.; Monteiro, R.L.; Suda, E.Y.; Sacco, I.C.N. Foot-Ankle Functional Outcomes of Using the Diabetic Foot Guidance System (SOPeD) for People with Diabetic Neuropathy: A Feasibility Study for the Single-Blind Randomized Controlled FOotCAre (FOCA) Trial I. Pilot Feasibility Stud. 2021, 7. [Google Scholar] [CrossRef]
  16. Kanchanasamut, W.; Pensri, P. Effects of Weight-Bearing Exercise on a Mini-Trampoline on Foot Mobility, Plantar Pressure and Sensation of Diabetic Neuropathic Feet; a Preliminary Study. Diabet Foot Ankle 2017, 8, 1287239. [Google Scholar] [CrossRef] [PubMed] [Green Version]
  17. Kruse, R.L.; Lemaster, J.W.; Madsen, R.W. Fall and Balance Outcomes after an Intervention to Promote Leg Strength, Balance, and Walking in People with Diabetic Peripheral Neuropathy: “Feet First” Randomized Controlled Trial. Phys. Ther. 2010, 90, 1568–1579. [Google Scholar] [CrossRef]
  18. Sartor, C.D.; Hasue, R.H.; Cacciari, L.P.; Butugan, M.K.; Watari, R.; Pássaro, A.C.; Giacomozzi, C.; Sacco, I.C. Effects of Strengthening, Stretching and Functional Training on Foot Function in Patients with Diabetic Neuropathy: Results of a Randomized Controlled Trial. BMC Musculoskelet Disord. 2014, 15, 137. [Google Scholar] [CrossRef] [Green Version]
  19. Win, M.M.T.; Fukai, K.; Nyunt, H.H.; Linn, K.Z. Hand and Foot Exercise for Diabetic Peripheral Neurophaty: A Randomized Controlled Trial. Nurs. Health Sci. 2020, 22, 416–426. [Google Scholar] [CrossRef]
  20. Cerrahoglu, L.; Koşan, U.; Sirin, T.C.; Ulusoy, A. Range of Motion and Plantar Pressure Evaluation for the Effects of Self-Care Foot Exercises on Diabetic Patients with and Without Neuropathy. J. Am. Podiatr. Med. Assoc. 2016, 106, 189–200. [Google Scholar] [CrossRef]
  21. Chang, C.-F.; Chang, C.-C.; Hwang, S.-L.; Chen, M.-Y. Effects of Buerger Exercise Combined Health-Promoting Program on Peripheral Neurovasculopathy Among Community Residents at High Risk for Diabetic Foot Ulceration. Worldviews Evid. Based Nurs. 2015, 12, 145–153. [Google Scholar] [CrossRef]
  22. Fayed, E.E.; Mohamed Badr, N.; Mahmoud, S.; Hakim, S.A. Exercise Therapy Improves Planter Pressure Distribution in Patients with Diabetic Peripheral Neuropathy. Int. J. PharmTech Res. 2016, 9, 151–159. [Google Scholar]
  23. Francia, P.; Anichini, R.; de Bellis, A.; Seghieri, G.; Lazzeri, R.; Paternostro, F.; Gulisano, M. Diabetic Foot Prevention: The Role of Exercise Therapy in the Treatment of Limited Joint Mobility, Muscle Weakness and Reduced Gait Speed. Ital. J. Anat. Embryol. 2015, 120, 21–32. [Google Scholar] [CrossRef] [PubMed]
  24. Goldsmith, J.R.; Lidtke, R.H.; Shott, S. The Effects of Range-of-Motion Therapy on the Plantar Pressures of Patients with Diabetes Mellitus. J. Am. Podiatr. Med. Assoc. 2002, 92, 483–490. [Google Scholar] [CrossRef]
  25. Monteiro, R.L.; Ferreira, J.S.S.P.; Silva, É.Q.; Cruvinel-Júnior, R.H.; Veríssimo, J.L.; Bus, S.A.; Sacco, I.C.N. Foot–Ankle Therapeutic Exercise Program Can Improve Gait Speed in People with Diabetic Neuropathy: A Randomized Controlled Trial. Sci. Rep. 2022, 12, 7561. [Google Scholar] [CrossRef] [PubMed]
  26. Pataky, Z.; de León Rodriguez, D.; Allet, L.; Golay, A.; Assal, M.; Assal, J.P.; Hauert, C.A. Biofeedback for Foot Offloading in Diabetic Patients with Peripheral Neuropathy. Diabet. Med. 2010, 27, 61–64. [Google Scholar] [CrossRef]
  27. York, R.M.; Perell-Gerson, K.L.; Barr, M.; Durham, J.; Roper, J.M. Motor Learning of a Gait Pattern to Reduce Forefoot Plantar Pressures in Individuals with Diabetic Peripheral Neuropathy. PM&R 2009, 1, 434–441. [Google Scholar] [CrossRef]
  28. Schaper, N.C.; van Netten, J.J.; Apelqvist, J.; Bus, S.A.; Hinchliffe, R.J.; Lipsky, B.A. Practical Guidelines on the Prevention and Management of Diabetic Foot Disease (IWGDF 2019 Update). Diabetes Metab. Res. Rev. 2020, 36, e3266. [Google Scholar] [CrossRef] [Green Version]
  29. Allet, L.; Armand, S.; de Bie, R.A.; Golay, A.; Monnin, D.; Aminian, K.; Staal, J.B.; de Bruin, E.D. The Gait and Balance of Patients with Diabetes Can Be Improved: A Randomised Controlled Trial. Diabetologia 2010, 53, 458–466. [Google Scholar] [CrossRef] [Green Version]
  30. Silva, É.Q.; Santos, D.P.; Beteli, R.I.; Monteiro, R.L.; Ferreira, J.S.S.P.; Cruvinel-Junior, R.H.; Donini, A.; Verissímo, J.L.; Suda, E.Y.; Sacco, I.C.N. Feasibility of a Home-Based Foot–Ankle Exercise Programme for Musculoskeletal Dysfunctions in People with Diabetes: Randomised Controlled FOotCAre (FOCA) Trial II. Sci. Rep. 2021, 11, 12404. [Google Scholar] [CrossRef]
  31. Silva, E.Q.; Suda, E.Y.; Santos, D.P.; Veríssimo, J.L.; Ferreira, J.S.S.P.; Cruvinel Júnior, R.H.; Monteiro, R.L.; Sartor, C.D.; Sacco, I.C.N. Effect of an Educational Booklet for Prevention and Treatment of Foot Musculoskeletal Dysfunctions in People with Diabetic Neuropathy: The FOotCAre (FOCA) Trial II, a Study Protocol of a Randomized Controlled Trial. Trials 2020, 21, 180. [Google Scholar] [CrossRef]
  32. Veríssimo, J.L.; Sacco, I.C.N.; de Almeida, M.H.M.; Sartor, C.D.; Suda, E.Y. Development of a Customized Booklet of Foot-Ankle Exercises for People with Diabetes Mellitus as a Management and Prevention Tool for Musculoskeletal Complications: A Customized Booklet of Foot-Ankle Exercises for People with Diabetes. Braz. J. Phys. Ther. 2022, 26, 100402. [Google Scholar] [CrossRef] [PubMed]
  33. Altman, D.G.; Bland, J.M. How to Randomise. Br. Med. J. 1999, 319, 703–704. [Google Scholar] [CrossRef] [Green Version]
  34. Fragala, M.S.; Cadore, E.L.; Dorgo, S.; Izquierdo, M.; Kraemmer, W.J.; Peterson, M.D.; Ryan, E.D. Resistance Training for Older Adults: Position Statement from the National Strength and Conditioning Association. J. Strength Cond. Res. 2019, 33, 2019–2052. [Google Scholar] [CrossRef] [PubMed]
  35. Sartor, C.; Oliveira, M.; Campos, V.; Ferreira, J.; Sacco, I. Brazilian Journal of Cross-Cultural Adaptation and Measurement Properties of the Brazilian Version of the Michigan Neuropathy Screening Instrument. Braz. J. Phys. Ther. 2018, 22, 222–230. [Google Scholar] [CrossRef]
  36. McIllhatton, A.; Lanting, S.; Lambkin, D.; Leigh, L.; Casey, S.; Chuter, V. Reliability of Recommended Non-Invasive Chairside Screening Tests for Diabetes-Related Peripheral Neuropathy: A Systematic Review with Meta-Analyses. BMJ Open Diabetes Res. Care 2021, 9, e002528. [Google Scholar] [CrossRef] [PubMed]
  37. Perkins, B.A.; Olaleye, D.; Zinman, B.; Bril, V. Simple Screening Test for Peripheral Neuropathy in the Diabetes Clinic. Diabetes Care 2001, 24, 250–256. [Google Scholar] [CrossRef] [Green Version]
  38. Mickle, K.J.; Chambers, S.; Steele, J.R.; Munro, B.J. A Novel and Reliable Method to Measure Toe Flexor Strength. Clin. Biomech. 2008, 23, 683. [Google Scholar] [CrossRef]
  39. Ellis, S.J.; Stoecklein, H.; Yu, J.C.; Syrkin, G.; Hillstrom, H.; Deland, J.T. The Accuracy of an Automasking Algorithm in Plantar Pressure Measurements. HSS J. 2011, 7, 57–63. [Google Scholar] [CrossRef] [Green Version]
  40. Burrows, R.F.; Gan, E.T.; Gallus, A.S.; Wallace, E.M.; Burrows, E.A. A Randomised Double-Blind Placebo Controlled Trial of Low Molecular Weight Heparin as Prophylaxis in Preventing Venous Thrombolic Events after Caesarean Section: A Pilot Study. Br. J. Obstet. Gynaecol. 2001, 108, 835–839. [Google Scholar] [CrossRef]
  41. Faul, F.; Erdfelder, E.; Lang, A.G.; Buchner, A. G * Power 3: A Flexible Statistical Power Analysis Program for the Social, Behavioral, and Biomedical Sciences. Behav. Res. Methods 2007, 39, 175–191. [Google Scholar] [CrossRef]
  42. Suryani, M.; Samekto, W.; Heri-Nugroho; Susanto, H.; Dwiantoro, L. Effect of Foot-Ankle Flexibility and Resistance Exercise in the Secondary Prevention of Plantar Foot Diabetic Ulcer. J. Diabetes Complicat. 2021, 35, 107968. [Google Scholar] [CrossRef] [PubMed]
  43. Iunes, D.H.; Rocha, C.B.J.; Borges, N.C.S.; Marcon, C.O.; Pereira, V.M.; Carvalho, L.C. Self-Care Associated with Home Exercises in Patients with Type 2 Diabetes Mellitus. PLoS ONE 2014, 9, e114151. [Google Scholar] [CrossRef] [PubMed] [Green Version]
  44. de Castro, J.P.W.; Ferreira, F.C.; Vargas, J.G.F.; Bosso, L.B.; Nabozny, N.; Martins, C.M.; Farhat, G.; Gomes, R.Z. Accuracy of Foot Pressure Measurement on Predicting the Development of Foot Ulcer in Patients with Diabetes: A Systematic Review and Meta-Analysis. J. Diabetes Sci. Technol. 2021, 17, 1–9. [Google Scholar] [CrossRef] [PubMed]
  45. Searle, A.; Spink, M.J.; Oldmeadow, C.; Chiu, S.; Chuter, V.H. Calf Muscle Stretching Is Ineffective in Increasing Ankle Range of Motion or Reducing Plantar Pressures in People with Diabetes and Ankle Equinus: A Randomised Controlled Trial. Clin. Biomech. 2019, 69, 52–57. [Google Scholar] [CrossRef]
  46. Zimny, S.; Schatz, H.; Pfohl, M. The Role of Limited Joint Mobility in Diabetic Patients with an At-Risk Foot. Diabetes Care 2004, 27, 942–946. [Google Scholar] [CrossRef] [Green Version]
  47. Maeshige, N.; Uemura, M.; Hirasawa, Y.; Yoshikawa, Y.; Moriguchi, M.; Kawabe, N.; Fujii, M.; Terashi, H.; Fujino, H. Immediate Effects of Weight-Bearing Calf Stretching on Ankle Dorsiflexion Range of Motion and Plantar Pressure During Gait in Patients with Diabetes Mellitus. Int. J. Lower Extremity Wounds 2021, 1–7. [Google Scholar] [CrossRef]
  48. Fernando, M.; Crowther, R.; Lazzarini, P.; Sangla, K.; Cunningham, M.; Buttner, P.; Golledge, J. Biomechanical Characteristics of Peripheral Diabetic Neuropathy: A Systematic Review and Meta-Analysis of Findings from the Gait Cycle, Muscle Activity and Dynamic Barefoot Plantar Pressure. Clin. Biomech. 2013, 28, 831–845. [Google Scholar] [CrossRef]
  49. Mueller, M.J.; Sinacore, D.R.; Hoogstrate, S.; Daly, L. Hip and Ankle Walking Strategies: Effect on Peak Plantar Pressures and Implications for Neuropathic Ulceration. Arch. Phys. Med. Rehabil. 1994, 75, 1196–1200. [Google Scholar] [CrossRef]
  50. Yavuzer, G.; Yetkin, I.; Toruner, F.B.; Koca, N.; Bolukbas, N. Gait Deviations of Patients with Diabetes Mellitus: Looking beyond Peripheral Neuropathy. Eur. Medicophys. 2006, 42, 127–133. [Google Scholar]
  51. Grossman, M. On the Concept of Helath Capital and the Demand for Health. J. Polit. Econ. 1972, 80, 223–255. [Google Scholar] [CrossRef]
Figure 1. Flowchart of participant recruitment, assessments, and follow-up process of FOCA-II trial.
Applsci 13 01423 g001
Figure 2. (A) Mean time series of the hip flexor moment during gait of the intervention group at baseline (T00) and 8 weeks (T08). (B) Mean time series of the hip flexor moment during gait of the control group at baseline (T00) and 8 weeks (T08). The dotted lines correspond to end of the propulsion phase/beginning of the swing phase of gait.
Applsci 13 01423 g002
Table 1. DPN-related outcomes and anthropometric and demographic characteristics at baseline for the control and intervention groups.
Intervention Group (n = 25)
Mean (SD)
Control Group (n = 25)
Mean (SD)
Age (years)59.1 (6.4)56.5 (9.4)
Body mass (kg)74.4 (15.6)74.2 (14.8)
Height (cm)162.0 (0.1)164.0 (0.1)
Body mass index (kg/m2)23.5 (4.8)22.9 (3.6)
Sex (Male/Female)(M = 6/F = 19)(M = 5/F = 20)
Type 2 Diabetes (number of participants, %)22 (88%)19 (76%)
Time of onset of diabetes (years)13.8 (10.0)18.2 (9.8)
Education
   Elementary education incomplete 4 (16%)2 (8%)
   Elementary education complete 6 (24%)7 (28%)
   High school complete7(28%)9 (36%)
   Higher education incomplete1 (4%)2 (8%)
   Higher education complete7 (28%)5 (20%)
Socioeconomic status
   1 to 3 Brazilian minimum salary/month13 (52%)15 (60%)
   3 to 5 Brazilian minimum salary/month5 (20%)4 (16%)
   Up to 5 Brazilian minimum salary/month6 (24%)2 (8%)
DPN symptoms (MNSI score)5.4 (1.9)6.9 (2.1)
DPN severity (Fuzzy score)4.4 (2.6)4.6 (2.3)
Tactile sensitivity (number of areas, median (IQR))0 (0–4)0 (0–3)
Vibration Perception (number of feet, %)
   absent—L 10 (40%)6 (24%)
   absent—R10 (40%)9 (36%)
   reduced—L5 (20%)9 (36%)
   reduced—R3 (12%)5 (20%)
Foot Strength (%BW)
   Hallux—L13.8 (6.6)11.7 (6.2)
   Hallux—R13.8 (6.9)13.6 (6.8)
   Toe—L9.4 (5.2)9.3 (5.1)
   Toe—R9.7 (4.2)8.5 (2.9)
Abbreviations: L—left, R—right, BW—bodyweight, MNSI—Michigan Neuropathy Screening Instrument.
Table 2. Estimated mean (standard error, SE), p-values of the interaction, group and time effects, and between-group mean difference at 8 and 16 weeks (95% confidence interval) of the clinical outcomes for each group (control and intervention) at two follow-up assessments (8 and 16 weeks).
Intervention Group
(n = 25)
Control Group
(n = 25)
Between-Group Difference
(CI 95%)
GEE Analysis
Variables8-Week
Estimated Mean (SE)
16-Week
Estimated Mean (SE)
p8-Week
Estimated Mean (SE)
16-Week
Estimated Mean (SE)
p8 Weeks16 WeeksGroup × TimeGroupTime
DPN symptoms (MNSI score)5.3 (0.5)5.6 (0.5)-6.2 (0.6)6.0 (0.6)-−0.9 (−2.3 to 0.6)−0.4 (−1.9 to 1.2)0.2760.1320.346
DPN severity (Fuzzy score)3.7 (0.5)3.9 (0.6)-3.3 (0.5)3.6 (0.4)-0.4 (−1.0 to 1.8)0.4 (−1.1 to 1.8)0.7650.6410.002
Tactile sensitivity (number of areas, (median, IQR])0 [0–1]0 [0–0]-0 [0–2]0 [0–0.75]-- 0.0560.6180.669
Vibration Perception (number of participants, %)
absent—L2 (11.8%)1 (7.1%)0.8762 (11.1%)2 (11.1%)0.615- ---
absent—R10 (55.6%)5 (14.3%)0.5299 (52.9%)0 (0.0%)0.476- ---
reduced—L9 (52.9%)8 (57.1%)0.5818 (44.4%)8 (44.4%)0.677- ---
reduced—R2 (11.1%)7 (50%)0.0181 (5.9%)7 (38.9%)0.702- ---
Foot Strength (%BW)
Hallux—L13.8 (1.1)13.1 (1.3)-11.6 (1.3)12.0 (1.2)-2.2 (−1.3 to 5.6)1.0 (−2.5 to 4.7)0.7160.2700.989
Hallux—R13.8 (1.0)14.0 (1.1)-11.6 (1.0)13.3 (1.2)-2.2 (−0.6 to 4.9)0.6 (−2.5 to 3.8)0.4150.4530.346
Toes—L10.5 (1.1)10.2 (1.0)-9.3 (1.0)9.7 (0.9)-1.1 (−1.8 to 4.1)0.6 (−2.2 to 3.3)0.6290.6380.394
Toes—R8.6 (0.9)10.3 (1.0)-8.9 (0.7)9.1 (0.8)-0.3 (−0.6 to 1.9)1.2 (−1.3 to 3.7)0.2100.4780.344
Abbreviation: IQR—interquartile range, L—left; R—right; BW—body weight; MNSI—Michigan Neuropathy Screening Instrument; GEE—generalized estimating equations.
Table 3. Estimated mean (standard error, SE), p-values of the interaction, group and time effects, and between-group mean difference at 8 and 16 weeks (95% confidence interval) of the plantar pressure variables during gait for each group (control and intervention) at baseline and two follow-up assessments (baseline, 8 and 16 weeks).
Intervention Group
(n = 25)
Control Group
(n = 25)
Between-Group Difference
(CI 95%)
GEE Analysis
Region of InterestVariablesBaseline
Estimated Mean (SE)
8-Week
Estimated Mean (SE)
16-Week
Estimated Mean (SE)
Baseline
Estimated Mean (SE)
8-Week
Estimated Mean (SE)
16-Week
Estimated Mean (SE)
8 Weeks16 WeeksGroup × TimeGroupTime
ToesContact Area [cm2]10.26 (0.56)18.26 (1.03)19.02 (1.02)10.76 (0.49)18.06 (0.89)17.76 (0.94)0.20 (−2.47 to 2.87)1.25 (−1.47 to 3.98)0.3840.844<0.001
Peak [kPa]391.10 (26.82)325.42 (27.68)365.34 (29.73)361.56 (19.21)365.02 (29.57)366.29 (29.83)−39.59 (−118.99 to 39.79)−0.95 (−83.51 to 81.60)0.2090.8860.269
Pressure–time integral [(kPa)·s]133.54 (9.70)104.11 (8.50)129.79 (16.09)120.08 (8.01)118.78 (10.30)116.10 (9.13)−14.66 (−40.85 to 11.53)13.68 (−22.58 to 49.96)0.0540.7840.045
HalluxContact Area [cm2]18.15 (0.61)8.48 (0.54)8.37 (0.35)16.07 (0.59)8.87 (0.59)8.84 (0.56)−0.38 (−1.97 to 1.20)−0.46 (−1.77 to 0.84)0.1850.886<0.001
Peak [kPa]406.20 (41.89)457.92 (58.67)457.98 (53.12)353.08 (29.76)402.18 (51.63)420.45 (53.76)55.73 (−97.45 to 208.92)37.52 (−110.61 to 185.67)0.8760.4110.030
Pressure–time integral [(kPa)·s]122.46 (13.57)133.79 (25.34)137.03 (18.24)96.82 (9.85)106.86 (14.63)127.91 (17.52)26.92 (−30.42 to 84.27)9.11 (−40.46 to 58.70)0.2960.2930.003
Forefoot medialContact Area [cm2]9.46 (0.40)10.78 (0.58)10.65 (0.64)10.03 (0.60)9.94 (0.75)10.45 (0.71)0.83 (−1.03 to 2.70)0.20 (−1.68 to 2.09)0.1330.8600.025
Peak [kPa]294.05 (29.69)326.05 (35.43)341.09 (48.19)322.56 (33.79)289.13 (44.75)311.74 (37.57)36.91 (−74.95 to 148.79)29.34 (−90.43 to 149.12)0.1720.7870.763
Pressure–time integral [(kPa)·s]102.36 (9.67)110.24 (12.76)120.21 (15.25)114.20 (15.72)101.30 (19.67)117.07 (15.89)8.93 (−37.02 to 54.89)3.14 (−40.04 to 46.32)0.3580.9980.259
Forefoot centralContact Area [cm2]26.18 (0.57)26.81 (0.76)26.59 (0.77)27.22 (0.55)27.47 (0.63)27.03 (0.61)−0.65 (−2.61 to 1.29)−0.43 (−2.36 to 1.49)0.5460.4190.224
Peak [kPa]554.00 (36.21)592.86 (49.06)596.23 (34.83)556.96 (32.51)558.92 (43.88)585.06 (45.04)33.94 (−95.07 to 162.96)11.16 (−100.43 to 122.76)0.7420.7840.304
Pressure–time integral [(kPa)·s]205.91 (16.62)198.47 (16.29)200.23 (12.18)192.64 (11.27)184.84 (11.51)191.37 (11.78)13.62 (−25.48 to 52.73)8.86 (−24.36 to 42.08)0.9190.4820.525
Forefoot lateralContact Area [cm2]12.29 (0.38)12.39 (0.58)12.30 (0.45)11.72 (0.47)12.31 (0.52)11.74 (0.53)0.08 (−1.45 to 1.62)0.55 (−0.82 to 1.93)0.5580.5310.309
Peak [kPa]455.69 (37.04)460.79 (51.91)454.30 (56.75)465.58 (44.45)479.59 (51.36)440.05 (38.89)−18.79 (−161.94 to 124.34)14.24 (−120.60 to 149.09)0.7730.9400.615
Pressure–time integral [(kPa)·s]164.05 (13.35)149.90 (12.43)160.28 (18.94)148.15 (13.86)149.82 (13.30)137.67 (11.72)0.08 (−35.61 to 35.77)22.61 (−21.05 to 66.27)0.2410.4480.745
MidfootContact Area [cm2]14.95 (0.91)14.90 (1.10)14.98 (0.96)15.19 (0.78)15.54 (0.92)14.69 (0.96)−0.64 (−3.47 to 2.18)0.28 (−2.38 to 2.95)0.2450.8810.379
Peak [kPa]167.23 (17.79)161.60 (16.43)151.64 (16.48)176.90 (22.21)163.70 (19.53)164.37 (17.99)−2.10 (−52.14 to 47.92)12.72 (−60.55 to 35.10)0.8600.7320.123
Pressure–time integral [(kPa)·s]58.76 (5.69)52.08 (6.42)51.02 (7.79)59.52 (7.60)56.05 (7.17)51.58 (6.14)−3.97 (−22.85 to 14.91)−0.56 (−20.01 to 18.89)0.6470.8440.114
HeelContact Area [cm2]35.12 (1.08)37.03 (1.29) *36.59 (1.18)34.55 (1.24)34.33 (1.60) *34.28 (1.49)2.70 (1.18 to 4.22)2.30 (−1.43 to 6.05)0.043 *0.3140.177
Peak [kPa]341.93 (16.62)338.21 (19.01) &339.93 (15.71)389.30 (23.44)402.37 (21.17) &378.44 (22.73)−64.16 (−119.93 to −8.39)−38.51 (−92.69 to 15.66)0.5680.020 &0.776
Pressure–time integral [(kPa)·s]100.95 (5.81)93.86 (4.06)90.11 (3.73)105.08 (5.07)104.55 (6.34)102.15 (5.85)−10.69 (−25.45 to 4.06)−12.03 (−25.65 to 1.58)0.4390.1590.061
Abbreviations: GEE—generalized estimating equations. * interaction effect p = 0.043, difference between intervention and control group at 8 weeks. & group effect p = 0.020, difference between intervention and control group at 8 weeks.
Table 4. Estimated mean (standard error, SE), p-values of the interaction, group and time effects, and between-group mean difference at 8 and 16 weeks (95% confidence interval) of the foot–ankle kinematics and hip, knee, and ankle joint moments during gait for each group (control and intervention) at three assessments (baseline, 8, and 16 weeks).
Intervention Group
(n = 25)
Control Group
(n = 25)
Between-Group Difference
(CI 95%)
GEE Analysis
VariablesBaseline
Estimated Mean (SE)
8-Week
Estimated Mean (SE)
16-Week
Estimated Mean (SE)
Baseline
Estimated Mean (SE)
8-Week
Estimated Mean (SE)
16-Week
Estimated Mean (SE)
8 Weeks16 WeeksGroup × TimeGroupTime
ANKLE
Ankle ROM (degree)24.07 (0.65)23.66 (0.82)24.63 (0.96)23.44 (0.65)22.71 (0.83)24.65 (0.81)0.96 (−1.47 to 3.40)0.00 (−2.43 to 2.43)0.7180.4940.065
Ankle dorsiflexion at heel strike (degree)−2.53 (1.76)−0.04 (1.14)−2.15 (1.81)−0.51 (1.60)−0.82 (1.70)0.31 (1.49)−0.78 (−3.25 to 4.82)−1.76 (−6.49 to 2.95)0.4630.4370.738
Ankle plantarflexion at push off (degree)−9.27 (2.05)−7.21(1.59)−10.34 (1.93)−5.20 (1.83)−5.33 (2.00)−8.34 (1.66)−1.75 (−6.76 to 3.26)−2.00 (−7.00 to 2.99)0.7590.1340.215
Ankle plantarflexor moment at heel strike (Nm/BM·Height)−0.05 (0.01)−0.04 (0.01)−0.05 (0.02)−0.05 (0.01)−0.03 (0.01)−0.07 (0.03)−0.01 (−0.04 to 0.02)−0.02 (−0.10 to 0.06)0.6900.8350.492
Ankle plantarflexor moment at push off (Nm/BM·Height)1.29 (0.03)1.28 (0.04)1.20 (0.05)1.23 (0.05)1.16 (0.08)1.25 (0.03)0.12 (−0.06 to 0.31)−0.05 (−1.72 to 0.06)0.1630.4350.372
Ankle peak eccentric power at the push off (W/BM·Height)2.24 (0.10)2.17 (0.11)2.06 (0.13)2.36 (0.16)2.20 (0.18)2.32 (0.11)−0.02 (−0.46 to 0.41)−2.51 (−5.87 to 8.41)0.6230.3970.345
KNEE AND HIP
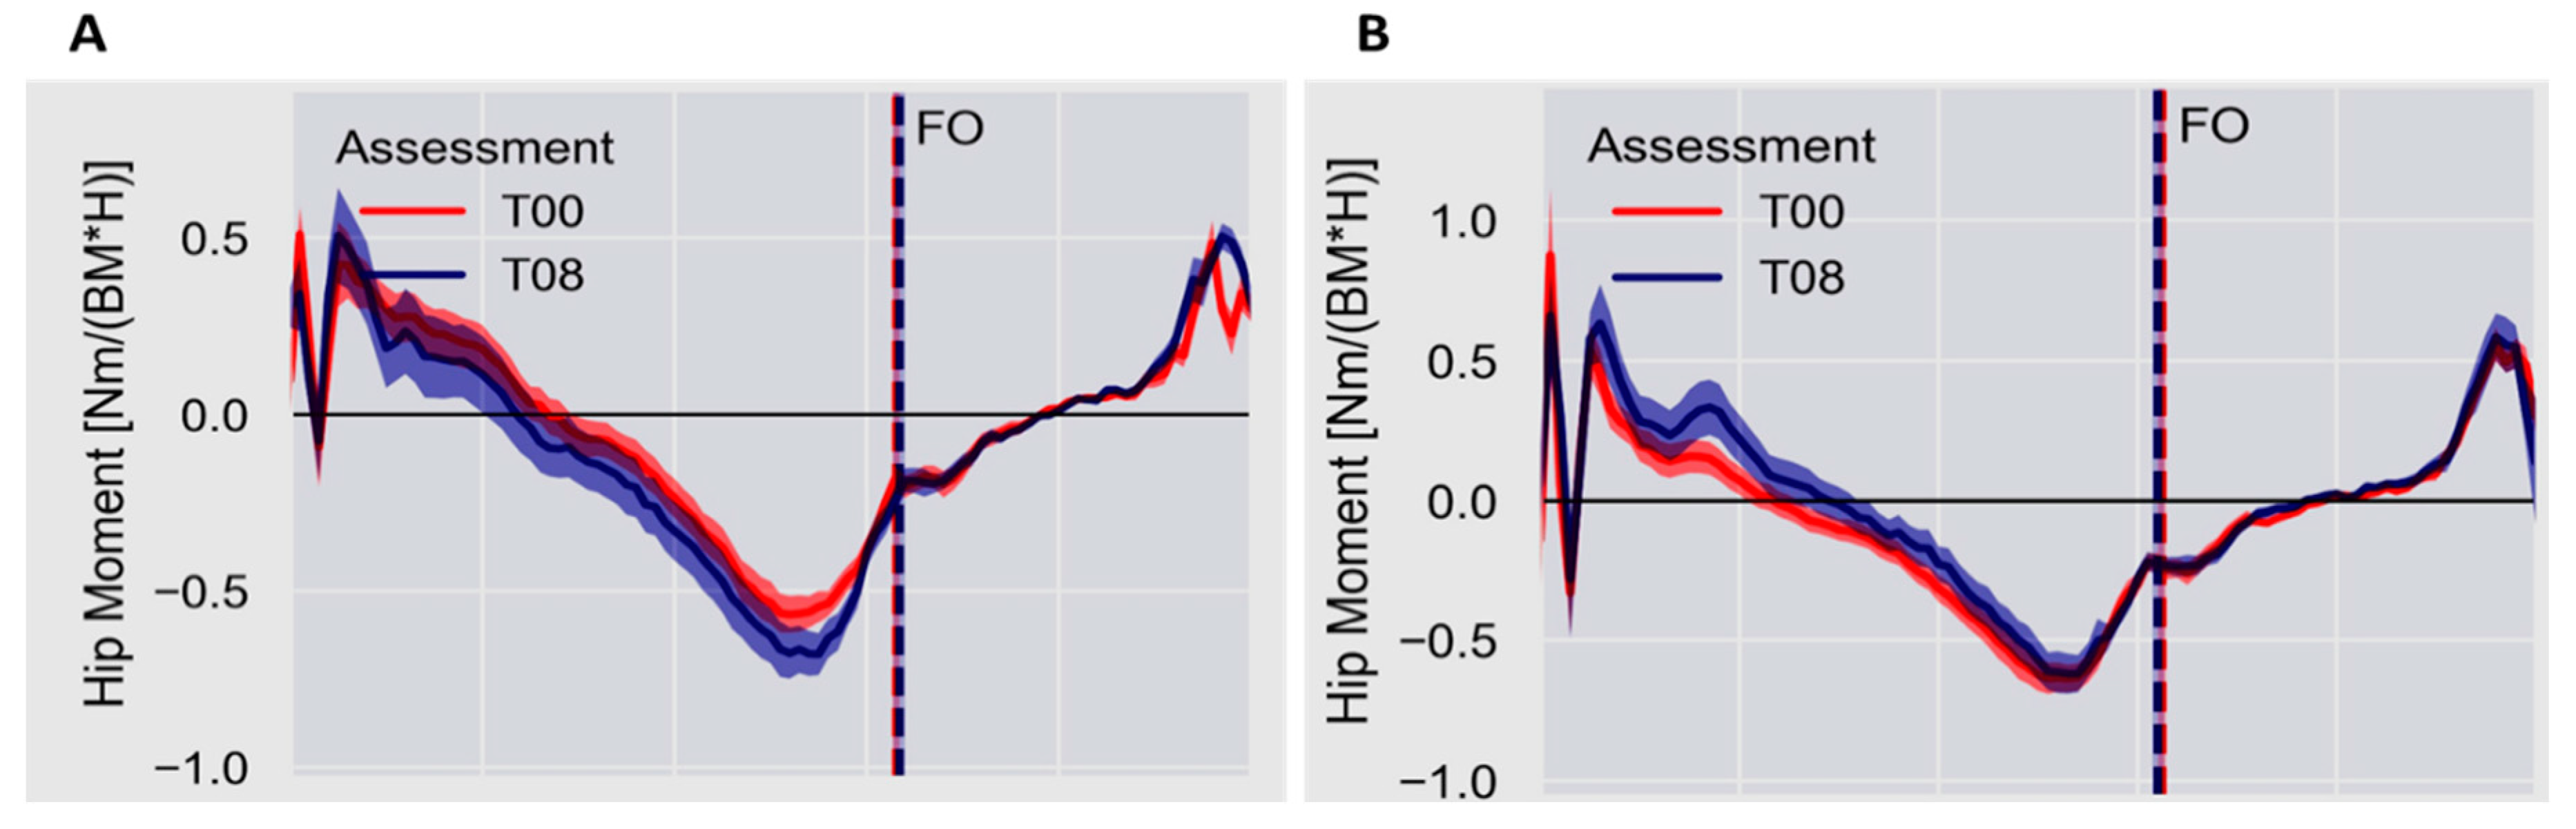
Hip flexor moment at heel strike (Nm/BM·Height)0.09 (0.12)0.24 (0.08) *0.27 (0.09)0.20 (0.24)0.45 (0.27) *#0.26 (0.33) #−0.21 (−0.27 to −0.15)0.01 (−1.22 to 0.15)0.010 *0.2660.007 #
Hip extensor moment at push off (Nm/BM·Height)−0.76 (0.05)−0.83 (0.05)−0.94 (0.07)−0.75 (0.05) #−0.73 (0.07)−0.96 (0.06) #−0.09 (−0.26 to 0.08)0.02 (−0.16 to 0.21)0.3170.693<0.001 #
Knee flexor moment at heel strike (Nm/BM·Height)0.21 (0.03)0.18 (0.04)0.28 (0.07) &0.33 (0.05)0.28 (0.04)0.41 (0.05) &−0.09 (−0.22 to 0.03)−0.13 (−0.32 to 0.05)0.9210.045 &0.063
Knee flexor moment at push off (Nm/BM·Height)0.05 (0.01)0.03 (0.01)0.05 (0.01)0.01 (0.02)0.02 (0.02) #0.07 (0.01) #0.01 (−0.04 to 0.07)−0.01 (−0.06 to 0.02)0.1850.5630.009 #
OXFORD FOOT MODEL
Hindfoot to tibia ROM (degree)20.09 (1.81)22.19 (2.31)20.66 (1.67)20.34 (1.34)22.61 (1.77)27.44 (5.20)−0.41 (−5.30 to 6.13)−6.58 (−16.57 to 3.40)0.4860.3230.256
Hindfoot to tibia peak angle (degree)10.30 (1.34)14.54 (1.94)10.51 (1.74)10.92 (1.63)12.04 (1.83)14.28 (3.20)2.59 (−2.74 to 7.75)−3.76 (−10.92 to 3.38)0.2430.7600.129
Forefoot to hindfoot ROM (degree)11.98 (1.40)11.78 (1.31)12.00 (1.17)13.35 (0.87)13.31 (1.11)14.18 (1.12)−1.53 (−4.89 to 1.83)2.17 (−1.01 to 5.36)0.8650.1090.726
Forefoot to hindfoot peak angle (degree)8.04 (1.97)9.23 (4.21)5.38 (0.72)8.35 (0.78)8.69 (0.95)10.70 (3.21)0.53 (−7.93 to 9.00)−5.31 (−11.71 to 1.15)0.3460.4260.930
Hallux to forefoot ROM (degree)23.35 (2.15)27.00 (2.55)26.35 (2.13)23.77 (2.10)24.26 (2.11)25.31 (1.45)2.74 (−3.76 to 9.24)1.04 (−4.02 to 6.11)0.7600.5980.417
Hallux to forefoot peak angle (degree)21.31 (2.95)23.29 (2.50)18.42 (5.90)24.68 (4.13)23.84 (1.42)21.19 (1.43)−0.55 (−6.20 to 5.09)−2.77 (−14.67 to 9.13)0.8520.4520.396
Abbreviations: BM—body mass. GEE—generalized estimating equations. * interaction effect p = 0.010, difference between intervention and control group at 8 weeks. & group effect p = 0.045, difference between intervention and control group at 16 weeks. # time effects, differences between baseline and 16 weeks and differences between 8 weeks and 16 weeks in the control group.
Disclaimer/Publisher’s Note: The statements, opinions and data contained in all publications are solely those of the individual author(s) and contributor(s) and not of MDPI and/or the editor(s). MDPI and/or the editor(s) disclaim responsibility for any injury to people or property resulting from any ideas, methods, instructions or products referred to in the content.

