Abstract
Polyhedral oligomeric silsesquioxane (POSS) is a suitable nanoscale reinforcement for thermosetting polymers, such as epoxy resin systems in order to modify its mechanical, thermal and chemical properties. The inclusion of POSS in the epoxy resin at higher loading (greater than 1 wt.%); however, it introduces the ductility during the fracture behavior of these nanocomposites. Consequently, the J-integral is used to quantify the fracture behavior of these materials and characterize the crack growth resistance curve against stable crack growth. A range of nanocomposites is prepared by adding 0.5, 1, 3, 5, and 8 wt.% of glycidyl POSS into DGEBF epoxy resin cured with an amine-based curing agent. From fracture toughness experiments, the load-displacement result confirms that when the POSS reinforcement is greater than 1 wt.%, the fracture behavior of the nanocomposite changes from brittle to ductile. For both brittle and ductile nanocomposites, the addition of POSS molecules improves the crack initiation toughness. The development of POSS–POSS compliant domains, reported previously, is responsible for this change in the failure behavior. The fractured images of POSS–epoxy nanocomposites, obtained by using scanning electron microscopy, show that the increase in fracture resistance at higher values of POSS loading occurs due to the extensive shear yielding. Meanwhile, the increased fracture toughness at lower values of POSS loading occurs due to crack pinning and crack deflection.
1. Introduction
Highly cross-linked thermosetting polymers, such as epoxy resins, can exhibit low values of fracture toughness and strain-to-failure. A conventional approach to overcome this limitation is to add fillers that lead to extrinsic toughening mechanisms, such as crack pinning, particle bridging, crack path deflection, shear yielding and microcracking. The use of nanofillers continues to be of interest because nanosized filler provides a necessary increase in the properties of the epoxy resin for lower weight fractions, as compared to micron-sized fillers because the surface area of the nanosized filler is much higher.
Polyhedral oligomeric silsesquioxane (POSS) is a hybrid nanomaterial made up of the organic–inorganic monomer silsesquioxane (RSiO1.5). The POSS molecule has a size of 1–3 nm and possesses an inorganic rigid cage-type structure containing silicon and oxygen, and selectable organic groups (R) attached to the silicon atoms. Various investigations have been done on the characterization of POSS-reinforced nanocomposites. These have included the study of the formation of nanoscale structures, the synthesis of novel POSS molecules with different functionalities, and the improvement of physical properties such as thermal degradation and glass transition temperature [1,2,3,4,5,6,7,8,9]. It is generally believed that the quality of POSS dispersion in the epoxy resin is directly correlated to its efficiency in the improvement of mechanical, electrical, and thermal properties. Prior research on the fracture toughness behavior of POSS–epoxy composites have shown that based on the organic functionality, POSS–POSS compliant domains can form at higher loadings [10,11]. These formations of soft domains lead to a change in the failure response, making the use of linear elastic fracture mechanics invalid. Therefore, the present study focuses on the use of the J-integral concept to quantify the initiation toughness and characterize the crack growth resistance curve.
2. Materials and Methods
The polymer system adopted in this work consists of diglycidyl ether of bisphenol-F based resin (EPON 862®, Hexion Specialty Chemicals, Columbus, OH, USA), that is cured with a low viscous aliphatic amine (EPIKURE 3274® Hexion Specialty Chemicals, Columbus, OH, USA). Both the resin and the curing agent were acquired from Miller–Stephenson Chemical Company, (Danbury, CT, USA). This epoxy resin system is a highly cross-linked network that results in excellent mechanical properties and high chemical resistance.
The POSS selected in this work is glycidyl POSS (Hybrid Plastics, Hattiesburg, MS, USA), as shown in Figure 1, which is an epoxide-based filler. Glycidyl POSS can show compatibility with epoxy resin through hydrogen bonding, a similar chemical structure, and – interaction. In addition, glycidyl POSS can also form covalent bonds with the polymer matrix during the cross-linking process due to the presence of epoxide groups on the POSS molecule.
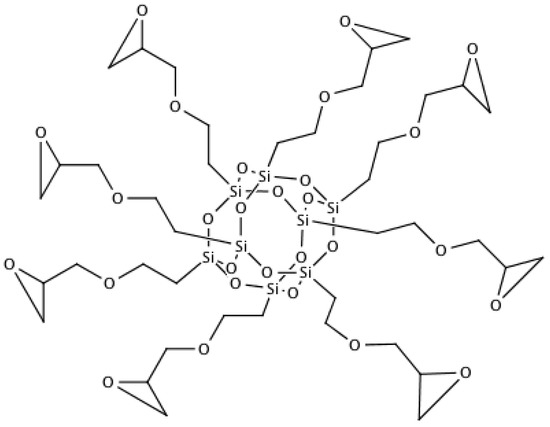
Figure 1.
Molecular structure of glycidyl POSS.
Mixing of the EPON 862 epoxy resin and POSS was carried out in a magnetic stirrer at 70 °C and 200 rpm for 12 h on a magnetic stirrer (VWR Advanced Hot Plate Stirrers, Sugar Land, TX, USA). The mixture was then cooled to room temperature, and a stoichiometric amount of amine-based curing agent (EPIKURE 3274) was added by 40% wt. of epoxy. This was followed by mixing for 10 min. Subsequently, the mixture was placed in a vacuum chamber for 30 min for degassing. The degassed mixture was poured into a prepared mold for casting and cured at room temperature for 24 h. The cast plate was then released from the mold and post cured at 121 °C for 6 h. The same procedure was used for preparing neat resin samples for comparison. Materials were prepared at POSS loading levels of 0.5%, 1%, 3%, 5%, and 8%.
Figure 2 exhibited how inclusion of POSS molecule in the epoxy network increases the free volume which increases the ductility parameter hence change in failure mode was observed.
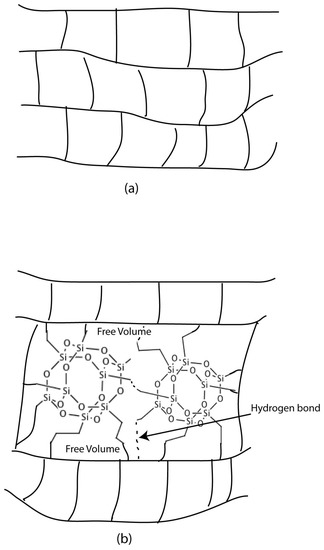
Figure 2.
Figure shows molecular network without (a) and with (b) POSS molecule. Inclusion of POSS in the epoxy network increases the free volume that contributed in increase of ductility parameter.
2.1. Characterization of Properties
2.1.1. Fracture Toughness: Linear Elastic Fracture Mechanics
Fracture toughness was determined by performing a single-edge notch bend test as per ASTM D–5045 [12]. Samples were machined from the cast plate with nominal dimensions of 54.0 × 12.7 × 6.3 mm. A 4.5-mm-deep notch was cut by using a diamond precision saw (MK370, MK Diamond Products Inc., Torrance, CA, USA). Then, the tip of the notch was tapped lightly with a fresh razor blade by using a hammer to initiate a natural precrack. The nominal crack length was kept between 5.7 and 6.9 mm to maintain an ratio of 0.45–0.55 as per the ASTM standard. The precracked single-edge notch specimens were loaded under three-point bending by using the universal testing machine (Instron 5567, Norwood, MA, USA). Tests were performed in a displacement-controlled mode at a fixed crosshead speed of 0.5 mm/min till the point of specimen failure. The load and crosshead displacement were recorded during testing. The fracture toughness of nanocomposites was measured in terms of the critical stress intensity factor (KIC) calculated from the peak load (P), as per ASTM standard. As discussed later, this approach was found to be valid for POSS–epoxy nanocomposites that contained less than 1.0 wt.% of POSS. We have
where P is the maximum applied force, B is the thickness of specimen, W is width of the specimen and f is the geometry factor [12]. We have
2.1.2. Fracture Toughness: Elastic-Plastic Fracture Mechanics
Fracture toughness of the ductile sample was determined by single-edge notch bend (SENB) test as per ASTM D–6068 [13]. This test method is to characterize the slow stable crack growth resistance of the bend-type specimen. Samples were machined from the cast plate as per ASTM standard. A notch was cut by using a diamond precision saw and crack initiated by tapping a razor blade on the tip of the notch. The length of the notch () was kept between 11.4 and 12.7 mm according to the ASTM standard. The specimens were loaded under three-point bending by using the universal testing machine. The specimen was loaded to a selected displacement level that is used to produce a crack extension in the desired position. After that, the specimen was unloaded, and the crack front was marked and broken to expose the specimen’s fracture surface.
The resulting crack fronts were marked () and the crack extension ( = − ) were measured from fractured surface by looking under microscope. For one set of results, a minimum of seven samples was used to generate a complete J-R curve. All specimens must be machined to the same dimensions. The energy required to extend the crack, U, was used to calculate J. U is determined from the area under the load-displacement curve obtained from the test. J is calculated as follows,
where = 2, B is the specimen thickness, W is the specimen width, and is the original crack length.
The J-R curve was constructed from J − as follows.
- Construct a minimum crack extension line at = 0.05.
- Construct a maximum crack extension line at = 0.1(W − ).
- Divide the interval between the minimum and maximum crack extension lines into four equally paced regions.
- The data points shall be evenly spaced throughout the interval with at least three data points in the first row, two data points in the second quadrant, and at least one data falling in each of the two remaining regions.
2.1.3. Fracture Surface Characterization
The fractured surface was studied by using field emission scanning electron microscopy (Hitachi S-4800 FESEM, Dallas, TX, USA). Prior to imaging, the surfaces of the samples were coated with gold platinum by an electrodeposition method by using a sputter coater (Cressington Scientific Instruments Ltd., Redding, CA, USA). This was done to make the sample conductive to prevent the accumulation of static electric charge during scanning electron microscopy.
3. Results
Figure 3 shows the load-displacement curve of POSS–epoxy nanocomposites. The graph indicates that with the inclusion of POSS, the peak load increases before failure. The other interesting observation from the load-displacement curve suggests that at higher loading of POSS in epoxy resin the failure mode changes from brittle to ductile. Hence, measuring fracture toughness by using linear elastic fracture mechanics (LEFM) is no longer valid for more than 1 wt.% of POSS reinforcement. Figure 4 shows the excessive ductile behavior in the POSS–epoxy nanocomposites at higher POSS loading.
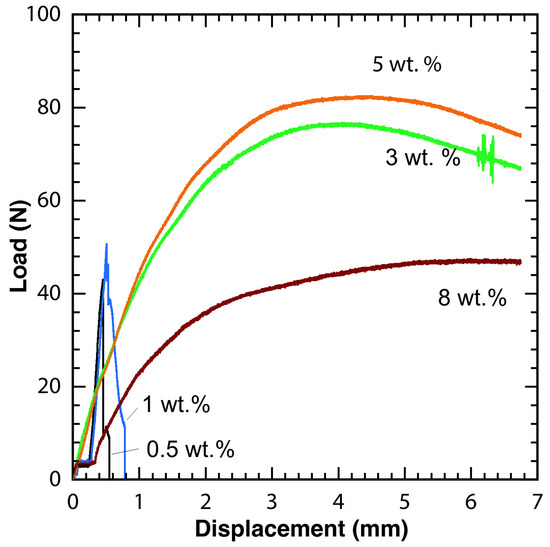
Figure 3.
Load displacement curve of glycidyl POSS–epoxy nanocomposite at different POSS percentage.
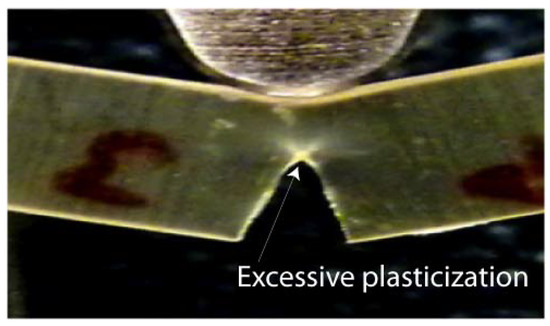
Figure 4.
Ductile failure of 8 wt.% POSS–epoxy nanocompositee.
Various studies have been done to investigate the nonlinear fracture behavior by using either the load separation method [14,15,16,17] or multiple specimen method [18,19] to develop the J-R curve. Both of these techniques show good agreement in the results [20,21]. In order to keep the specimen preparation constant in this study, we have used multiple specimen methods to quantify the resistance against the stable crack growth. This multiple specimen method approaches uses phenomena of the J-integral method for the assessment of the nonlinear material. The crack initiation resistance () have been measured [13] by using ASTM D 6068. Figure 5 shows the variation in the value of J (fracture resistance) with increase in the crack length ().
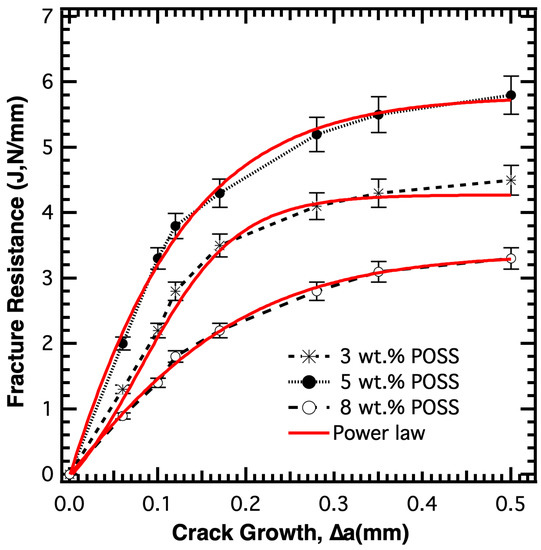
Figure 5.
Variation of J value with the increase in crack extension, for different percentage of glycidyl POSS.
The J-R curve confirmed (Figure 5) that POSS–epoxy nanocomposite follows the J-integral fundamental. The formation of the J-R curve indicates that the inclusion of glycidyl POSS makes the polymer chain more flexible, which leads to ductile behavior in POSS–epoxy nanocomposite at higher POSS loading. Initially, in the J-R curve, J increases linearly with crack length because more energy is needed to break the flexible chain. After that J shows no or very less variation with the further crack extension. This may be because the energy required to break the same amount of POSS–epoxy chains becomes constant and leads to steady-state crack growth. The change in the failure behavior with the increase in POSS reinforcement can be explained concerning the formation of the compliant domain at higher loading of POSS molecule as discussed in our previous literature [10,11]. From the Figure 5, we also observed that the resistance trend against crack extension fits the J curve data in accordance to a power law as per the equation below.
Table 1 shows the value of obtained after power law curve fit that confirms the validity of J-R curve for 3, 5 and 8 wt.% as obtained values are less than 0.99.

Table 1.
Fracture Properties of brittle and ductile POSS–epoxy nanocomposites.
At lower POSS loading, POSS–epoxy nanocomposites exhibit brittle behavior. Hence, the LEFM phenomena can be used to calculate the fracture resistance against the crack propagation in terms of the critical stress intensity factor. Figure 6a illustrates that with the inclusion of the POSS molecule increases the fracture toughness of the nanocomposite increase by an average of 50% compared to neat resin.
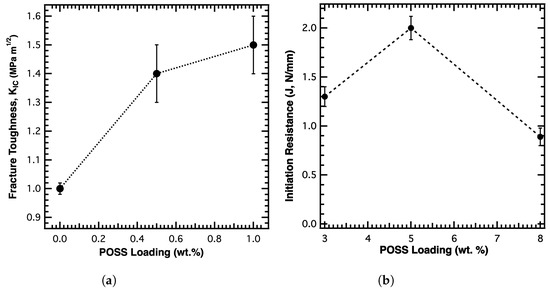
Figure 6.
Fracture and initiation toughness of brittle POSS–epoxy nanocomposite compared to ductile POSS–epoxy nanocomposite. (a) Fracture toughness of neat resin and POSS–epoxy nanocomposites (0–1 wt.% POSS inclusion) in term of critical stress intensity factor. (b) Initiation fracture toughness of POSS–epoxy nanocomposites at higher loading of POSS.
In order to understand the initiation toughness, first, we have converted the critical stress intensity factor () into (initiation fracture toughness). The of the brittle nanocomposite was calculated from and elastic modulus (E) by using the equation given below [22]:
The elastic modulus of the epoxy resin is taken as 3 GPa ( based on literature value [10]). For ductile POSS–epoxy nanocomposites the fracture resistance at initial crack growth has been taken as initiation fracture toughness as shown in Figure 6b. The initiation fracture toughness values from Table 1 indicates that with POSS inclusion the resistance against the crack propagation increases up to 5 wt.% POSS inclusion. More than 5 wt.% POSS inclusion shows a decrease in the toughness value which may be caused by the deterioration of the material due to POSS agglomeration.
The increase in the fracture toughness with the inclusion of POSS will be explained in terms of the presence of a stiffer silica cage that, well distributed, leads to the tortuous path; hence, more work is required to create more surface. Figure 7 illustrates the crack propagation at lower and higher loading of POSS molecules. At lower loading, the presence of a well-distributed POSS molecule creates a tortuous path for crack propagation, whereas at higher loading the presence of the compliant domain leads to crack blunting at the crack front, which leads to the stable crack growth.
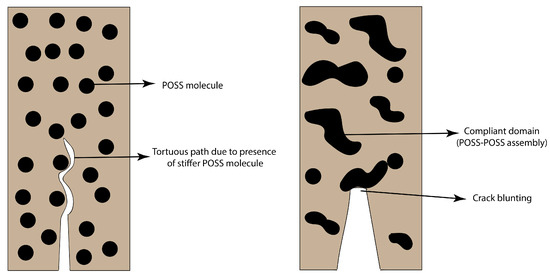
Figure 7.
Fracture behavior of POSS–epoxy nanocomposites at lower (left) and higher loading (right).
Figure 8 showed fractured surface of 1 wt.% and 8 wt.% of POSS–epoxy nanocomposites under scanning electron microscopy. No phase separation was observed, indicating good dispersion of POSS. For 1 wt.% POSS inclusion, the toughening phenomena such as crack pinning and crack deflection was observed, indicating the brittle failure. However, extensive tearing and formation of shear lips at the fracture surface were observed in the case of 8 wt.% POSS inclusion suggests the shear yielding phenomena. This tearing of the fractured surface at higher POSS loading is due to the formation of soft domains that leads to plasticization in the nanocomposite.
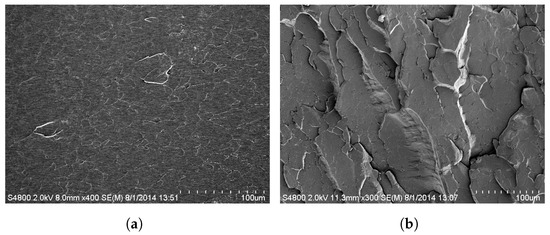
Figure 8.
Scanning electron microscopy image of 1 wt.% and 8 wt.% POSS loading shows the toughening mechanism due to POSS inclusion. (a) Fractured surface of 1 wt.% POSS inclusion. (b) Fractured surface of 8 wt.% POSS inclusion.
4. Conclusions
Addition of the POSS molecule to the epoxy resin increases fracture toughness. POSS loading up to 1 wt.% of the POSS molecule exhibits brittle behavior. However, beyond 1 wt.% POSS addition, the nanocomposite exhibits ductile failure. Brittle initiation toughness, as found by using LEFM, is 50% higher than when using neat epoxy resin. Failure of brittle materials exhibits catastrophic behavior. From SEM images, reinforcement mechanisms in brittle nanocomposites observed are crack pinning and crack deflection. At a higher level of POSS inclusion in the epoxy resin, fracture behavior exhibited ductile phenomena. For ductile material, LEFM phenomena were no longer valid, but J-integral approach implemented successfully. Initiation toughness of the ductile nanocomposite increases with the POSS inclusion up to 5 wt.% and then decreases with further loading. The increase in the initiation toughness value is due to the blunting of the crack because of the formation of POSS–POSS compliant domain higher loading. Further inclusion of POSS leads to the deteriorating effect on the nanocomposite by creating the larger domain that acts as a critical site of a failure. The fracture surface of ductile nanocomposite exhibit formation of shear lips on the surface due to the shear yielding toughening mechanism.
Author Contributions
K.M. conceptualized, investigated, analyzed, and worked on original draft preparation. R.P.S. worked on conceptualization, review and editing of draft and funding acquisition. All authors have read and agreed to the published version of the manuscript.
Funding
We gratefully acknowledge that this work is funded in part or wholly by a grant through the Oklahoma Nanotechnology Applications Project (ONAP) (Grant no. O9-20) and NASA Experimental Program to Stimulate Competitive Research (EPSCOR) (Grant no. NNXO9AP68A).
Institutional Review Board Statement
Not applicable.
Informed Consent Statement
Not applicable.
Data Availability Statement
Not applicable.
Conflicts of Interest
The authors declare no conflict of interest.
References
- Kopesky, E.T.; McKinley, G.H.; Cohen, R.E. Toughened poly(methyl methacrylate) nanocomposites by incorporating polyhedral oligomeric silsesquioxanes. Polymer 2006, 47, 299–309. [Google Scholar] [CrossRef]
- Kopesky, E.T.; Boyes, S.G.; Treat, N.; Cohen, R.E.; McKinley, G.H. Thermorheological properties near the glass transition of oligomeric Poly (methyl methacrylate) blended with acrylic. Rheol. Acta 2006, 45, 971–981. [Google Scholar] [CrossRef]
- Zhang, W.; Wang, S.; Li, X.; Yuan, J.; Wang, S. Organic/inorganic hybrid star-shaped block copolymers of poly(l-lactide) and poly(N-isopropylacrylamide) with a polyhedral oligomeric silsesquioxane core: Synthesis and self-assembly. Eur. Polym. J. 2012, 48, 720–729. [Google Scholar] [CrossRef]
- Ni, C.; Ni, G.; Zhang, S.; Liu, X.; Chen, M.; Liu, L. The preparation of inorganic/organic hybrid nanomaterials containing silsesquioxane and its reinforcement for an epoxy resin network. Colloid Polym. Sci. 2010, 288, 469–477. [Google Scholar] [CrossRef]
- Ruiz-Perez, L.; Royston, G.J.; Fairclough, J.P.A.; Ryan, A.J. Toughening by nanostructure. Polymer 2008, 49, 4475–4488. [Google Scholar] [CrossRef]
- Song, L.; He, Q.; Hu, Y.; Chen, H.; Liu, L. Study on thermal degradation and combustion behaviors of PC/POSS hybrids. Polym. Degrad. Stab. 2008, 93, 627–639. [Google Scholar] [CrossRef]
- Kopesky, E.; Cohen, R.E.; McKinley, G.H. Thermomechanical properties of Poly(Methyl Methacrylate) Containing Tethered and Untethered Polyhedral Oligomeric Silsequioxanes (POSS). Macromolecules 2004, 37, 8992–9004. [Google Scholar] [CrossRef]
- Schwab, J.J.; Lichtenhan, J.D. Polyhedral oligomeric silsesquioxane(POSS)-based polymers. Appl. Organomet. Chem. 1998, 12, 707–713. [Google Scholar] [CrossRef]
- Sánchez-Soto, M.; Schiraldi, D.A.; Illescas, S. Study of the morphology and properties of melt-mixed polycarbonate-POSS nanocomposites. Eur. Polym. J. 2009, 45, 341–352. [Google Scholar] [CrossRef]
- Mishra, K.; Pandey, G.; Singh, R. Enhancing the mechanical properties of an epoxy resin using polyhedral oligomeric silsesquioxane (POSS) as nano-reinforcement. Polym. Test. 2017, 62, 210–218. [Google Scholar] [CrossRef]
- Mishra, K.; Singh, R. Quantitative evaluation of the effect of dispersion techniques on the mechanical properties of polyhedral oligomeric silsesquioxane (POSS)-epoxy nanocomposites. Polym. Compos. 2018, 39, E2445–E2453. [Google Scholar] [CrossRef]
- ASTM. Standard Test Methods for Plane-Strain Fracture Toughness and Strain Energy Release Rate of Plastic Materials 1. ASTM Int. 2013, 99, 1–9. [Google Scholar] [CrossRef]
- ASTM. Standard Test Method for Determining J-R Curves of Plastic Materials. ASTM Stand. Test Method 2013, 1–8. [Google Scholar] [CrossRef]
- Zhou, Z.; Landes, J.D.; Huang, D.D. J-R curve calculation with the normalization method for toughened polymers. Polym. Eng. Sci. 1994, 34, 128–134. [Google Scholar] [CrossRef]
- Bernal, C.R.; Cassanelli, A.N.; Frontini, P.M. A simple method for J-R curve determination in ABS polymers. Polym. Test. 1995, 14, 85–96. [Google Scholar] [CrossRef]
- Baldi, F.; Agnelli, S.; Riccò, T. On the determination of the point of fracture initiation by the load separation criterion in J-testing of ductile polymers. Polym. Test. 2013, 32, 1326–1333. [Google Scholar] [CrossRef]
- Wilson, C.D.; Mani, P. Plastic J-integral calculations using the load separation method for the double edge notch tension specimen. Eng. Fract. Mech. 2008, 75, 5177–5186. [Google Scholar] [CrossRef]
- Agnelli, S.; Baldi, F.; Blackman, B.R.; Castellani, L.; Frontini, P.M.; Laiarinandrasana, L.; Pegoretti, A.; Rink, M.; Salazar, A.; Visser, H.A. Application of the load separation criterion in J-testing of ductile polymers: A round-robin testing exercise. Polym. Test. 2015, 44, 72–81. [Google Scholar] [CrossRef]
- Agnelli, S.; Baldi, F.; Riccò, T. A tentative application of the energy separation principle to the determination of the fracture resistance (J Ic) of rubbers. Eng. Fract. Mech. 2012, 90, 76–88. [Google Scholar] [CrossRef]
- Rodríguez, C.; Maspoch, M.L.; Belzunce, F.J. Fracture characterization of ductile polymers through methods based on load separation. Polym. Test. 2009, 28, 204–208. [Google Scholar] [CrossRef]
- Frontini, P.M.; Fasce, L.A.; Rueda, F. Non linear fracture mechanics of polymers: Load Separation and Normalization methods. Eng. Fract. Mech. 2012, 79, 389–414. [Google Scholar] [CrossRef]
- Anderson, T.L. Fracture Mechanics: Fundamentals and Applications; CRC Press: Boca Rotan, FL, USA, 1991. [Google Scholar]
Disclaimer/Publisher’s Note: The statements, opinions and data contained in all publications are solely those of the individual author(s) and contributor(s) and not of MDPI and/or the editor(s). MDPI and/or the editor(s) disclaim responsibility for any injury to people or property resulting from any ideas, methods, instructions or products referred to in the content. |
© 2023 by the authors. Licensee MDPI, Basel, Switzerland. This article is an open access article distributed under the terms and conditions of the Creative Commons Attribution (CC BY) license (https://creativecommons.org/licenses/by/4.0/).