Article

Structural Health Monitoring of Underground Metro Tunnel by Identifying Damage Using ANN Deep Learning Auto-Encoder

1
Department of Disaster Mitigation for Structures, Tongji University, Shanghai 200070, China
2
School of Civil Engineering, Huazhong University of Science and Technology, Wuhan 430074, China
3
Architecture and the Built Environment, University of the West of England, Bristol BS16 1QY, UK
4
Department of Civil Engineering, Red Sea University, Port Sudan 36481, Sudan
5
Institute of Mountain Hazards and Environment, Chinese Academy of Sciences, Chengdu 610041, China
6
Department of Civil Engineering, Zhengzhou University, Zhengzhou 450001, China
7
Department of Civil Engineering, Sir Syed University of Engineering & Technology, Karachi 75300, Pakistan
*
Author to whom correspondence should be addressed.
Appl. Sci. 2023, 13(3), 1332; https://doi.org/10.3390/app13031332
Submission received: 25 November 2022 / Revised: 28 December 2022 / Accepted: 17 January 2023 / Published: 19 January 2023

Abstract

:
Due to the complexity of underground environmental conditions and operational incidents, advanced and accurate monitoring of the underground metro shield tunnel structures is crucial for maintenance and the prevention of mishaps. In the past few decades, numerous deep learning-based damage identification studies have been conducted on aboveground civil infrastructure. However, a few studies have been conducted for underground metro shield tunnels. This paper presents a deep learning-based damage identification study for underground metro shield tunnels. Based on previous experimental studies, a numerical model of a metro tunnel was utilized, and the vibration data obtained from the model under a moving load analysis was used for the evaluation. An existing deep auto-encoder (DAE) that can support deep neural networks was utilized to detect structural damage accurately by incorporating raw vibration signals. The dynamic analysis of a metro tunnel FEM model was conducted with different severity levels of the damage at different locations and elements on the structure. In addition, root mean square (RMS) was used to locate the damage at the different locations in the model. The results were compared under different schemes of white noise, varying levels of damage, and an intact state. To test the applicability of the proposed framework on a small dataset, the approach was also utilized to investigate the damage in a simply supported beam and compared with two deep learning-based methods (SVM and LSTM). The results show that the proposed DAE-based framework is feasible and efficient for the damage identification, damage size evaluation, and damage localization of the underground metro shield tunnel and a simply supported beam with comparison of two deep models.

1. Introduction

In recent times, underground urban metro tunnel infrastructures have become of great importance in the public transportation system due to road traffic overcrowding. In a modern metropolis, with an increasing trend to use the metro, the subway system has become a more convenient and leading mode to alleviate the growing road traffic pressure. Tunnel structural health during operational conditions is closely linked with public safety. Due to operational incidents and the complexity of underground environment conditions, the circumstances of damage (changes in geometric and material properties) affect the service life and safety of metro tunnel structures. Considering these issues, well-timed and accurate monitoring of the life-threatening responses of the structure is essential for structural maintenance and the prevention of mishaps [1,2,3,4]. Previous research and recurrent occurrences of damage consequences in metro tunnel structures have piqued researchers’ interest in paying more attention to damage identification, and the monitoring of underground tunnel structures by taking into account the requirements of a large number of existing structures before any mishaps occur. Structural health monitoring technology offers the corresponding maintenance through a process of instantaneous monitoring, data analysis, damage identification and state evaluation of structures to provide a valid guarantee for the regular operation of civil structures and the safety of people’s lives and property. Among them, as an essential part of structural health monitoring, structural damage identification has attracted more and more attention [5,6,7,8].
With advancements in science and technology, computational approaches based on machine learning are subversively renovating the activities of human life, such as the genetic algorithms used in [9], artificial neural networks (ANN)-based techniques proposed in [10], and swarm intelligence techniques [11]. These approaches, including SHM, have been investigated by many researchers in numerous applications. One of the most significant and promising uses of deep learning is in the convolutional neural network (CNN) used in SHM methods, which has been widely studied in real-world applications. CNN is considered one of the most innovative and effective deep learning tools, and it has been used in a variety of applications, including face recognition, natural language refining, and fault detection [12,13]. The dissimilarity between CNN and conventional ANN is the capability of the CNN layers to consolidate neurons in three dimensions (3D): height, width, and length. As a result, many CNN applications have performed admirably in structural health monitoring areas based on accelerometer vibration signals. The fast and precise method was suggested for primary fault detection systems and motor condition monitoring, applying 1D-CNN [14].
The authors [15] have used the same method for tackling fault detection using CNN on raw vibration signals as previously used in [16]. In [17], real-time damage identification and localization methods based on raw acceleration signals through 1D-CNN were proposed. As a result, ref. [18], in order to improve diagnosing accuracy and reliability, sensor fusion was incorporated into the CNN structure. They gathered the raw training process data of CNN from multiple accumulator sensors and examined the information both temporally and spatially. Their technique, as concluded, obtained superior assessment functionality compared with other traditional methods that extract features manually. In [19], the authors presented a technique created for wireless sensor networks training a single, assigned 1-D CNN for an individual wireless sensor in a sensor network on the locally available data as a solution to overcome data communication and synchronization issues. The proposed method eliminated the need for any filtering or preprocessing since it worked directly on the raw signals acquired from the ambient vibration environment. Similarly, ref. [20], the authors utilized an improved CNN-based method that needs only two measurement arrangements, irrespective of structure size, to overcome the CNN training limitation, which primarily requires a large number of sample data, especially for large-scale applications. It should be noted that the method investigated in the benchmark study with nine damage assumptions was capable of successfully quantifying the actual damage quantity. The authors observed that a more accurate method was needed to identify multiple damages because there are subtle differences between the measures of the various damages [21]. The major achievement of deep learning methods is that they can learn the useful features from the raw data automatically [22,23]. Similarly, the need for signal processing methods and handcrafted features is omitted using deep learning methods. The last three years have witnessed several researchers’ work on deep learning due to its superiority in feature learning capability [15,24,25]. Convolutional neural networks (CNN) and deep auto-encoder (DAE) are two widely used deep learning models [26]. DAE is an unsupervised learning model; this differs from CNN, which is a more efficient and simple training method. In many structural health monitoring applications, popular deep learning models such as CNN and deep auto-encoder are successfully used to find damage based on raw vibration signals that have not been changed in any way.
Auto-encoders are simple learning models that transform inputs into outputs with the least possible amount of distortion [27]. Jorge Loy et al. [28] proposed a sparse auto-encoder-driven method for indoor air quality monitoring in the Metro subway. Nadith et al. [29] investigated an auto-encoder-based damage identification technique in multi-story buildings. Pattern recognition problems can be best solved by taking into account two major features: reducing the number of dimensions and learning the relationship between vibration characteristics and structural damage. A similar auto-encoder-based framework was proposed for multi-scale data [30]. Using data-based deep learning approaches, DAE and sparse-DAE were proposed to identify structural damage and monitor structural health [31,32]. Conclusively, the SHM state of the art approved that there is no information for the application of vibration-based NDT techniques in underground structures where DAE is used for damage identification and structural monitoring, marking the uniqueness of the recommended approach.
The literature demonstrates clearly that the deep auto encoder has not been used for damage identification in underground tunnel structures. Therefore, this study proposed a deep auto encoder-based technique for damage identification in an underground metro tunnel structure. The proposed approach incorporated a deep auto encoder to abstract the hidden features of the input vector (raw vibration signals) acquired from an underground tunnel structure without any preprocessing. The autoencoder (DAE) and root mean square (RMS) was used to identify and locate to the damage of the underground metro tunnel structure.
In this study, a precise finite element model of a metro tunnel structure was built in the ABAQUS software, and numerical simulation was conducted under a moving load with different severity levels of damage. This numerical investigation was based on experimental studies on the damage identification of underground tunnel structures using wavelet-based residual force vector [33] and damage detection of the underground tunnel through a frequency response function [34]. Numerous damaged and undamaged structural conditions were assessed using dynamic tunnel structure analysis to assess the efficiency and robustness of the anticipated damage identification approach based on input signal data. The results of the damage detection were evaluated under different measuring locations, and white noise was added to simulate the polluted measurements in real-world scenarios.

2. Methodology

2.1. Deep Auto Encoder-Based Damage Identification Technique

To identify the damage effectively and to overcome problems associated with signal processing methods in SHM, we proposed a deep auto-encoder feature learning model that can extract important hidden features from measured vibration raw signals. This method was based on a deep auto encoder, which can support neural networks and can be used in the proposed framework to find damage in the metro tunnel structure.

2.2. Deep Auto Encoder

An auto-encoder involves two major parts, known as the encoder and decoder, each having a particular hidden layer. Auto-encoders are a significant scheme to acknowledge dimensional reduction, active feature learning, and nonlinear regressions for exact and vigorous structural crack recognition. Figure 1 shows that an auto-encoder is a type of unsupervised learning technique that is used to make low-dimensional data so that the information can be saved for the final operation.
Auto-encoders are basically learning simulations for the transformation of input data into output data with the slightest alteration [32]. The DAE was utilized in several functions such as image processing, damage identification, acquiring high-level features, vibration-based structural condition monitoring, and the decline of dimensions. Auto-Encoders are unsupervised training modules. There are two categories of auto-encoder training: fine-tuning and pre-training. Pre-training is generally executed by the encirclement of layers, while fine-tuning is generally executed by the optimization of multiple layers of the comprehensive system. Multiple encoders are utilized for the initialization of the layers’ weight to ensure excellent results. As shown in Figure 1, a typical auto-encoder consists of two main sections: a single hidden layer encoder and a decoder. MATLAB was used for training the auto-encoders, while the parameters used in the DAE model are shown in Table 1.

2.3. Projected Framework

As displayed in Figure 2, the proposed framework layout is given in detail.
In the first step, a model of the tunnel structure was created, and then vibration data from the tunnel structure were collected to be used as inputs for the proposed approach. In the second step, to extract the significant or damaged features from the data, a DAE framework was designed with different features, and optimization of different parameters was established. The proposed DAE classification results of damage were performed in the final step, and damage localization was presented using route mean square (RMS).

2.4. Damage Localization Using RMS Deviation

Generally, the damage index is vital for the state valuation of the because it focuses on the real part of the vibration sensor’s impedance as a sign of the condition, which varies through perceiving the deviations and quantifying damage statistically. The mean function is a supportive means for arranging and examining large datasets. Once the differences in the parameters are positive and negative, as in a sinusoidal wave, the root mean square (RMS) is an active statistical measure for defining the number of variations. The RMS value of various signals can be represented as a sample of equivalent space. The summation of samples is divided by the total of the observations (N), results in the average (mean). In this research work, the root mean square was considered to detect the damage by quantifying the changes in voltage at each sensor with its corresponding position on the tunnel structure and producing a graphic representation related to the damage map for each damage position and size. The subsequent equation outlines the RMS: This method allowed us to calculate the damage location of the structure from the vibration signals of the sensors located on the same structure. The data were acquired from each sensor at a sampling frequency of 1000 Hz, which means 1 sample (x_m (t_n)) every 0.01 s, in fact: t_(n + 1) − t_n = 0.01 s.
The total scan time for each signal was about 10 s = 0.01 s × 1000 samples. Three hundred sensors were placed so the 300 signals were saved as column vectors in a 1000 × 300 matrix. We carried out the same procedure for several cases: one undamaged case and 9 damaged cases, obtaining 10 matrices stored in 10 .xlsx files. The whole method was implemented in MATLAB.
N = 1000, n: 1 to N
M = 300, m: 1 to M
M a t r i x   o f   d a t a = x 1 t 1 x 2 t 1 . . . x M t 1 x 1 t 2 x 2 t 2 . . . . . . . . . . x 1 t n x 2 t n . x m t n . x M t n . . . . . . x 1 t N x 2 t N . . . x M t N
The damage indicator vector represents the relative percentage increase of each sensor signal amid the damaged case (DMG) and the undamaged case (UDG), due to the load. In the end, the damage indicator of each sensor signal is stored in a row vector. Each component of the damage indicator vector was calculated as follows:
D a m a g e   I n d i c a t o r R M S D   % = a b s n = 1 N x m t n 2 U D G n = 1 N x m t n 2   D M G n = 1 N x m t n 2 U D G   × 100
At this point, we managed to multiply the damage indicator by a scale factor (s = 10), and we added a uniformly distributed white noise to the damage indicator vector in order to simulate an underground tunnel situation for the structure. The percentage of the noise is related to the maximum damage index value vector, as shown in the MATLAB code. Finally, the damage indicator vector (300 × 1) was plotted for each case, showing the damage location and amplitude because each component of the vector (1 to 300) is a sensor. For this reason, it is possible to know exactly where the damage is located because the location of each sensor is known from the beginning.

2.5. Investigation of the Feasibility of Proposed Approach on Simply Supported Beam

A simply supported beam was designed to investigate the feasibility of the proposed approach on small structures with a limited data set, as the proposed method in this study was utilized on the tunnel structures, which are considered to be massive structures with a large dataset. ABAQUS was incorporated to do a concrete modeling analysis on a beam that was only held up by two points. C40 concrete was considered a solid element for the modeling. The element type was C3D8R. The concrete’s material properties and dimension parameters were 3.2 m long, 0.25 m wide, and 14 mm in diameter, respectively. The beam was distributed into 32 Euler–Bernoulli elements; the elasticity modulus was E = 1.96 × 10⁵ MPa. A sensor was positioned at the mid-span of the proposed simply supported beam to measure the vibration response, and the impact load was implemented to acquire the acceleration signals from the beam. The acceleration data of the beam model was obtained using a history output.
The impact load (hammering) was applied to the proposed simply supported beam model. The beam vibration signals under varying values of impact loads were acquired in the mid-span of the beam via the acceleration sensor to perform a dynamic analysis on the beam. The impact load was adopted six times under relevant conditions, respectively, to collect the vibration signal data from the mid-span of the beam. The beam model was divided into 32 elements, and the displacement and rotation were at the locations of the corresponding supports of the beam.
The entire finite element model with a cross-section of the beam structure is depicted in Figure 3. To identify the damage using acceleration data acquired from a simply supported beam model, the proposed (DAE) approach was utilized. In contrast, two other methods, LSTM and SVM, were also used for the damage identification of beams. The average testing accuracy and computation time of the three different methods are shown in Table 2. The proposed method’s average tested accuracy was 95.3%, which was far higher than the other two methods, with respective accuracy rates of 82.65 percent and 55.75 percent. The proposed DAE system standard deviation was 1.23, which was lower than the other three methods. The proposed DAE method’s average measurement computation time was 365.17 s, compared to the other two deep learning-based methods, which re respectively 370.82 s and 165.23. Ten trials were carried out using three methods: autoencoder, LSTM, and SVM. As shown in Figure 4, the proposed method’s accuracy percentage was much higher than the other methods. The results demonstrate the feasibility of the proposed approach for the simply supported beam.

2.6. Numerical Simulation and Results Analysis on Underground Tunnel Structure

To conduct the numerical simulations of the structure, which is subjected to moving train loads, an intact case (UDG) and nine different damage cases (DMG1, DMG2, DMG3, DMG4….DMG9) were taken at three different locations (U100, U180, U200) with varying severity of 4%, 8%, 10%, respectively. All numerical simulations were done using the supercomputer. The parameters and dimensions used in this study were taken from the Wuhan Metro Tunnel Office, China, and these parameters were also used in [33], as shown in Table 3. The acceleration signals were obtained and arranged to assess the validity of the DAE damage detection method with the proposed damage index. The dynamic responses were measured in the study under train moving load excitations.

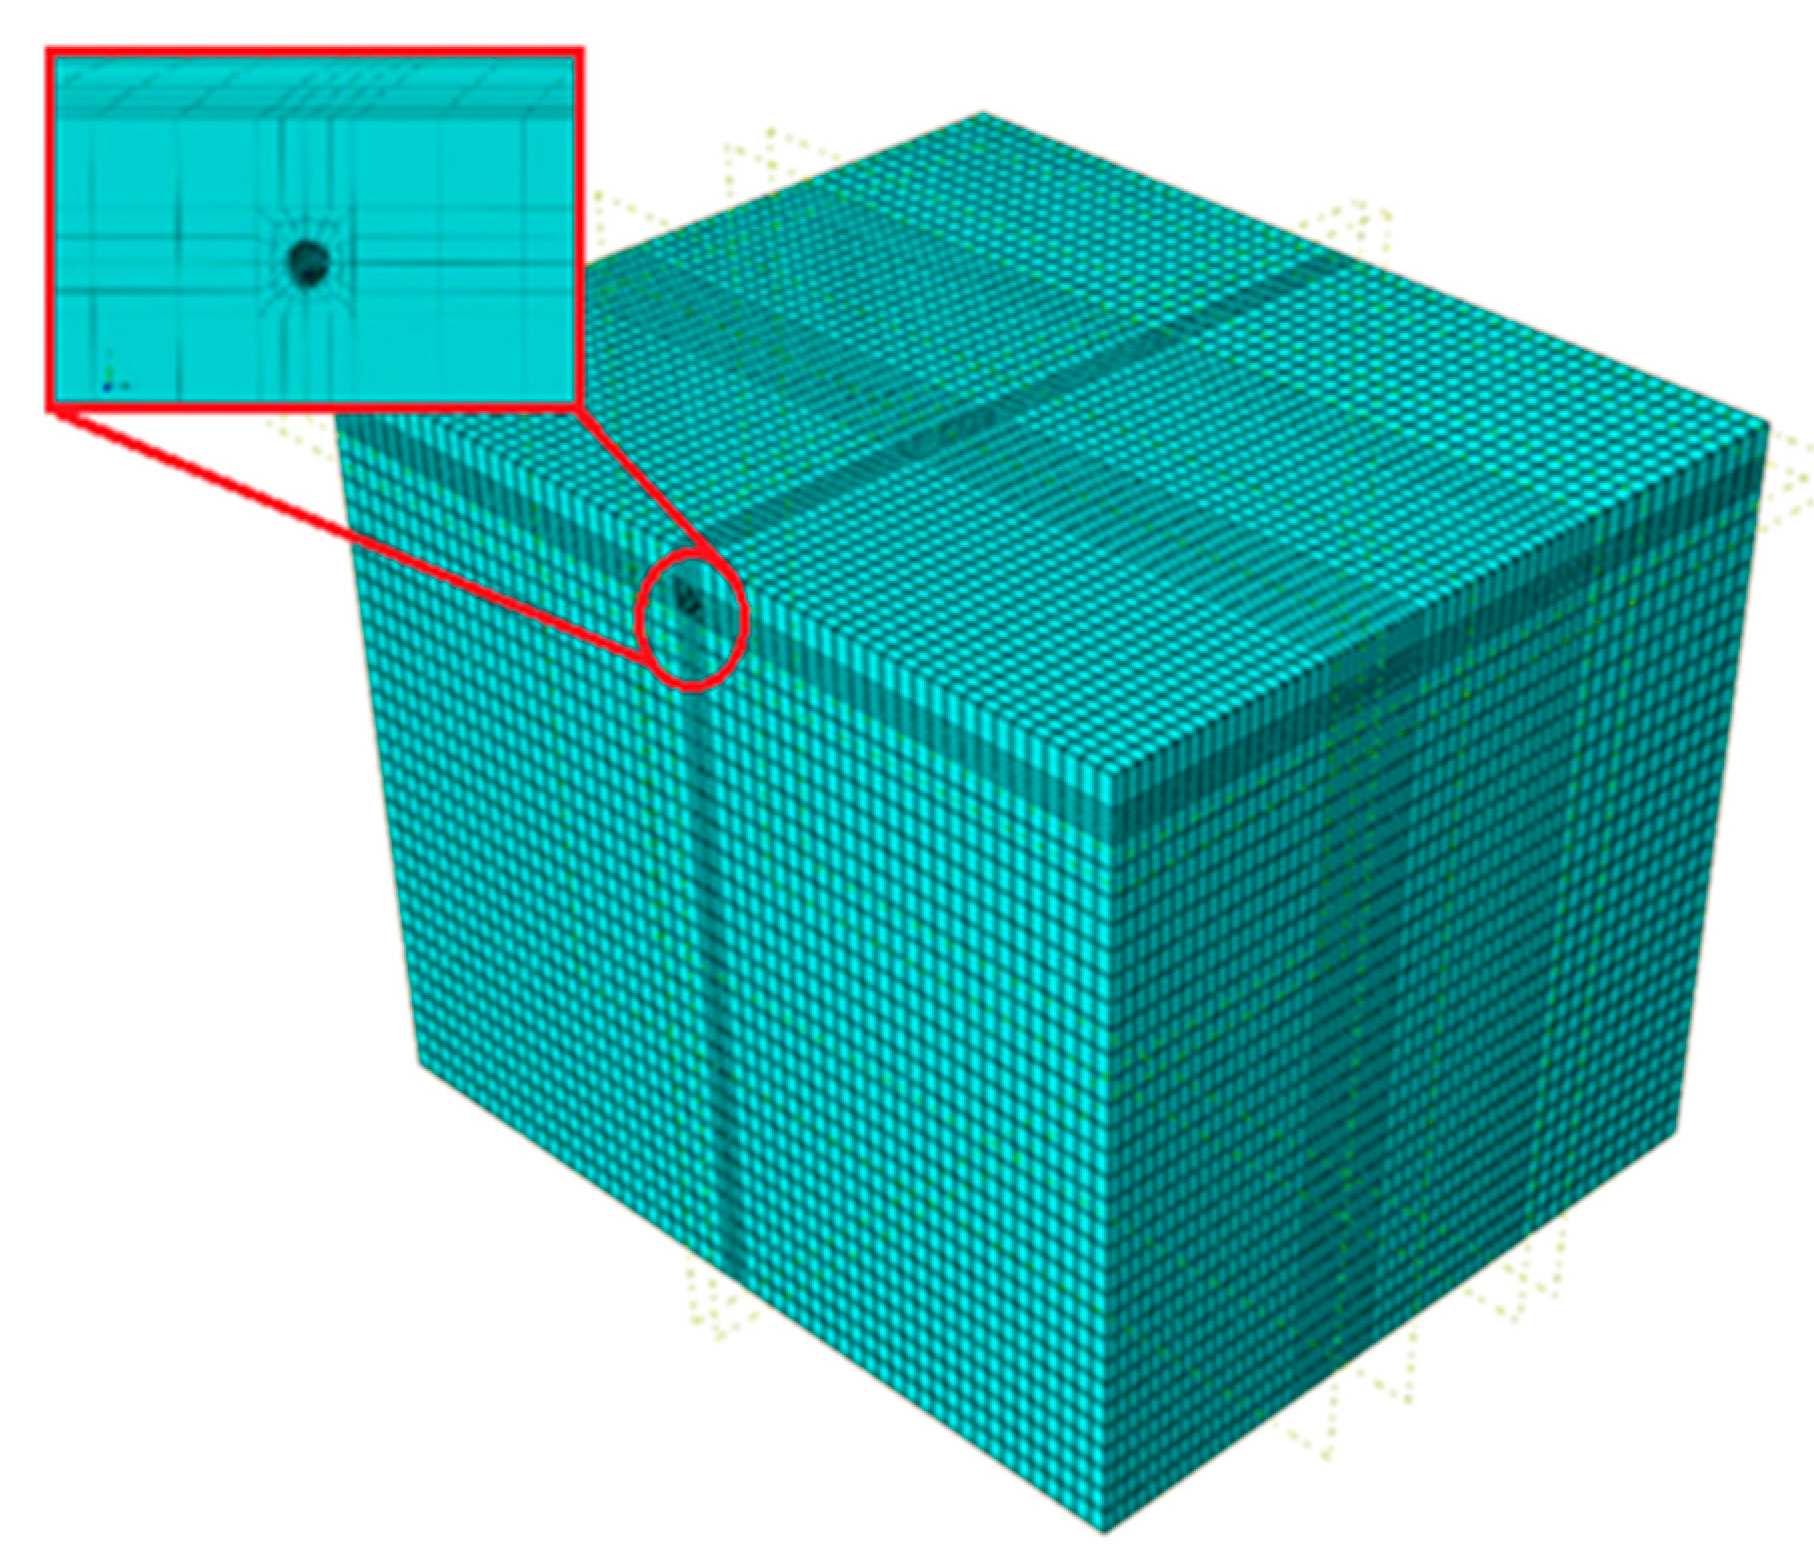
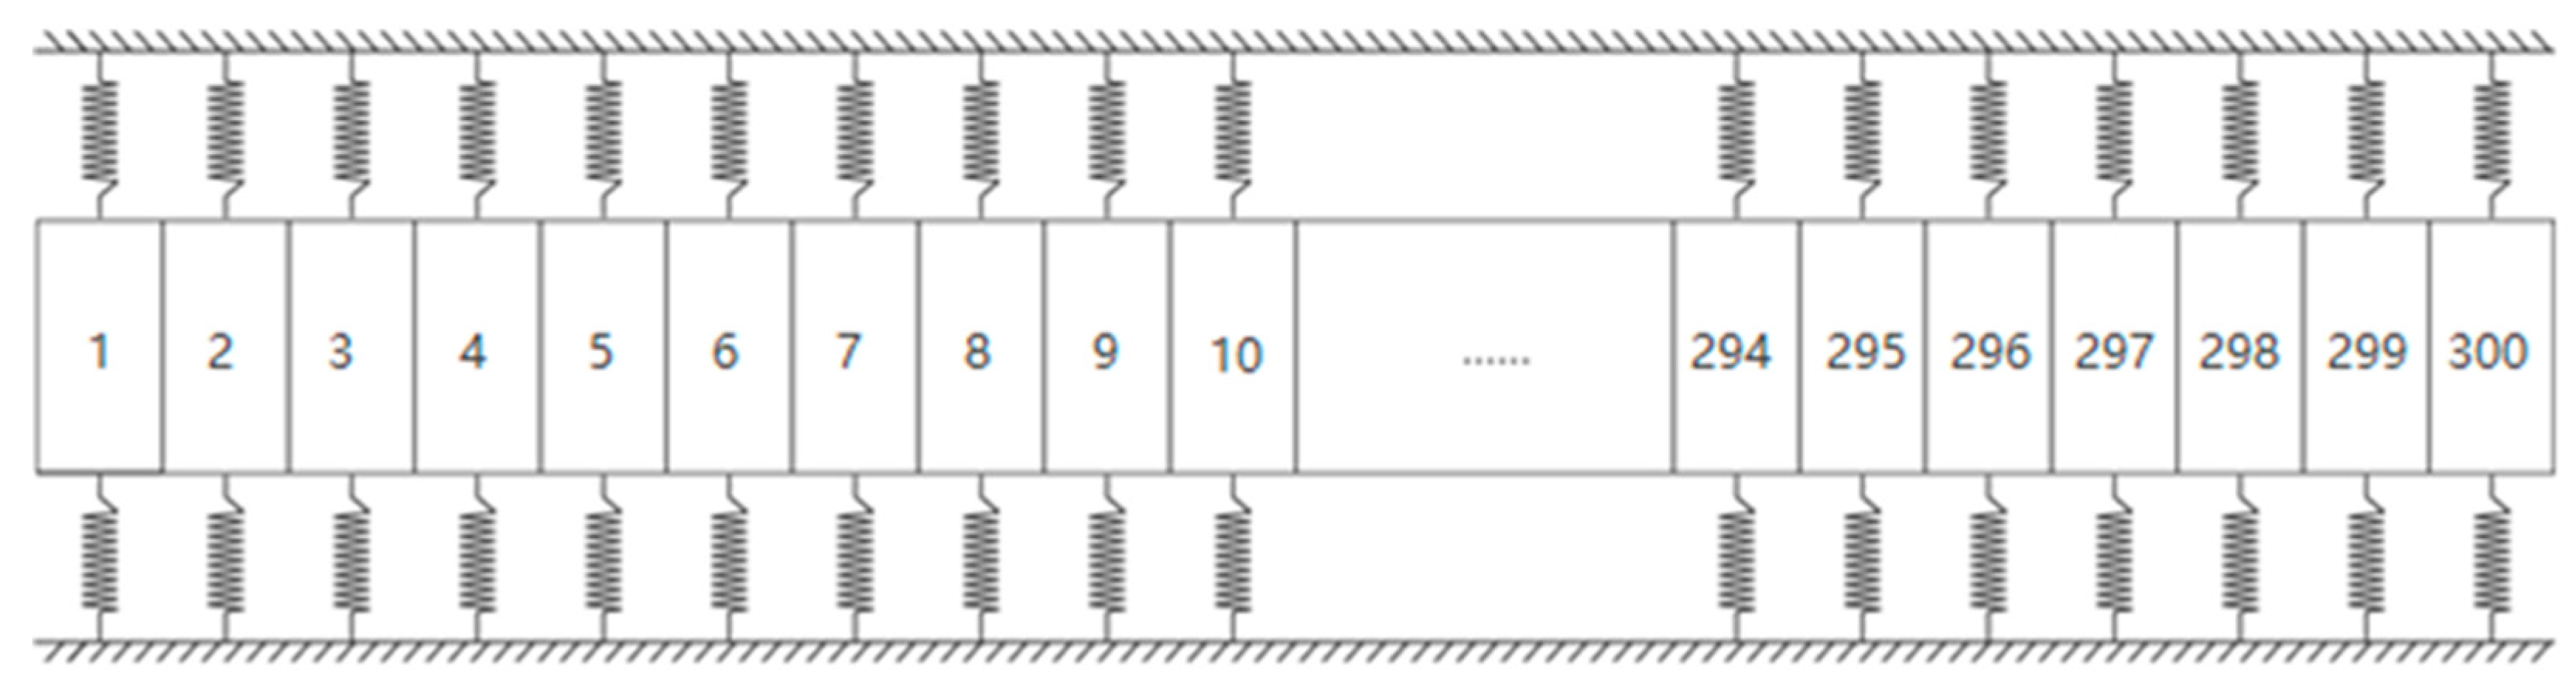
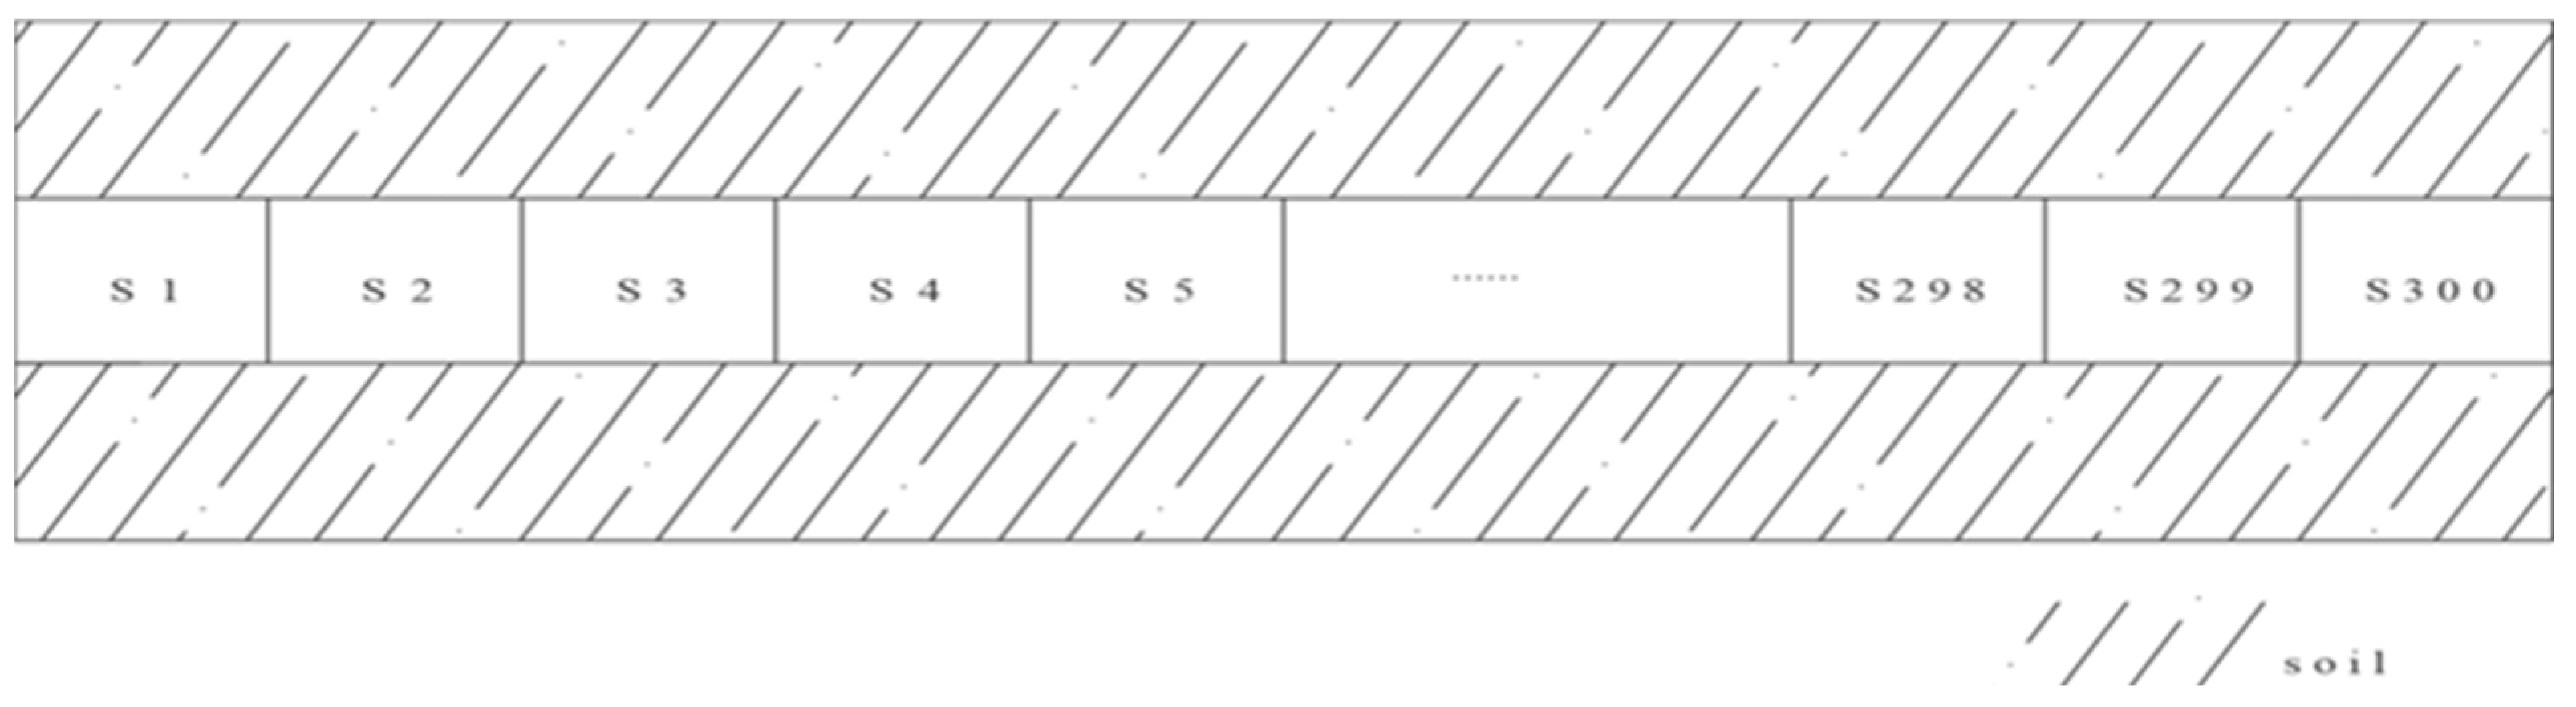
2.7. Description of Finite Element Model
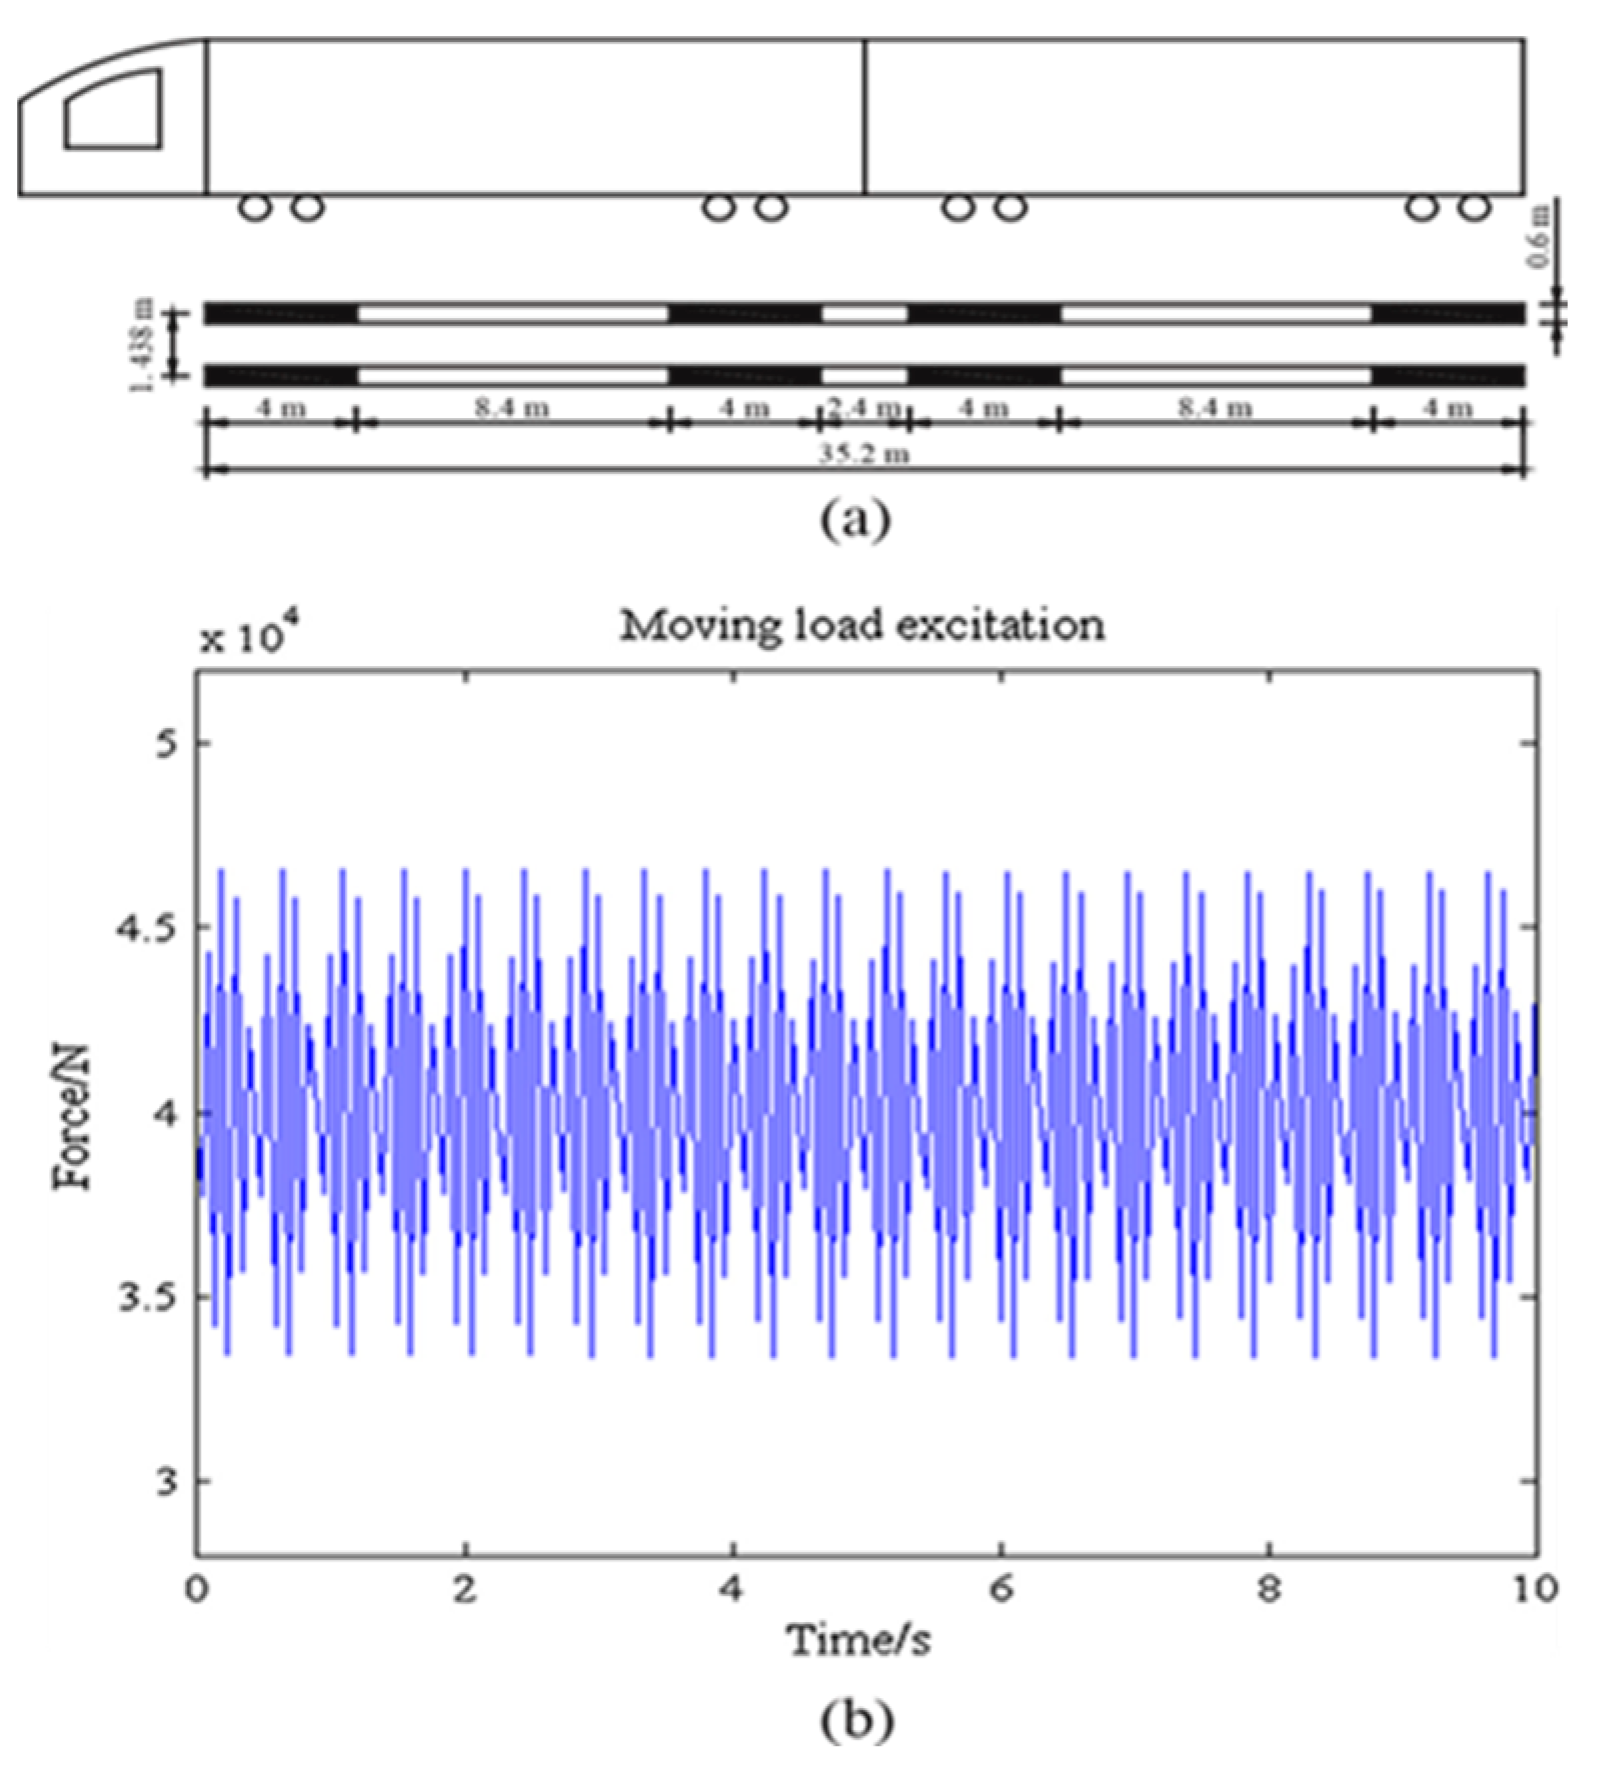
In the proposed research, to simulate the real operation of underground metro trains, the influence of variable load and variable speed moving load on the damage identification results of tunnel structures was analyzed through the 30-m soil-tunnel structure model. The metro tunnel was taken at full scale in the finite element model of the soil tunnel, as shown in Figure 5. The finite element model of a metro tunnel structure was built with ABAQUS software, and the parameters and dimensions were taken from the Wuhan metro tunnel office, China [33,34]. The finite element program ABAQUS was employed with suitable elements to model the used metro tunnel structure. The size and material properties of the metro tunnel, concrete, and soil are given in Table 4 for the proposed metro tunnel structure investigation. Shell63 elements were used in the study.
In this proposed research analysis, the entire structural framework follows the linear assumption; the linear connection is assumed to be minor structural damage that can only cause a small change in the structure. The soil and tunnel boundaries are simulated using full-circle ground springs. The complete mechanical model system with the parameters taken from past studies conducted by different researchers [33,35] is shown in Table 5.
The established finite element model to simulate the training constraint given by the contiguous sections was not modeled at the end of the tunnel for boundary conditions controlled with springs.
In the built finite element model, in order to simulate the training constraints given by the contiguous sections, they were not modeled at the end of the tunnel boundary conditions controlled with springs. The rotational spring’s stiffness was known to be (1 × 10¹¹ N·m/rad). Therefore, when the soil dimension is more than ten times the metro tunnel dimension, the boundary outcome may be overlooked. The soil dimension was assumed to be beyond the 10-fold tunnel diameter range. The finite element segment model and the tunnel’s finite element models are shown in Figure 6 and Figure 7, respectively.
By splitting the entire tunnel into portions, the metro tunnel was assembled using a lumped mass in the mechanical model used in this analysis. Every element mass was located in the middle of the entire tunnel model. Consequently, both the excitation of the moving load and the tunnel were represented as point masses. Concrete and soil densities were both 2500 kg/m3 and 1800 kg/m3, respectively. This proposed study analysis for metro tunnel structure and soil simulation used the design of the Wuhan metro.

2.8. Moving Load

To excite the proposed model of the metro tunnel and to minimize the rail’s boundary condition effect, the load of the metro tunnel was determined by a simple function simulation of the train load excitation force function fitting method. Data acquisition started at the time the metro train enters the tunnel and stopped every 10 s until the train reached the end of the tunnel edge. As shown in Figure 6 and Figure 7, the total tunnel model length for the computation was simulated into 300 standardized components, which was approximately ten times that of the load moving. The deep auto encoder (DAE) method was used to obtain and evaluate the responses at a sampling rate of 1000 Hz.

3. Results

3.1. Measurement Points Used on Metro Tunnel Model

As demonstrated in Figure 7, the entire tunnel structure was divided into 300 elements. At the base of the metro tunnel model, the measurement points were collected with a spacing range of ten elements (10 m) along the simulated moving load path. The moving load was used to obtain the raw acceleration signal data from the vibration, and the time domain force is shown in Figure 8. At a 1000 Hz sampling frequency with a sampling time duration of 10 s and a time step of 0.02 s for each sample, the dynamic responses were measured from the model, and the tunnel finite element simulation diagram is given in Figure 8. The dataset is acquired at three different locations using different percentages of moving load, and the setting of nine different damaged and undamaged conditions was carried out on the finite element model of an underground tunnel structure under a moving load. Figure 9 depicts the excitation curve force of a simulated moving load.

3.2. Confusion Matrix Results for the Proposed Method

The damage classification results of the proposed method are shown in Figure 10. The confusion matrix of the anticipated approach was carried out to identify each case dataset. The confusion matrix validated the classification results of all the damage cases in an elaborate way that contains the misclassification errors and classification precision as a percentage. The ordinate axis of the confusion matrix was determined as the authentic label of classification, while the horizontal axis predicted the label of classification. The color bar on the right demonstrates the correspondence between colors and numbers between 0 and 1, as well as the high efficiency of the proposed approach, which was obtained at 95.8%. Figure 10 depicted in the results exhibit that the trained deep auto encoder is accurate, until this percentage, in detecting the 10 structural conditions. The proposed methodology is feasible and robust for detecting and quantifying different structural damage conditions.

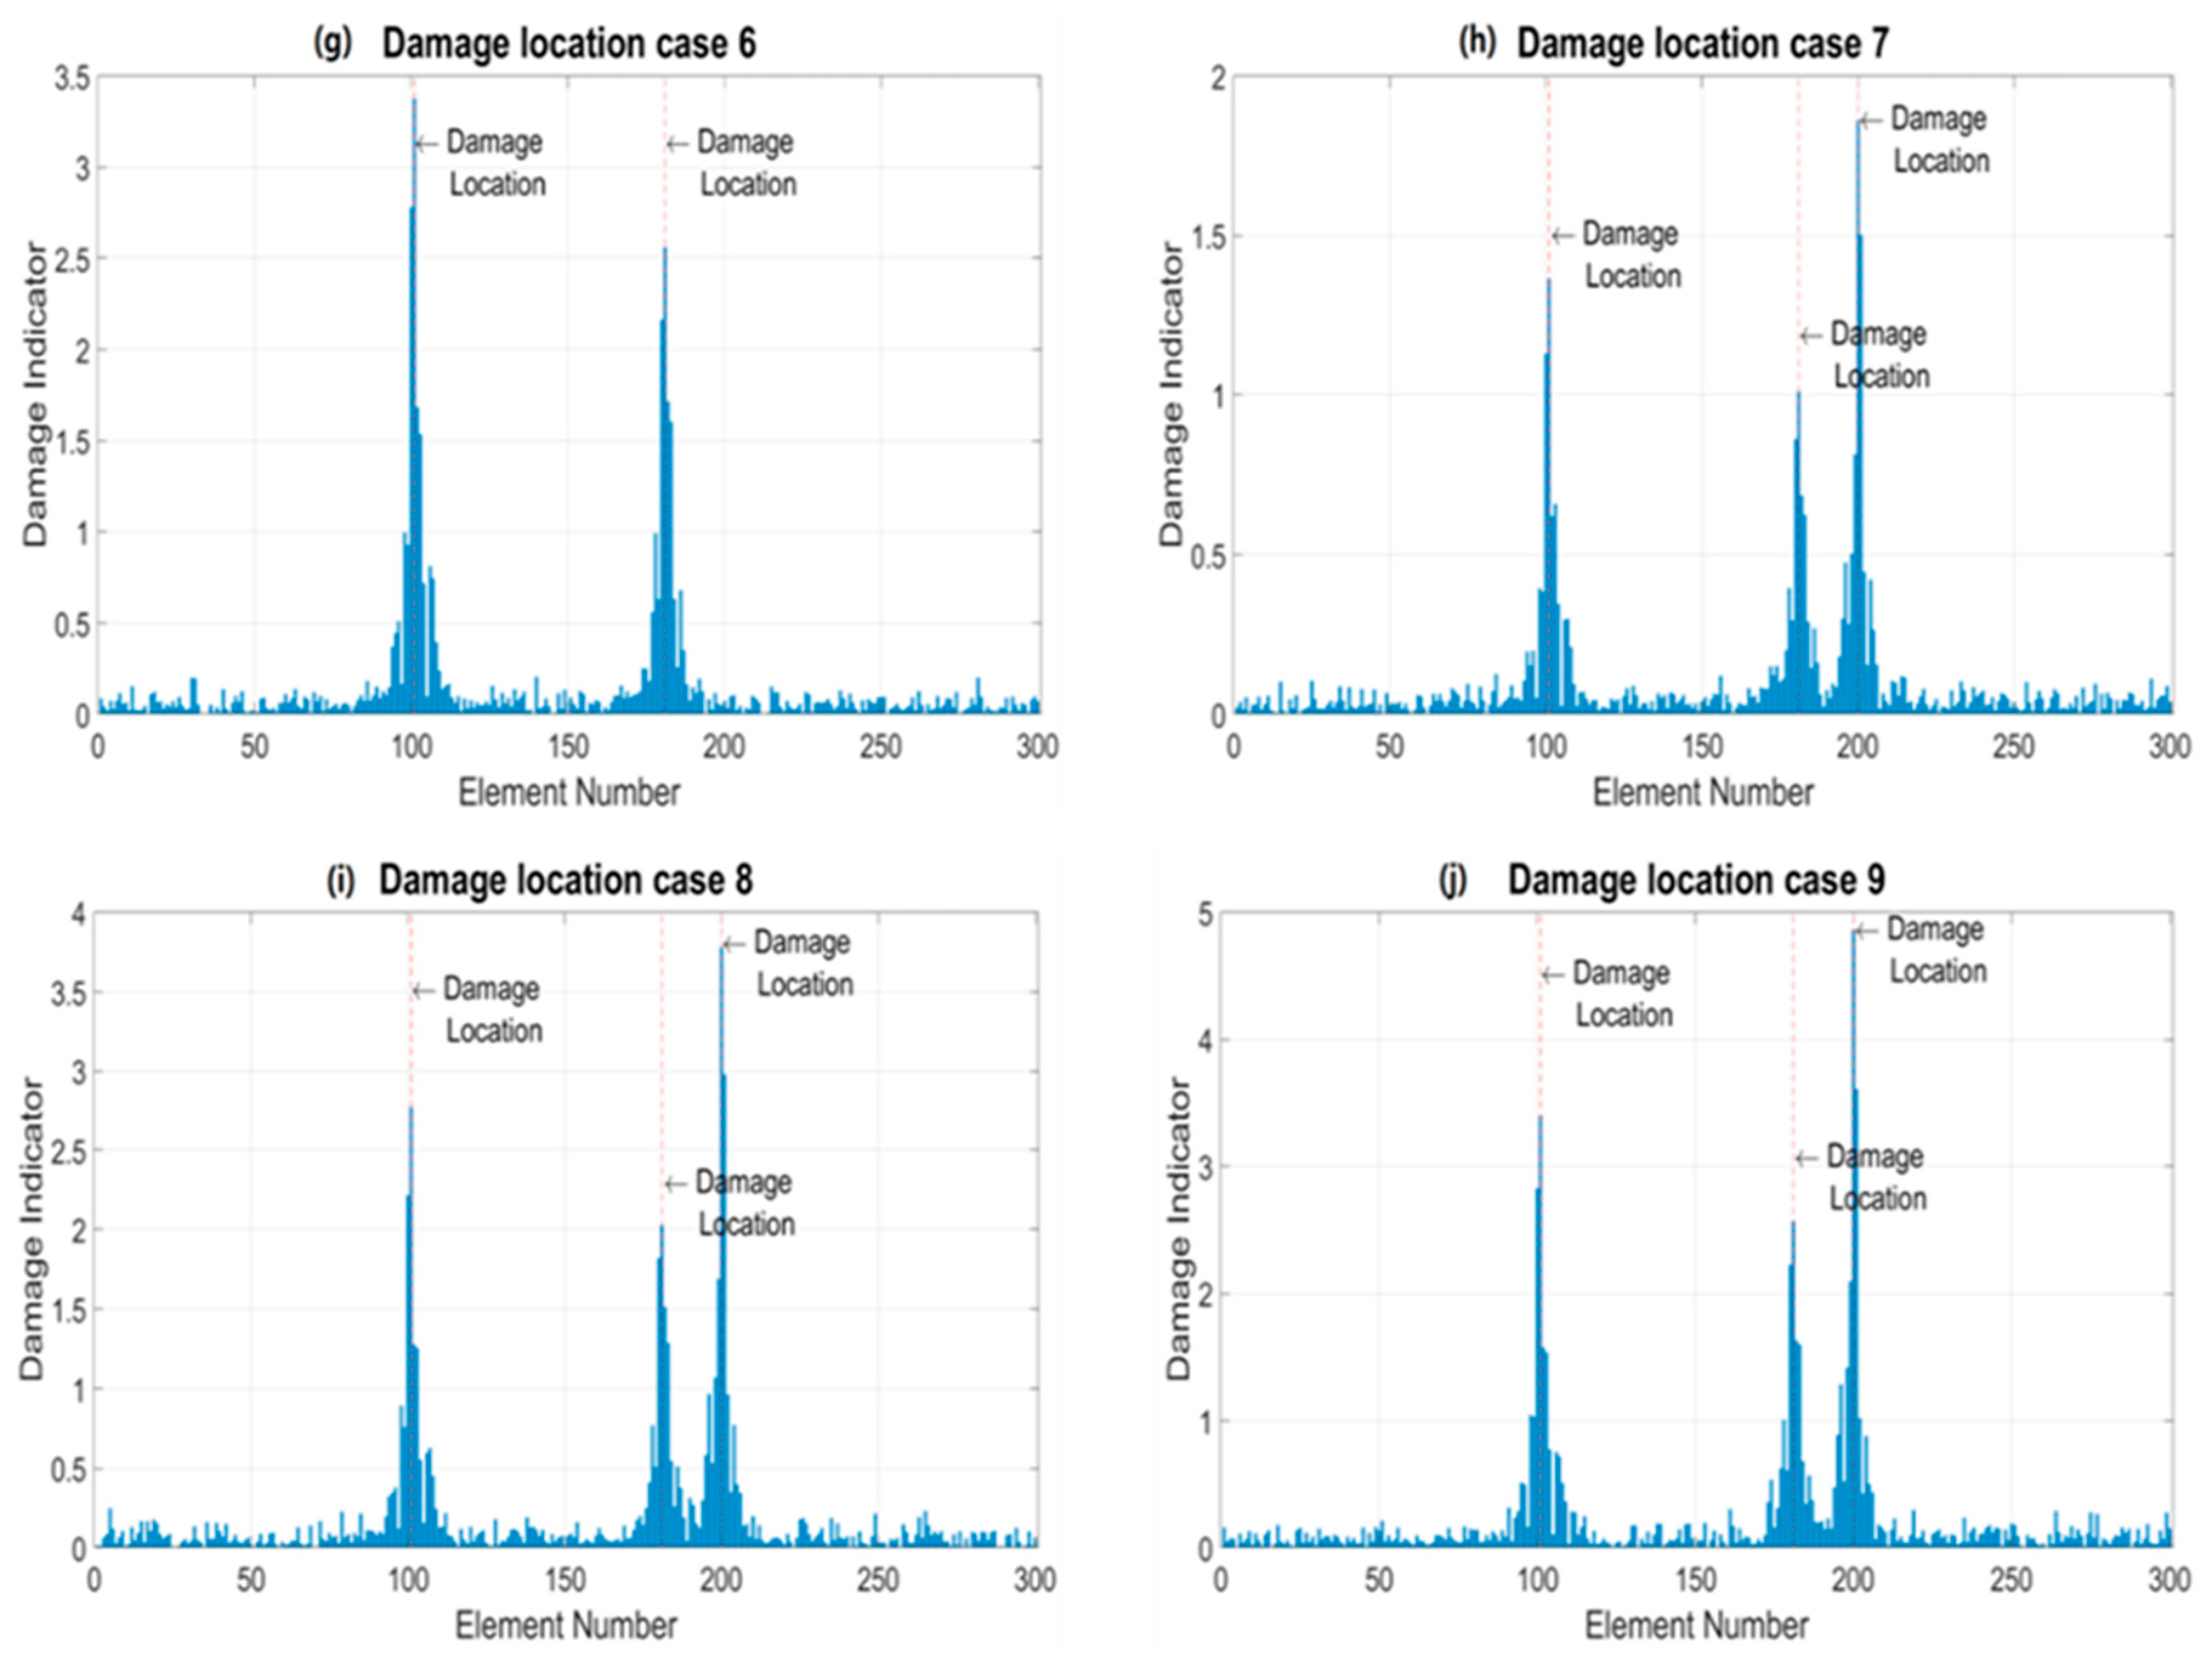
3.3. Damage Localization of Different Cases

The results of numerical simulations were discussed, and the damage localization was presented using an RMS deviation. The changes in the damage index of different damage cases were also discussed. Usually, the damage index is imperative for the condition assessment of the structures, which is based on the real part of the acceleration sensors as a sign of condition variations through perceiving the changes and quantifying the damage statistically. A mean function is a useful tool for arranging and analyzing large datasets. The RMS is a powerful statistical measure for figuring out the number of changes when the changes are both positive and negative.
The damage index of the underground metro tunnel structure was calculated and evaluated under motion using acceleration response raw data (without any processing). The raw vibration data acquired from the numerical simulation of a tunnel model using 300 elements with different percentages of damage severity were used for the localization of damage in the structure. The RMS deviation was used for the localization of each damage condition. Each damaged case was given a separate damage index, which shows the damage index of each damaged and undamaged case. In order to simulate the real tunnel environment, 6% white noise and 12% of white noise were added to the input signals, respectively. The damage identification results under the condition of adding two types of white noise are shown in Figure 11 and Figure 12, respectively.
As shown in Figure 11, even though the damage severity is 4%, the maximum damage index value can be accurately observed at the damage indicator when 6% white noise is added. Besides, the damage index increased from 1.40 to 4.68 as the damage severity risen from 4% to 10%. Damage cases, 1, 2, and 3 have one damage on element 100, and cases 6, 7, 8, and 9 have damage on three elements of different severities. Similarly, when 12% white noise is added, 4% damage can also be accurately identified, and the damage index increased from 1.48 to 5.28 as the damage degree increased from 4% to 10%.
The results of damage identification in two cases demonstrate that the proposed method is feasible to identify structural damage with 6% white noise and 12% white noise, respectively. At the same time, when different types of noise pollution were added, the structural damage index value changed slightly. This shows that the method is reliable and can be used to find, locate, and classify damage in underground tunnel structures. It should be noted from the damage identification results that the higher damage degree on the damage indicator clearly demonstrates the change in the value of damage with damage severity. It can be seen from the observation that the damage identification values at elements 100 and 200 are significantly higher than the element 180 damage index values. As shown in Figure 13a, the higher damage indicator value corresponds to the damage severity. The damage case has a higher damage index of 10% damage severity.
Furthermore, there is no damage in cases 1 and 2 when the damage rigorousness is 10%, as shown in Figure 13a. It is noted that in case 4, element 100 has damage; however, elements 180 and 200 have no damage. Similarly, damage case 9 has maximum damage on all elements. As shown in Figure 13b, element 200 has no damage in the first six damage cases, and element 180 has no damage in the first three cases. Similarly, element 100 has maximum damage in all cases. All the above simulations, analyses of the results, and discussions show that the proposed deep auto encoder (DAE)-based framework execution for damage recognition, damage size assessment, and damage localization is accurate and possible for underground metro tunnel structures.

4. Conclusions

A damage detection study for underground metro shield tunnels was presented in this paper. A numerical model of a metro shield tunnel was utilized, and data obtained from the model through a moving load analysis were used as inputs for the existing deep auto-encoders (DAE) and convolutional neural networks (CNN). Varying levels of damage and noise were considered in the analyses and the utilized deep learning model accurately identified the damage.
  • First, an FEM model of the underground metro shield tunnel structure was built based on previous experimental studies. The dynamic analyses on the numerical model were conducted under a moving load with different severity levels of damage at different locations and elements. To simulate the real-world tunnel scenarios, a different percentage of white noise was added to the calculated responses of the tunnel model to simulate polluted data measurements;
  • Second, a DAE-based framework was used for damage identification, which can support deep neural networks in accurately investigating structural damage via damage feature extraction from input vibration raw signals (without any processing). In addition, root means square (RMS) was used to locate the damage at the different elements and locations in the model. The results were compared under the different schemes: white noise, varying levels of damage, and an intact state. The proposed deep auto encoder algorithm is trained and executed using MATLAB;
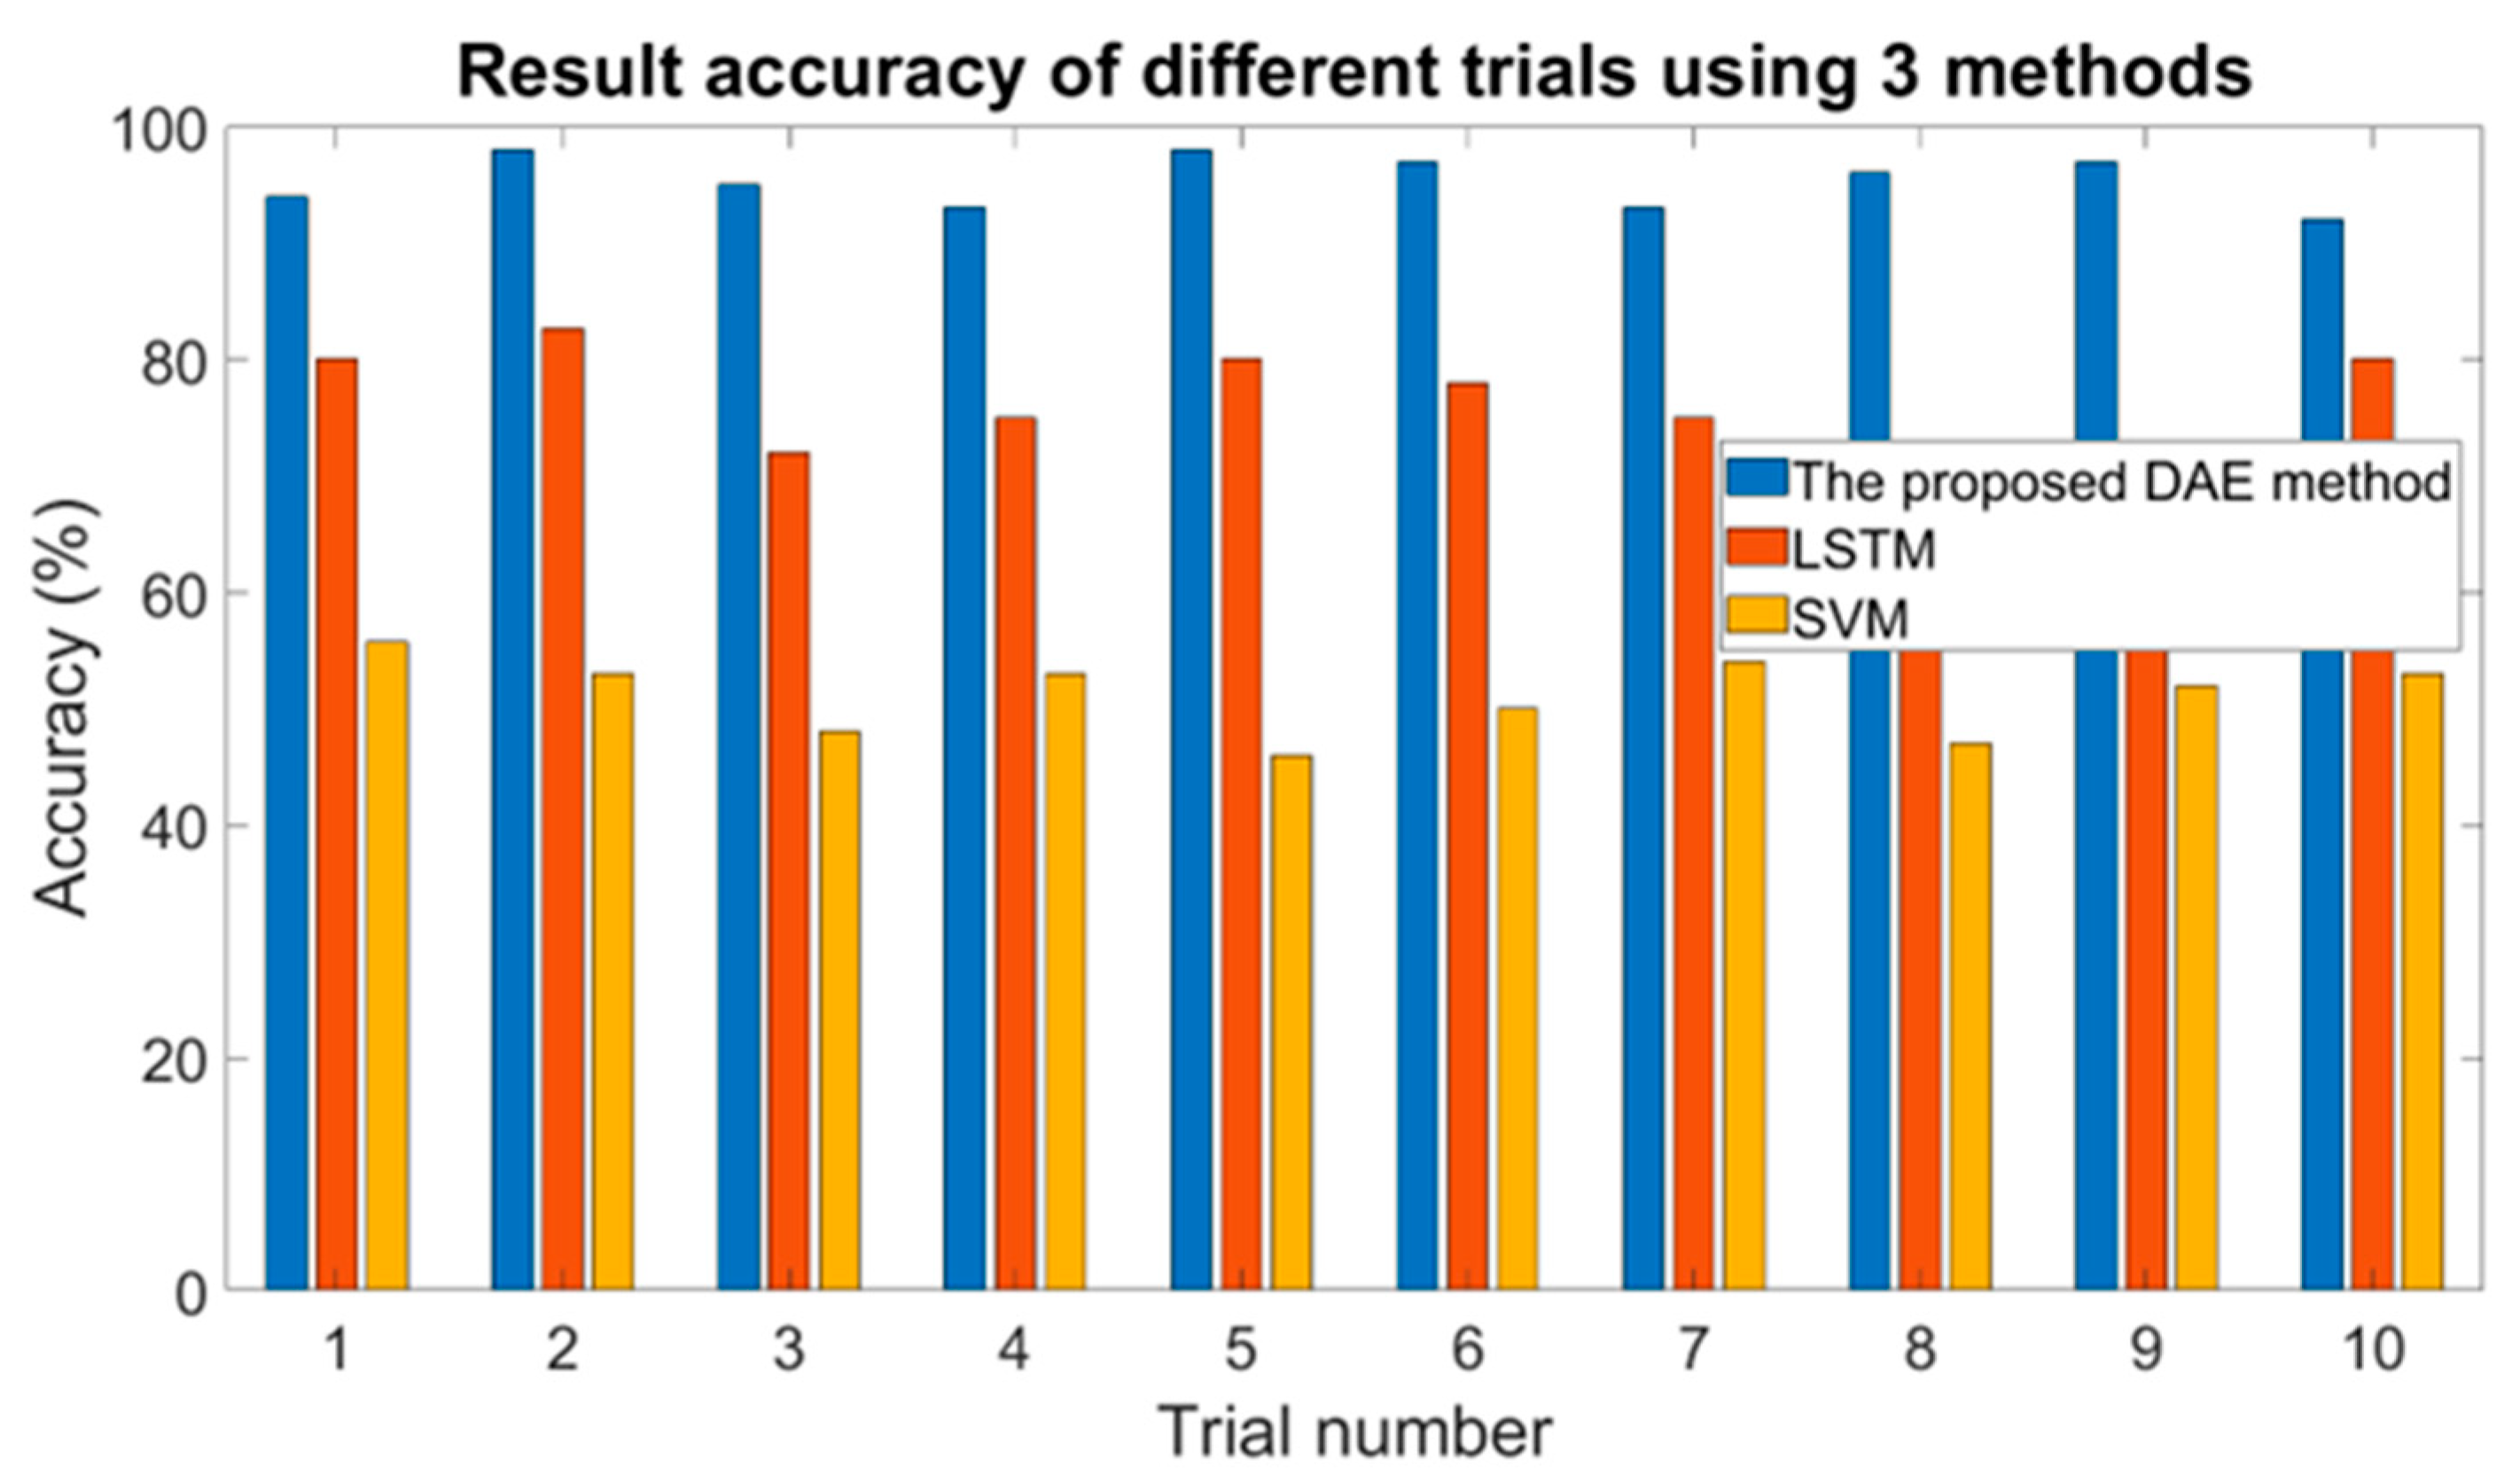
  • To check the feasibility of the proposed approach on a small dataset such as a beam, a finite element model of the simply supported beam was built with ABAQUS software, and numerical simulations were conducted under an impact load. To evaluate the efficiency of the proposed DAE approach, two deep learning-based methods (LSTM and SVM) were also compared with the same input vibration data of the beam. The results of evaluating the beam and comparing it to the other two methods showed that the proposed DAE framework is also feasible for a small structure;
  • A numerical investigation of the underground metro shield tunnel structure validated the accuracy and efficacy of the proposed deep autoencoder (DAE)-based framework execution regarding damage detection, damage size evaluation, and damage localization.

Author Contributions

Conceptualization, N.A. and M.A.; methodology, N.A.; software, N.A.; validation, N.A., M.A. and Z.H.; formal analysis, N.A.; investigation, N.A.; resources, T.U.; writing—original draft preparation, M.A. and Z.H.; writing—review and editing, R.S., T.U. and X.H.; supervision, T.U.; project administration, T.U. All authors have read and agreed to the published version of the manuscript.

Funding

This paper was supported by the Second Tibetan Plateau Scientific Expedition and Research Program (STEP) (Grant No. 2019QZKK0902), and National Natural Science Foundation of China (Grant No. 42077275). It was also supported by Youth Innovation Promotion Association of the Chinese Academy of Sciences (2018405).

Informed Consent Statement

We declare that we do not have human participants, human data, or human tissue.

Data Availability Statement

All data available as per request to corresponding author.

Conflicts of Interest

The authors declare that there is no conflict of interest regarding the publication of this paper.

References

  1. Feng, L.; Yi, X.; Zhu, D.; Xie, X.; Wang, Y. Damage detection of metro tunnel structure through transmissibility function and cross correlation analysis using local excitation and measurement. Mech. Syst. Signal Process. 2015, 60, 59–74. [Google Scholar] [CrossRef]
  2. Ore DIN. ORE Open Research Exeter; University of Exeter: Exeter, UK, 2016. [Google Scholar]
  3. Sadhu, A.; Narasimhan, S.; Antoni, J. A review of output-only structural mode identification literature employing blind source separation methods. Mech. Syst. Signal Process. 2017, 94, 415–431. [Google Scholar] [CrossRef]
  4. Li, H.N.; Ren, L.; Jia, Z.G.; Yi, T.H.; Li, D.S. State-of-the-art in structural health monitoring of large and complex civil infrastructures. J. Civ. Struct. Health Monit. 2016, 6, 3–16. [Google Scholar] [CrossRef]
  5. Kaveh, A.; Zolghadr, A. An improved CSS for damage detection of truss structures using changes in natural frequencies and mode shapes. Adv. Eng. Softw. 2015, 80, 93–100. [Google Scholar] [CrossRef]
  6. Iacovino, C.; Ditommaso, R.; Limongelli, M.P.; Ponzo, F.C. Comparison of the performance of two different approaches for damage detection on framed structures. In Proceedings of the 8th European Workshop on Structural Health Monitoring (EWSHM 2016), Bilbao, Spain, 5–8 July 2016; Volume 3, pp. 2017–2026. [Google Scholar]
  7. Hussain, Z.; Pu, Z.; Hussain, A.; Ahmed, S.; Shah, A.U.; Ali, A. Effect of fiber dosage on water permeability using a newly designed apparatus and crack monitoring of steel fiber–reinforced concrete under direct tensile loading. Struct. Health Monit. 2021, 21, 147592172110528. [Google Scholar] [CrossRef]
  8. Ahmed, S.; Hussain, A.; Hussain, Z.; Pu, Z.; Ostrowski, K.A.; Walczak, R. Effect of Carbon Black and Hybrid Steel-Polypropylene Fiber on the Mechanical and Self-Sensing Characteristics of Concrete Considering Different Coarse Aggregates’ Sizes. Materials 2021, 14, 7455. [Google Scholar] [CrossRef]
  9. Hao, H.; Xia, Y. Vibration-based damage detection of structures by genetic algorithm. J. Comput. Civ. Eng. 2002, 16, 222–229. [Google Scholar] [CrossRef]
  10. Padil, K.H.; Bakhary, N.; Hao, H. The use of a non-probabilistic artificial neural network to consider uncertainties in vibration-based-damage detection. Mech. Syst. Signal Process. 2017, 83, 194–209. [Google Scholar] [CrossRef]
  11. Ding, Z.; Yao, R.; Huang, J.; Huang, M.; Lu, Z.R. Structural damage detection based on residual force vector and imperialist competitive algorithm. Struct. Eng. Mech. 2017, 62, 709–717. [Google Scholar]
  12. Sun, M.; Han, T.X.; Liu, M.C.; Khodayari-Rostamabad, A. Multiple Instance Learning Convolutional Neural Networks for object recognition. In Proceedings of the 2016 23rd International Conference on Pattern Recognition (ICPR), Cancun, Mexico, 4–8 December 2016; pp. 3270–3275. [Google Scholar] [CrossRef] [Green Version]
  13. Costilla-Reyes, O.; Scully, P.; Ozanyan, K.B. Deep Neural Networks for Learning Spatio-Temporal Features From Tomography Sensors. IEEE Trans. Ind. Electron. 2018, 65, 645–653. [Google Scholar] [CrossRef]
  14. Guo, X.; Chen, L.; Shen, C. Hierarchical adaptive deep convolution neural network and its application to bearing fault diagnosis. Meas. J. Int. Meas. Confed. 2016, 93, 490–502. [Google Scholar] [CrossRef]
  15. Janssens, O.; Slavkovikj, V.; Vervisch, B.; Stockman, K.; Loccufier, M.; Verstockt, S.; Van de Walle, R.; Van Hoecke, S. Convolutional Neural Network Based Fault Detection for Rotating Machinery. J. Sound Vib. 2016, 377, 331–345. [Google Scholar] [CrossRef]
  16. Zhang, W.; Li, C.; Peng, G.; Chen, Y.; Zhang, Z. A deep convolutional neural network with new training methods for bearing fault diagnosis under noisy environment and different working load. Mech. Syst. Signal Process. 2018, 100, 439–453. [Google Scholar] [CrossRef]
  17. Cai, C.; Wu, Q.; Song, P.; Zhou, H.; Akbar, M.; Ma, S. Study on diffusion of oxygen in coral concrete under different preloads. Constr. Build. Mater. 2021, 319, 126147. [Google Scholar] [CrossRef]
  18. Xia, M.; Li, T.; Xu, L.; Liu, L.; De Silva, C.W. Fault Diagnosis for Rotating Machinery Using Multiple Sensors and Convolutional Neural Networks. IEEE/ASME Trans. Mechatron. 2018, 23, 101–110. [Google Scholar] [CrossRef]
  19. Avci, O.; Abdeljaber, O.; Kiranyaz, S.; Hussein, M.; Inman, D.J. Wireless and real-time structural damage detection: A novel decentralized method for wireless sensor networks. J. Sound Vib. 2018, 424, 158–172. [Google Scholar] [CrossRef]
  20. Abdeljaber, O.; Avci, O.; Kiranyaz, M.S.; Boashash, B.; Sodano, H.; Inman, D.J. 1-D CNNs for structural damage detection: Verification on a structural health monitoring benchmark data. Neurocomputing 2018, 275, 1308–1317. [Google Scholar] [CrossRef]
  21. de Oliveira, M.A.; Monteiro, A.V.; Filho, J.V. A new structural health monitoring strategy based on PZT sensors and convolutional neural network. Sensors 2018, 18, 2955. [Google Scholar] [CrossRef] [Green Version]
  22. Hinton, G.E.; Salakhutdinov, R.R. Reducing the dimensionality of data with neural networks. Science 2006, 313, 504–507. [Google Scholar] [CrossRef] [Green Version]
  23. Schmidhuber, J. Deep Learning in neural networks: An overview. Neural Netw. 2015, 61, 85–117. [Google Scholar] [CrossRef]
  24. Abbas, N.; Yousaf, M.; Akbar, M.; Saeed, M.A.; Huali, P.; Hussain, Z. An Experimental Investigation and Computer Modeling of Direct Tension Pullout Test of Reinforced Concrete Cylinder. Inventions 2022, 7, 77. [Google Scholar] [CrossRef]
  25. Gan, M.; Wang, C.; Zhu, C. Construction of hierarchical diagnosis network based on deep learning and its application in the fault pattern recognition of rolling element bearings. Mech. Syst. Signal Process. 2016, 72–73, 92–104. [Google Scholar] [CrossRef]
  26. Mao, W.; He, L.; Yan, Y.; Wang, J. Online sequential prediction of bearings imbalanced fault diagnosis by extreme learning machine. Mech. Syst. Signal Process. 2017, 83, 450–473. [Google Scholar] [CrossRef]
  27. Bengio, Y. Learning Deep Architectures for AI; Foundations and Trends® in Machine Learning: Hanover, MA, USA, 2009; Volume 2. [Google Scholar]
  28. Loy-Benitez, J.; Li, Q.; Nam, K.J.; Yoo, C.K. Sustainable subway indoor air quality monitoring and fault-tolerant ventilation control using a sparse autoencoder-driven sensor self-validation. Sustain. Cities Soc. 2020, 52, 101847. [Google Scholar] [CrossRef]
  29. Pathirage, C.S.N.; Li, J.; Li, L.; Hao, H.; Liu, W.; Ni, P. Structural damage identification based on autoencoder neural networks and deep learning. Eng. Struct. 2018, 172, 13–28. [Google Scholar] [CrossRef]
  30. Wang, R.; Li, L.; Li, J. A novel parallel auto-encoder framework for multi-scale data in civil structural health monitoring. Algorithms 2018, 11, 112. [Google Scholar] [CrossRef] [Green Version]
  31. Chathurdara, P.; Nadith, S.; Jun, L.I.; Ling, L.I.; Hong, H.A.O.; Wanquan, L.I.U. Application of deep autoencoder model for structural condition monitoring. J. Syst. Eng. Electron. 2018, 29, 873–880. [Google Scholar] [CrossRef] [Green Version]
  32. Pathirage, C.S.N.; Li, J.; Li, L.; Hao, H.; Liu, W.; Wang, R. Development and application of a deep learning–based sparse autoencoder framework for structural damage identification. Struct. Health Monit. 2019, 18, 103–122. [Google Scholar] [CrossRef] [Green Version]
  33. Wang, S.; Li, J.; Luo, H.; Zhu, H. Damage identification in underground tunnel structures with wavelet based residual force vector. Eng. Struct. 2019, 178, 506–520. [Google Scholar] [CrossRef]
  34. Wang, S.; Long, X.; Luo, H.; Zhu, H. Damage identification for underground structure based on frequency response function. Sensors 2018, 18, 3033. [Google Scholar] [CrossRef]
  35. Su, Z.; Mechanics, C.H.-E. Shell-spring-contact model for shield tunnel segmental lining analysis and its application. Eng. Mech. 2007, 24, 131–136. [Google Scholar]
Figure 1. Structure of Autoencoder.
Applsci 13 01332 g001
Figure 2. Frame of proposed approach based on auto encoder.
Applsci 13 01332 g002
Figure 3. Numerical model of a simply supported beam.
Applsci 13 01332 g003
Figure 4. Diagnosis results of 10 trials using three methods.
Applsci 13 01332 g004
Figure 5. Finite element model for the tunnel soil in ABAQUS.
Applsci 13 01332 g005
Figure 6. Complete mechanical model system.
Applsci 13 01332 g006
Figure 7. Segment of the finite element model.
Applsci 13 01332 g007
Figure 8. Tunnel finite element simulation diagram.
Applsci 13 01332 g008
Figure 9. The simulated load (moving): (a) moving trainload; and (b) time domain force of each of the wheel action points.
Applsci 13 01332 g009
Figure 10. Confusion matrix results efficiency.
Applsci 13 01332 g010
Figure 11. The damage location results for moving load having 6% white noise: (a) undamaged case; (b) case 1; (c) case 2; (d) case 3; (e) 4; (f) case 5; (g) case 6; (h) case 7; (i) case 8; and (j) case 9.
Applsci 13 01332 g011aApplsci 13 01332 g011b
Figure 12. Damage location results for a moving load with 12% white noise: (a) undamaged case; (b) case 1; (c) case 2; (d) case 3; (e) 4; (f) case 5; (g) case 6; (h) case 7; (i) case 8; and (j) case 9.
Applsci 13 01332 g012aApplsci 13 01332 g012b
Figure 13. Damage recognition results for different damage cases with 12% white noise: (a) undamaged cases and damage cases (DMG1-DMG9); and (b) comparison of all cases on different elements.
Applsci 13 01332 g013
Table 1. Parameter used in the proposed framework.
DescriptionSymbolValue
Number of hidden layers3
Number of units in the input layer1000
Number of units in the first hidden layer100
Number of units in the second hidden layer200
Number of units in the third hidden layer3000
Learning rate of autoencoderg0.2
Momentum of the autoencodera0.8
Iteration times of the autoencoderT60
kernel size of the autoencoderr2.26
Number of autoencoder3
Table 2. Different impact loading conditions.
Conditions123456
Impact Load/kN.0510152030
Table 3. Average testing accuracy and computation time comparison of the 3 methods.
MethodsAverage Accuracy (%)Standard Deviation AccuracyAverage Computation Time (s)
Proposed DAE method95.3%1.23365.17
LSTM82.65%4.40370.82
SVM55.75%2.76165.23
Table 4. Material properties and unit values.
PropertiesValueUnits
Metro Tunnel:
Diameter outside (D1)5.85m
Diameter inside (D2)5.05m
Length of the Metro (L)30m
Concrete:
Density (ρc)2500kg/m3
Young’s Modulus (Ec)3.1 × 10⁴MPa
Passion ratio (μc)0.2
Soil:
Width (Lw)58.5m
Depth (Ld)58.5 m
Length (Ll)30 m
Density (ρs)1800kg/m3
Young’s Modulus (Es)18Mpa
Poisson ratio (μs)0.36
Table 5. Damage cases to carry out numerical simulation.
Label NoDamage ScenariosSegmentDamage LocationsDamage Severity %
0UDGnullnullnull
1DMG1S100x = 100 m4%
2DMG2S100x = 100 m8%
3DMG3S100x = 100 m10%
4DMG4S100, S180x = 100, 180 m4%
5DMG5S100, S180x = 100, 180 m8%
6DMG6S100, S180x = 100, 180 m10%
7DMG7S100, S180, S200x = 100 m, 180 m, 200 m4%
8DMG8S100, S180, S200x = 100 m, 180 m, 200 m8%
9DMG9S100, S180, S200x = 100 m, 180 m, 200 m10%
Disclaimer/Publisher’s Note: The statements, opinions and data contained in all publications are solely those of the individual author(s) and contributor(s) and not of MDPI and/or the editor(s). MDPI and/or the editor(s) disclaim responsibility for any injury to people or property resulting from any ideas, methods, instructions or products referred to in the content.

