
Prediction of the Yield Strength of RC Columns Using a PSO-LSSVM Model
Abstract
:1. Introduction
2. Pseudo-Static Cyclic Test and Yield Point
2.1. Pseudo-Static Cyclic Test
2.2. Yield Point
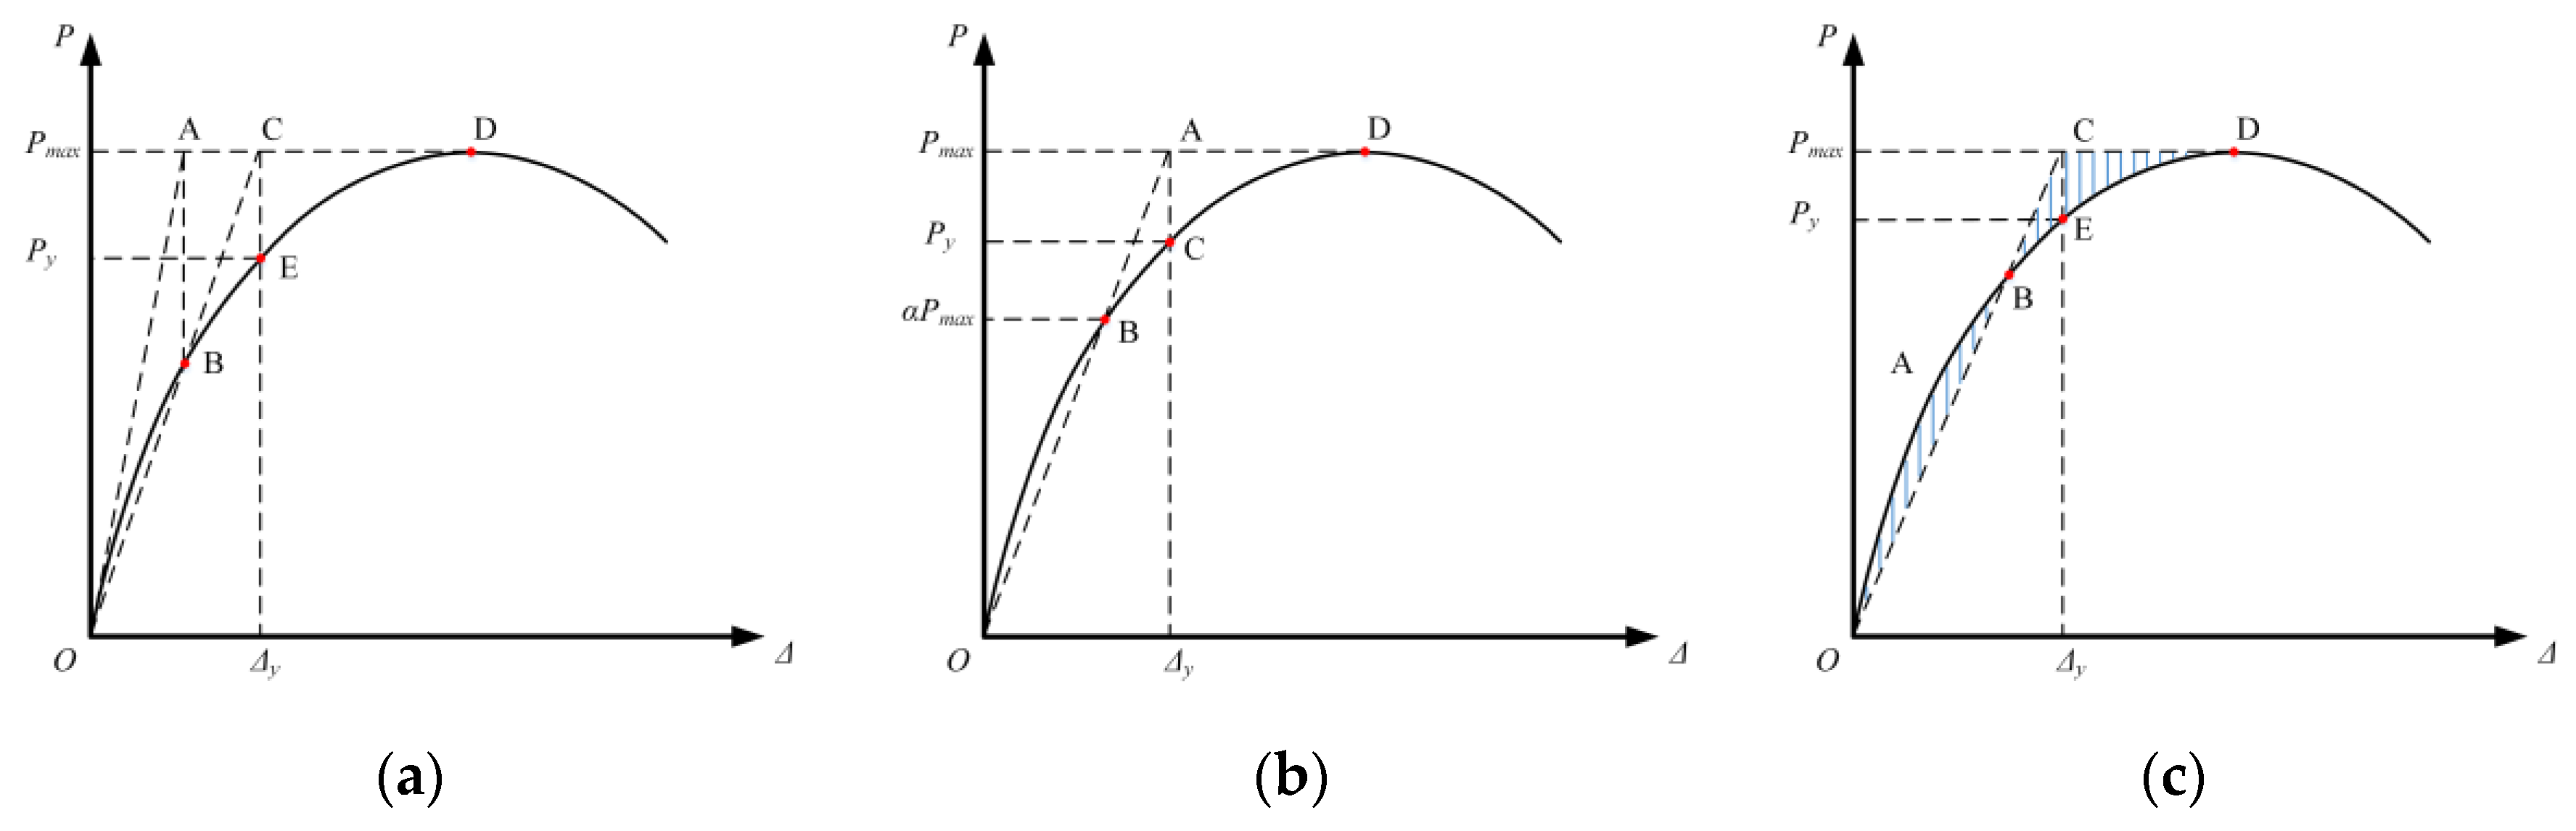
- For the Geometric Graphic Method shown in Figure 2a, the yield displacement and yield point are defined as follows: Draw the tangent line to the curve at ‘O’. The line is extended to the intersection with a horizontal line through ‘D’ at ‘A’, where the ‘D’ corresponds to the maximum applied shear Pmax shown in Figure 2a. The perpendicular of line ‘OA’ intersects the curve at ‘B’. Connect ‘O’ and ‘B’ and extend line ‘OB’ to meet the horizontal line ‘DA’ at ‘C’, and then project onto the horizontal axis to obtain the yield displacement ∆y and the yield point ‘E’ on the curve, where it corresponds to the yield applied shear Py.
- For R. Park Method shown in Figure 2b [48], the yield displacement and yield point are defined as follows: A secant ‘OB’ is drawn to intersect the lateral load-displacement relation at a certain proportion of the maximum applied shear, i.e., the ‘B’ on the curve corresponding to αPmax shown in Figure 2b. Similarly, this extension of line ‘OB’ and the horizontal line corresponding to the maximum applied shear Pmax intersect at ‘A’, and then projects onto the horizontal axis to obtain the yield displacement ∆y. The intersection point ‘C’ of the vertical and curve is defined as the yield point, which corresponds to the yield applied shear Py.
- For Equivalent Elasto-Plastic Energy Method shown in Figure 2c, the yield displacement and yield point are defined as follows: Determine a point ‘B’ on the curve and draw secant ‘OB’ to intersect the curve for satisfying the principle that the energy absorbed by the ideal elastoplastic structure is equal to that absorbed by the actual structure, i.e., the areas of shaded area ‘OAB’ and ‘BCD’ are equal shown in Figure 2c. Similar to the R. Park Method in Figure 2b, this extension of line ‘OB’ and the horizontal line corresponding to the maximum applied shear Pmax intersect at ‘C’, and is then projected onto the horizontal axis to obtain the yield displacement ∆y. The intersection point ‘E’ of the vertical and curve is defined as the yield point, which corresponds to the yield applied shear Py.
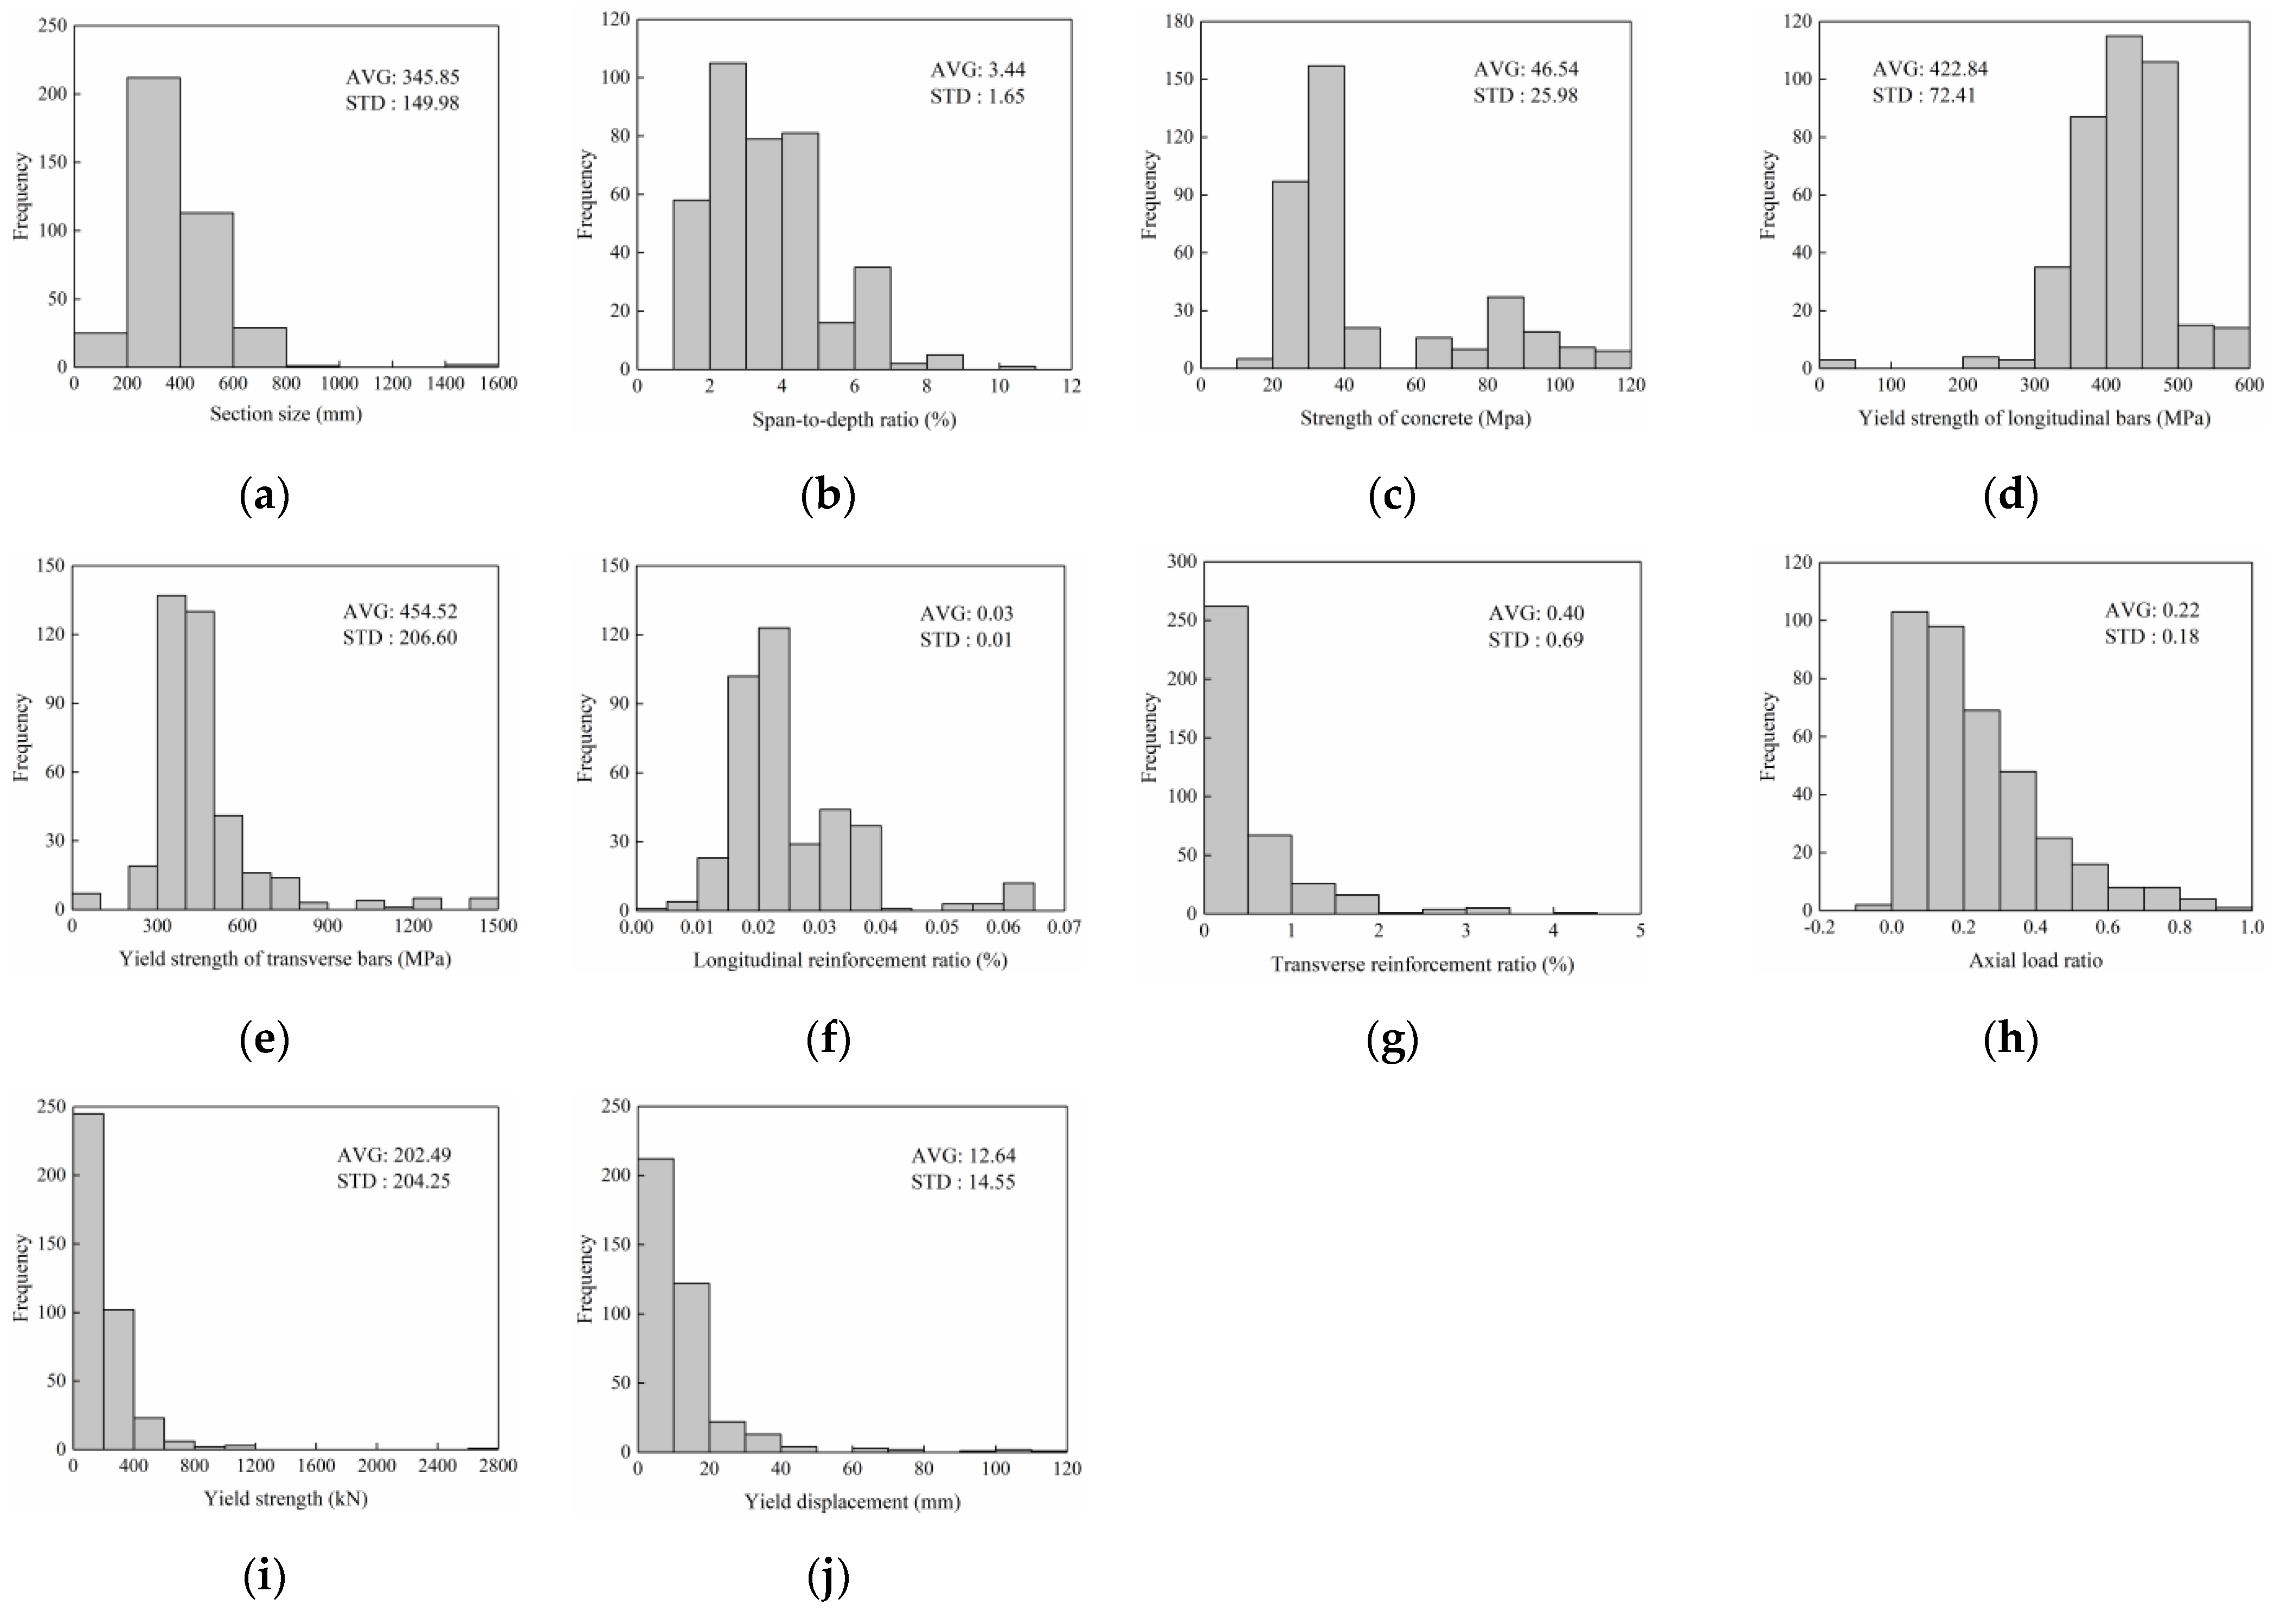
3. Data Collection and Pre-Processing
4. Model Development and Verification
4.1. Least Squares Support Vector Machine
| Algorithm 1: Pseudo-code of LSSVM algorithm | |
| 1 | Initialize LSSVM parameters |
| 2 | Normalize data using Equation (8) |
| 3 | whilestopping condition is not met do |
| 4 | Train LSSVM model with parameters (σ and γ) using each training data point |
| 5 | end while |
| 6 | Predict testing data using trained LSSVM model |
| 7 | returnaccuracy |
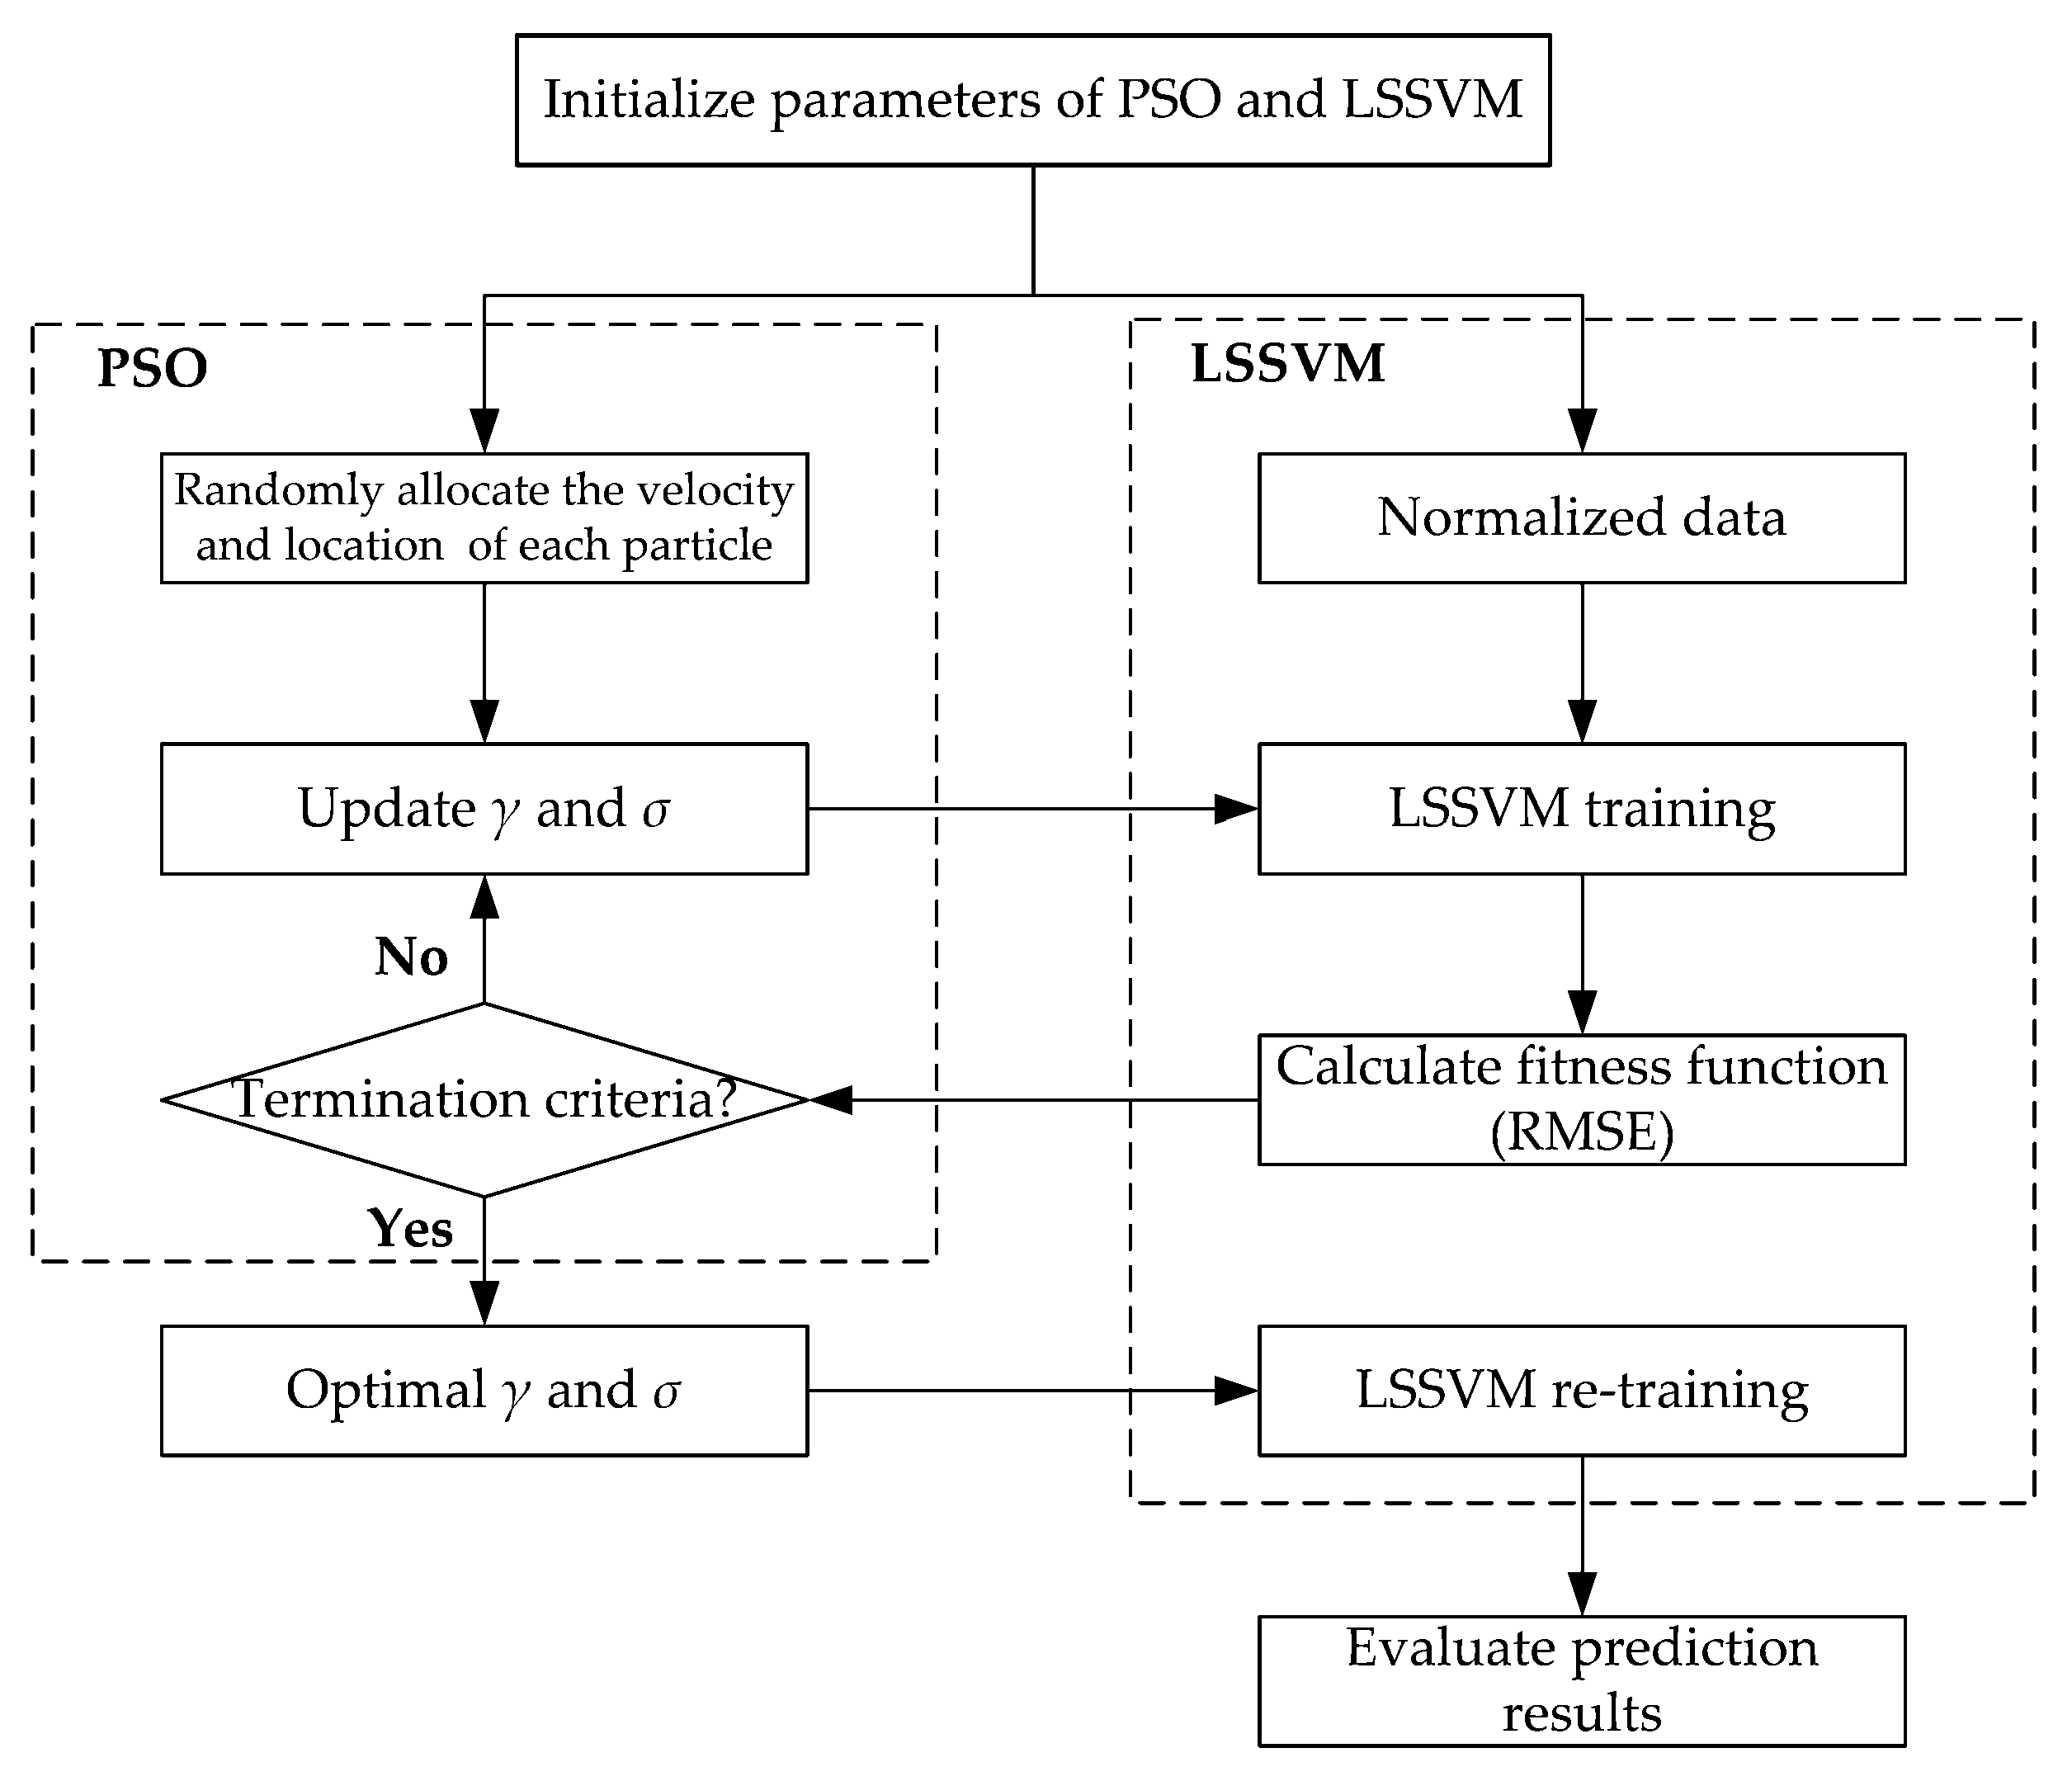
4.2. Particle Swarm Optimization
| Algorithm 2: Pseudo-code of LSSVM algorithm | |
| 1 | Initialize population of particles and derive local and global best particles (pbesti and gbest) |
| 2 | for k = 1 to maximum number of iterations do |
| 3 | for i = 1 to population size do |
| 4 | Update the velocity of the ith particle (vi) using Equation (6) |
| 5 | Update the location of the ith particle (ui) using Equation (7) |
| 6 | if F(ui) < F(pbesti) then |
| 7 | pbesti = ui. |
| 8 | if F(pbesti) < F(gbest) then |
| 9 | gbest = pbesti |
| 10 | end if |
| 11 | end if |
| 12 | end for |
| 13 | end for |
| 14 | returngbest |
- (i)
- Initialize the parameters in PSO algorithm.
- (ii)
- Calculate the fitness value of each particle, and evaluate their fitness with Equation (8), i.e., F(u) = F(σ, γ) = RMSE.
- (iii)
- Update the location and velocity of the ith particle with Equations (6) and (7) and compare the current fitness value of each particle F(ui) with the individual best fitness value F(pbesti), if satisfying F(ui) < F(pbesti), pbesti = ui.
- (iv)
- Compare the current fitness values of all particles in the swarm F(ui) with the fitness value of the best location of the swarm F(gbest), if satisfying F(ui) < F(gbest), the global optimal solution gbest = ui.
- (v)
- Check whether the termination condition is met. If the error accuracy is satisfied or the maximum number of swarm evolution is reached, then the process of searching for the optimal solution (σ, γ) ends and the optimal values of σ and γ are outputted. Otherwise, proceed to the next step from step (ii) to continue the process of parameter optimization.
- (vi)
- Substitute the optimal parameters (σ, γ) into Equation (1) for predicting the yield strength and displacement of RC columns.
4.3. Implementation of the Yield Strength and Displacement Prediction
4.4. Evaluation of the PSO-LSSVM Prediction Performance
4.4.1. Performance Evaluation Indicators
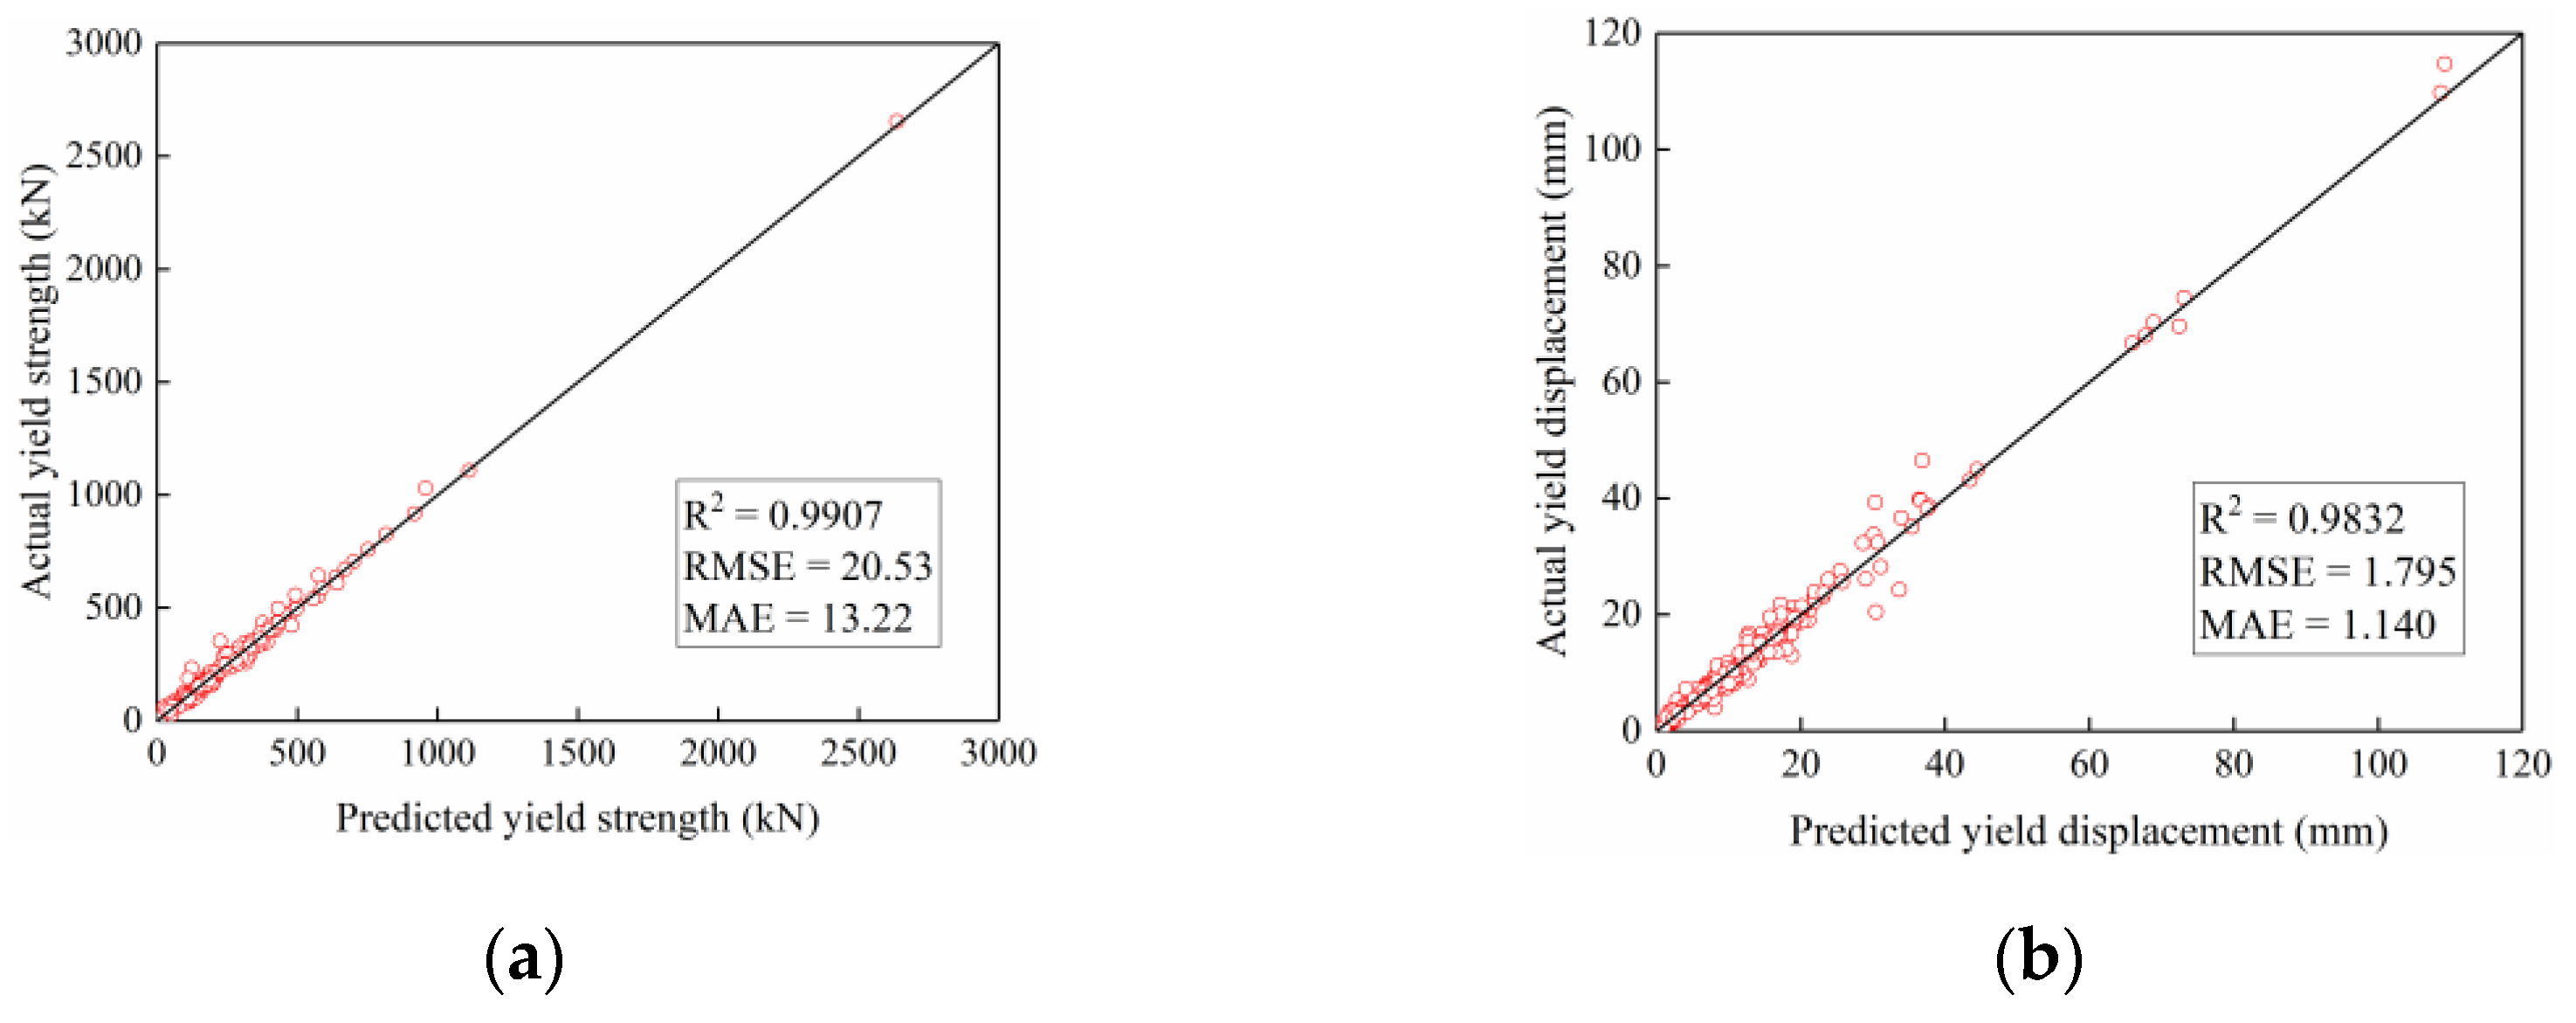
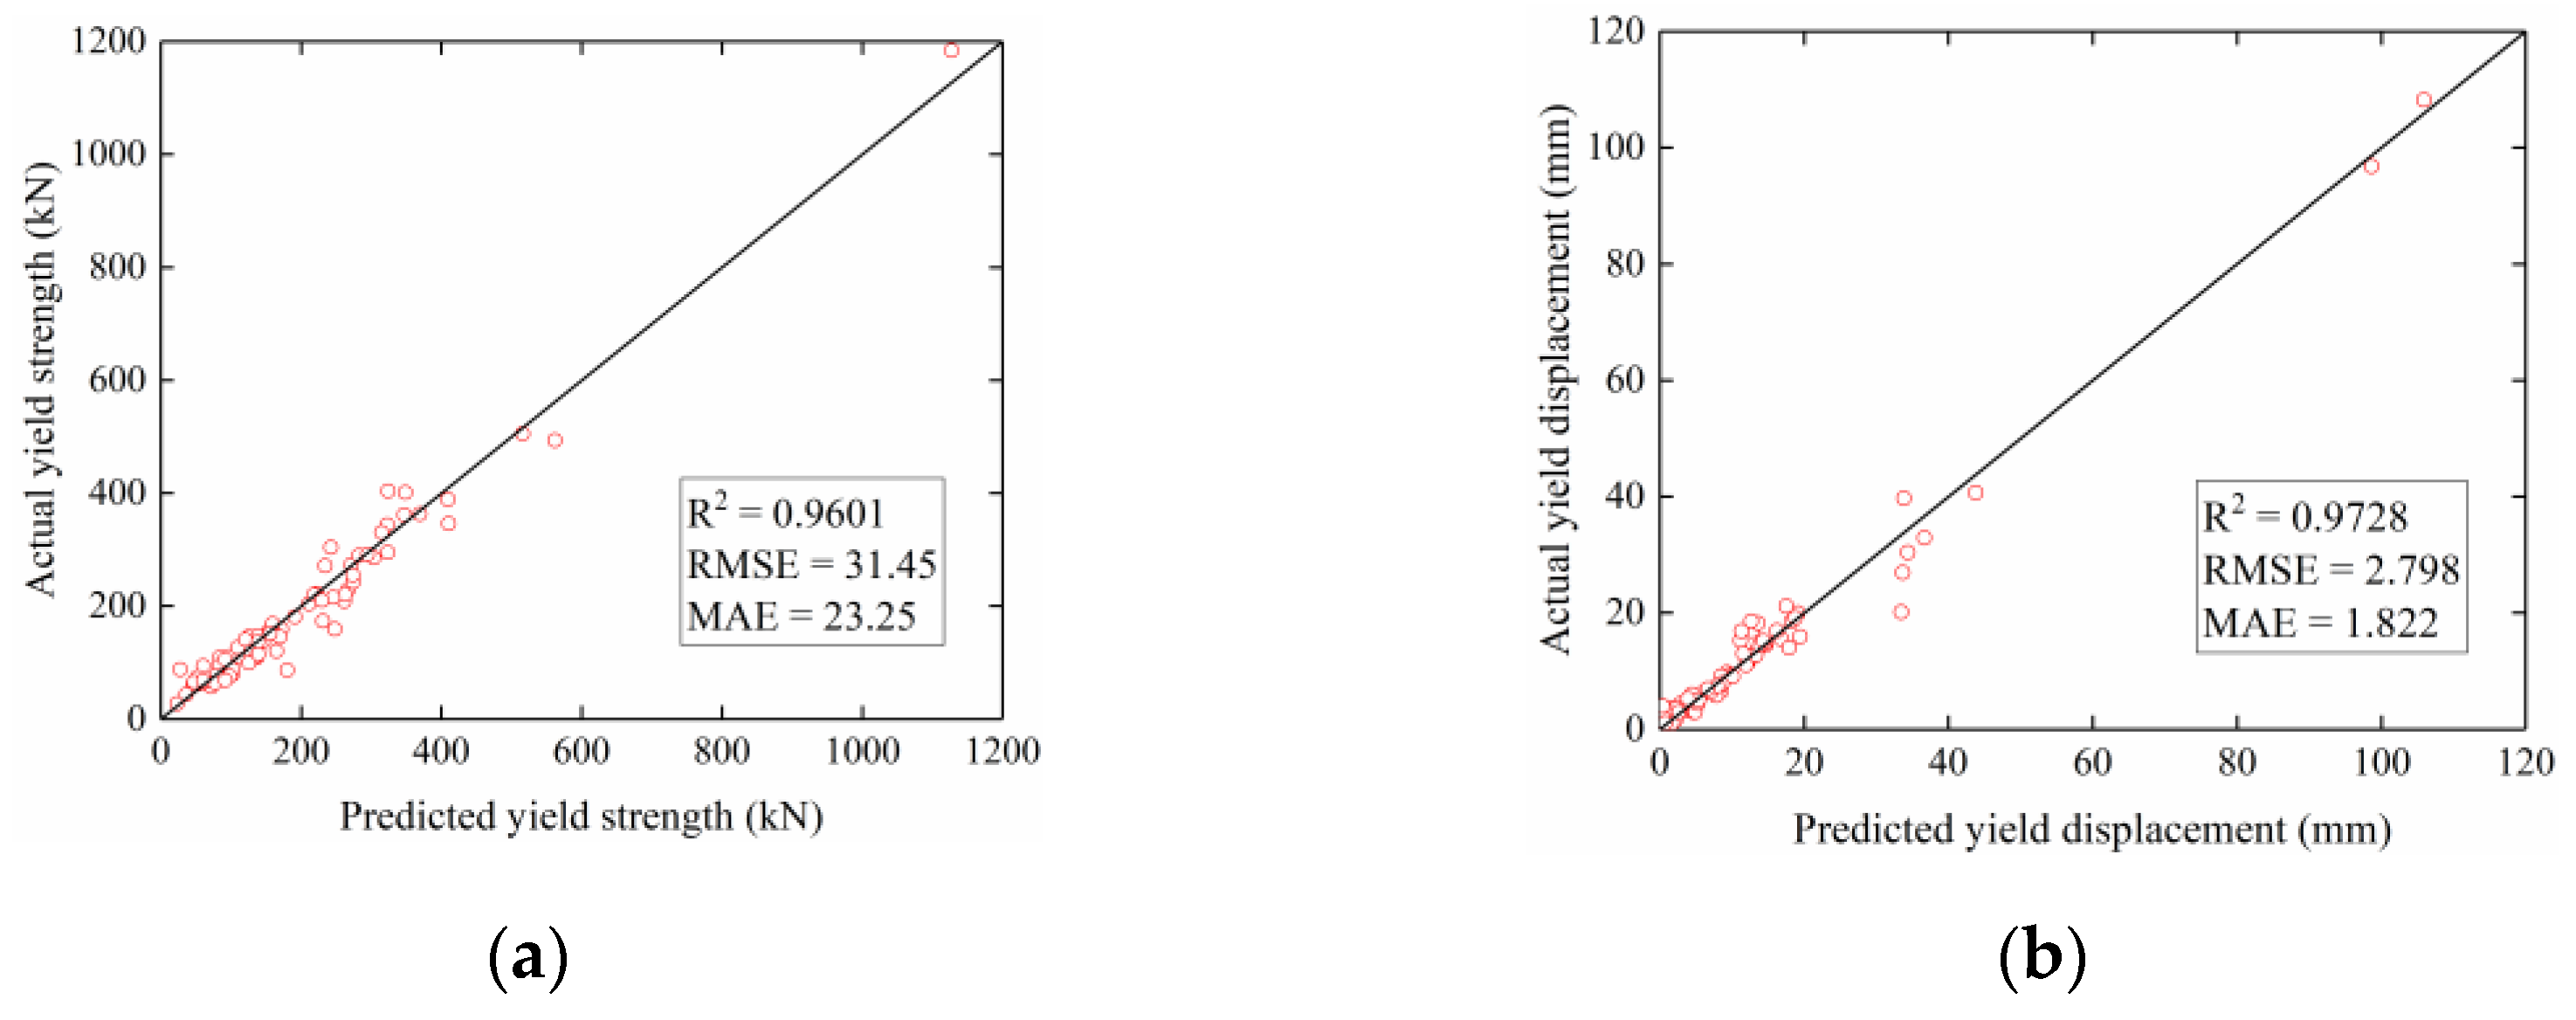
4.4.2. Evaluation of the PSO-LSSVM Prediction Results
4.4.3. Comparative Evaluation of Model Prediction Performance
5. Conclusions
- (1)
- The determination coefficient R2 is 0.96, if 80% of the whole dataset is used for training the PSO-LSSVM model, which means a low prediction error. Meanwhile, the RMSE and MAE are 31.45 and 23.25, respectively, which indicates that the prediction model has a low prediction deviation.
- (2)
- The PSO adopted for parameter optimization of σ and γ that are embedded in the LSSVM model, can quickly find the optimal parameters to effectively assist the LSSVM model in prediction work.
- (3)
- The proposed PSO-LSSVM model can predict the yield strength and displacement of RC columns with high efficiency and accuracy by comparing them with the LSSVM models optimized by other metaheuristic algorithms.
Author Contributions
Funding
Institutional Review Board Statement
Informed Consent Statement
Data Availability Statement
Conflicts of Interest
References
- Lehman, D.; Moehle, J.; Mahin, S. Experimental evaluation of the seismic performance of reinforced concrete bridge columns. J. Struct. Eng. 2004, 130, 869–879. [Google Scholar] [CrossRef]
- Du, X.L.; Chen, M.Q.; Han, Q. Experimental evaluation of seismic performance of reinforced concrete hollow bridge columns. J. Vib. Shock 2011, 30, 254–259. [Google Scholar]
- Basöz, N.I.; Kiremidjian, A.S.; King, S.A.; Law, K.H. Statistical analysis of bridge damage data from the 1994 Northridge, CA, earthquake. Earthq. Spectra 1999, 15, 25–54. [Google Scholar] [CrossRef]
- Park, H.G.; Yu, E.J.; Choi, K.K. Shear-strength degradation model for RC columns subjected to cyclic loading. Eng. Struct. 2012, 34, 187–197. [Google Scholar] [CrossRef]
- Shrestha, R.; Smith, S.T.; Samali, B. Finite element modelling of FRP-strengthened RC beam-column connections with ANSYS. Comput. Concr. 2013, 11, 1–20. [Google Scholar] [CrossRef]
- Wang, Q.; Song, X.; Hao, Z.; Wang, Z. Numerical simulation of failure process of RC columns based on fiber beam element in ABAQUS. China Civ. Eng. J. 2014, 47, 16–26. [Google Scholar]
- Panagiotakos, T.B.; Fardis, M.N. Deformations of reinforced concrete members at yielding and ultimate. ACI Struct. J. 2001, 98, 135–148. [Google Scholar]
- Frederic, L.; Patrick, P. Behavior of high-strength concrete columns under cyclic flexure and constant axial load. ACI Struct. J. 2000, 97, 591–601. [Google Scholar]
- Lu, X.Z.; Ye, L.P.; Pan, P. Pseudo-static collapse experiments and numerical prediction competition of RC frame structure II: Key elements experiment. Build. Struct. 2012, 42, 23–26. [Google Scholar]
- Li, X.; Wang, J.; Luo, M. Pseudo-static experiment and analysis on seismic behavior of the RC columns strengthened by GHPFRCC. Nephron Clin. Pract. 2015, 22, 56–60. [Google Scholar] [CrossRef] [Green Version]
- Lee, S.C. Prediction of concrete strength using artificial neural networks. Eng. Struct. 2003, 25, 849–857. [Google Scholar] [CrossRef]
- Gencel, O. The application of artificial neural networks technique to estimate mass attenuation coefficient of shielding barrier. Int. J. Phys. Sci. 2009, 4, 743–751. [Google Scholar]
- Chou, J.S.; Pham, A.D. Enhanced artificial intelligence for ensemble approach to predicting high performance concrete compressive strength. Constr. Build. Mater. 2013, 49, 554–563. [Google Scholar] [CrossRef]
- Pham, A.D.; Hoang, N.D.; Nguyen, Q.T. Predicting compressive strength of high-performance concrete using metaheuristic-optimized least squares support vector regression. J. Comput. Civ. Eng. 2016, 30, 06015002. [Google Scholar] [CrossRef]
- Sharma, L.K.; Singh, T.N. Regression-based models for the prediction of unconfined compressive strength of artificially structured soil. Eng. Comput. 2017, 34, 175–186. [Google Scholar] [CrossRef]
- Yue, Z.; Ding, Y.; Zhao, H.; Wang, Z. Case study of deep learning model of temperature-induced deflection of a cable-stayed bridge driven by data knowledge. Symmetry 2021, 13, 2293. [Google Scholar] [CrossRef]
- Jeon, J.S.; Shafieezadeh, A.; Desroches, R. Statistical models for shear strength of RC beam-column joints using machine-learning techniques. Earthq. Eng. Struct. Dyn. 2014, 43, 2075–2095. [Google Scholar] [CrossRef]
- Xu, J.; Ren, Q.; Shen, Z. Prediction of the strength of concrete radiation shielding based on LS-SVM. Ann. Nucl. Energy 2015, 85, 296–300. [Google Scholar]
- Vu, D.T.; Hoang, N.D. Punching shear capacity estimation of FRP-reinforced concrete slabs using a hybrid machine learning approach. Struct. Infrastruct. Eng. 2016, 12, 1153–1161. [Google Scholar] [CrossRef]
- Luo, H.; Paal, S.G. Machine Learning-Based Backbone Curve Model of Reinforced Concrete Columns Subjected to Cyclic Loading Reversals. J. Comput. Civ. Eng. 2018, 32, 04018042. [Google Scholar] [CrossRef]
- Mangalathu, S.; Jeon, J.S. Classification of failure mode and prediction of shear strength for reinforced concrete beam-column joints using machine learning techniques. Eng. Struct. 2018, 160, 85–94. [Google Scholar] [CrossRef]
- Ning, C.; Wang, L.; Du, W. A practical approach to predict the hysteresis loop of reinforced concrete columns failing in different modes. Constr. Build. Mater. 2019, 218, 644–656. [Google Scholar] [CrossRef]
- Jiang, C.S.; Liang, G.Q. Modeling shear strength of medium- to ultra-high-strength concrete beams with stirrups using SVR and genetic algorithm. Soft Comput. 2021, 25, 10661–10675. [Google Scholar] [CrossRef]
- Quaranta, G.; De Domenico, D.; Monti, G. Machine-learning-aided improvement of mechanics-based code-conforming shear capacity equation for RC elements with stirrups. Eng. Struct. 2022, 267, 114665. [Google Scholar] [CrossRef]
- Cortes, C.; Vapnik, V. Support-vector networks. Mach. Learn. 1995, 20, 273–297. [Google Scholar] [CrossRef]
- Suykens, J.A.; Vandewalle, J. Least squares support vector machine classifiers. Neural Process. Lett. 1999, 9, 293–300. [Google Scholar] [CrossRef]
- Suykens, J.A.; Vandewalle, J.; Moor, B.D. Optimal control by least squares support vector machines. Neural Netw. 2001, 14, 23–35. [Google Scholar] [CrossRef]
- Suykens, J.A.; De Brabanter, J.; Lukas, L.; Vandewalle, J. Weighted least squares support vector machines: Robustness and sparse approximation. Neurocomputing 2002, 48, 85–105. [Google Scholar] [CrossRef]
- Zheng, C.; Kasihmuddin, M.S.M.; Mansor, M.A.; Chen, J.; Guo, Y. Intelligent Multi-Strategy Hybrid Fuzzy K-Nearest Neighbor Using Improved Hybrid Sine Cosine Algorithm. Mathematics 2022, 10, 3368. [Google Scholar] [CrossRef]
- Holland, J.H. Genetic algorithms and the optimal allocation of trials. SIAM J. Comput. 1973, 2, 88–105. [Google Scholar] [CrossRef]
- Storn, R.; Price, K. Differential evolution—A simple and efficient heuristic for global optimization over continuous spaces. J. Glob. Optim. 1997, 11, 341–359. [Google Scholar] [CrossRef]
- Karaboga, D.; Basturk, B. A powerful and efficient algorithm for numerical function optimization: Artificial bee colony (ABC) algorithm. J. Glob. Optim. 2007, 39, 459–471. [Google Scholar] [CrossRef]
- Kennedy, J.; Eberhart, R. Particle swarm optimization. In Proceedings of the ICNN’95-International Conference on Neural Networks, Perth, Australia, 27 November–1 December 1995; Volume 4, pp. 1942–1948. [Google Scholar]
- Ma, W.T. Evaluation of rock slope stability based on PSO and LSSVM. Rock Soil Mech. 2009, 30, 845–848. [Google Scholar]
- Chatterjee, S.; Sarkar, S.; Hore, S.; Dey, N.; Ashour, A.S.; Shi, F.; Le, D.N. Structural failure classification for reinforced concrete buildings using trained neural network based multi-objective genetic algorithm. Struct. Eng. Mech. 2017, 63, 429–438. [Google Scholar]
- Xue, X. Prediction of slope stability based on hybrid PSO and LSSVM. J. Comput. Civ. Eng. 2017, 31, 04016041. [Google Scholar] [CrossRef]
- Yang, J.; Zhu, H.; Wang, Y. An orthogonal multi-swarm cooperative PSO algorithm with a particle trajectory knowledge base. Symmetry 2017, 9, 15. [Google Scholar] [CrossRef] [Green Version]
- Cao, J.; Li, W.Y.; Zhao, D.S.; Song, Z.G.; Ding, W.Y. Forecast of building inclination around foundation pit based on PSO-LSSVM model. Comput. Eng. Appl. 2016, 52, 254–259. [Google Scholar]
- Yu, Y.; Zhang, C.; Gu, X.; Cui, Y. Expansion prediction of alkali aggregate reactivity-affected concrete structures using a hybrid soft computing method. Neural Comput. Appl. 2019, 31, 8641–8660. [Google Scholar] [CrossRef]
- Mo, P.Q.; Ma, D.Y.; Zhu, Q.Y.; Hu, Y.C. Interpretation of heating and cooling data from thermal cone penetration test using a 1D numerical model and a PSO algorithm. Comput. Geotech. 2020, 130, 103908. [Google Scholar] [CrossRef]
- He, S.; Chen, W.; Mu, X.; Cui, W. Constrained optimization model of the volume of initial rainwater storage tank based on ANN and PSO. Environ. Sci. Pollut. R. 2020, 27, 21057–21070. [Google Scholar] [CrossRef]
- Khari, M.; Danial, J.A.; Dehghanbanadaki, A. Prediction of lateral deflection of small-scale piles using hybrid PSO–ANN model. Arab. J. Sci. Eng. 2020, 45, 3499–3509. [Google Scholar] [CrossRef]
- Haselton, C.B.; Liel, A.B.; Taylor-Lange, S.C.; Deierlein, G.G. Calibration of model to simulate response of reinforced concrete beam-columns to collapse. ACI Struct. J. 2016, 113, 1141–1152. [Google Scholar] [CrossRef]
- Liu, Z.; Guo, A. Empirical-based support vector machine method for seismic assessment and simulation of reinforced concrete columns using historical cyclic tests. Eng. Struct. 2021, 237, 112141. [Google Scholar] [CrossRef]
- Zhang, J.; Li, X.; Cao, W.; Yu, C. Cyclic behavior of steel tube-reinforced high-strength concrete composite columns with high-strength steel bars. Eng. Struct. 2019, 189, 565–579. [Google Scholar] [CrossRef]
- Hassan, W.M.; Farag, M. Seismic performance of steel-reinforced concrete composite columns in existing and modern construction. Soil Dyn. Earthq. Eng. 2021, 151, 106945. [Google Scholar] [CrossRef]
- Liu, Z.; Wang, X.; Zhou, Z.; Xue, J.; Lai, B.; Xu, J. Experimental and numerical study on seismic performance of steel reinforced concrete spatial frame with irregular section columns. Eng. Struct. 2021, 242, 112507. [Google Scholar] [CrossRef]
- Park, R. State of the art report-ductility evaluation from laboratory and analytical testing. In Proceedings of the 9th World Conference on Earthquake Engineering, Tokyo-Kyoto, Japan, 2–9 August 1988; Volume 8, pp. 605–616. [Google Scholar]
- Berry, M.; Parrish, M.; Eberhard, M. PEER Structural Performance Database User’s Manual Version 1.0; University of California: Berkeley, CA, USA, 2004. [Google Scholar]
- Ghannoum, W.; Sivaramakrishnan, B.; Pujol, S.; Catlin, A.C.; Fernando, S.; Yoosuf, N.; Wang, Y. NEES: ACI 369 Rectangular Column Database. 2015. Available online: https://datacenterhub.org/resources/255 (accessed on 25 October 2022).
- Platt, J.C. A fast algorithm for training support vector machines. J. Inf. Technol. 1998, 2, 1–28. [Google Scholar]
- Shevade, S.K.; Keerthi, S.S.; Bhattacharyya, C.; Murthy, K. Improvements to the SMO algorithm for SVM regression. IEEE Trans. Neural Networ. 2000, 11, 1188–1193. [Google Scholar] [CrossRef]


| Study | Model | Issues or Objectives |
|---|---|---|
| Xu et al. [18] | LSSVM | Predict the strength of radiation-shielding concrete |
| Vu and Hoang [19] | LSSVM | Predict the ultimate punching shear capacity of FRP-RC slabs. |
| Luo and Paal [20] | ML-BCV | Predict backbone curves of RC columns |
| Mangalathu and Jeon [21] | MLs | Predict shear strength for RC beam-column joints |
| Ning et al. [22] | DE-ANN | Predict the hysteresis loop of RC columns |
| Influencing Factors | Parameters | Description |
|---|---|---|
| Geometries | Dc | Section size (mm) |
| ρr = L/Dc | Span-to-depth ratio (%) | |
| SecT | Section type | |
| Materials | fc | Strength of concrete (MPa) |
| fyl | Yield strength of longitudinal bars (MPa) | |
| fyv | Yield strength of transverse bars (MPa) | |
| Reinforcement | ρl | Longitudinal reinforcement ratio (%) |
| ρv | Transverse reinforcement ratio (%) | |
| Loading | ρn = P/(Ag·fc) | Axial load ratio |
| Variables | Min. | Max. | Mean | Std. |
|---|---|---|---|---|
| Dc | 80 | 1520 | 345.85 | 149.98 |
| ρr | 1 | 10 | 3.44 | 1.65 |
| fc | 16 | 118 | 46.54 | 25.98 |
| fyl | 0 | 587.1 | 422.84 | 72.41 |
| fyv | 0 | 1424 | 454.52 | 206.60 |
| ρl | 0.0046 | 0.0603 | 0.03 | 0.01 |
| ρv | 0 | 4.27 | 0.40 | 0.69 |
| ρn | −0.099 | 0.9 | 0.22 | 0.18 |
| Fy | 16.27 | 2654.11 | 202.49 | 204.25 |
| Δy | 0.54 | 114.70 | 12.64 | 14.55 |
| σ | γ | |
|---|---|---|
| Fy | 0.47 | 195.45 |
| Δy | 0.43 | 49.93 |
| Model | Training | Testing | |||||||
|---|---|---|---|---|---|---|---|---|---|
| RMSE | MAE | R2 | EV | RMSE | MAE | R2 | EV | ||
| Fy | LSSVM | 25.41 | 15.65 | 0.9859 | 98.5933 | 43.29 | 26.58 | 0.9248 | 92.6090 |
| GA-LSSVM | 20.61 | 13.41 | 0.9907 | 99.0746 | 31.92 | 23.93 | 0.9591 | 95.9857 | |
| ABC-LSSVM | 20.54 | 13.25 | 0.9908 | 99.0802 | 31.60 | 23.38 | 0.9599 | 96.0527 | |
| DE-LSSVM | 19.90 | 12.94 | 0.9913 | 99.1371 | 31.42 | 23.17 | 0.9603 | 96.1449 | |
| PSO-LSSVM | 20.53 | 13.22 | 0.9907 | 99.0821 | 31.45 | 23.25 | 0.9601 | 96.0898 | |
| Δy | LSSVM | 2.067 | 1.282 | 0.9775 | 99.7536 | 7.870 | 2.895 | 0.7848 | 78.5773 |
| GA-LSSVM | 1.800 | 1.108 | 0.9830 | 98.2953 | 4.647 | 2.87 | 0.9249 | 92.5010 | |
| ABC-LSSVM | 1.876 | 1.168 | 0.9815 | 98.1484 | 4.943 | 2.674 | 0.9151 | 91.5142 | |
| DE-LSSVM | 1.831 | 1.139 | 0.9823 | 98.2360 | 4.975 | 2.686 | 0.9140 | 91.4036 | |
| PSO-LSSVM | 1.795 | 1.140 | 0.9832 | 98.3245 | 2.798 | 1.822 | 0.9728 | 97.2999 |
Publisher’s Note: MDPI stays neutral with regard to jurisdictional claims in published maps and institutional affiliations. |
© 2022 by the authors. Licensee MDPI, Basel, Switzerland. This article is an open access article distributed under the terms and conditions of the Creative Commons Attribution (CC BY) license (https://creativecommons.org/licenses/by/4.0/).
Share and Cite
Wang, B.; Gong, W.; Wang, Y.; Li, Z.; Liu, H. Prediction of the Yield Strength of RC Columns Using a PSO-LSSVM Model. Appl. Sci. 2022, 12, 10911. https://doi.org/10.3390/app122110911
Wang B, Gong W, Wang Y, Li Z, Liu H. Prediction of the Yield Strength of RC Columns Using a PSO-LSSVM Model. Applied Sciences. 2022; 12(21):10911. https://doi.org/10.3390/app122110911
Chicago/Turabian StyleWang, Bochen, Weiming Gong, Yang Wang, Zele Li, and Hongyuan Liu. 2022. "Prediction of the Yield Strength of RC Columns Using a PSO-LSSVM Model" Applied Sciences 12, no. 21: 10911. https://doi.org/10.3390/app122110911
APA StyleWang, B., Gong, W., Wang, Y., Li, Z., & Liu, H. (2022). Prediction of the Yield Strength of RC Columns Using a PSO-LSSVM Model. Applied Sciences, 12(21), 10911. https://doi.org/10.3390/app122110911