Article

An Automatic ECG Signal Quality Assessment Method Based on Resnet and Self-Attention

1
Institute of Microelectronics of Chinese Academy of Sciences, Beijing 100029, China
2
University of Chinese Academy of Sciences, Beijing 100049, China
*
Author to whom correspondence should be addressed.
Appl. Sci. 2023, 13(3), 1313; https://doi.org/10.3390/app13031313
Submission received: 15 December 2022 / Revised: 13 January 2023 / Accepted: 16 January 2023 / Published: 18 January 2023

Abstract

:
Electrocardiogram (ECG) signals are among the significant physiological signals that indicate the essential properties of the human body. In recent years, the measurement of ECG signals has become more portable thanks to the increasing usage of wearable health testing technology. However, the enormous amount of signal data gathered over a long period of time does impose a heavy load on medical professionals. In addition, false alarms might occur due to the potential for the detected signal to become jumbled with noise and motion perturbations. Therefore, analyzing the quality of the measured raw ECG signal automatically is a valuable task. In this paper, we propose a new single-channel ECG signal quality assessment method that combines the Resnet network structure and the principle of self-attention to extract ECG signal features using the principle of similarity between individual QRS heartbeats within a time slice of ten seconds. In addition, an improved self-attention module is introduced into the deep neural network to learn the similarity between features. Finally, the network distinguishes between acceptable and unacceptable ECG segments. The model test results indicate that the F1-score can approach 0.954, which leads to a more accurate assessment of the ECG signal quality.

1. Introduction

According to a World Health Organization study in November 2021 [1], 31% of fatalities worldwide in 2019 were attributable to cardiovascular diseases. Cardiovascular diseases remain one of the largest causes of death worldwide [2]. Analyzing heart activity through an electrocardiogram is presently the most prevalent way to find cardiac disease [3,4]. Electrocardiography is a method that records the electrical activity produced by the heart from the biological body surface during each beating cycle using an electrocardiographic monitoring equipment [5,6]. ECG signals represent critical information about the vital signs of a person and give information about the health of the heart and cardiovascular system. Long-term ECG signal measurement is becoming more affordable and practical as a result of the growing popularity of wearable medical diagnostic equipment. A typical length of time for ambulatory ECG examinations nowadays is 24 h, 48 h, or 72 h [7,8,9]. Medical professionals must go through and choose the best slices from this lengthy ECG data to analyze the heart activity state. A considerable number of medical professionals must be sent for this time-consuming endeavor, especially in isolated places with limited access to medical care. Additionally, compared to the ECG signals picked up by clinical equipment, the signals acquired by wearable health testing devices are more susceptible to different interferences (such as power line interference, baseline drift, impulse noise, and muscle noise) [10]. Therefore, the development of ECG signal quality evaluation methods for mobile medical health detection devices continues to be a challenging problem.
Machine learning is a branch of artificial intelligence and a necessary way to achieve artificial intelligence [11]. Its purpose is to study how computers can simulate or implement human learning behavior to acquire new knowledge or skills. Machine learning algorithms are a class of algorithms that automatically analyze data to obtain patterns and use the patterns to make predictions about unknown data [12]. Traditional machine learning methods work in three main steps: data preprocessing, feature extraction, and signal classification. These signal processing steps are often used in ECG signal quality assessment tasks [13]. For example, the methods of ECG signal quality assessment based on the machine learning principle include analysis based on the autoregressive model [14], analysis based on morphological characteristics [15], and a combination of multiple signal quality indicators and support vector machines algorithm [16].The manual calculation of features is a time-consuming step that is unsuitable for handling large amounts of data, and all of the methods mentioned above use some custom thresholds as criteria for signal quality assessment. These criteria are subjective and may contain insufficient or redundant information.
Deep learning is a branch of machine learning; it is an algorithm based on representation learning of data in machine learning [17,18,19]. Different from traditional machine learning methods, deep learning models do not need to design features manually but use deep neural networks to form more abstract high-level representations (or features) by combining low-level features [17], so that the model can understand data more deeply. It has been applied to various fields such as computer vision, natural language processing, and bioinformatics, and has achieved wonderful results [20,21,22]. There are also some ECG signal analysis works on the deep learning network [23,24,25]. However, with the increase of these network layers, the model performance will be degraded. As a kind of deep learning network model, residual network can be used to solve the problem of network performance degradation [26]. Therefore, in this paper, we use the residual network to complete the ECG signal quality evaluation.
Attention mechanisms have attracted a lot of interest recently in fields such as image processing and natural language processing, including tasks such as text translation and image classification [27,28]. However, it is seldom applied in the area of one-dimensional signal processing. In this work, we develop a self-attention module for processing one-dimensional ECG signal data based on QRS waveform similarity. The module creates an attention map by computing pairwise relationships between the channels, then weighting all the features to aggregate information about the distant dependencies between channels. The module employs a 1x1 convolution operation at the input side, which can flexibly reduce the number of channels, thus reducing the calculation workload of the attention module.
To avoid subjective judgments and redundant information that may be introduced by manual computation of features, as well as the problem of network performance degradation, this paper adopts the idea of a residual network to build a network model. The network incorporates the proposed self-attention module and improves the structure and parameters of the residual model to adapt to the processing of one-dimensional signals. Our test results on the PhysioNet/Computing in Cardiology Challenge 2011 (Cinc2011) show that the model can achieve efficient and high-quality ECG signal evaluation with low resource consumption. It reduces the workload of the ECG medical experts and improves the efficiency and accuracy of cardiovascular disease diagnosis.

2. Background

2.1. Resnet Based ECG Classification

With the development of global aging, cardiovascular disease, as one of the chronic diseases, has the characteristics of being sudden, hidden, and fatal [29]. Therefore, strengthening the early screening and long-term monitoring technology of cardiovascular disease has become an urgent problem. With the development of artificial intelligence and the popularization of ECG, there are more than 300 million ECG records every year in the world [30]. Therefore, the importance of automatic classification technology for ECG data is increasingly prominent. At the same time, the popularization of wearable health monitoring equipment brings huge data analysis tasks to medical staff. In this case, automated ECG signal classification technology provides great convenience for medical diagnosis. Although the development of early machine learning algorithms has improved the accuracy of automatic analysis of ECG signals, they require a large number of data preprocessing and manual feature engineering to make the processed data and feature sets suitable for interpreting ECG signals [31,32,33,34]. It increases the complexity of the automatic data analysis process. In recent years, deep learning has been the preferred method for ECG classification [35,36,37,38,39].
As a kind of deep learning network model, the residual network is mainly proposed to solve the problem of network degradation caused by the increase in network depth; that is to say, the residual network can ensure: first, that the network performance can be continuously improved; second, that when the optimal performance is achieved, the redundant network layer does identity mapping. Based on the above properties, the structure has been applied to various fields, including the field of ECG signal processing. For example, Kim et al. proposed a new model framework by combining the residual network with the extrusion and excitation block and the bidirectional short and long memory network [40]. The proposed framework can enable the direct diagnosis of arrhythmia types in clinical trials based on the accurate detection of the minority class. Liu et al. proposed a new heartbeat classification method based on ResNet-101 hybrid time-frequency analysis and migration learning [41]. However, there are few applications in the ECG signal quality assessment task at present. In this paper, we apply the residual network to the ECG signal quality assessment task and optimize the network structure to make it more suitable for one-dimensional ECG signal processing tasks.

2.2. Attention Mechanism in ECG Signal Processing

The attention mechanism was first proposed by DeepMind for image classification, which is a special structure embedded in a machine learning model. We can roughly compare the attention mechanism to a neural network that can focus on a subset (or feature) of the input content, which allows the neural network to pay more attention to the relevant parts of the input and less attention to the irrelevant parts when performing the prediction task. Google mind team used attention mechanism on the recurrent neural network (RNN) model for image classification and obtained good results [42]; this cause the attention mechanism to gradually become a hot research topic. In recent years, some researchers have used it for arrhythmia detection and obtained good performance [43,44,45]. However, the large amount of computations and parameters introduced by the attention module added on the basis of the previous network model is a great challenge for the embedded mobile devices with limited storage and computing capacity. In this paper, in order to minimize the amount of computations and parameters, a lightweight attention model is designed for ECG signal quality assessment.

3. Materials and Methods

This design uses Resnet18 as the basic framework of the network and optimizes the structure and parameters of the network while introducing a self-attention module in the network to obtain the attention matrix and improve the signal quality assessment performance. This network can achieve a high level of ECG signal quality assessment without introducing a large amount of computations and parameters.
Accuracy, sensitivity, specificity, precision, and F1-score are the five assessment criteria we use to assess the performance of the deep network model. Equations (1)–(5) below define their calculating equations. Table 1 shows the confusion matrix, with TP, TN, FP, and FN defined as true positive, true negative, false positive, and false negative.
A c c u r a c y = T P + T N T P + F N + F P + T N
S e n s i t i v i t y = R e c a l l = T P T P + F N
S p e c i f i c i t y = T N F P + T N
P r e c i s i o n = T P T P + F P
F 1 - s c o r e = 2 × P r e c i s i o n × R e c a l l P r e c i s i o n + R e c a l l

3.1. Proposed Signal Quality Assessment Model Framework

It is simpler to set the residuals to zero when a constant mapping is ideal than to fit the constant mapping by stacking nonlinear layers. Simple constant mapping is all that the shortcut connection does, adding its output to the output of the stacked layers. The constant shortcut connection does not increase the number of parameters or the complexity of the computation. Therefore, employing leftover modules to construct deep networks for deployment on resource-constrained embedded mobile devices is useful. Additionally, the lack of research on residual network models in the area of ECG signal quality assessment is filled by the design.
Figure 1 shows the network structure of the entire signal quality assessment model and the location of the self-attention modules within it. The network is made up of 11 modules, including an input module with a convolutional layer, an output module with complete connectivity, 8 Resnet modules, and a self-attention module. The overall network architecture and training parameters are redesigned for better adaptation to the one-dimensional ECG signal quality assessment task. The network structure uses one-dimensional convolution and one-dimensional pooling in place of the original two-dimensional convolution and two-dimensional pooling operations used for two-dimensional image feature extraction. The self-attention module is incorporated into the architecture to gather information about channel similarity and enhance signal quality estimation. However, since evaluating the quality of an ECG signal is equivalent to performing a binary classification task, adding more layers or neurons increases the weight parameters of the network, which can increase the expressiveness of the neural network but also increases the likelihood of overfitting issues. As a result, learning the model parameters is negatively impacted by having an excessive number of neurons in the last completely connected layer. The original number of channels in this network is changed from 512 to 128, while the number of neurons in the fully connected layer is changed from 512 to 128. By redesigning the seventh and eighth Resnet modules of the resnet18 network model, we can avoid the overfitting phenomenon on the one hand and reduce the number of model parameters on the other.

3.2. Proposed Self-Attention Module

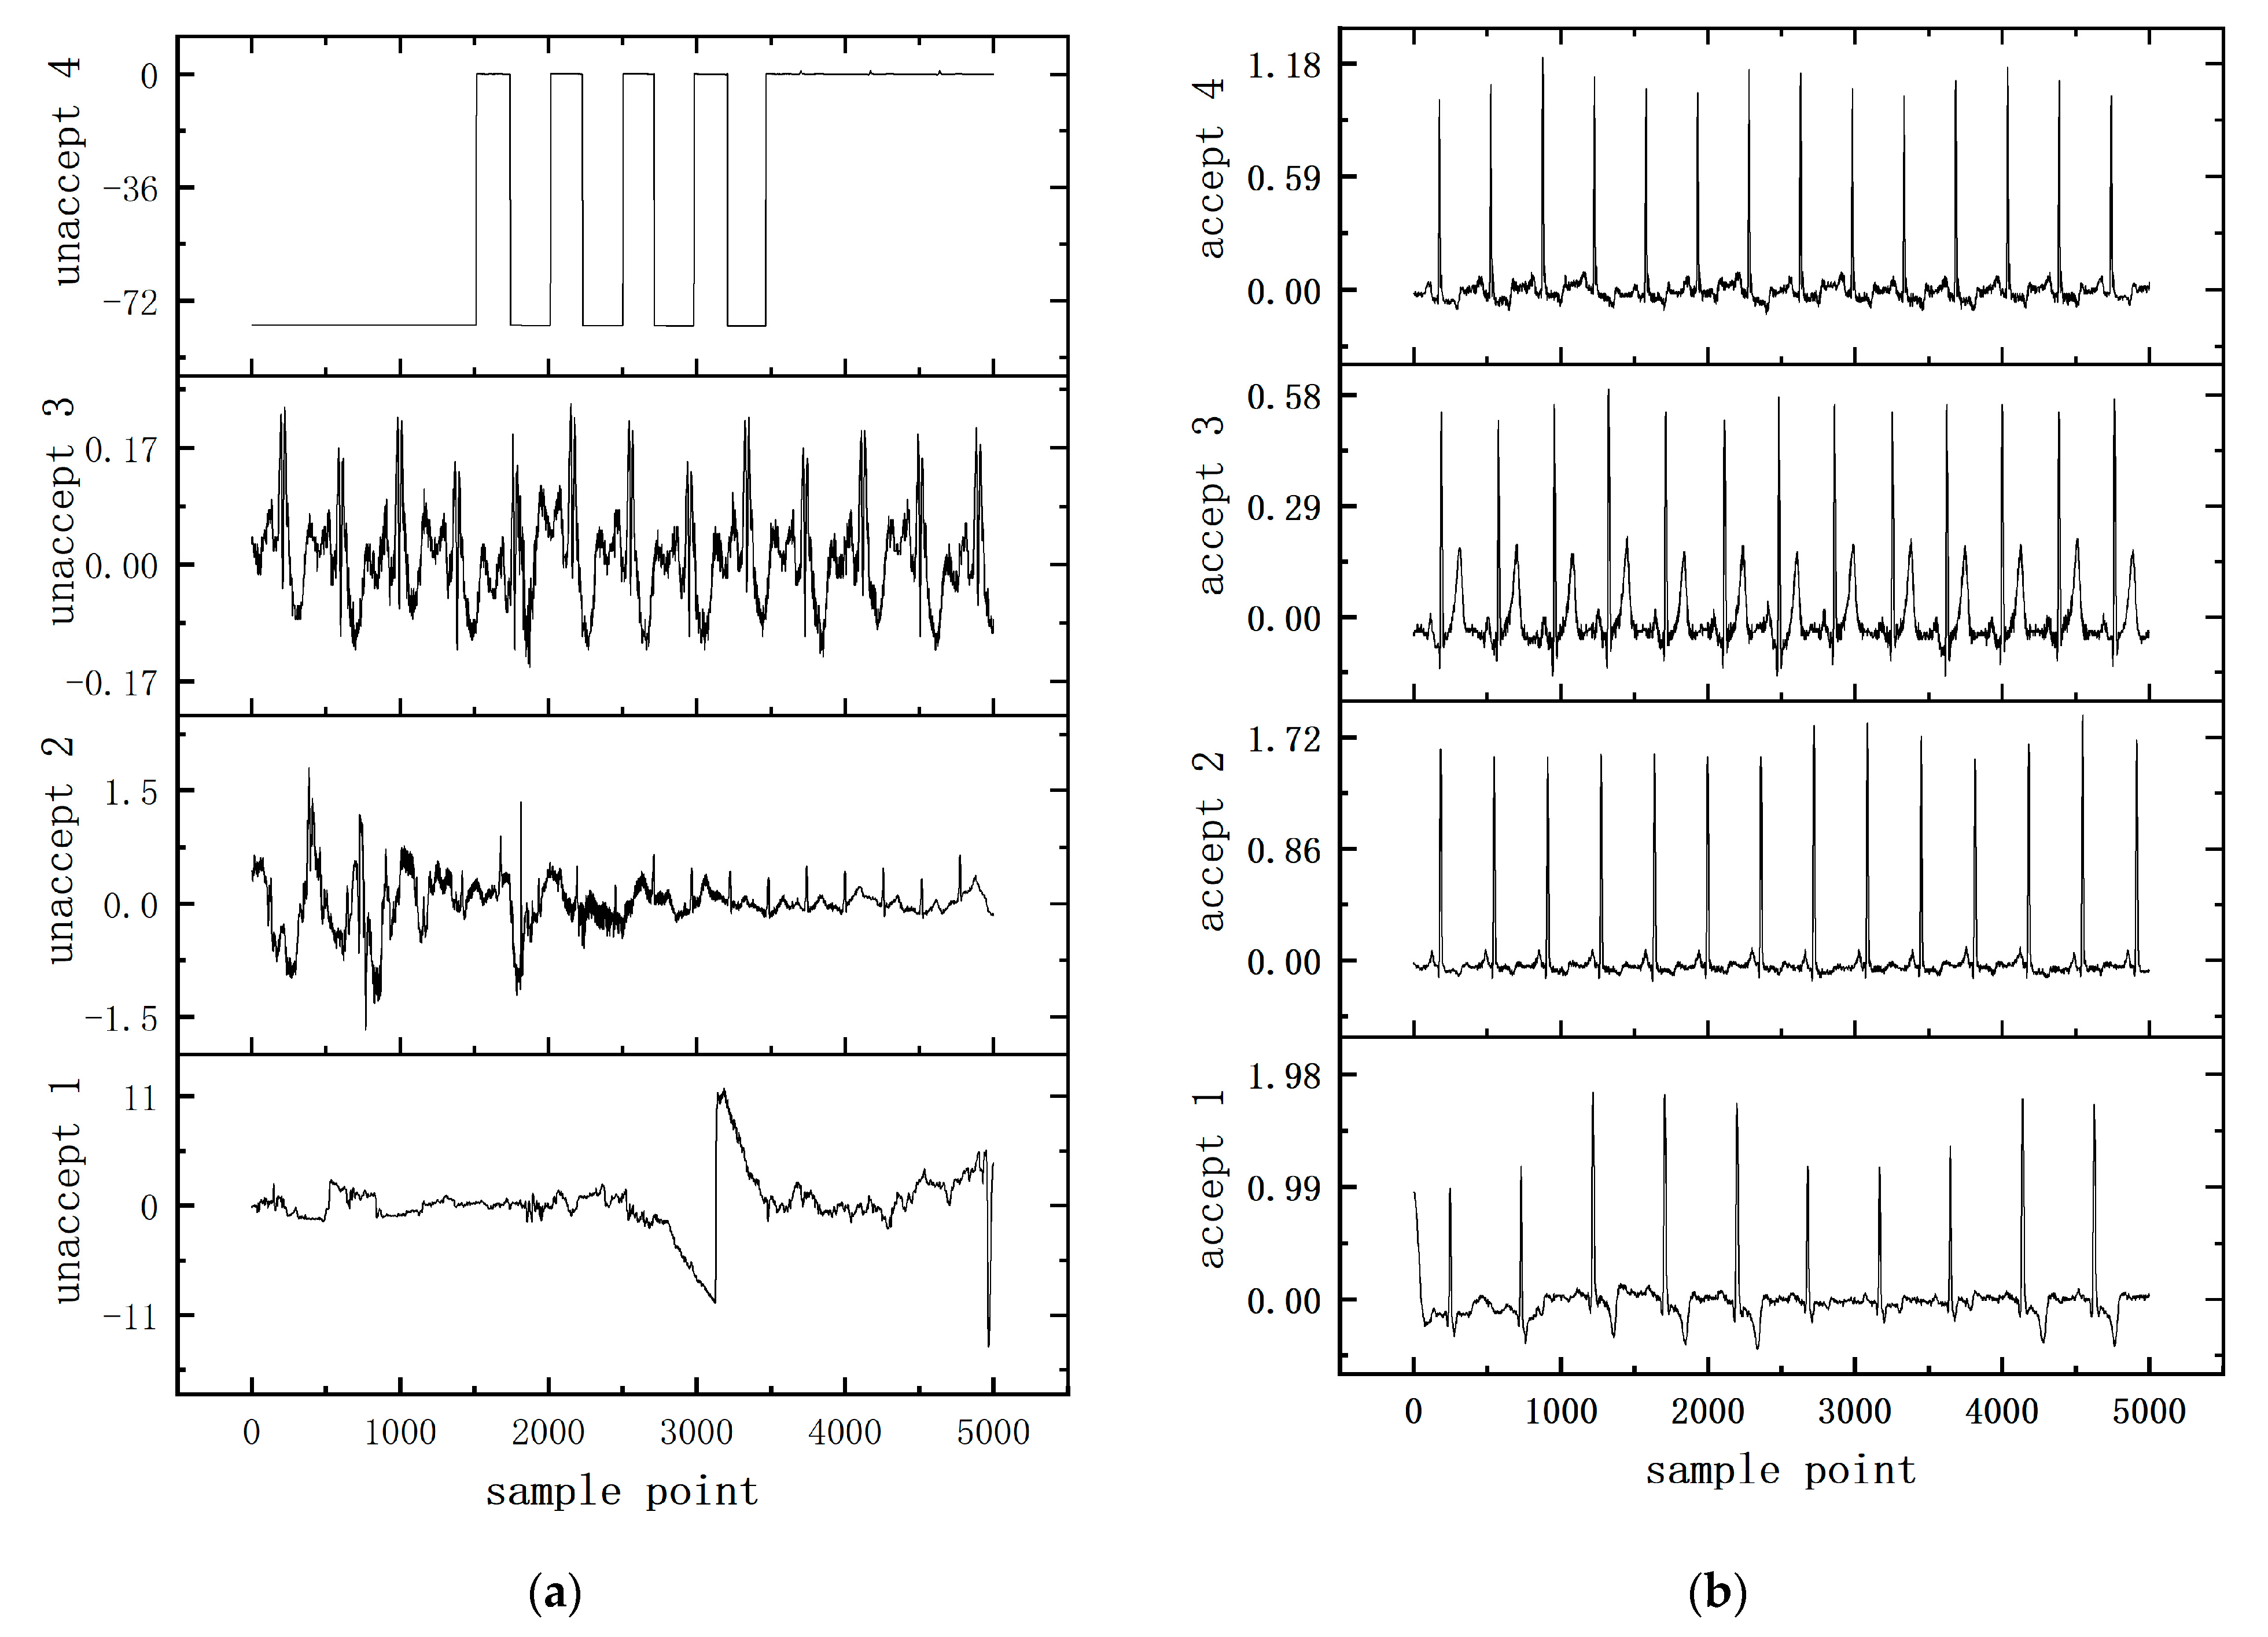
Considering that the correlation between individual heartbeats within a regular ECG segment can be used as an auxiliary judgment condition for ECG signal quality assessment, we designed a self-attention module based on the non-local idea for obtaining the dependencies between heartbeats within an ECG segment [46]. As can be seen in Figure 2, there is a clear difference between regular heartbeats and heartbeats with noise interference. Among them, there are obvious similar features between individual heartbeats within the ideal heartbeat fragment. Therefore, the attention module designed in this paper obtains the dependence information between heartbeats within a fragment by calculating the pairwise similarity relationship between channels to obtain the attention graph and then aggregating all features by weighting them to obtain the remote dependence information between channels. For regular ECG signals, there are obvious similarity features between each heartbeat, while, for random noisy signals, these similarity features are not obvious. Examples of unacceptable and acceptable samples are shown in Figure 2.
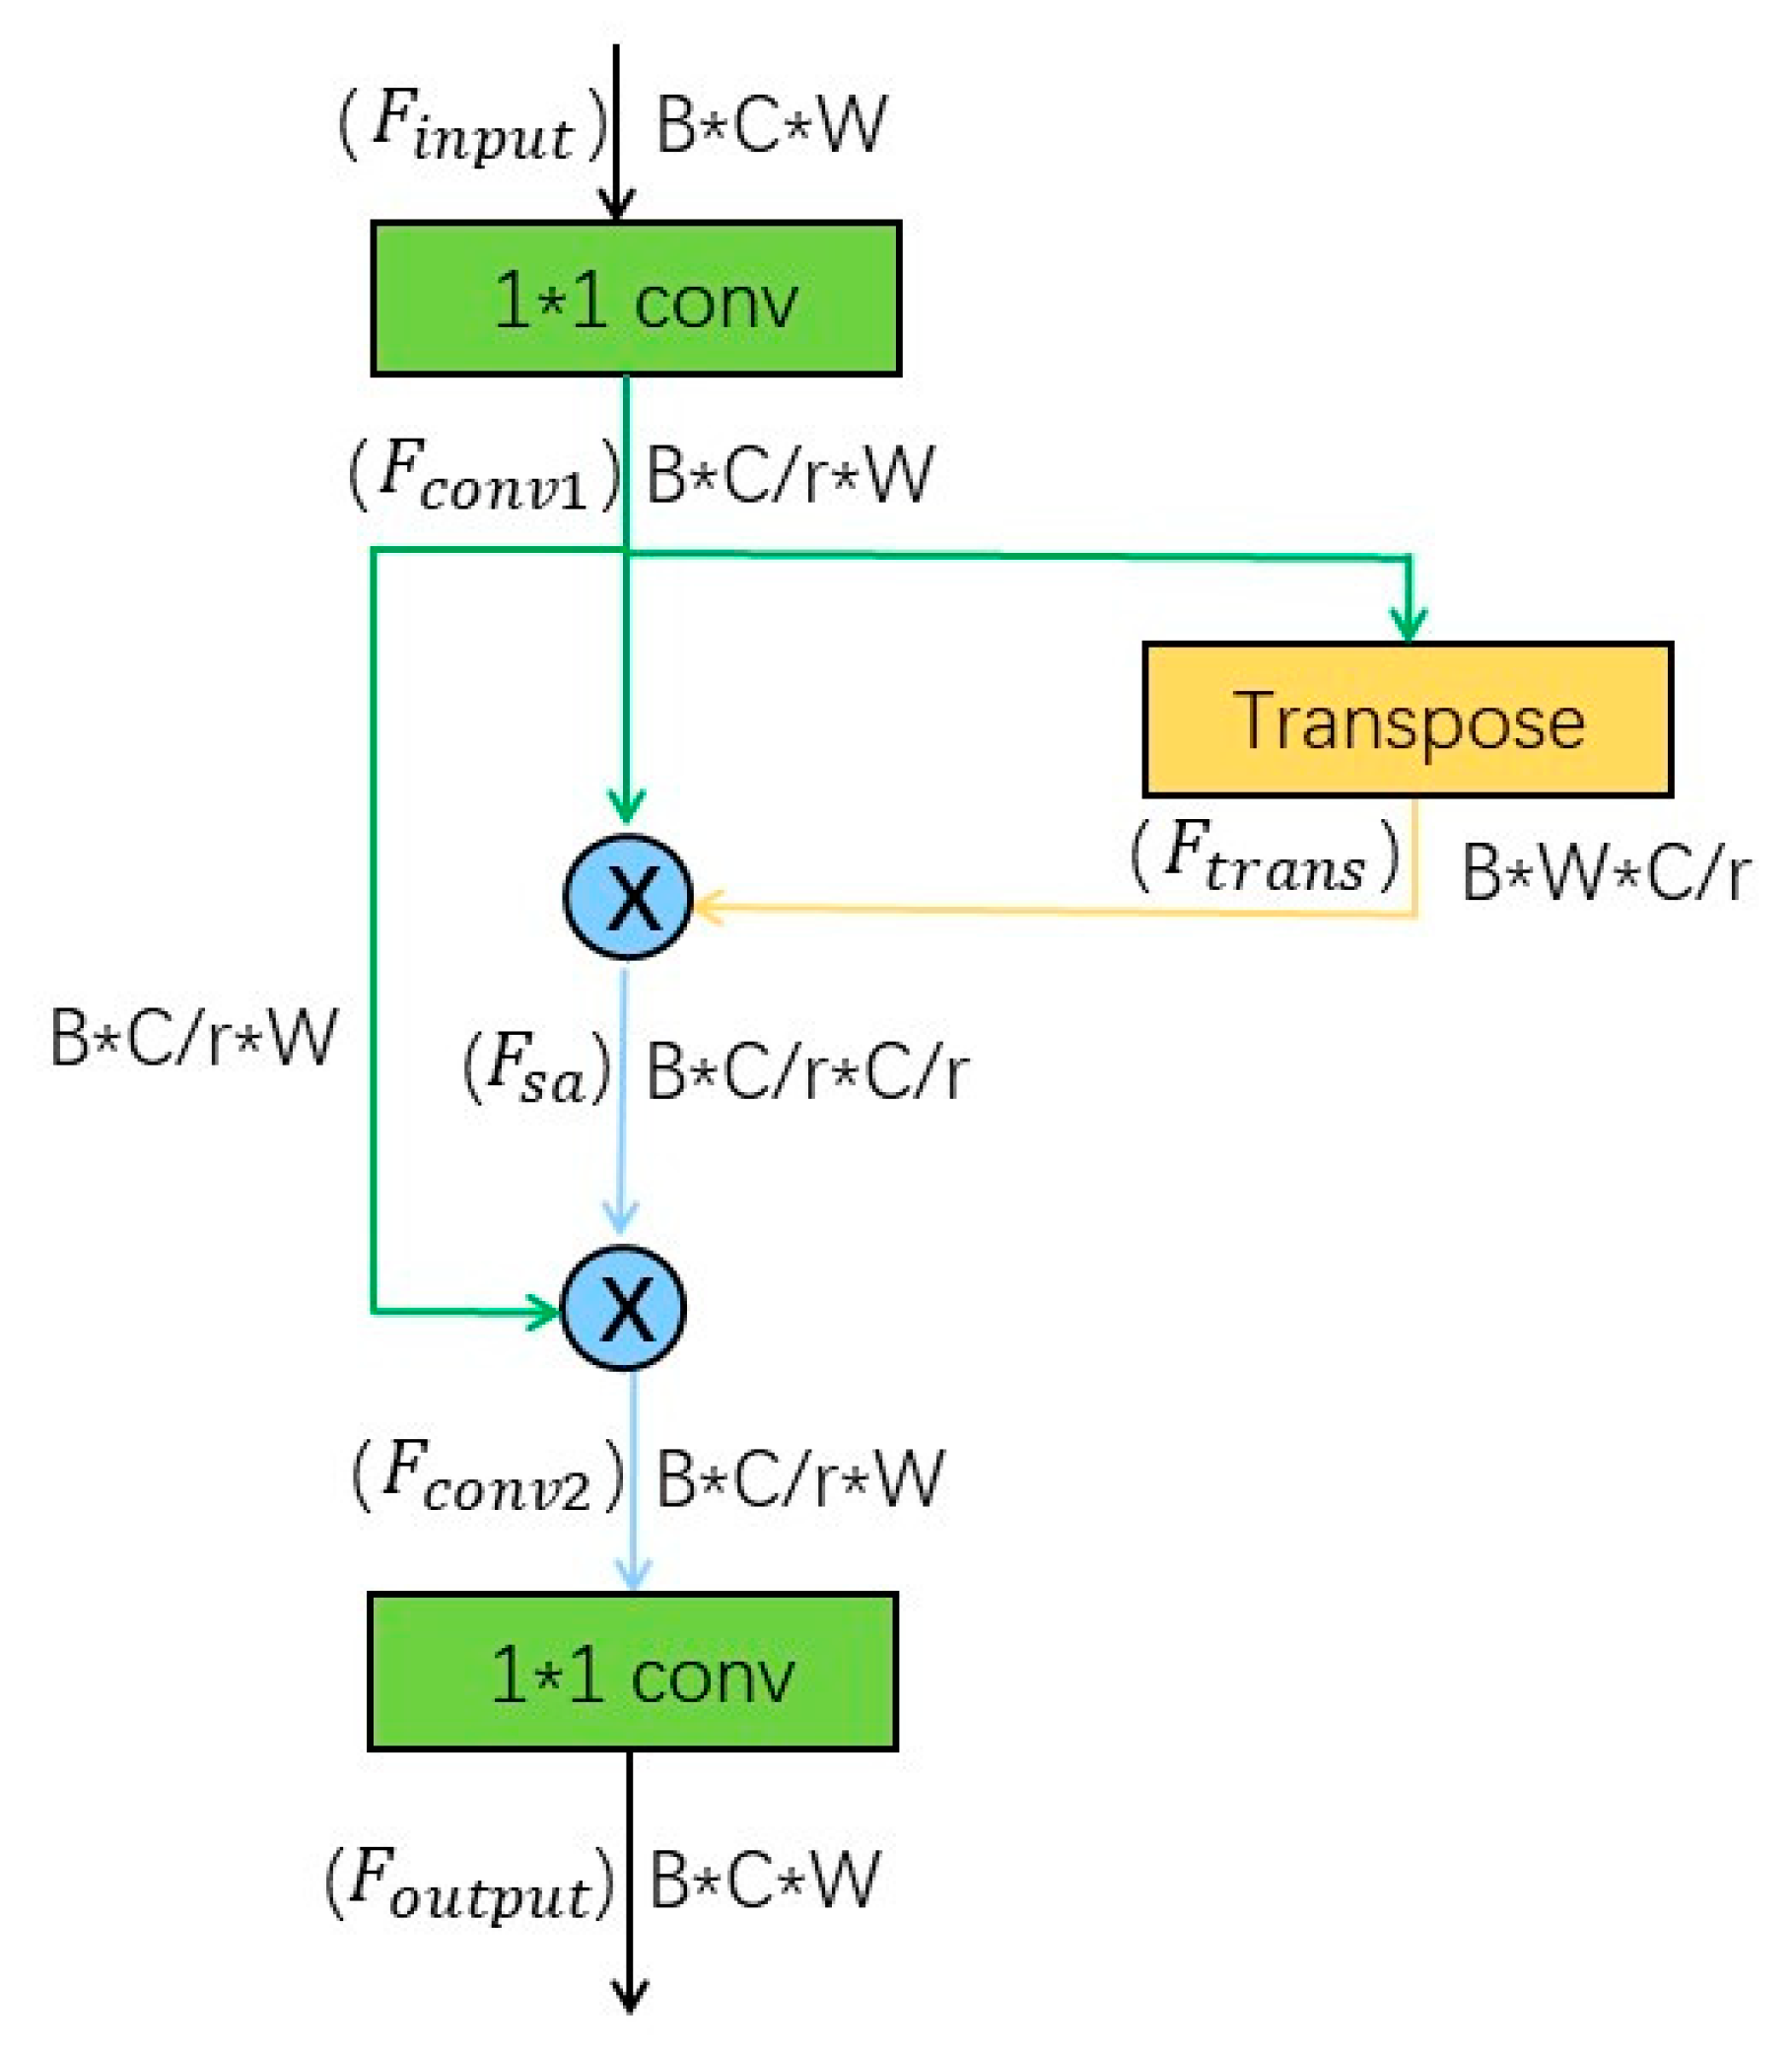
Figure 3 illustrates the structure of this self-attention module. Suppose the input feature F i n p u t dimension is BxCxW , the feature map is reduced to 1 / r of the original number of channels by a 1 × 1 convolution to obtain a matrix F c o n v 1 . The convolved data is transposed to obtain F t r a n s , the attention matrix F s a (inter-channel feature similarity matrix) is obtained after the dot product operation, and then the attention matrix is multiplied with F c o n v 1 to obtain the feature F c o n v 2 (with the same dimension as F c o n v 1 ) with self-attention information. Finally, a 1 × 1 convolution module is employed to obtain the output data F o u t p u t with the same dimension as the input data. Therefore, this module can be added to the structure of most deep networks as a flexible attention module.
Equations (6)–(9) show the computational principle of the self-attention module. x represents the feature matrix of the input self-attention module, W z and W g can here be considered as a convolution operation to change the number of data channels, and f ( x i , x j ) represents the dot product operation to obtain the self-attention matrix. We set the normalization factor as C ( x ) = N , where N is the number of positions in x .
z i = W z y i
y i = 1 C ( x ) j f ( x i , x j ) g ( x j )
g ( x j ) = W g x j
f ( x i , x j ) = θ ( x i ) T φ ( x j )

3.3. Comparison of Parameters and Calculations of Attention Modules

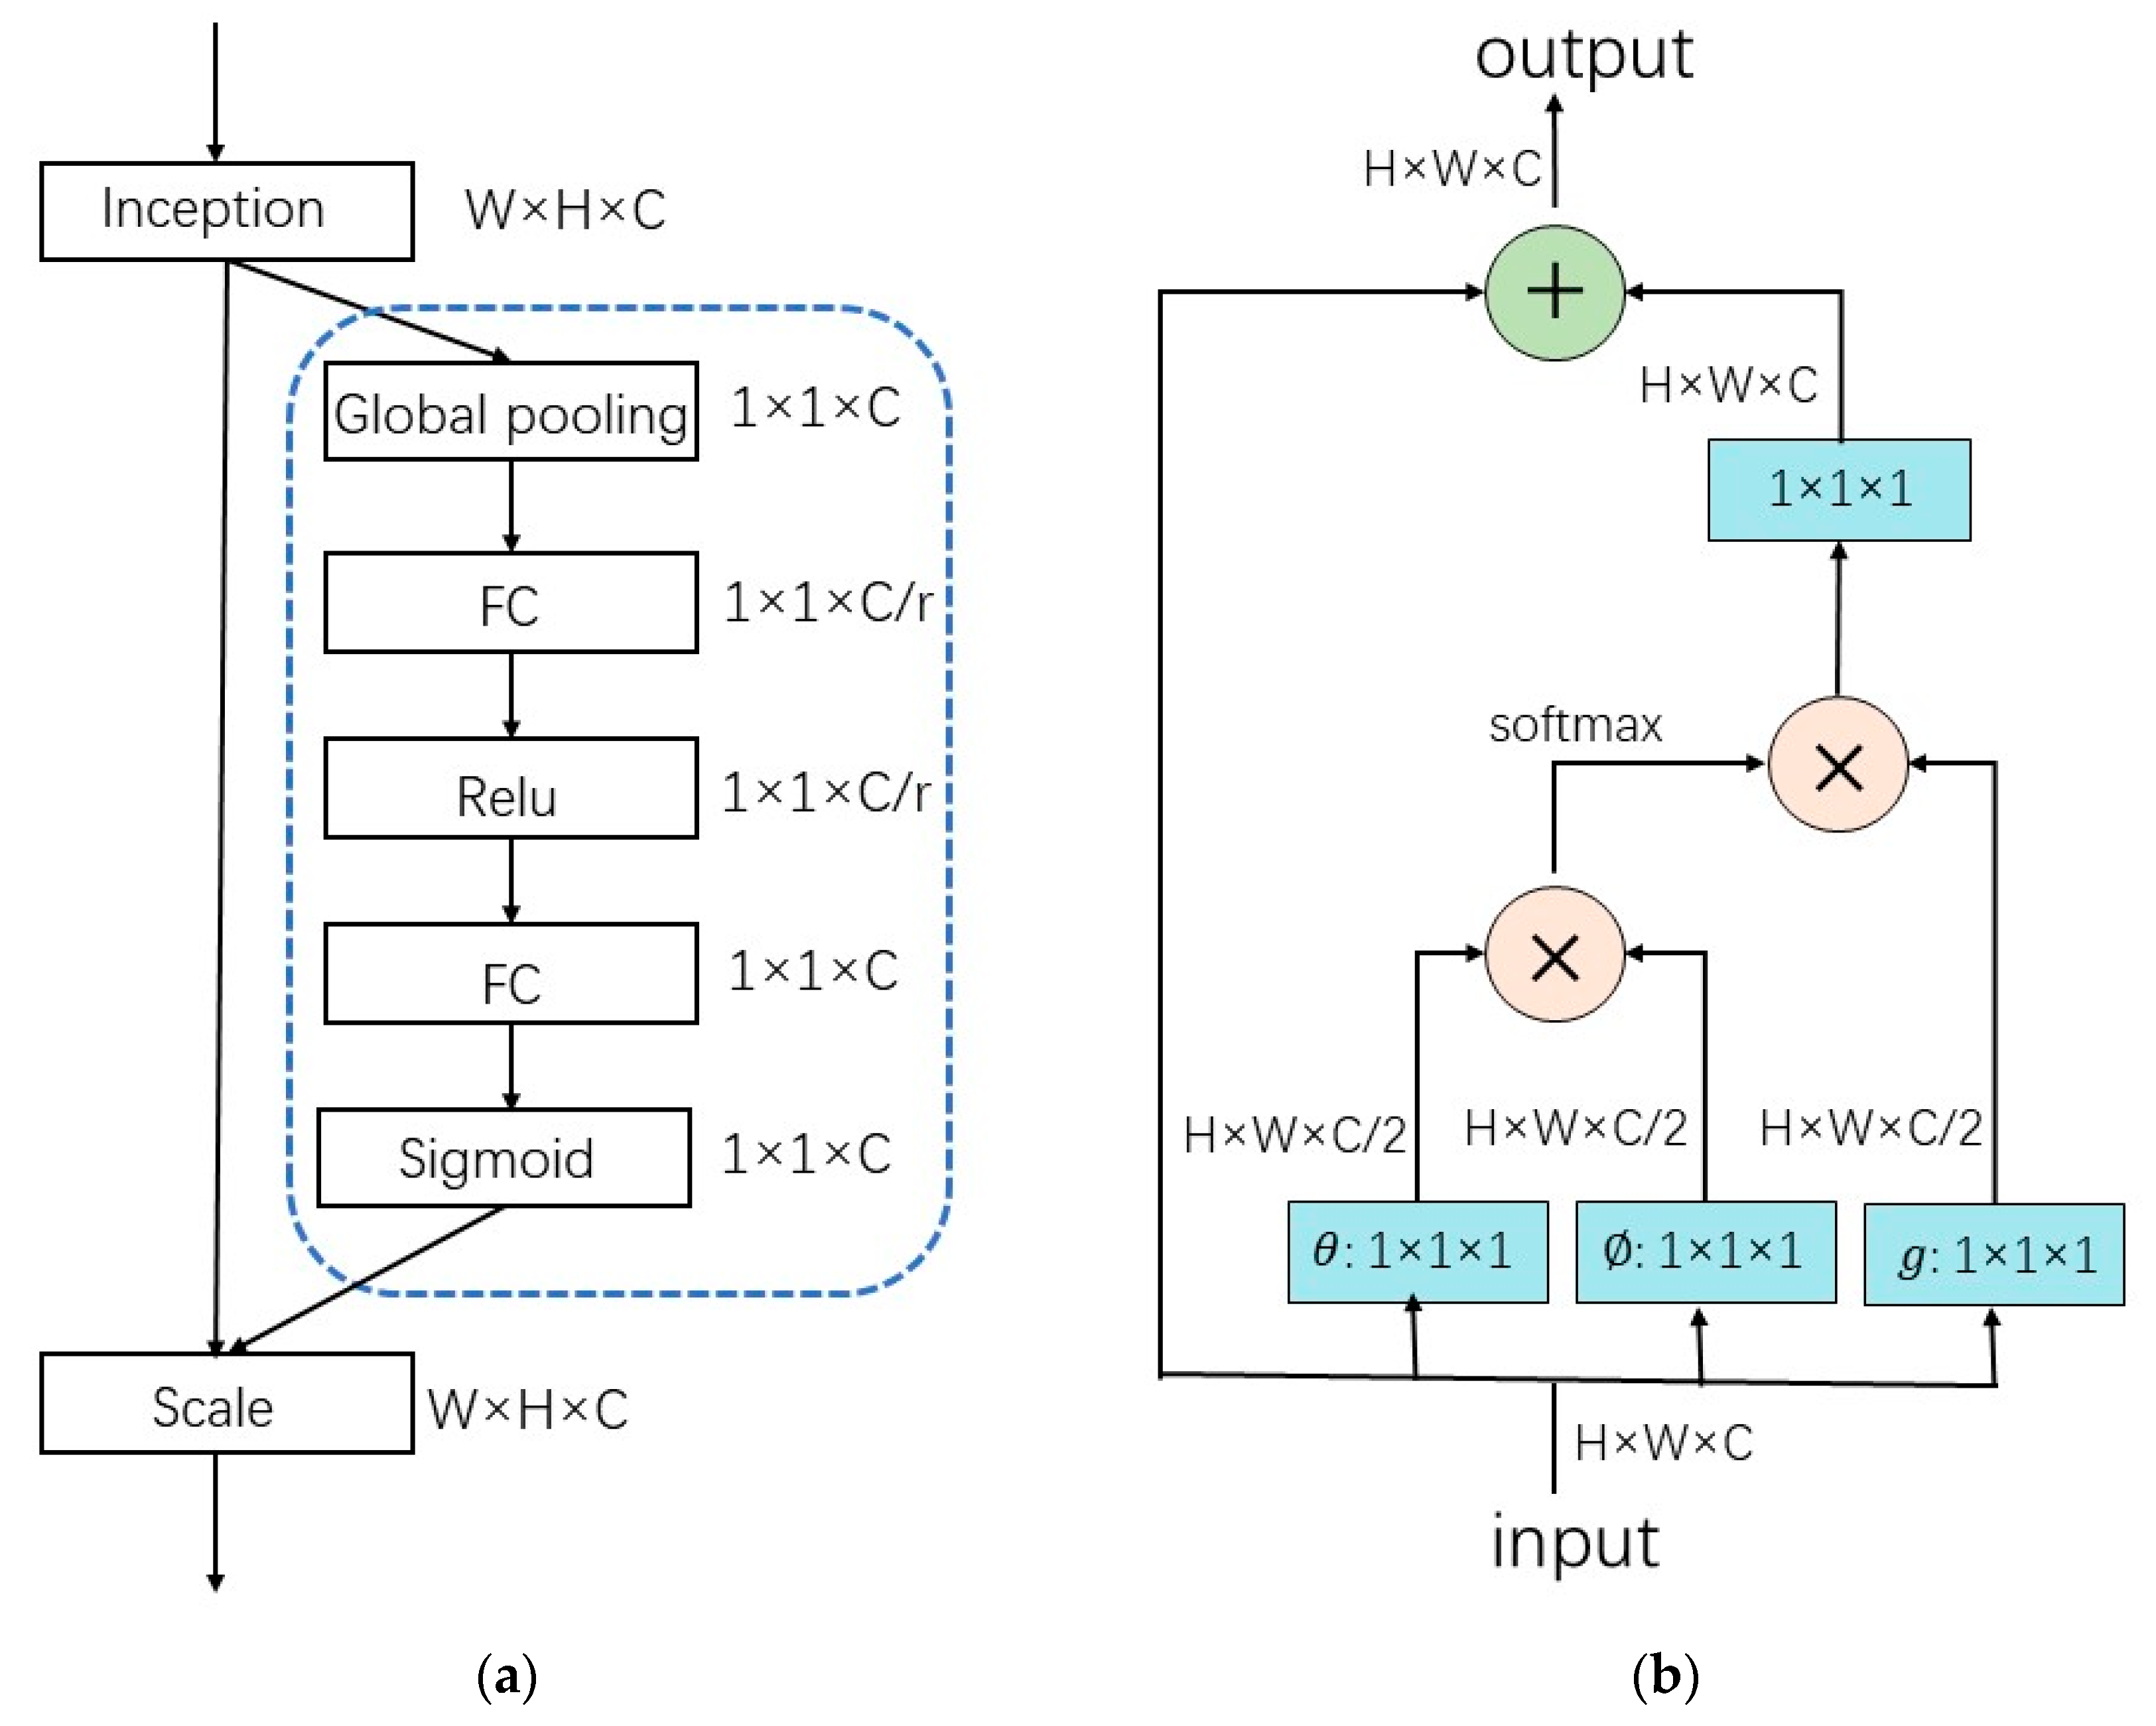
In this subsection, we compare the proposed self-attention module with two typical attention modules in terms of parameter amount and calculation amount. One of them is the squeeze and exception network (SE-Net), which refers to the attention mechanism added on the channel dimension [47]. The key operations are "squeeze” and “exception”. Figure 4a shows the module structure of SE-Net. Compared with using one full connection layer directly, using two full connection layers in the citation operation introduces more computation and parameter quantities. The other module is the non-local attention mechanism, which uses the information of the surrounding points when extracting a feature. The “surrounding” can be either temporal or spatial. The non-local module can be used as a component to complete video classification, image segmentation, target detection, and other tasks together with other network results, and the effect is good. In this design, when extracting a heartbeat feature, we also use other heartbeat information around it as auxiliary judgment information, so we follow the idea of the non-local module to optimize and design a self-attention module.
The proposed self-attention module only needs to perform one convolution operation at the input side in comparison to the non-local model, which decreases the computation and number of parameters of the attention module as well as the number of convolution operations. The computation and number of parameters for the proposed self-attention module, SE block module, and non-local module are compared in Table 2. As can be seen, the suggested self-attention module has the least computations and parameters, allowing the attention module to minimize the introduction of computations and parameters to the overall network. It is more suitable for training lightweight network models for deployment into mobile embedded devices.

4. Results

In this part, we will evaluate the performance of the network model proposed in this paper on the PhysioNet/Computing in Cardiology Challenge 2011 dataset [48]. To evaluate the performance of the SA-Resnet18 network designed in this paper, we conducted a group of comparative experiments. The network models with attention modules and without attention modules are trained, respectively, and the model indices are compared. At the same time, the performance of the model with the attention module is compared with other existing ECG signal quality evaluation models.

4.1. Datasets

This study used the PhysioNet/Computing in Cardiology Challenge 2011 dataset from the Research Resource for Complex Physiologic Signals (PhysioNet) platform. Each record is a standard 10s ECG segment with a sampling frequency of 500 Hz and a resolution of 16bit. Since the original dataset is a standard 12-lead ECG signal, and this experiment investigates the quality assessment of single-lead ECG signals, only single-lead (V6) ECGs were extracted from the original dataset to form the dataset for this experiment. Each record was given a label that read “accepted” or “unaccepted.” The total amount of valid sample data following data screening was 863, which was utilized for the final model training and performance assessment. This is because some of the initial labels were unsatisfactory for reasons unrelated to V6. Thus, 706 of them were given the “accepted” label, while 157 were given the “unaccepted” label. Table 3 shows the composition of the dataset used in this experiment. The dataset was divided in the ratio of 8:2, and 80% were randomly selected as the training dataset and the remaining 20% as the test dataset.

4.2. Data Preprocessing

Since the self-attention module needs to obtain correlation information between individual heartbeats within ECG segments, we split the continuous 10 s ECG recordings into some independent heartbeats, and the reference point of the split is the R point of each heartbeat. Since the dataset used in this experiment does not have official R-point marking information, we optimize and improve the PT algorithm [49] to find out each R-point within the ECG fragment as accurately as possible.
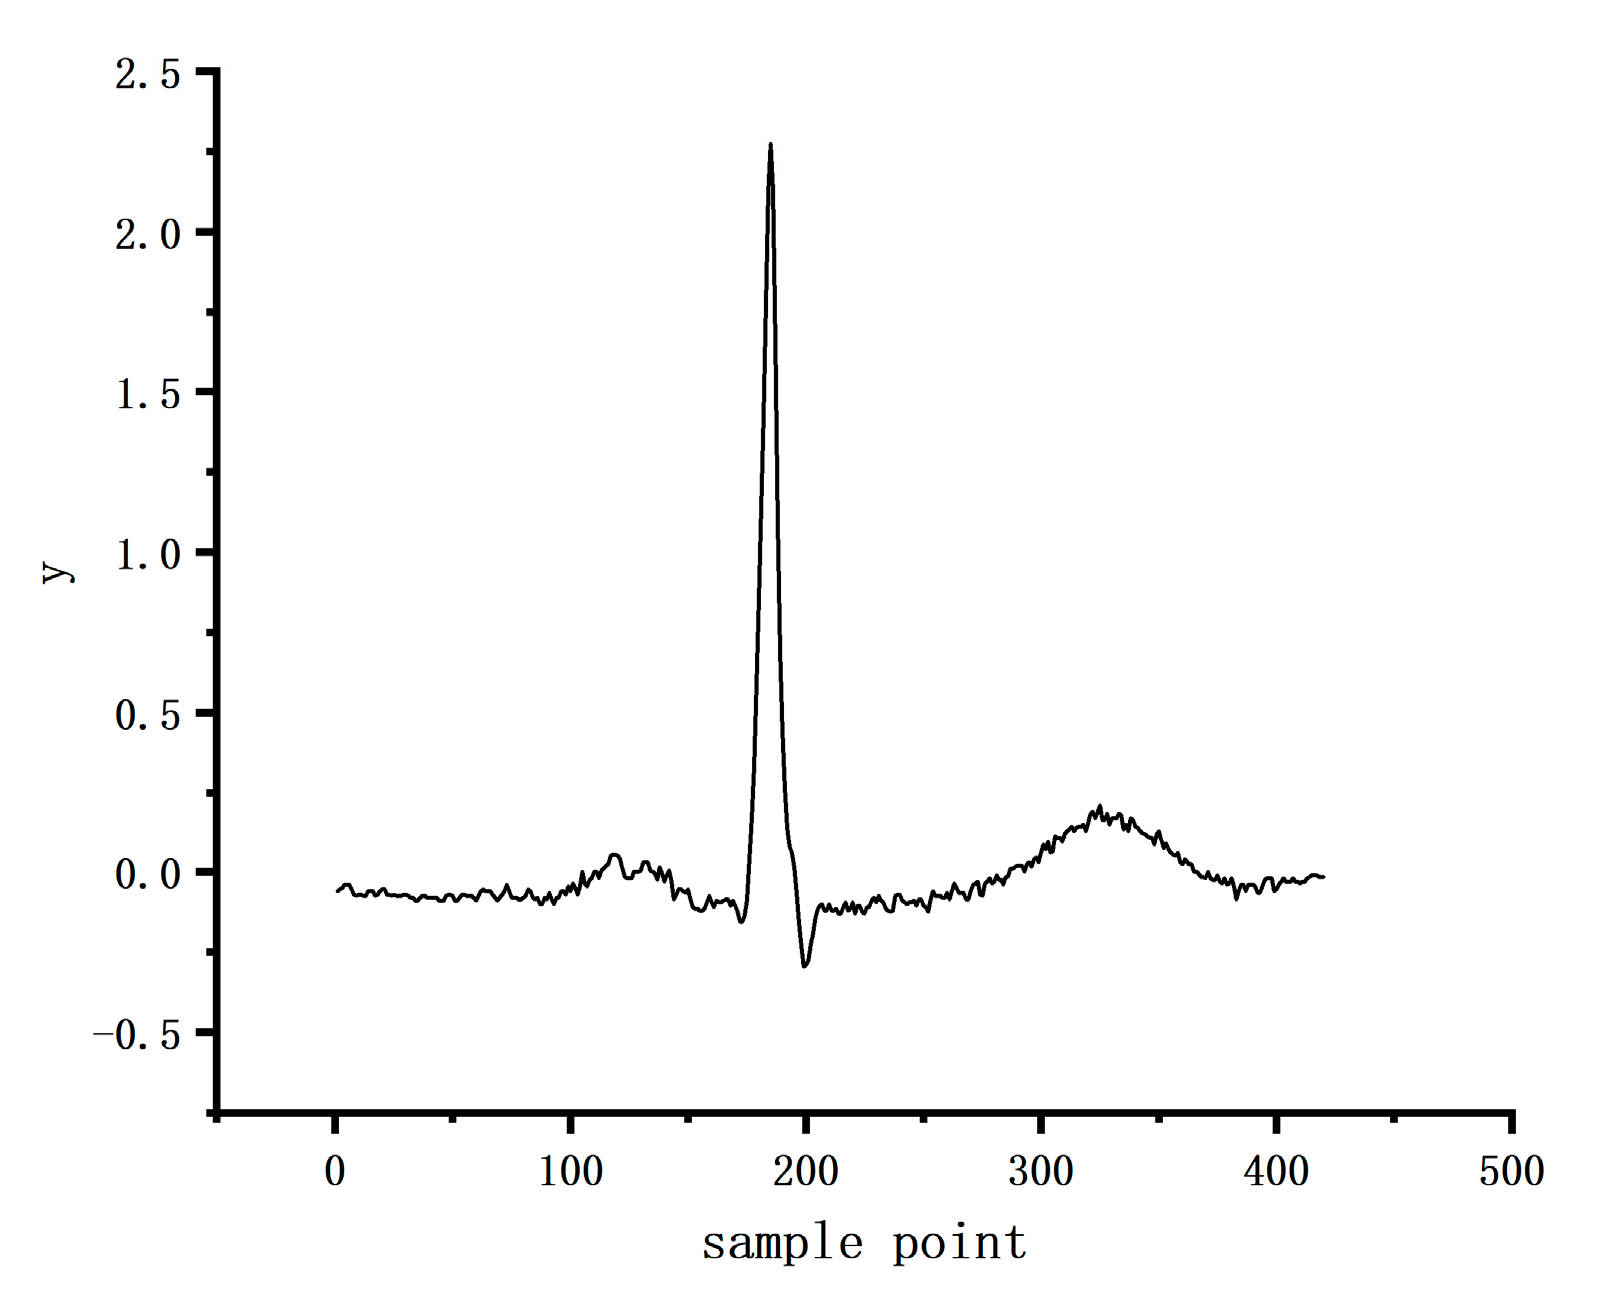
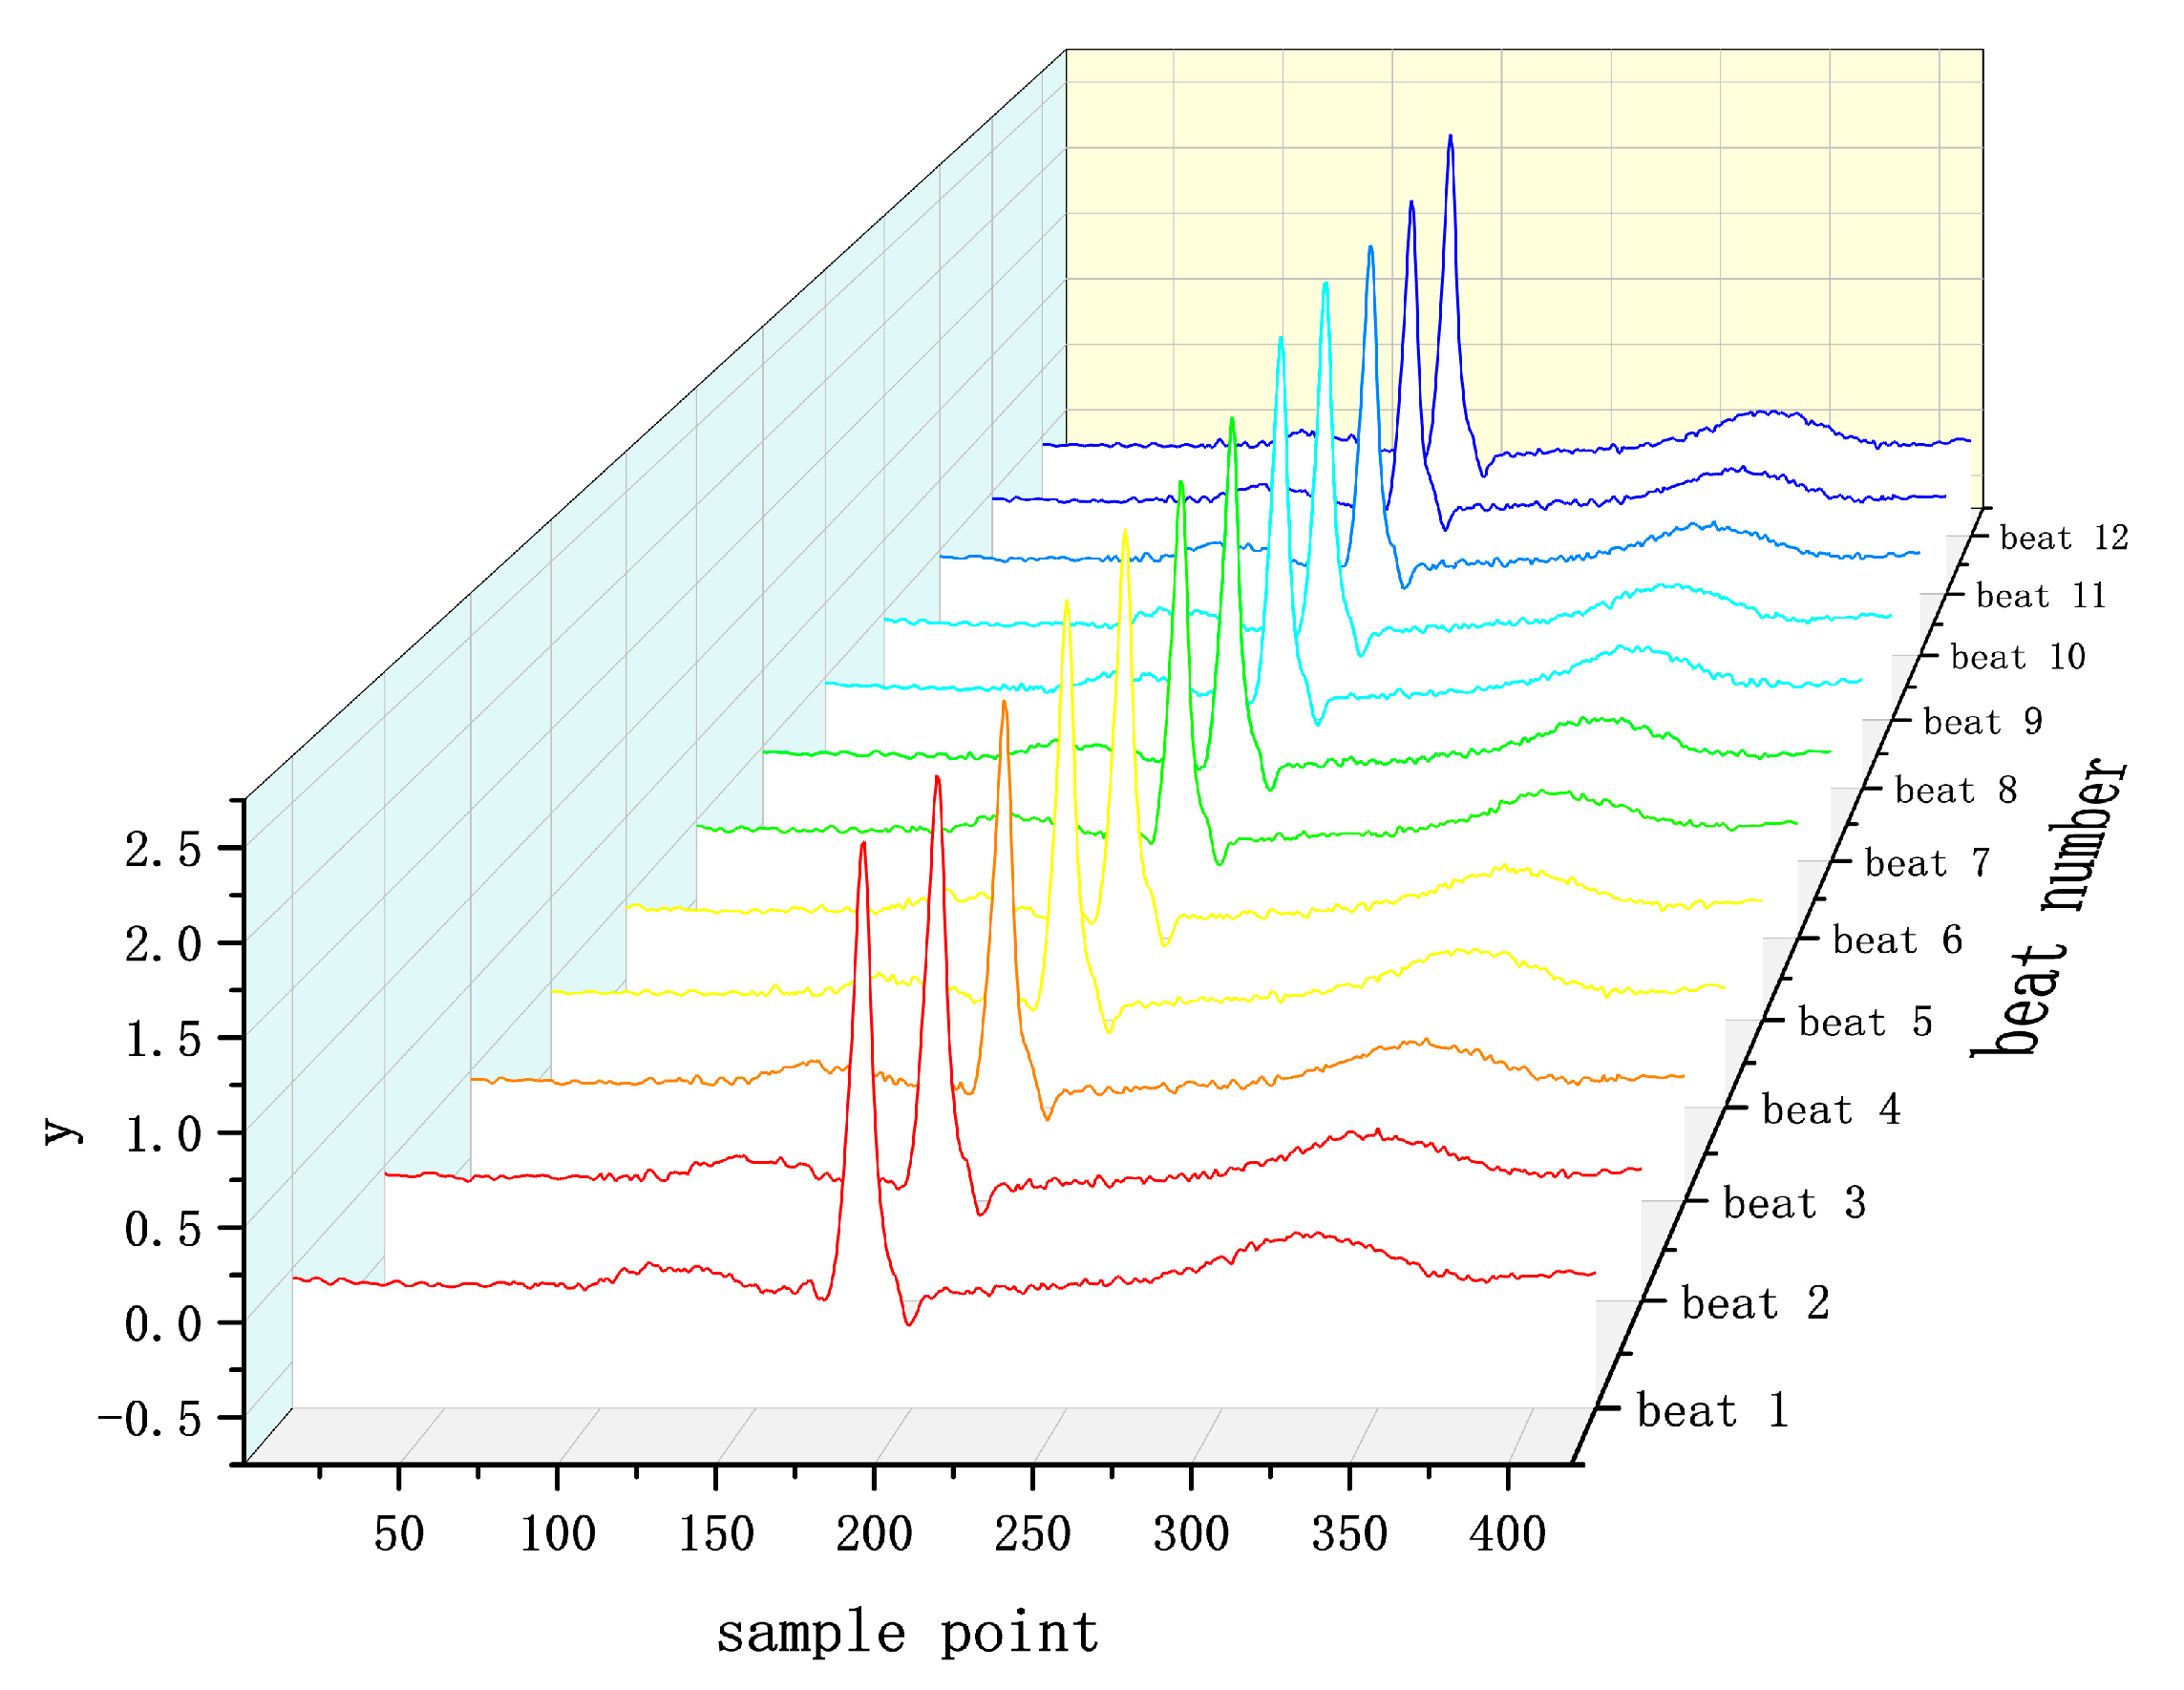
In this experiment, a single-lead (V6) ECG signal was used, and the similarity characteristics between individual heartbeats within the ECG segments were used as auxiliary judgment information to segment each 10s ECG segment into 12 individual heartbeats with the help of the analysis principle of multichannel ECG signals. The schematic diagram of individual heartbeats is shown in Figure 5, taking the sampling point 0.37 s before the R point, and the sampling point 0.47 s after the R point. Data fragments that do not satisfy the 12 heartbeats are followed by zeroes, and for more than 12 heartbeats, the extra heartbeats are discarded. The R points of the 12 QRS heartbeats are aligned, and the final data form is shown in Figure 6. The data dimension is B × 12 × 420 × 1 (Batch * Channel * Long * Width), which is input into the deep neural network to extract the features of each heartbeat and combine with the heartbeat similarity to evaluate the quality of this fragment of ECG signal.

4.3. Experiment

In this experiment, we first train a network model without the attention mechanism by batch-inputting 80% of the randomly chosen training set into the neural network model without the self-attention module, with the batch size set to 16. Following the introduction of the attention module, a different network model is trained, and its performance metrics are compared.
As shown in Table 4, the results tested on the Cinc2011 database show that the addition of the self-attention module improves the accuracy of the model by 1.39, recall by 0.85, specificity by 7.64, precision by 1.41, and F1-score by 1.14. The results indicate that, compared to the original Resnet18 structure, the addition of the self-attention module can further improve the signal quality evaluation performance of the network.
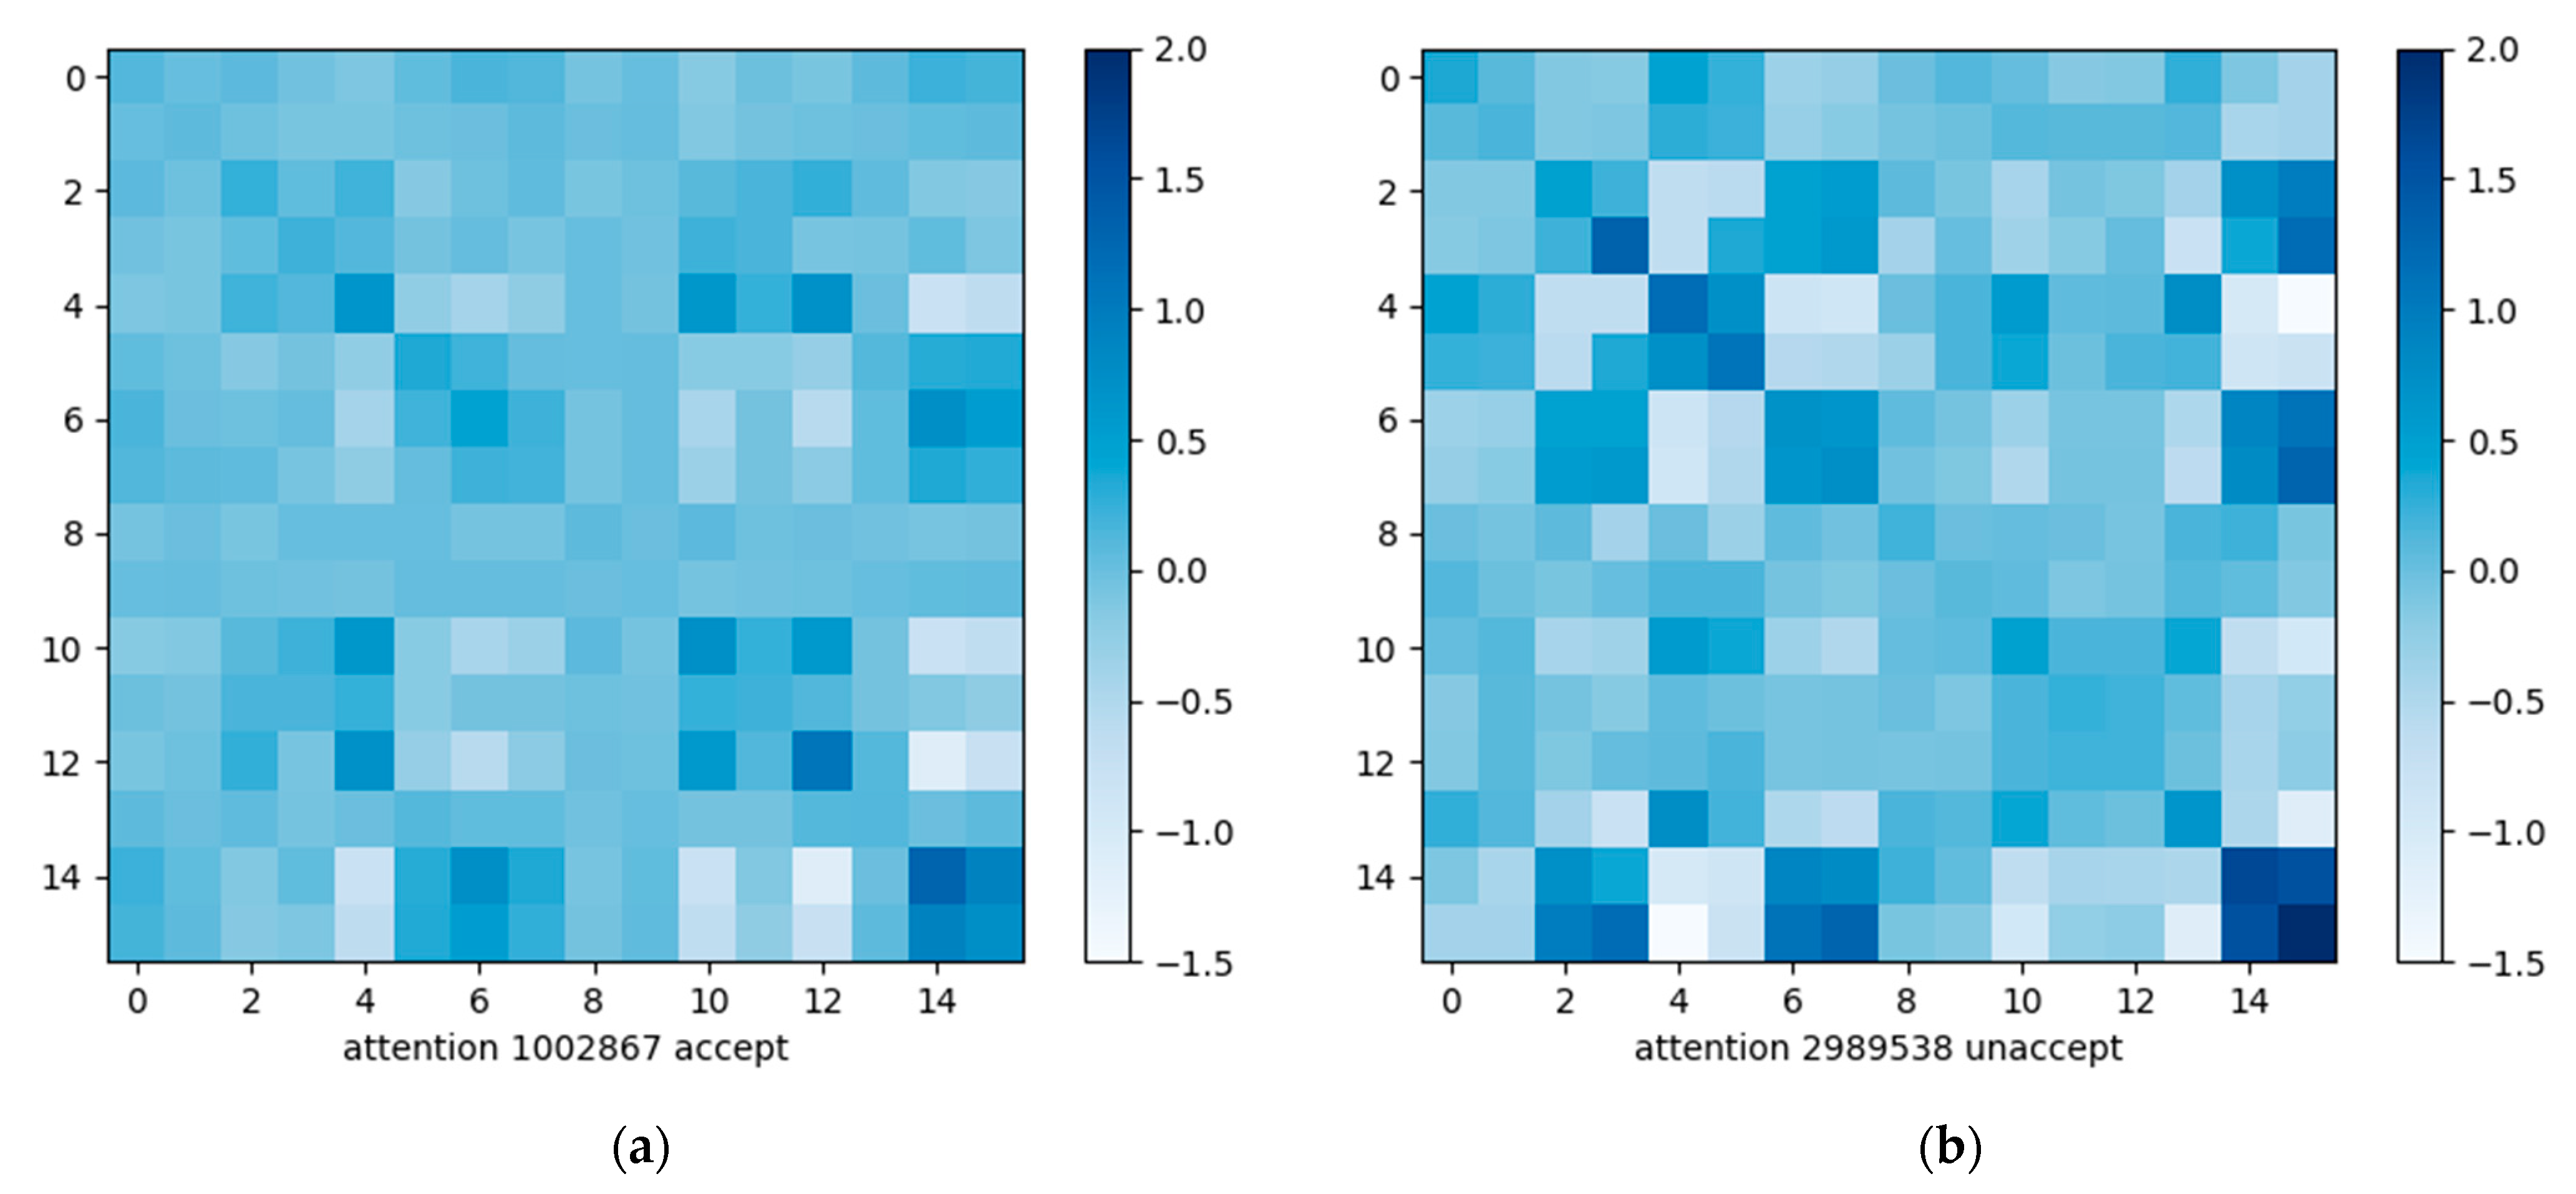
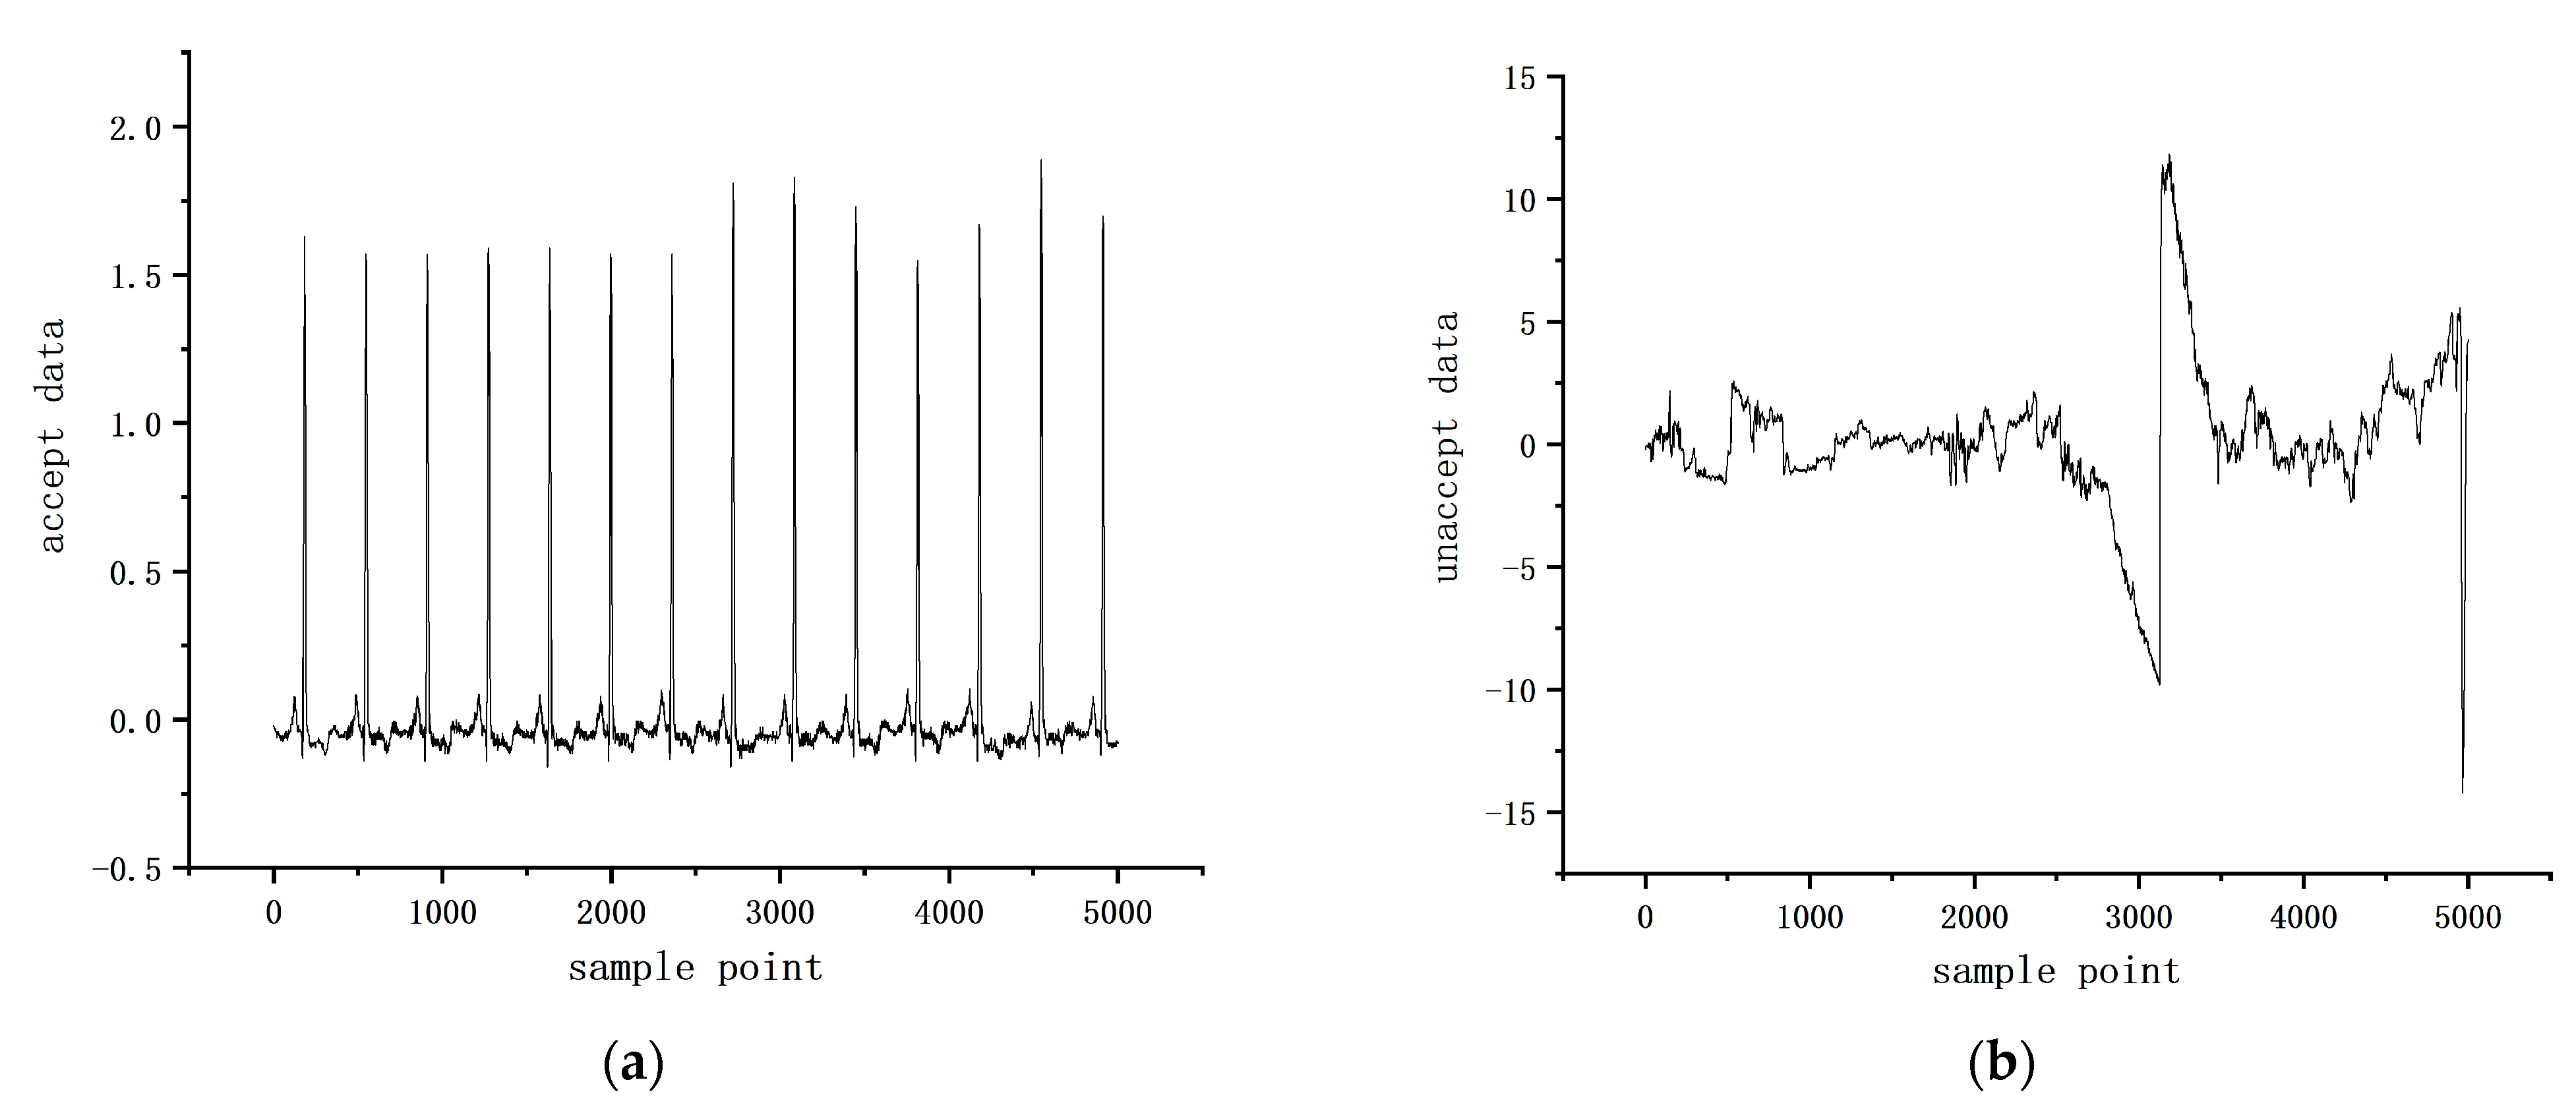
The attention matrix of the acceptable sample and the attention matrix of the unacceptable sample are shown in Figure 7 below, corresponding to the attention matrices of the two samples shown in Figure 8, respectively, and it can be seen that there is a clear difference between them.

5. Discussion

With the gradual improvement of intelligent medical systems, improving the accuracy of automated analysis techniques of physiological signals and reducing the complexity of models have become the main directions of current research. In this paper, considering the sudden and fatal nature of cardiovascular diseases, we design an automated ECG signal quality assessment method to screen out valid ECG signals for subsequent early screening of abnormal ECG signals and to improve the efficiency of healthcare workers. The method is designed based on a modified Resnet and combined with a self-attentive module we designed in this paper. The design of this model not only avoids a lot of feature engineering design work caused by using traditional machine learning, but also avoids the problem of model performance degradation caused by a too-deep network model. Based on this, an attention mechanism is introduced to improve the accuracy of model prediction by paying more attention to the similarity information between individual heartbeats within the fragment when performing the prediction task. Moreover, the experimental results show that the attention module designed in this paper is more suitable for lightweight model design, which provides a new idea for the research of lightweight deep learning networks.
Here, we compare the results of SA-Resnet18 with those of other works in recent years to evaluate the performance level of SA-Resnet18 in the area of ECG signal quality assessment. According to the data in Table 5, the SA-Resnet18 performs comparatively better when the combined accuracy and F1-score performance measures are taken into account. In terms of experimental methods, the SA-Resnet18 model is similar to [23] in that both do not require manual feature engineering; however, the SA-Resnet18 model has higher accuracy compared to [23], while the design of the SA-Resnet18 model verifies that the combination of these two network structures can show good performance in ECG signal quality assessment. In terms of the number of leads of experimental data, we use single-channel experimental data for model training and testing, which is more suitable for deployment on the mobile wearable health monitoring device side. This is because the acquisition and storage of single-lead data are more suitable for wearable health monitoring devices compared to 12-lead data.
However, a signal quality evaluation model has to be employed for numerous users of different genders and ages in the early morning, taking into account the variability of ECG signals among various persons. In the future, we plan to apply the concept of transfer learning to enhance the model’s portability and robustness while maintaining patient privacy, which will further enhance the generalization capabilities of the model. Additionally, it is difficult to describe precisely which network phases or elements result in the final classification findings for the deep learning models we employ. Hence, we also need to work on the interpretability of the model.

6. Conclusions

Deep learning has successfully automated the classification and diagnosis of multi-channel ECG signals. However, there are still some problematic issues, such as high annotation costs, high memory requirements, and computational resource requirements during the training process. Additionally, it is very challenging to detect multi-channel signals, especially 12-channel signals, using mobile-embedded health detection devices. On the contrary, single-channel signals and single-channel ECG signals are relatively easy to detect. However, in remote locations, particularly in remote mountainous regions where medical knowledge is scarce, it is desirable to record valid ECG signals from patients which are helpful for subsequent ECG diagnosis and increase the effectiveness of medical specialists; theoretically, health detection devices can reduce abnormal alarms and automatically screen valuable ECG signals for the subsequent diagnosis of heart health conditions. To address the aforementioned requirements, we propose a self-attention module. Furthermore, the Resnet18 structure is optimized and enhanced to adapt to one-dimensional ECG signal analysis. The similarity principle of heartbeats within ECG recording segments is used as auxiliary judgment information to obtain correlation information and improve the performance of the signal quality assessment of the model. The experiment results also demonstrate that SA-Resnet performs well when evaluating the quality of 1D ECG data in single leads. In addition to making up for the lack of research on residual networks in the area of ECG signal analysis, it also develops a lightweight attention model that enhances network signal quality evaluation performance without adding a lot of computation or parametric variables.

Author Contributions

Conceptualization, Y.L. and H.Z.; methodology, Y.L. and K.Z.; software, Y.L.; validation, Y.L. and Y.Y.; formal analysis, Y.L.; investigation, Y.L. and F.L.; resources, H.Z. and K.Z.; data curation, Y.L. and L.C.; writing—original draft preparation, Y.L.; writing—review and editing, Y.L., H.Z. and H.L.; visualization, Y.L.; supervision, H.Z.; project administration, Y.L.; funding acquisition, H.Z. All authors have read and agreed to the published version of the manuscript.

Funding

This work was supported by the National Key R&D Program of China (2020YFC2003304).

Institutional Review Board Statement

Not applicable.

Informed Consent Statement

Informed consent was obtained from all subjects involved in the study.

Data Availability Statement

Publicly available datasets were analyzed in this study. This data can be found here: https://www.physionet.org/content/challenge-2011/1.0.0/ (accessed on 19 September 2022).

Conflicts of Interest

The authors declare no conflict of interest.

References

  1. Cardiovascular Diseases. Available online: https://www.who.int/news-room/fact-sheets/detail/cardiovascular-diseases-(cvds) (accessed on 8 October 2022).
  2. Mendis, S.; Puska, P.; Norrving, B.; World Health Organization. Global Atlas on Cardiovascular Disease Prevention and Control; World Health Organization: Geneva, Switzerland, 2011. [Google Scholar]
  3. Kumar, P.; Sharma, V.K. Cardiac Signals Based Methods For Recognizing Heart Disease: A Review. In Proceedings of the 2021 Third International Conference on Intelligent Communication Technologies and Virtual Mobile Networks (ICICV), Tirunelveli, India, 4–6 February 2021; pp. 1375–1377. [Google Scholar]
  4. Islam, M.R.; Ahmad, S.; Hirose, K.; Molla, M.K.I. Data adaptive analysis of ECG signals for cardiovascular disease diagnosis. In Proceedings of the 2010 IEEE International Symposium on Circuits and Systems, Paris, France, 30 May–2 June 2010; pp. 2243–2246. [Google Scholar]
  5. Isin, A.; Ozdalili, S. Cardiac arrhythmia detection using deep learning. Procedia Comput. Sci. 2017, 120, 268–275. [Google Scholar] [CrossRef]
  6. Hao, P.; Gao, X.; Li, Z.; Zhang, J.; Wu, F.; Bai, C. Multi-branch fusion network for Myocardial infarction screening from 12-lead ECG images. Comput. Methods Programs Biomed. 2020, 184, 105286. [Google Scholar] [CrossRef] [PubMed]
  7. Rahman, A.; Rahman, T.; Ghani, N.H.; Hossain, S.; Uddin, J. IoT Based Patient Monitoring System Using ECG Sensor. In Proceedings of the 2019 International Conference on Robotics, Electrical and Signal Processing Techniques (ICREST), Dhaka, Bangladesh, 10–12 January 2019; pp. 378–382. [Google Scholar]
  8. Lobodzinski, S.S.; Laks, M.M. New devices for very long-term ECG monitoring. Cardiol. J. 2012, 19, 210–214. [Google Scholar] [CrossRef] [PubMed]
  9. van der Bijl, K.; Elgendi, M.; Menon, C. Automatic ECG Quality Assessment Techniques: A Systematic Review. Diagnostics 2022, 12, 2578. [Google Scholar] [CrossRef]
  10. Satija, U.; Ramkumar, B.; Manikandan, M.S. Automated ECG Noise Detection and Classification System for Unsupervised Healthcare Monitoring. IEEE J. Biomed. Health Inform. 2018, 22, 722–732. [Google Scholar] [CrossRef]
  11. Cioffi, R.; Travaglioni, M.; Piscitelli, G.; Petrillo, A.; De Felice, F. Artificial Intelligence and Machine Learning Applications in Smart Production: Progress, Trends, and Directions. Sustainability 2020, 12, 492. [Google Scholar] [CrossRef] [Green Version]
  12. El Naqa, I.; Murphy, M.J. What Is Machine Learning? In Machine Learning in Radiation Oncology: Theory and Applications; El Naqa, I., Li, R., Murphy, M.J., Eds.; Springer International Publishing: Cham, The Netherlands, 2015; pp. 3–11. [Google Scholar]
  13. Satija, U.; Ramkumar, B.; Manikandan, M.S. A Review of Signal Processing Techniques for Electrocardiogram Signal Quality Assessment. IEEE Rev. Biomed. Eng. 2018, 11, 36–52. [Google Scholar] [CrossRef]
  14. Li, L. A Quality Assessment Method of Single-Lead ECG Signal Based on Spectral Analysis. In Proceedings of the 2016 8th International Conference on Information Technology in Medicine and Education (ITME), Fuzhou, China, 23–25 December 2016; pp. 35–38. [Google Scholar]
  15. Agrawal, A.; Dash, A.; Ghosh, N.; Patra, A. Morphological Event Based Signal Quality Assessment of Electrocardiogram. In Proceedings of the 2022 44th Annual International Conference of the IEEE Engineering in Medicine & Biology Society (EMBC), Glasgow, UK, 11–15 July 2022; pp. 2021–2024. [Google Scholar]
  16. Behar, J.; Oster, J.; Li, Q.; Clifford, G.D. ECG signal quality during arrhythmia and its application to false alarm reduction. IEEE Trans. Biomed. Eng. 2013, 60, 1660–1666. [Google Scholar] [CrossRef]
  17. LeCun, Y.; Bengio, Y.; Hinton, G. Deep learning. Nature 2015, 521, 436–444. [Google Scholar] [CrossRef]
  18. Schmidhuber, J. Deep learning in neural networks: An overview. Neural Netw. 2015, 61, 85–117. [Google Scholar] [CrossRef]
  19. Bengio, Y. Learning Deep Architectures for AI. In Foundations and Trends® in Machine Learning; Now Publishers: Norwell, MA, USA, 2009; Volume 2, pp. 1–127. [Google Scholar]
  20. Guo, J.; Zhu, X.; Xiao, J.; Lei, Z.; Wan, G.; Li, S.Z. Improving Face Anti-Spoofing by 3D Virtual Synthesis. In Proceedings of the 2019 International Conference on Biometrics (ICB), Crete, Greece, 4–7 June 2019; pp. 1–8. [Google Scholar]
  21. Liu, J.; Zhang, C.; Sun, Y.; Han, J.; Ding, E. Detecting Text in the Wild with Deep Character Embedding Network. arXiv 2019, arXiv:1901.00363. [Google Scholar]
  22. Elola, A.; Aramendi, E.; Irusta, U.; Picon, A.; Alonso, E.; Owens, P.; Idris, A. Deep Neural Networks for ECG-Based Pulse Detection during Out-of-Hospital Cardiac Arrest. Entropy 2019, 21, 305. [Google Scholar] [CrossRef] [PubMed] [Green Version]
  23. Á, H.; Martínez-Rodrigo, A.; Puchol, A.; Pachón, M.I.; Rieta, J.J.; Alcaraz, R. Comparison of Pre-Trained Deep Learning Algorithms for Quality Assessment of Electrocardiographic Recordings. In Proceedings of the 2020 International Conference on e-Health and Bioengineering (EHB), Iasi, Romania, 29–30 October 2020; pp. 1–4. [Google Scholar]
  24. Zhou, X.; Zhu, X.; Nakamura, K.; Mahito, N. ECG Quality Assessment Using 1D-Convolutional Neural Network. In Proceedings of the 2018 14th IEEE International Conference on Signal Processing (ICSP), Beijing, China, 12–16 August 2018; pp. 780–784. [Google Scholar]
  25. Bortolan, G.; Christov, I.; Simova, I. Rule-Based methods and Deep Learning Networks for Automatic Classification of ECG. In Proceedings of the 2020 Computing in Cardiology Conference (CinC), Rimini, Italy, 13–16 September 2020; pp. 1–4. [Google Scholar]
  26. He, K.; Zhang, X.; Ren, S.; Sun, J. Deep Residual Learning for Image Recognition. In Proceedings of the 2016 IEEE Conference on Computer Vision and Pattern Recognition (CVPR), Las Vegas, NV, USA, 27–30 June 2016; pp. 770–778. [Google Scholar]
  27. Fang, S.; Xie, H.; Wang, Y.; Mao, Z.; Zhang, Y. Read Like Humans: Autonomous, Bidirectional and Iterative Language Modeling for Scene Text Recognition. In Proceedings of the 2021 IEEE/CVF Conference on Computer Vision and Pattern Recognition (CVPR), Nashville, TN, USA, 20–25 June 2021; pp. 7094–7103. [Google Scholar]
  28. Lanchantin, J.; Wang, T.; Ordonez, V.; Qi, Y. General Multi-label Image Classification with Transformers. In Proceedings of the 2021 IEEE/CVF Conference on Computer Vision and Pattern Recognition (CVPR), Nashville, TN, USA, 20–25 June 2021; pp. 16473–16483. [Google Scholar]
  29. Ramirez-Villegas, J.F.; Lam-Espinosa, E.; Ramirez-Moreno, D.F.; Calvo-Echeverry, P.C.; Agredo-Rodriguez, W. Heart rate variability dynamics for the prognosis of cardiovascular risk. PLoS ONE 2011, 6, e17060. [Google Scholar] [CrossRef] [Green Version]
  30. Holst, H.; Ohlsson, M.; Peterson, C.; Edenbrandt, L. A confident decision support system for interpreting electrocardiograms. Clin. Physiol. 1999, 19, 410–418. [Google Scholar] [CrossRef] [PubMed] [Green Version]
  31. Monasterio, V.; Laguna, P.; Martinez, J.P. Multilead analysis of T-wave alternans in the ECG using principal component analysis. IEEE Trans. Biomed. Eng. 2009, 56, 1880–1890. [Google Scholar] [CrossRef]
  32. de Chazal, P.; O’Dwyer, M.; Reilly, R.B. Automatic classification of heartbeats using ECG morphology and heartbeat interval features. IEEE Trans. Biomed. Eng. 2004, 51, 1196–1206. [Google Scholar] [CrossRef] [Green Version]
  33. Ye, C.; Kumar, B.V.; Coimbra, M.T. Heartbeat classification using morphological and dynamic features of ECG signals. IEEE Trans. Biomed. Eng. 2012, 59, 2930–2941. [Google Scholar]
  34. Osowski, S.; Hoai, L.T.; Markiewicz, T. Support vector machine-based expert system for reliable heartbeat recognition. IEEE Trans. Biomed. Eng. 2004, 51, 582–589. [Google Scholar] [CrossRef]
  35. Gyawali, P.K.; Horacek, B.M.; Sapp, J.L.; Wang, L. Sequential Factorized Autoencoder for Localizing the Origin of Ventricular Activation From 12-Lead Electrocardiograms. IEEE Trans. Biomed. Eng. 2020, 67, 1505–1516. [Google Scholar] [CrossRef]
  36. Xu, S.S.; Mak, M.W.; Cheung, C.C. Towards End-to-End ECG Classification With Raw Signal Extraction and Deep Neural Networks. IEEE J. Biomed. Health Inform. 2019, 23, 1574–1584. [Google Scholar] [CrossRef]
  37. Nurmaini, S.; Umi Partan, R.; Caesarendra, W.; Dewi, T.; Naufal Rahmatullah, M.; Darmawahyuni, A.; Bhayyu, V.; Firdaus, F. An Automated ECG Beat Classification System Using Deep Neural Networks with an Unsupervised Feature Extraction Technique. Appl. Sci. 2019, 9, 2921. [Google Scholar] [CrossRef] [Green Version]
  38. Niu, L.; Chen, C.; Liu, H.; Zhou, S.; Shu, M. A Deep-Learning Approach to ECG Classification Based on Adversarial Domain Adaptation. Healthcare 2020, 8, 437. [Google Scholar] [CrossRef] [PubMed]
  39. Byeon, Y.H.; Pan, S.B.; Kwak, K.C. Intelligent Deep Models Based on Scalograms of Electrocardiogram Signals for Biometrics. Sensors 2019, 19, 935. [Google Scholar] [CrossRef] [PubMed] [Green Version]
  40. Kim, Y.K.; Lee, M.; Song, H.S.; Lee, S.-W. Automatic Cardiac Arrhythmia Classification Using Residual Network Combined With Long Short-Term Memory. IEEE Trans. Instrum. Meas. 2022, 71, 1–17. [Google Scholar] [CrossRef]
  41. Liu, F.; Zhou, X.; Wang, T.; Cao, J.; Wang, Z.; Wang, H.; Zhang, Y. An Attention-based Hybrid LSTM-CNN Model for Arrhythmias Classification. In Proceedings of the 2019 International Joint Conference on Neural Networks (IJCNN), Budapest, Hungary, 14–19 July 2019; pp. 1–8. [Google Scholar]
  42. Mnih, V.; Heess, N.; Graves, A.; Kavukcuoglu, K. Recurrent Models of Visual Attention. arXiv 2014, arXiv:1406.6247. [Google Scholar]
  43. Rafi, T.H.; Woong Ko, Y. HeartNet: Self Multihead Attention Mechanism via Convolutional Network With Adversarial Data Synthesis for ECG-Based Arrhythmia Classification. IEEE Access 2022, 10, 100501–100512. [Google Scholar] [CrossRef]
  44. Liu, Y.; Xie, H.; Cao, Q.; Yan, J.; Wu, F.; Zhu, H.; Pan, Y. Multi-Label Classification of Multi-lead ECG Based on Deep 1D Convolutional Neural Networks With Residual and Attention Mechanism. In Proceedings of the 2021 Computing in Cardiology (CinC), Brno, Czech Republic, 13–15 September 2021; pp. 1–4. [Google Scholar]
  45. Wang, X.; He, Z.; Lin, Z.; Han, Y.; Liu, T.; Lu, J.; Xie, S. PA2Net: Period-Aware Attention Network for Robust Fetal ECG Detection. IEEE Trans. Instrum. Meas. 2022, 71, 1–12. [Google Scholar]
  46. Wang, X.; Girshick, R.; Gupta, A.; He, K. Non-local Neural Networks. In Proceedings of the 2018 IEEE/CVF Conference on Computer Vision and Pattern Recognition, Salt Lake City, UT, USA, 18–23 June 2018; pp. 7794–7803. [Google Scholar]
  47. Vaswani, A.; Shazeer, N.; Parmar, N.; Uszkoreit, J.; Jones, L.; Gomez, A.N.; Kaiser, L.; Polosukhin, I. Attention Is All You Need. arXiv 2017, arXiv:1706.03762. [Google Scholar]
  48. PhysioNet. Available online: https://www.physionet.org/content/challenge-2011/1.0.0/ (accessed on 19 September 2022).
  49. Hamilton, P.S.; Tompkins, W.J. Quantitative Investigation of QRS Detection Rules Using the MIT/BIH Arrhythmia Database. IEEE Trans. Biomed. Eng. 1986, BME-33, 1157–1165. [Google Scholar] [CrossRef]
  50. Hermawan, I.; Ma’sum, M.A.; Intan, P.R.D.; Jatmiko, W.; Wiweko, B.; Boediman, A.; Pradekso, B.K. Temporal feature and heuristics-based Noise Detection over Classical Machine Learning for ECG Signal Quality Assessment. In Proceedings of the 2019 International Workshop on Big Data and Information Security (IWBIS), Bali, Indonesia, 11 October 2019; pp. 1–8. [Google Scholar]
  51. Liu, G.; Han, X.; Tian, L.; Zhou, W.; Liu, H. ECG quality assessment based on hand-crafted statistics and deep-learned S-transform spectrogram features. Comput. Methods Programs Biomed. 2021, 208, 106269. [Google Scholar] [CrossRef]
  52. Athif, M.; Daluwatte, C. Combination of rule based classification and decision trees to identify low quality ECG. In Proceedings of the 2017 IEEE International Conference on Industrial and Information Systems (ICIIS), Peradeniya, Sri Lanka, 15–16 December 2017; pp. 1–4. [Google Scholar]
  53. Morgado, E.; Alonso-Atienza, F.; Santiago-Mozos, R.; Barquero-Perez, O.; Silva, I.; Ramos, J.; Mark, R. Quality estimation of the electrocardiogram using cross-correlation among leads. Biomed. Eng. Online 2015, 14, 59. [Google Scholar] [CrossRef] [PubMed]
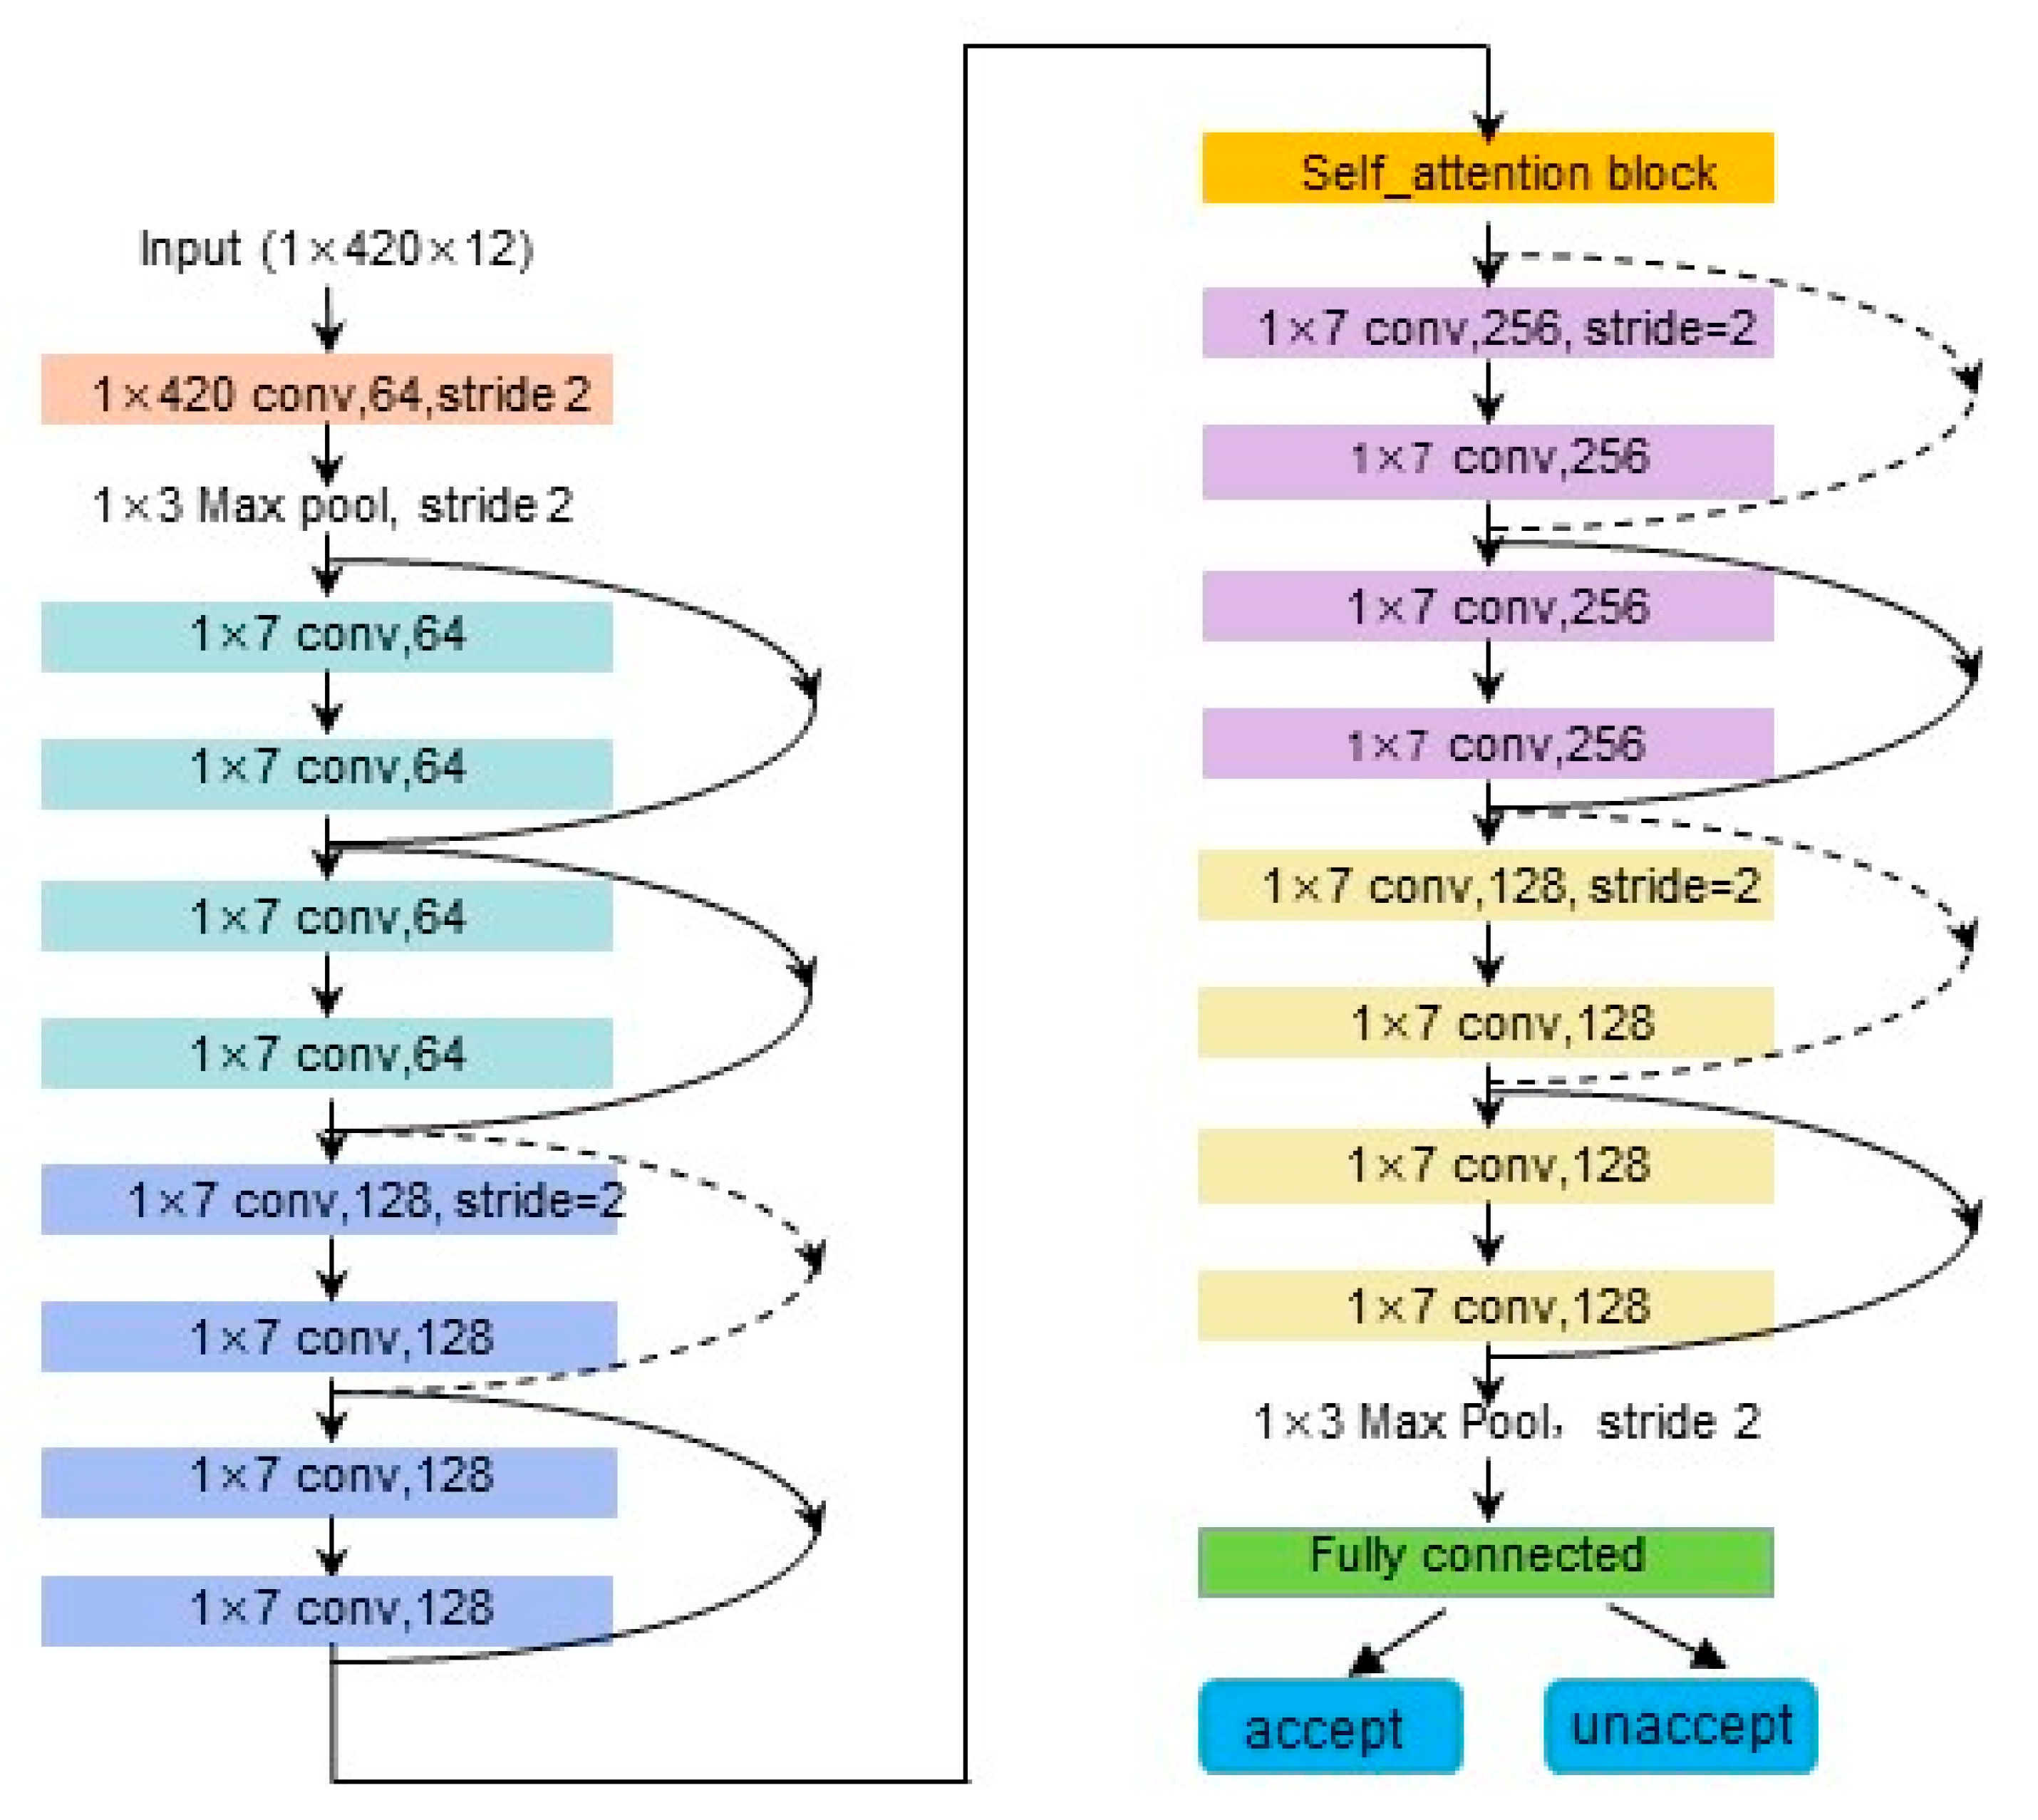
Figure 1. Structure diagram of the signal quality assessment model.
Applsci 13 01313 g001
Figure 2. (a) Unacceptable sample diagram; (b) acceptable sample diagram.
Applsci 13 01313 g002
Figure 3. Self-attention module.
Applsci 13 01313 g003
Figure 4. (a) SE-Net module structure; (b) Non-Local module structure.
Applsci 13 01313 g004
Figure 5. Schematic diagram of a single heartbeat.
Applsci 13 01313 g005
Figure 6. Schematic diagram of data after preprocessing.
Applsci 13 01313 g006
Figure 7. (a) Attention matrix of an acceptable sample; (b) attention matrix of an unacceptable sample.
Applsci 13 01313 g007
Figure 8. (a) An acceptable sample plot corresponds to (a) in Figure 7; (b) an unacceptable sample plot corresponds to (b) in Figure 7.
Applsci 13 01313 g008
Table 1. Confusion matrix.
True
Predicted acceptedunaccepted
acceptedTPFP
unacceptedFNTN
Table 2. Comparison of the calculation amount and parameter amount between the self-attention module and the typical attention modules. The input data dimension is 16 * 128 * 4 * 1 (B × C × W × H), and the parameter amount and calculation amount of the three attention modules are calculated, respectively (r in Figure 4a is taken as 4).
CategorySE-NetNon-LocalSelf-Attention
Calculation volume819282564128
Number of participants819253124208
Table 3. Composition of the dataset.
CategoryDiagnosisCount
1accepted706
2unaccepted157
Total 863
Table 4. Comparison of network indicators without attention module and with attention module.
AccuracyRecallSpecificityPrecisionF1-Score
Resnet1891.43%98.32%52.87%90.51%94.26%
SA-Resnet1892.82%99.17%60.51%91.92%95.40%
Table 5. Performance metrics between the model proposed in this study and various common networks are compared.
ReferencesMethodsDatasetsLead NumberAccuracyF1-Score
Hermawan et al., 2019 [50]Machine learningCinc2011285.7%Unknown
Huerta et al., 2020 [23]GoogLeNet Combining the deep-learned StockwellCinc20171291.5%Unknown
Liu et al., 2021 [51]Transform (S-Transform) spectrogram features and hand-crafted statistical featuresCinc20111293.1%84.7%
Athif et al., 2018 [52]Decision treeCinc20111291.1%Unknown
Morgado et al., 2015 [53]Covariance characteristic matrix and machine learning classifierCinc20111289.8%Unknown
Our proposed methodResnet18+Self-AttentionCinc2011192.8%95.4%
Disclaimer/Publisher’s Note: The statements, opinions and data contained in all publications are solely those of the individual author(s) and contributor(s) and not of MDPI and/or the editor(s). MDPI and/or the editor(s) disclaim responsibility for any injury to people or property resulting from any ideas, methods, instructions or products referred to in the content.