Abstract
Remote sensing technology is widely used in the application of the extraction of lineaments in geological research. However, most of the current traditional lineament extraction methods are based on edge detection technology using a digital filter to extract the mitochondrial features in the image. These previously used algorithms are generally unable to extract the mitochondrial features in the shadow area on the mountain and the area parallel to the direction of the solar incident angle. In this paper, we have improved the STA algorithm (Line Segment Tracking method). The line segmentation and connection methods were firstly proposed, and then 32 search directions were set with one pixel as the center to find the best continuity direction of the lineament. A threshold was then set in this direction to determine whether it was a line element. Finally, line elements were connected into lineaments for further lineament interpretation. The lineament data from three different directions were collected in the Gaosong ore field in the Gejiu mining area, namely at the first place the traditional Canny algorithm, then the improved line segment tracking method, and finally the field measurement. The coefficients of the three-type lineament variations were compared by calculating the lineaments’ strength and their density attributes. It shows that the lineament variability extracted based on the improved line segment tracking method is closer to the measured lineament variability. The results show that the lineaments extracted by the improved algorithm are closer to the measured data. The improved algorithm has higher precision than the traditional Canny algorithm. More realistic and comprehensive lineaments can be attained by using the improved method to extract lineaments in the mining area, which is helpful to the study of the geology of the mining area and helps to construct a more accurate structure model to serve the needs of the mine production.
1. Introduction
The application of remote sensing technology in geological research mainly focuses on the extraction of linear structures. Linear structures are a series of linear, arc, and fold linear (shape) image features [1,2,3,4,5,6] displayed in remote sensing images related to geological processes. Linear structure extraction methods mainly include principal component analysis, image texture analysis, false color composite enhancement study area fracture, and surrounding color difference [7,8,9]. The linear structure extraction process of this method mainly depends on manual visual interpretation [10,11].
Due to the long time period necessary for visual interpretation and the need for interpretation experts to be present to accumulate a large number of field investigation experiences, the interpretation results are slow and time-consuming. To improve the efficiency of linear structure extraction, the standard Hough transform method is used to detect fracture structures with linear characteristics in remote sensing images. For image mitochondrial edge tracking, the linear structure in the image is combined with DEM data and then accurately interpreted to obtain the fracture surface. Methods such as that using gravity data combined with field investigation to identify linear structural features in images have gradually emerged [12,13,14,15]. However, most of these methods are based on the edge detection technology of digital filtering, which is used to extract the mitochondrial features in the image. Generally, it is impossible to extract the mitochondrial features in the shadow area of the remote sensing image and in the area parallel to the incident angle of the sun. In addition, there are problems due to the fact that the line element automatic connection cannot reflect the line element interval and turn, and also cannot fully show the fracture change, fracture attribute characteristics, and so on.
1.1. Research Background, Research Position, Research Purpose, and Method
In this study, the STA (Line Segment Tracking Method) algorithm is optimized and improved [16,17]. The improved algorithm is used to extract the lineaments of the remote sensing image of the Gaosong ore field in the Gejiu mining area and automatically connects the line elements. Then, the extraction lineaments are compared with the ones based on the traditional Canny algorithm [18,19,20,21] and field measurement data. When comparing the results, we think that the improved algorithm is not only faster than the traditional lineaments extraction method but is also more accurate and closer to the field data than the traditional method. We believe that the improved method has great significance for the analysis of tectonic genesis, and also for the stability evaluation of geological engineering and the prediction of geological prospecting.
1.2. Location and Geological Background of the Study Area
The Gejiu tin ore deposit lies between the Pacific tectonic domain and the Tethys [22,23,24]. Gaosong ore field is located in the northeastern Gejiu tin ore deposit. Mesozoic, Permian, and Triassic strata mainly outcrop in the Gaosong ore field and are comprised of Dolomite and Dolomitic limestone. The area has experienced four periods of geological tectonic movement, namely the Indosinian period, the middle and later Yanshan period, the early Himalayan period, and the later Himalayan period. Multistage geological movements have led to the complex tectonics in the area [25,26,27]. The fracture structure can be divided into EW, NE, NW, and SN groups based on the strikes. The strike directions of the major faults are EW and NE, and NW strikes are also fairly common. The EW fracture group contains the Gesong fault, the Kirin Mountain fault, the Machishui fracture, the Gaoa fracture, and the Beiyin Mountain fault from north to south. These features are near-equally distributed. The Gesong and Beiyin Mountain fault scales are the largest and the Kirin Mountain fault is the third largest. The NE fracture set includes the Lotus Flower Mountain, Lutangba, and Linaxi fractures from west to east. The NW fracture set includes the Daqingdong, Heimashi, Camel, Axi Village, and Lina fractures. The NS fracture set is not developed within the ore field (Figure 1) [28,29,30].
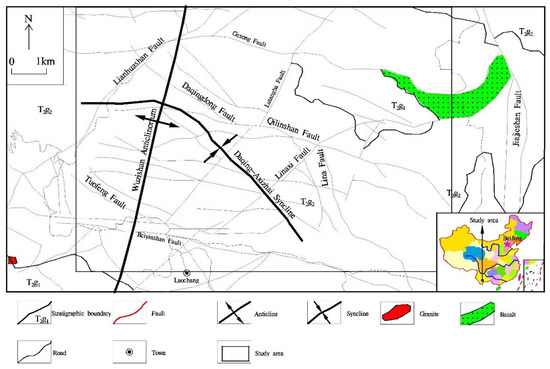
Figure 1.
Distribution of fracture structure in the Gaosong ore field.
The formation of the hydrothermal ore deposit, which is associated with magmatic-hydrothermal fluids, was the result of fluids generated in the Earth’s crust migrating from low-permeability to high-permeability zones via the fracture structure, which includes lineaments near the surface. Therefore, an appropriate method for lineament interpretation can help us to analyze the genesis of ore deposits and the establishment of an ore-forming model [31,32].
Most lineament research has focused on structural measurements, tectonic and geochemical evaluations, determination of the fault and ore body directions, and of fracture structure characteristics that are linked to multiperiodic activity. However, few lineament length and density studies have been conducted. In this study, we will try to make up for this vacancy.
2. Materials and Methods
2.1. Mine Image Processing
According to the geological structure characteristics of the Gaosong ore field, we selected the Landsat 8 Oli image and DEM elevation image to extract the lineaments in the mining area to be processed. The preprocess of the Landsat 8 Oli image mainly includes RGB color synthesis, image sharpening, geometric correction, and median filtering.
The Landsat 8 Oli image used in this experiment was taken in October 2014, and the solar altitude angle was about 145°. The overall vegetation coverage of the image was high, but the bedrock in the mining area image was exposed obviously, the number of clouds was two, and the coverage was low. As shown in Figure 2, it is suitable for a lineament interpretation of remote sensing images.

Figure 2.
Original remote sensing image.
First, the original remote sensing image was synthetically processed using 321 band RGB color composite, which conduces to expand the monochromatic band color space, make the original gray image into a color image, and increase the object information. The image processing results are shown in Figure 3. We then needed to clip it and select the area of the Gaosong ore field for automatic extraction and analysis of lineaments because the original image was too large.
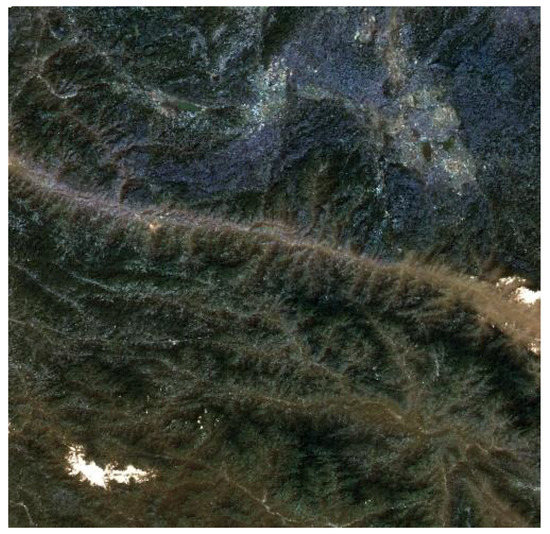
Figure 3.
The 321 band RGB synthesis.
The study area ranges from 103°9′30″ to 103°18′7″ E in longitude and 23°9′30″ to 23°27′23″ in latitude. The Landsat 8 Oli image and DEM image are clipped by an image clipping tool. The results of the study area are shown in Figure 4 and Figure 5.
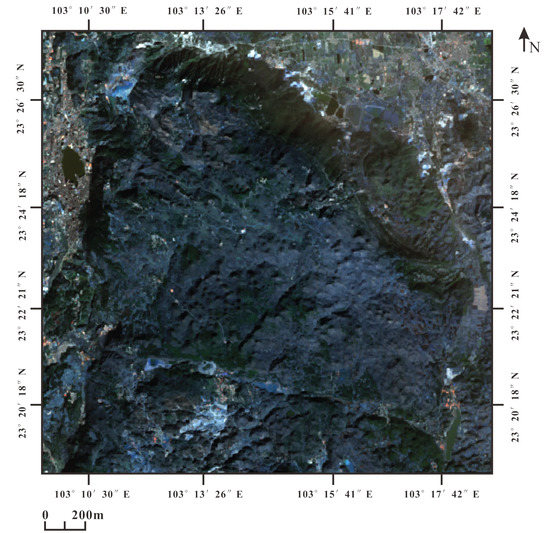
Figure 4.
Landsat 8 Oli clipping image.
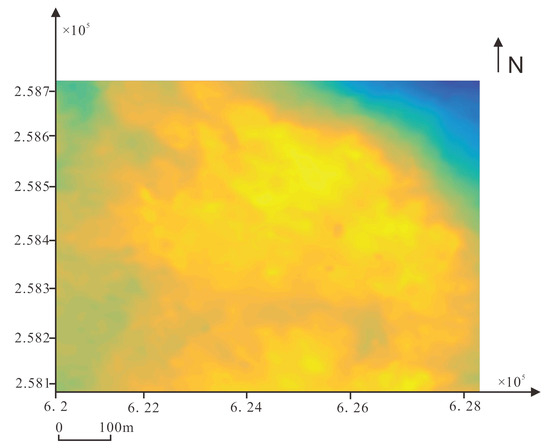
Figure 5.
DEM clipping image.
To make the lineament features in the mining area more obvious, this paper conducts geometric correction, image enhancement, and image sharpening on Landsat 8 Oli images based on cubic polynomials [33,34,35]. Among them, the geometric correction is to eliminate the tensile change caused by the orbital height, the flight attitude, and the speed of the satellite senso. The image enhancement and image sharpening are to strengthen the pixel features in the image, which can then be more clearly displayed in the remote sensing image. The enhancement remote sensing image is shown in Figure 6. For DEM images, a median filter is used to smooth the image and remove most of the noise. That is, select the pixel values of the pixels in the remote sensing image and their surrounding adjacent pixels (a total of odd pixels), sort these pixel values, and then use the pixel value in the middle position as the pixel value of the current pixel, so that the surrounding pixel value is closer to the real value, thereby eliminating isolated noise points. The edge characteristics of the image were maintained so that the image does not produce significant blur [36,37,38], and the principal component analysis method was used to combine the different bands in the image.

Figure 6.
Enhancement of the remote sensing image.
2.2. Lineament Extractions
2.2.1. Traditional Remote Sensing Image Lineament Extraction
The common lineament extractions are based on digital filter edge filtering technology to extract the lineaments of remote sensing images, such as Hough transform and edge detection. For the traditional lineament extraction, this paper chooses the Canny operator to extract the lineaments of a Landsat 8 Oli image. Three steps are identified as follows:
(1) The preprocessed Landsat 8 Oli image was conducted by Gaussian filtering. The standard deviation of the Gaussian low-pass filter was set to 0.4 to enhance its inner edge width.
(2) In image edge detection, a threshold within a specified range is used to judge the edge of the image to avoid the sitution where the image edge specified by a certain threshold leads to a blurred or lost edge of the image. The maximum upper threshold and the minimum lower threshold are determined in a specified range, and the image edges are set within the upper and lower threshold ranges so that the image edges can be clearly determined. The low threshold was set to 0.03 and the high 0.11, which were used to determine the pixel edge in the image by the Canny algorithm.
(3) The length screening was performed to eliminate the pixel information that the computer fails to identify, and the lineaments interpretation map was obtained. The image results and lineaments interpretation results after low-pass filtering are shown in Figure 7 and Figure 8.
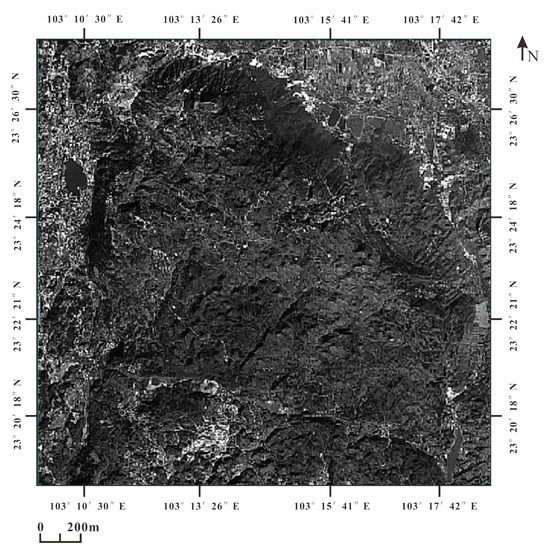
Figure 7.
Image data after Gaussian low-pass filtering.
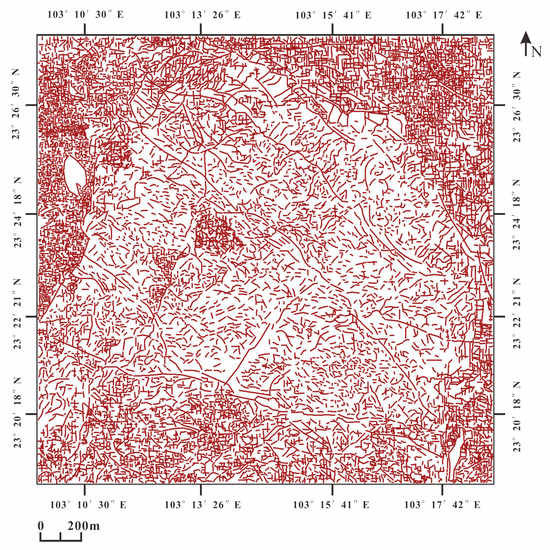
Figure 8.
Lineament interpretation results.
2.2.2. Improved Line Segment Tracking Method for Lineament Extraction and
Automatic Connection
This lineament extraction is to determine whether the obtained line element is a ridge by judging the continuity of the pixel brightness value (DN value) in the remote sensing image. The continuous direction of the pixel can be connected to obtain a lineaments diagram by a matlab program. The specific steps are as follows.
Continuous Direction Judgment of the Line Element
To improve the search accuracy of lineaments and reduce the computation time, we choose the 11 × 11 line element as the center, set the search window, and set 16 radial search directions with equal angle intervals in the range of 180° around the center, as shown in Figure 9.

Figure 9.
The 16 directions of the data search.
Then, the deviation is used to evaluate the continuity of the DN value in the straight line direction:
where is the value of image pixel is the value of another pixel passing through the pixel , and the angle is , which is a straight line from the pixel to the other pixel with a distance of . is the weight coefficient corresponding to the pixel , is the weight coefficient of the pixel with distance from the line element , and the weight coefficient is designed to strengthen the effect of the line element near the pixel . Then, we distinguished the value difference between each pixel. When the deviation is the smallest, it indicates that the direction has the best continuity for the DN value of this pixel .
Line Element Determination
After determining the direction with the best pixel continuity, the basic pixels can be constructed linearly in the continuation direction. Certain thresholds were set to determine the pixels. Meanwhile, the difference between different locations in the image should be eliminated. The difference can be defined as follows:
where is the change rate of the pixel value to eliminate the pixel extraction gap in different regions of the image.
Then, the quadratic integral function can be obtained in the direction perpendicular to the best direction of pixel continuity.
The threshold is seen as the limit threshold of the central pixel. If the change rate of the central pixel is greater than the threshold , the line element can be retained. This pixel is defined as .
where and represent the mean and standard deviation of , respectively, and can be determined by the variogram of the pixel value. If there is sunlight, the variograms parallel and perpendicular to the incident direction of sunlight can be denoted as and . The value of η can be defined by the ratio of the two different directions on the adjacent pixel .
The is the variant function that characterize the relationship between the variance of the change value of the data and the distance of the data. The formula of is defined as:
where is the mathematical expectation.
2.2.3. Line Element Connection
The line element in the direction with good continuity of pixel value is connected according to certain standards. The line element is used as the center point, and the line element connection direction is set (taking the 32 directions of data search as the boundary). Taking as the radius and the direction with good continuity of pixel value as the center direction, the image is scanned in the vertex sector area of , and the midpoint line element is connected with the farthest line element in the area to obtain the lineaments as shown in the figure. The radius function is defined as:
In the program design, radius and threshold are variables related to the direction of line element continuity.
The extraction results of the improved line segment tracking method are shown in Figure 10.

Figure 10.
Lineament extraction results (improved line segment tracking method).
2.2.4. Lineaments Extraction Result Processing
By using the traditional Canny algorithm and the improved line segment tracking algorithm, the lineaments were extracted in the two remote sensing images. The results show that the traditional lineaments extraction method can clearly present the topography and geomorphology, while the extraction results obtained by the line segment tracking method display much element information. Thus, these line elements were connected and interpreted artificially. The interpretation results are shown in Figure 11 and Figure 12.
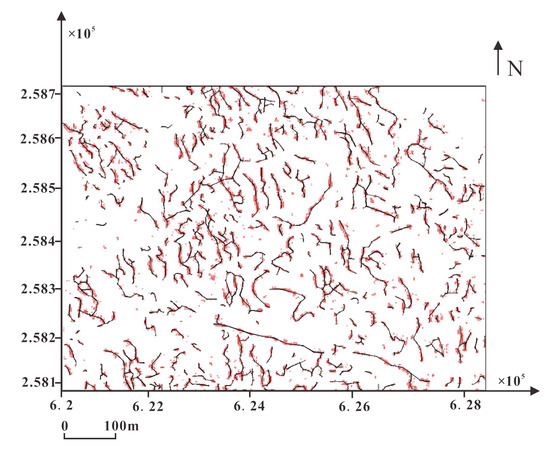
Figure 11.
Linear prime connection (artificial).

Figure 12.
Artificial visual interpretation.
From the results of artificial visual interpretation, important faults such as the Gesong fault, the Beiyin Mountain fault, Lotus Flower Mountain, and so on are distributed clearly in the ore field [39,40].
The line figure, which was extracted by the improved line segment tracking algorithm, is then automatically connected by a matlab program. The result shows that a total of 4198 line elements were extracted from an ETM+ image covering the Gaosong ore field. The largest extracted lineament length was 42 m, and the smallest was 13 m. The line element was then disconnected one by one with a threshold of 2 m. Thirty-two directions were defined in the range of 0–2 π to find the line element closest to the 2 m line element endpoint of the same searching area. Finally, this line of element endpoints was connected into lineaments (Figure 13).
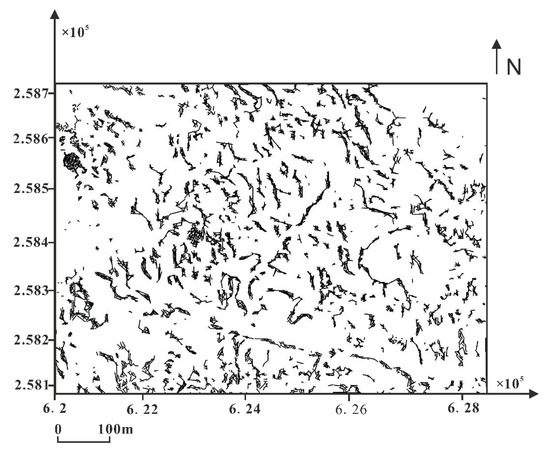
Figure 13.
Lineaments by computer automatic connection.
2.2.5. Comparative Analysis of Lineament Variability
The variation coefficient refers to the spatial variability of lineament strength and density. It can also reflect the influence of faults on the development of fault tectonics. Thus, the coefficients of variation were compared with the use of the traditional Canny algorithm and the improved algorithm. is determined as follows:
where is the standard deviation of the sample, and is the mean value of the sample.
For each fracture strength and fracture density map, a total of 36 semi-variance functions were calculated every 5° along the direction of 0–175°. The average value, standard deviation, variance, and coefficient of variation of the strength and density of each individual lineament were calculated in each direction. They represent the degree of influence and degree of faults and folds on the development of lineaments. The variability of the lineament results extracted by the improved line segment tracking method and the Canny algorithm is compared with the field measured fracture. It can determine whether the outlines of the lineaments extracted by the improved line segment tracking method are closer to the field measured data. The directional semi-variance function [41] in fracture strength and density map can be calculated by using geostatistical software (Wingslib). Table 1 provides the input parameters for calculation in the software.

Table 1.
The input parameters and values required when using GAMV program in GSLIB.
The variability of the linear structure results extracted by the improved line segment tracking method and the original Canny algorithm is compared with the measured fracture structure variability data. It can be seen whether the linear structure attribute data extracted by the improved line segment tracking method is closer to the measured data, which shows the advantages of the improved line segment tracking method in the field of linear structure extraction.
3. Results and Discussion
Faults and folds in the ore field generally reflect the lineaments on remote sensing images. By field investigation in the Gaosong ore field, lineaments in the mining area are influenced by surface faults and folds. Two research areas were chosen near the Lotus Flower Mountain fault and the Wuzi Mountain anticline (Figure 14). The strength and density of lineaments extracted both by traditional methods and then by the improved line segment tracking method were analyzed in these two areas. By comparing the variations between the traditional Canny algorithm, the improved line segment tracking method, and the field measurement, the results show that the improved line segment tracking algorithm has more advantages in providing results of lineament extraction.

Figure 14.
The sampling region in the study area.
Lineament strength and density in the ore field were extracted by Arcgis software. It was used to intercept two circular windows with a diameter of 100 m from the vectorized image, and the lineaments were shown in the circular windows. Two circular windows were located in the side of the Wuzi Mountain anticline and in the Lotus Flower Mountain fault [42]. By using the improved circular scan line method [43,44], based on the directional semi-variance function tool in geostatistics, the lineament strength density parameters were analyzed to quantitatively describe the spatial variability of lineaments [45,46,47,48,49,50]. Then, the spatial variability of the lineaments extracted by the traditional method and the improved line segment tracking method were compared with the measured variability. The measured digital lineament strength and density are shown in Figure 15.
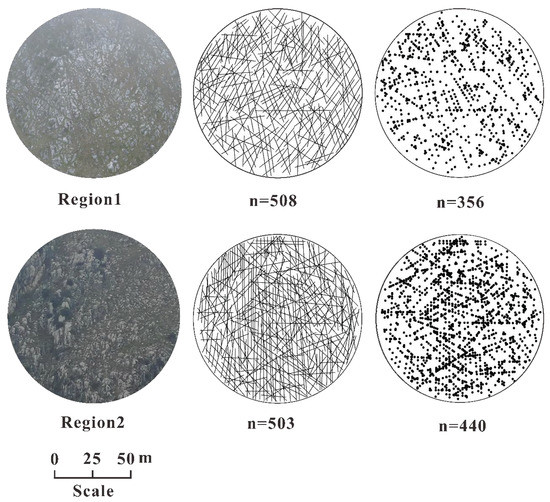
Figure 15.
Digital lineament strength and density map (n represents the number and intersections of the lineaments) in measured region 1 and 2.
Lineament strength and density in the same area within the measured region were analyzed when extracted by the traditional Canny algorithm and by the improved line tracking method, respectively. The processing results are shown in Figure 16 and Figure 17.

Figure 16.
Digital lineament strength and density map. Lineaments extracted from study area 1 and 2 by the traditional Canny algorithm (n represents the number and intersections of lineaments).
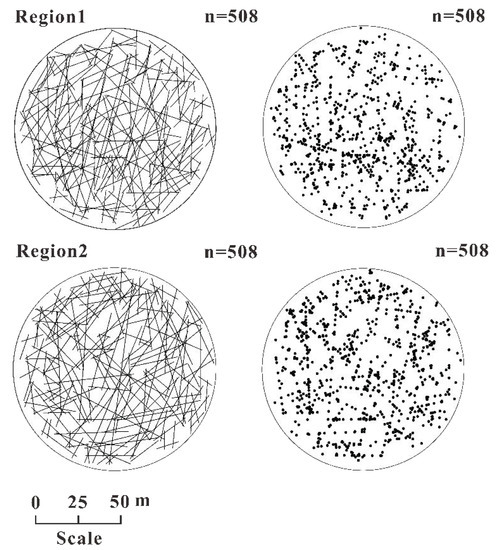
Figure 17.
Digital lineament strength and density map. Lineaments extracted from study area 1 and 2 by the improved line tracking method (n represents the number and intersections of lineaments).
The results show that the lineaments extracted by both the traditional and by the improved line segment tracking algorithm are similar to the measured lineaments by eye. Their lineament strength and density parameters were analyzed by the Arcgis 10.8.1 software. The parameters contain an average value, standard deviation, variance, coefficient of variation, and fracture density (Table 2).
Table 2.
Lineament strength and density with the three methods.
From Table 2, we can see that the average lineament strength by field measurement in regions 1 and 2 are 0.5125 m/m2 and 0.7284 m/m2, respectively. The average lineament strength by the traditional Canny algorithm and the improved line segment tracking method are 0.3593 m/m2 and 0.3890 m/m2; 0.4742 m/m2 and 0.4563 m/m2; 1.42 and 1.87 times; and 1.08 and 1.59 times. The average lineament density from measured data in region 1 and region 2 are 0.0886 and 0.1813, which are 1.73 times and 3.02 times, and 0.94 times and 2.03 times of average fracture strength extracted by traditional Canny algorithm and improved line tracking method. The coefficients of variation are 0.87 times, 0.86 times, 0.95 times, and 0.93 times (study area 1), and 0.83 times, 0.78 times, 0.90 times, and 0.93 times for the traditional Canny algorithm and the improved line segment tracking method, respectively.
In addition, to further compare the three data and analyze the variability of their structure, this paper quantifies and visualizes the spatial variability of the fracture structure. By creating a semi-variance function diagram, Surfer software is used to draw a two-dimensional contour image of the gridded semi-variance function data. To determine the overall direction of the extracted lineaments, the experimental results are shown in Figure 18, Figure 19 and Figure 20:
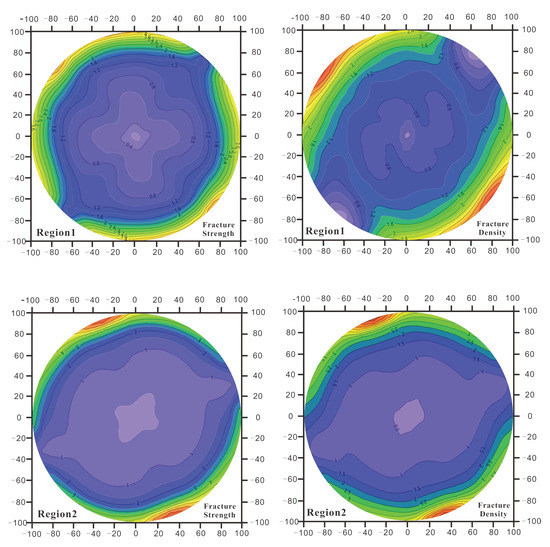
Figure 18.
Measured data study area 1 and study area 2; fracture strength and fracture density half variance contour map.

Figure 19.
Semi-variance contour map of fracture strength and fracture density of lineaments in study area 1 and study area 2 extracted by the traditional Canny algorithm.

Figure 20.
Semi-variance contour map of the fracture strength and fracture density of lineaments in study area 1 and study area 2 extracted by the improved line segment tracking method.
It can be seen from the experimental results that in the field measurement data extracted by the circular scanning line method, the fault strike attribute near the side of the Lianhuashan fault is about NE45°, which is similar to the trend of the Lianhuashan fault. The fracture strike attribute near the Wuzishan anticlinorium is about NE20°, which is close to the axial direction of the Wuzishan anticlinorium.
Because the accuracy and scale of the image, the Landsat 8 Oli image and DEM image in the field survey study area are different, so for the experimental results, we only count the same points of the fracture attributes in the three images, namely fracture density and fracture strength, to compare the lineament results extracted by the two algorithms with the field measurement data. The results are shown in Table 3.
Table 3.
Three sets of data for fracture strike and fracture tendency.
It can be seen from the table that the linear tectonic trend in study area 1 extracted by traditional Canny algorithm is NE62°. The lineament trend in the study area 2 is extracted to be NE32°; based on the improved line segment tracking method, the lineament trend in the study area 1 is NE47°. The lineament trend in the study area 2 is extracted to be NE26°. The fracture tendency in the three groups of data is the same. Therefore, it can be judged that the lineament results extracted based on the improved algorithm are closer to the field data.
The average, standard deviation, variance, and coefficient of variation of the fracture strength and fracture density of the lineaments extracted by the improved line segment tracking method are closer to the real measured data than the lineaments extracted by the original Canny algorithm. In addition, the lineaments extracted by the improved algorithm (representing the distribution of the field fracture structure) are the same as the field measurement of the fracture structure development affected by the fault, that is, the overall fracture structure shows obvious anisotropy in space. This anisotropy is related to the axis of the Wuzishan anticlinorium and the trend of the Lianhuashan fault.
4. Conclusions
In this paper, based on the STA algorithm, we see that this algorithm is improved, and the pixel selection threshold and pixel search direction suitable for a DEM image of the Gaosong ore field are set. In the process of pixel connection, a line segment is innovatively proposed, and its endpoints are taken to obtain a point feature connection between specific search thresholds. A lineament distribution map of the mining area is obtained, which is compared with the lineament results extracted based on the traditional Canny algorithm and the image data measured in the field. The experimental conclusions are as follows:
(1) The attribute values (mean and standard variance) of fracture strength and fracture density in the extracted lineament results based on the improved line segment tracking algorithm are always closer to the measured data than the attribute values of fracture strength and fracture density in the extracted lineament results based on the Canny algorithm.
(2) The strike data of lineaments extracted based on the improved line segment-tracking algorithm is closer to the strike data of the measured fracture distribution in the Gaosong ore field.
(3) The improved algorithm extracts the image as a digital elevation image, which can reduce the influence of houses, roads, factories, and water bodies on the lineament extraction results in Landsat 8 Oli images to a certain extent.
The above experimental results show that the improved line tracking method is not only faster than the traditional lineament extraction method in the field of lineament extraction, but also that the extraction results are more accurate and closer to the field data than the traditional method. The interference of external factors is also reduced, which undoubtedly provides a more efficient technical means for the analysis and research of mining area structures, making it more convenient for people to understand the formation process of geological structures in mining areas. However, there are still some problems, such as: a single line element cannot be identified as a linear structure, resulting in some fractures that cannot be identified; and some large faults cause linear structure connection discontinuity due to excessive turning. To solve these problems, continuing to optimize the linear structure connection program is the key to the next step.
Author Contributions
Conceptualization, formal analysis, writing—original draft preparation, J.F.; Manuscript review, C.N. All authors have read and agreed to the published version of the manuscript.
Funding
This research was funded by projects (41562017, 40902058 and 42062020) supported by the NSFC, the project of Yunnan Major Scientific and Technological Projects (grant NO. 202202AG050006).
Institutional Review Board Statement
Not applicable.
Informed Consent Statement
Not applicable.
Data Availability Statement
Data sharing not applicable.
Conflicts of Interest
The authors declare no conflict of interest.
References
- Yong, Y.; Aiping, Y. Quantitative analysis of high-resolution remote sensing linear structure in Gaolong gold mine area. Guangxi Sci. 2005, 12, 4. [Google Scholar]
- Zuohai, F.; Jincheng, L.; Guilin, Z.; Xibin, H.; Xiaofeng, L. Fractal characteristics of remote sensing linear structure in Pinggui area and its geological significance. Acta Geosci. Sin. 2002, 23, 563–566. [Google Scholar]
- Runsheng, W. Quantitative analysis of remote sensing linear body field. Remote Sens. Land Resour. 1992, 49–54. [Google Scholar]
- Yanjun, L. Geological significance of linear structure in satellite images and its relationship with earthquakes. Geogr. Sci. 1983, 1, 58–64. [Google Scholar]
- Shuliang, W. Linear structure density analysis of TM remote sensing image of Liyang volcanic basin. Geol. J. 2000, 24, 161–164. [Google Scholar]
- Shaojie, Z.; Jianping, Q.; Hongyi, C. Application of fractal statistics of remote sensing linear structure and alteration information extraction in gold-lead-zinc-tin polymetallic metallogenic prediction in eastern Guangxi. Geotecton. Metallog. 2011, 35, 8. [Google Scholar]
- Yuan, Z.; Jianping, Q.; Biaowu, X.; Xiaoxing, Z. The application of remote sensing alteration and linear structure information extraction in the area of Ali Zhailang mining area in Tibet. Mod. Geol. 2013, 27, 99–107. [Google Scholar]
- Gengming, W.; Lihua, W.; Yu, X. Interpretation and analysis of remote sensing geological structure in Guangzhou based on SPOT data. Mar. Geol. Dyn. 2010, 26, 21–24. [Google Scholar]
- Duoyi, W.; Meizhou, D.; Chunhan, T. Remote Sensing Geological Interpretation and Structural Analysis of Shitingjiang Area in Western Sichuan. J. Chengdu Univ. Technol. 2006, 33, 390–393. [Google Scholar]
- Solomon, S.; Ghebreab, W. Lineament characterization and their tectonic significance using Landsat TM data and field studies in the central highlands of Eritrea. J. Afr. Earth Sci. 2006, 46, 371–378. [Google Scholar] [CrossRef]
- Chaabouni, R.; Bouaziz, S.; Peresson, H.; Wolfgang, J. Lineament analysis of South Jenein Area (Southern Tunisia) using remote sensing data and geographic information system. Egypt. J. Remote Sens. Space Sci. 2012, 15, 197–206. [Google Scholar] [CrossRef]
- Uda, R.O.; Hart, P.E. Use of the Hough Transform to Detect Lines and Curves in Pictures. Commun. ACM 1972, 15, 11–15. [Google Scholar]
- Koike, K.; Nagano, S.; Kawaba, K. Construction and analysis of interpreted fracture planes through combination of satellite-image derived lineaments and digital elevation model data. Comput. Geosci. 1998, 24, 573–583. [Google Scholar] [CrossRef]
- Raghavan, V.; Wadatsumi, K.; Masumoto, S. Automatic extraction of lineament information from satellite images using digital elevation data. Nonrenewable Resour. 1993, 2, 148–155. [Google Scholar] [CrossRef]
- Batayneh, A.; Ghrefat, H.; Diabat, A. Lineament Characterization and Their Tectonic Significance Using Gravity Data and Field Studies in the AI-Jufr Area, Southeastern Jordan Plateau. J. Earth Sci. 2012, 23, 873–880. [Google Scholar] [CrossRef]
- Koike, K.; Nagano, S.; Ohmi, M. Lineament analysis of satellite images using a Segment Tracing Algorithm (STA). Comput. Geosci. 1995, 21, 1091–1104. [Google Scholar] [CrossRef]
- Chunzhong, N.; Shitao, Z.; Chunxue, L.; Yan, Y.; Li, Y. Lineament Length and Density Analyses Based on the Segment Tracing Algorithm: A Case Study of the Gaosong Field in Gejiu Tin Mine, China. Math. Probl. Eng. 2016, 2016, 5392453. [Google Scholar]
- Xiaojun, W.; Xumin, L.; Yong, G. Image edge detection algorithm based on improved Canny operator. Comput. Eng. 2012, 38, 196–198. [Google Scholar]
- Hui, L.; Changsheng, Z.; Ning, S. Edge detection and evaluation based on Canny operator. J. Heilongjiang Inst. Eng. 2003, 17, 5. [Google Scholar]
- Zhi, W.; Sai-Xian, H. An Adaptive Edge-detection Method Based on Canny Algorithm. J. Image Graph. 2004, 9, 957–962. [Google Scholar]
- Zhang, D.D.; Zhao, S. An Improved Edge Detection Algorithm Based on Canny Operator. Appl. Mech. Mater. 2013, 347–350, 3541–3545. [Google Scholar] [CrossRef]
- Yongqiu, Z.; Renzhong, W.; Shupei, Y.; Jinming, Y. Tin-copper polymetallic deposit, Gejiu, Yunnan. Acta Mineral. Sin. 1996, 34, 565–566. [Google Scholar]
- Chong-wen, Y.; Yao-song, J. Kinetic mechanism of primary metal zonation of cassiterite-sulfide deposits in Gejiu mining area, Yunnan. Geol. J. 1990, 64, 226–237. [Google Scholar]
- Ming-Guo, D.; Wen-Chang, L.; De-Xian, Q. Application of Kriging method to reserve calculation of No. 10-9 Lutangba ore body in Gejiu mining area. Geol. Explor. 2006, 42, 67–70. [Google Scholar]
- Shaoyou, S. Study on multi-stage activity characteristics of fault structure in Gaosong ore field of Gejiu tin deposit. Mineral. J. 2004, 24, 5. [Google Scholar]
- Shucheng, T. Study on Metallogenic Series of Gejiu Tin-Polymetallic Deposit; Kunming University of Science and Technology: Kunming, China, 2004. [Google Scholar]
- Tingting, S.; Xiuli, F.; Yu, C.; Yongming, W.; Qinjun, W.; Xianfeng, C. Remote Sensing Inversion of Soil Zinc Pollution in Gejiu Mining Area, Yunnan. Remote Sens. Technol. Appl. 2018, 33, 88–95. [Google Scholar]
- Jiangnan, Z.; Shouyu, C.; Pengda, Z. Geochemical Characteristics and Significance of Rare Earth Elements in Tectonic Rocks of Gaosong Ore Field, Gejiu. J. Chin. Soc. Rare Earths 2011, 29, 9. [Google Scholar]
- Yu, C.; Jiang, Y. The Dynamic Mechanisms Of Primary Metal-Zoning Of Cassiterite-Sulfide Deposits In The Gejiu Ore District Yunnan Province. Acta Geol. Sin. 1990, 3, 226–237. [Google Scholar]
- Liu, C.X.; Qin, D.X.; Dang, Y.T.; Tan, S.C. Synthesis Information Based Mineral Resource Prediction Of Gaosong Field In Gejiu Tin Deposit. Adv. Earth Sci. 2003, 18, 921–927. [Google Scholar]
- Jingwen, M. Tin ore field in Gejiu, Yunnan: Ore deposit model and discussion of some problems. Geol. J. 2008, 82, 1455–1467. [Google Scholar]
- Wenchang, L.; Pusheng, Z. Characteristics and metallogenic model of Pulang super-large porphyry copper deposit in Yunnan. J. Chengdu Univ. Technol. Nat. Sci. Ed. 2007, 34, 11. [Google Scholar]
- Wenzhong, S.; Changqing, Z.; Yu, W. Review and prospect of road feature extraction from remote sensing images. Acta Geod. Cartogr. Sin. 2001, 30, 6. [Google Scholar]
- Deren, L. Change detection using remote sensing images. J. Wuhan Univ. Inf. Sci. Ed. 2003, S1, 6. [Google Scholar]
- Chuang, L.; Chenghui, G. Characteristics and Application of Remote Sensing Data of Medium Resolution Imaging Spectroradiometer (MODIS) in Earth Observation System (EOS). Remote Sens. Inf. 2000, 4, 45–48. [Google Scholar]
- Xuming, Z.; Binshi, X.; Shiyun, D. Adaptive Median Filtering for Image Processing. J. Comput. Aided Des. Graph. 2005, 17, 5. [Google Scholar]
- Xiaokai, W.; Feng, L. Improved Adaptive Median Filtering. Comput. Eng. Appl. 2010, 3, 3. [Google Scholar]
- Lei, X.; Kun, H.; Jiliu, Z. Image denoising based on improved adaptive median filtering. Laser J. 2009, 2, 3. [Google Scholar]
- Chunxue, L.; Chunzhong, N.; Yongfeng, Y. Automatic extraction of linear structure based on remote sensing image. Remote Sens. Technol. Appl. 2014, 2, 5. [Google Scholar]
- Chongwen, Y.; Yaosong, J. The Dynamic Mechanisms for the Formation of Primary Metal Zoning of Cassiterite-Sulfide Deposits in the Gejiu Metallogenic Province, Yunnan. Acta Geol. Sin. Engl. Ed. 1991, 4, 51–63. [Google Scholar] [CrossRef]
- Chuanjie, P.; Dexian, Q.; Chunxue, L. Study on spatial enrichment law of gold element in jinchang gold deposit, mojiang. Geotecton. Miner. 2004, 28, 388–396. [Google Scholar]
- Watkins, H.; Bond, C.E.; Healy, D.; Butler, R.W.H. Appraisal of fracture sampling methods and a new workflow to characterise heterogeneous fracture networks at outcrop. J. Struct. Geol. 2015, 72, 67–82. [Google Scholar] [CrossRef]
- Mauldon, M. Estimating Mean Fracture Trace Length and Density from Observations in Convex Windows. Rock Mech. Rock Eng. 1998, 31, 201–216. [Google Scholar] [CrossRef]
- Mauldon, M.; Dunne, W.M.; Rohrbaugh, M.B. Circular scanlines and circular windows: New tools for characterizing the geometry of fracture traces. J. Struct. Geol. 2001, 23, 247–258. [Google Scholar] [CrossRef]
- Stavropoulou, M.; Exadaktylos, G.; Saratsis, G. A combined three-dimensional geological-geostatistical-numerical model of underground excavations in rock. Rock Mech. Rock Eng. 2007, 40, 213–243. [Google Scholar] [CrossRef]
- Hanke, J.R.; Fischer, M.P.; Pollyea, R.M. Directional semivariogram analysis to identify and rank controls on the spatial variability of fracture networks. J. Struct. Geol. 2018, 108, 34–51. [Google Scholar] [CrossRef]
- Priest, S.; Hudson, J. Estimation of discontinuity spacing and trace length using scanline surveys. Int. J. Rock Mech. Min. Sci. Geomech. Abstr. 1981, 18, 183–197. [Google Scholar] [CrossRef]
- Rawnsley, K.; Rives, T.; Petti, J.-P.; Hencher, S.R.; Lumsden, A.C.; Burg, J.P. Joint development in perturbed stress fields near faults. J. Struct. Geol. 1992, 14, 939–951. [Google Scholar] [CrossRef]
- Ortega, O.J.; Gale, J.F.; Marrett, R. Quantifying diagenetic and stratigraphic controls on fracture intensity in platform carbonates: An example from the Sierra Madre Oriental, northeast Mexico. J. Struct. Geol. 2010, 32, 1943–1959. [Google Scholar] [CrossRef]
- Maerten, L.; Gillespie, P.; Pollard, D.D. Effects of local stress perturbation on secondary fault development. J. Struct. Geol. 2002, 24, 145–153. [Google Scholar] [CrossRef]
Disclaimer/Publisher’s Note: The statements, opinions and data contained in all publications are solely those of the individual author(s) and contributor(s) and not of MDPI and/or the editor(s). MDPI and/or the editor(s) disclaim responsibility for any injury to people or property resulting from any ideas, methods, instructions or products referred to in the content. |
© 2023 by the authors. Licensee MDPI, Basel, Switzerland. This article is an open access article distributed under the terms and conditions of the Creative Commons Attribution (CC BY) license (https://creativecommons.org/licenses/by/4.0/).