Article

Study of Gravelly Soil Core Material Using a Large-Scale Triaxial Wetting Test

1
Geotechnical Engineering Department, Nanjing Hydraulic Research Institute, Nanjing 210029, China
2
Key Laboratory of Reservoir and Dam Safety of the Ministry of Water Resources, Nanjing Hydraulic Research Institute, Nanjing 210029, China
*
Author to whom correspondence should be addressed.
Appl. Sci. 2023, 13(24), 13295; https://doi.org/10.3390/app132413295
Submission received: 15 November 2023 / Revised: 7 December 2023 / Accepted: 13 December 2023 / Published: 15 December 2023

Abstract

:
Wetting deformation has a significant impact on dam safety, and is one of the leading causes of the long-term deformation of dams. For dams to operate safely, it is crucial to precisely estimate the extent of wetting deformation using a reasonable calculation model. This study describes the wetting deformation behavior of gravelly soil core material observed at a hydropower station using a large-scale triaxial wetting test, and the process, characteristics, and mechanism of the wetting deformation are analyzed. The results show that the direction of the wetting deformation exhibits different behaviors influenced by the stress levels. Compared with the significant changes in the wetting direction observed under low stress levels, the changes in the wetting direction under high stress levels appears to lag behind those in wetting deformation. The source of wetting deformation is thought to be the weakening of a material when it encounters water. Thus, a new calculation model of the wetting deformation of gravelly soil core material is proposed. In this model, the wetting strain ratio is in an exponential relationship with the stress levels, and the new model is used to simulate the triaxial wetting test on the gravelly soil core material; its validity and practicability are further evaluated, providing a new computational approach for analyzing the wetting deformation behavior of dams.

1. Introduction

Large dams have a close relationship with social development (i.e., water, food, and energy consumption), and the vital role of large dams in sustaining societies has been recognized [1]. The impermeability and geotechnical characteristics of dam core mate-rials are very important in the design of earth dams [2]. Wetting deformation, which is generated via particle sliding, breakage, and rearrangement, plays a vital role in dam deformation, which determines its safety [3]. Wetting deformation refers to the deformation that occurs when a material transitions from a dry state to a saturation state. Reservoir water storage, water level fluctuations, and rainwater infiltration can all cause wetting deformation. Wetting may accelerate the softening of materials, which adversely affects the strength, deformation, and even stability of the dam body [4,5,6,7]. For example, the Infernillo Dam in Mexico is 148 m high. The dam crest settled about 26 cm during its first impoundment [8]. In October 2014, during the first impoundment of the Guanyinyan composite dam in China, wetting deformation caused four longitudinal cracks on the dam crest, with the largest being about 127 m [9]. Wetting deformation is a key technical problem in the design and function of high earth–rockfill and earth–core rockfill dams [10].
The wetting test can be performed using either the single-line method or double-line method [11,12]. The two methods both produce similar wetting laws, but they differ significantly in terms of the deformation amount. Since the single-line method is closer to that used in engineering projects, it has been widely adopted [13,14]. The stiffness of the material refers to its ability to resist external deformation. Wetting significantly reduces particle strength and stiffness, and particle strength decreases with increasing particle size. The weakening of the material itself will reduce its stiffness; thus, the material will deform [15,16,17]. Kast et al. [18] (1985) proposed that, under a constant load, wetting deformation is equal to the deformation difference between a dry and saturated sample under the same conditions, while Jie et al. [19] (2020) suggested that it is unsuitable to directly subtract the deformation of ‘dry soil’ from that of ‘wet soil’ in the same stress state in a double-line test. The subtraction should instead be calculated by using the tangent modulus under the same stress state. Jia et al. [20] (2019) investigated the influence of the stress path on the wetting deformation of coarse-grained materials. In contrast to wetting deformation under traditional triaxial test settings, the wetting deformation of coarse-grained soil under an equal stress ratio path is influenced not only by the stress state but also by the loading path. Zuo et al. [21] (2023) conducted laboratory tests to determine the wetting deformation law of core wall material, which was discovered to be more complex than that of rockfill material. Ding et al. [22] (2019) studied the wetting mechanism and considered that wetting deformation can be divided into two stages: instantaneous wetting and creep wetting deformation. Yin et al. [23] (2021) added a water distribution controller to study the unsaturated wetting of rockfill materials. The study found that the wetting deformation characteristics in unsaturated conditions are similar to those in saturated conditions.
For the purpose of application, it is important to establish a wetting model to describe the mechanical behavior of the material under study. Shen et al. [24] (1989) proposed a classical wetting deformation model based on the law of wetting tests. According to Shen Zhujiang’s wetting model, the relationship between shear deformation and the stress level follows a hyperbolic curve, which is widely accepted. However, the conclusion that the volume deformation is constant during wetting is not universally accepted. Firstly, accurately measuring volume deformation during experiments can be challenging, especially in large-scale tests. Furthermore, the evolution law of the wetting direction itself is very complex. The behavior of volume deformation during the wetting process may vary in different soil types and experimental conditions [25]. Therefore, based on numerous experimental studies, many wetting models have been proposed on the basis of Shen Zhujiang’s model [26,27,28,29,30]. Zhang et al. [31] (2023) established a P-Z wetting model based on the elastic–plastic theory and the wetting model formula, and the BP artificial neural network was introduced to establish an artificial neural network wetting deformation prediction model. Qiu et al. [32] (2023) proposed that the lateral wetting strain of high-liquid-limit red clay can be divided into two types, the lateral wetting strain caused by humidification and the lateral wetting strain caused by the water absorption of expanding minerals, and established a wetting strain peak prediction model of high-liquid-limit red clay. Systematic experimental investigations of the wetting behavior of gravel core wall material have rarely been reported, compared with vast experimental research on rockfill materials. Therefore, it is not clear whether or not the observed behavior of rockfill materials can be extrapolated to gravelly soil core material, and the applicability of wetting models to gravelly soil core material is unknown.
This research study investigated the wetting behavior of the gravelly soil core material of a dam using large-scale triaxial wetting tests. Based on the results of the wetting tests, the direction and mechanism of wetting deformation are discussed. To conclude, a new constitutive model of wetting deformation is proposed.

2. Materials and Methods
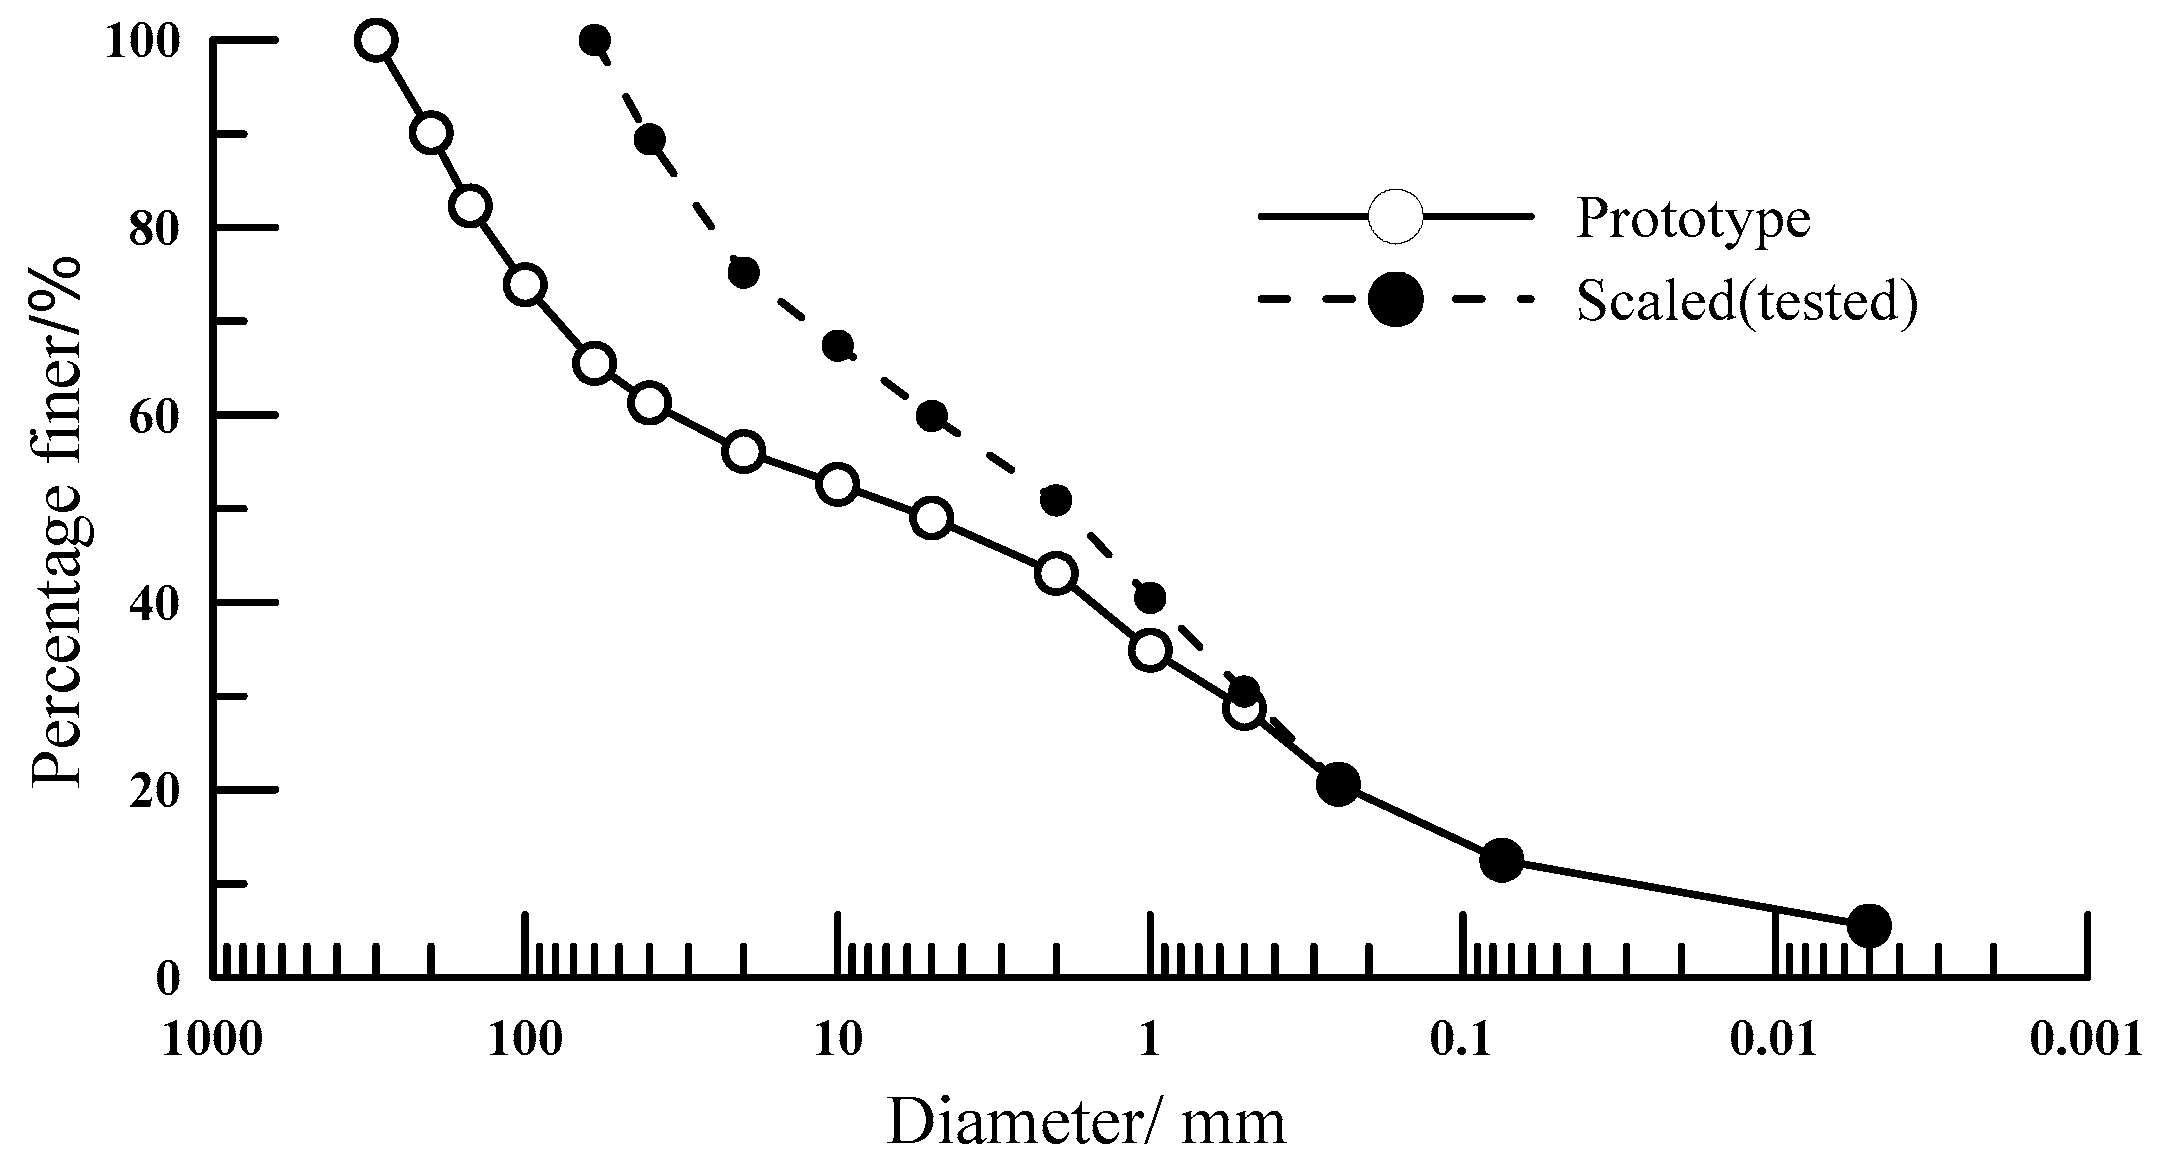
2.1. Materials

The tested material is gravelly soil core material collected from a hydropower station. In the experiments, a triaxial testing apparatus was utilized, which could only accommodate specimens with a diameter of 300 mm. Therefore, it was necessary to scale down the prototype material before conducting the tests. In this study, particles with a diameter greater than 60 mm were replaced with smaller particles using the replacing method, while the mass content of particles smaller than 5 mm remained unchanged. The particle size distribution of the material before and after scaling is presented in Figure 1. After scaling, the maximum and minimum dry density of the material were 2.22 g/cm3 and 1.61 g/cm3, respectively, and the simulated density of the test was 2.09 g/cm3.

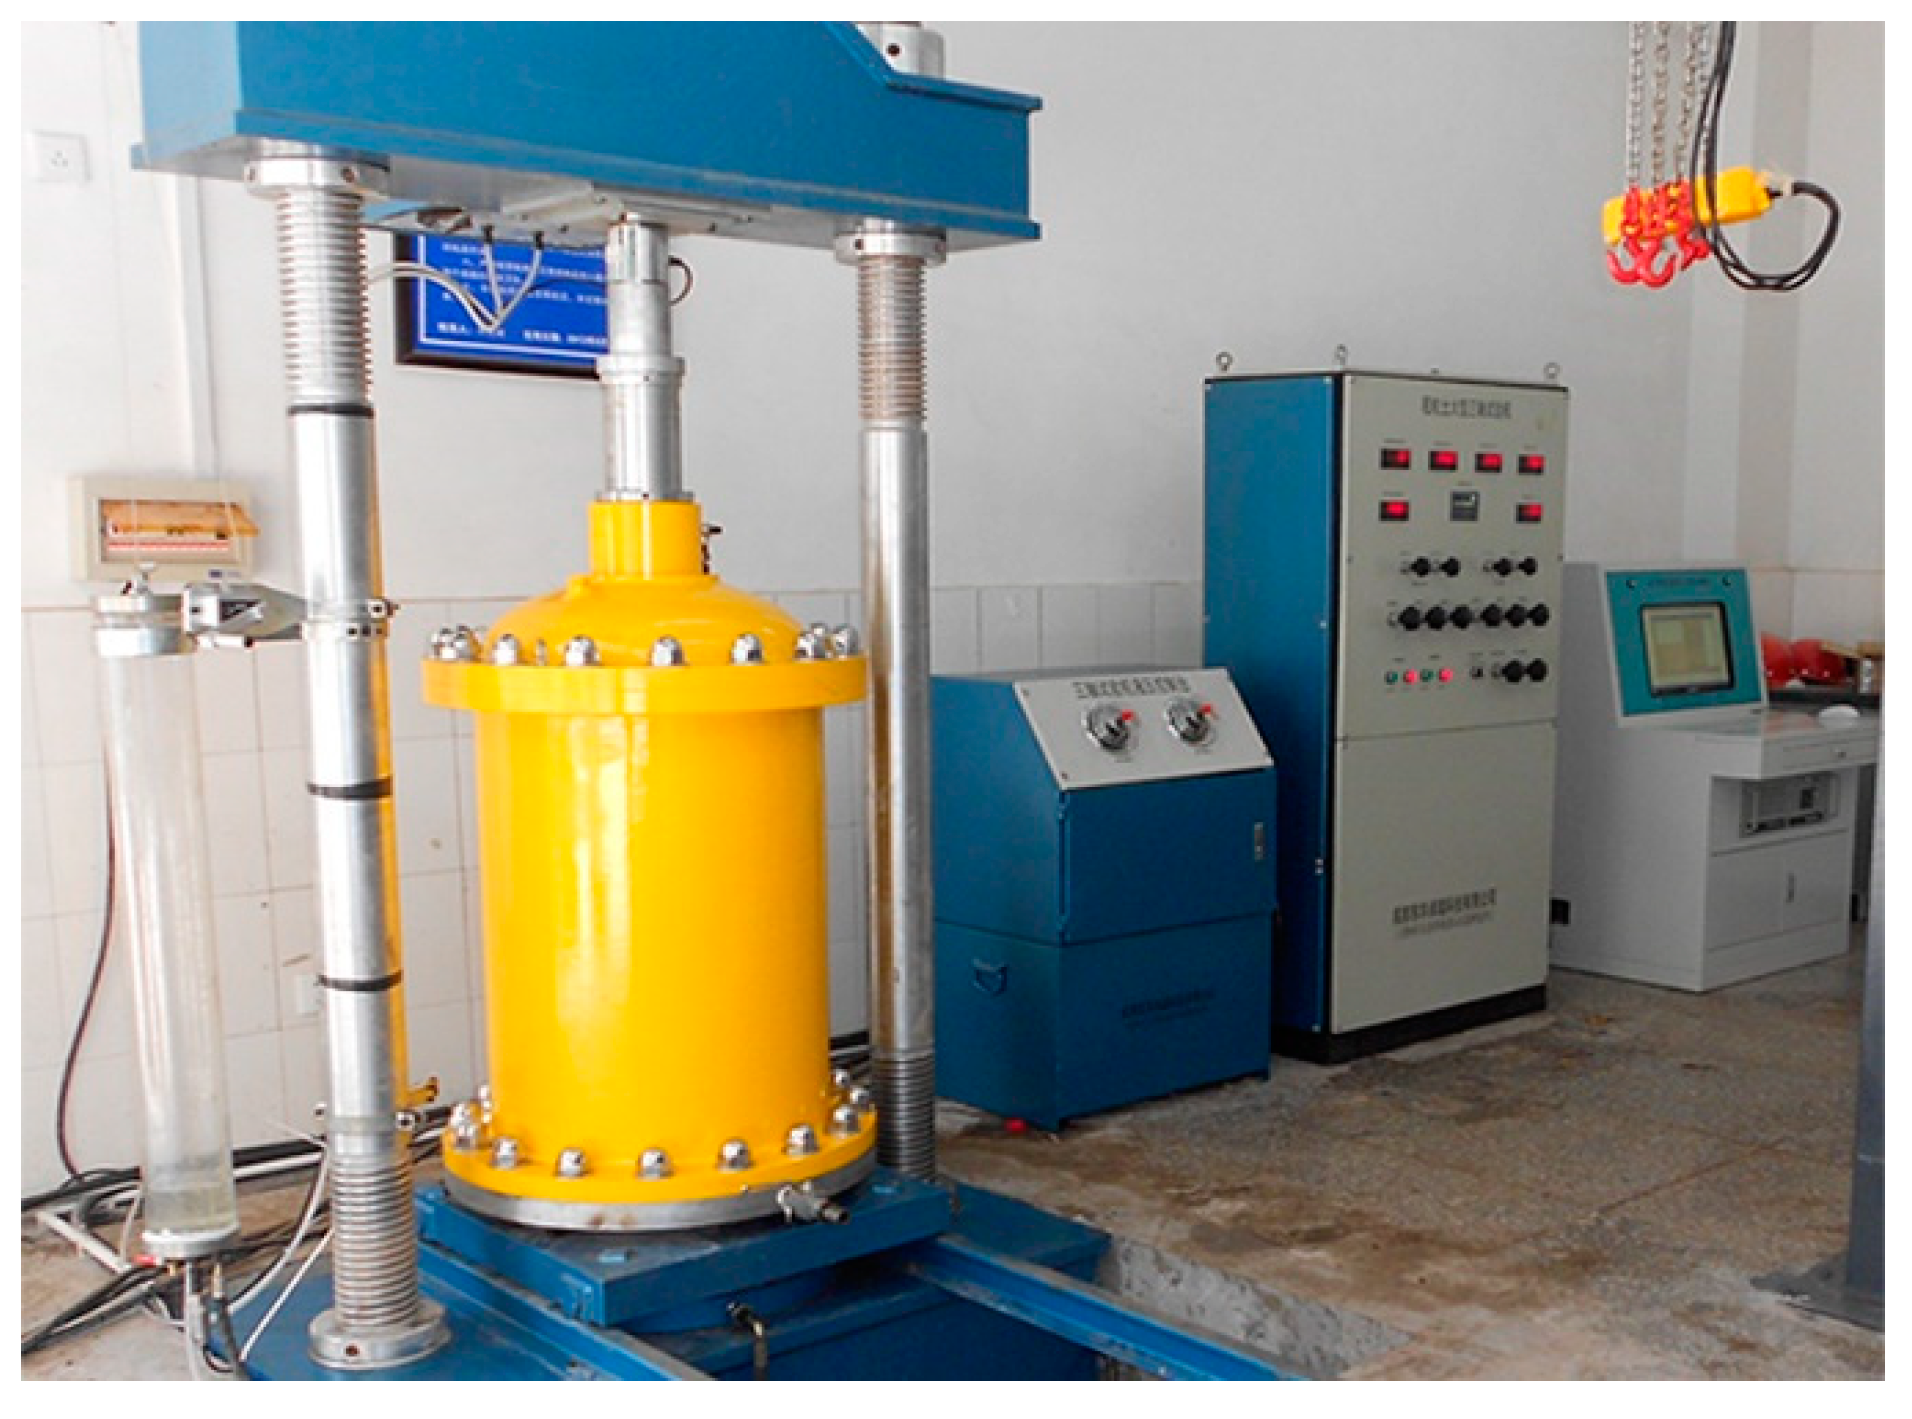
2.2. Sample Preparation and Experimental Program

The samples were prepared using the compaction method. The sample size was Φ300 × 700 mm. The dried sample was divided into six groups according to the following gradations: 0–1 mm, 1–5 mm, 5–10 mm, 10–20 mm, 20–4 0 mm, and 40–60 mm. Note that the total mass of each specimen was calculated according to the cylindrical specimen size, and then the mass of each group could be calculated according to the particle distribution curve (Figure 1). To prepare the samples, the soils from each group were mixed together, and water was added to achieve the desired moisture content. Each mixture was divided into five equal parts and compacted in the mold in layers using a vibrator.
Figure 2 illustrates the wetting apparatus used in this experiment, which was designed by the Nanjing Hydraulic Research Institute. In order to carry out the wetting deformation test, the strain-controlled triaxial shear instrument that is usually used should instead be stress-controlled.
The single-line method was used to conduct the wetting test on the gravelly soil core material. In the triaxial wetting tests, the specimen prepared in the split mold was placed onto the pedestal. After the confining pressure was applied to the sample until the consolidation was stable, axial stress was applied at the predetermined level, while the confining pressure and axial stress were kept constant. After the primary deformation of the sample reached a stable state, the sample was saturated via soaking, starting from the bottom of the sample. During the saturation process, the axial deformation and the external volume deformation of the sample were measured until the primary deformation of the sample was completed (the strain was less than 1 × 10⁻⁴ within 30 min), and then the axial pressure was applied to the sample to continue shearing until the sample was destroyed or reached 15% of the axial strain of the sample.
Each group of tests consisted of confining pressures and different stress levels for the wetting experiments. In total, 12 tests were completed. The specific test plan is presented in Table 1, in which Sl represents the stress level, defined as the ratio of the shear stress at the start of wetting to the shear stress upon failure under the same conditions.

3. Results

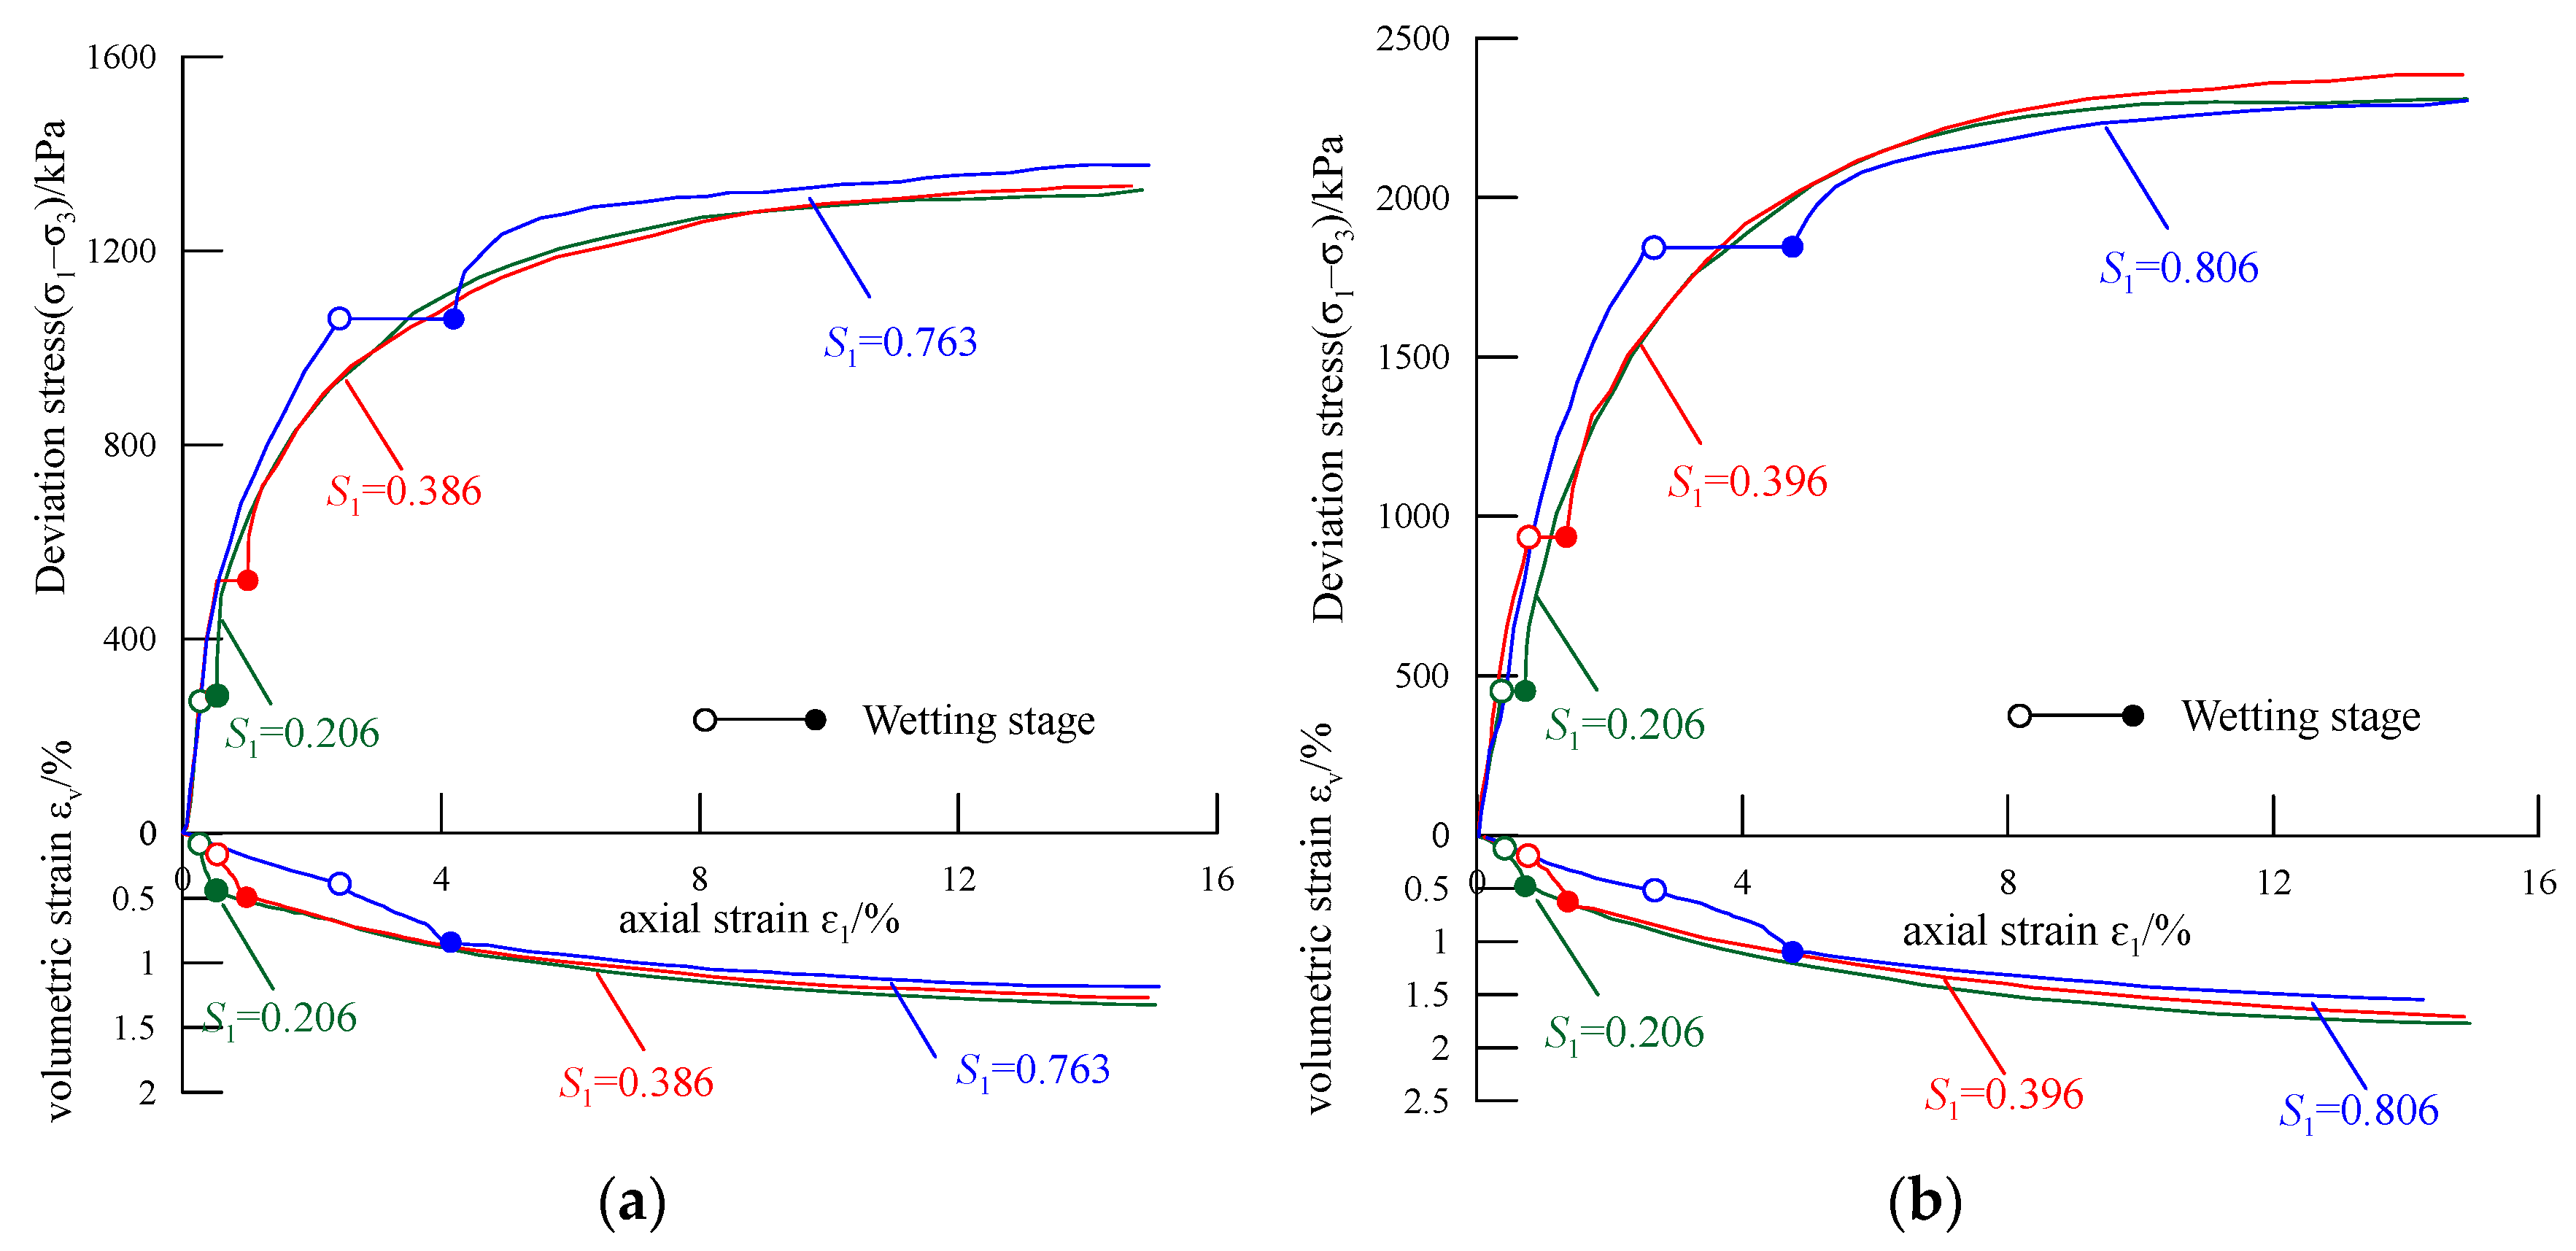
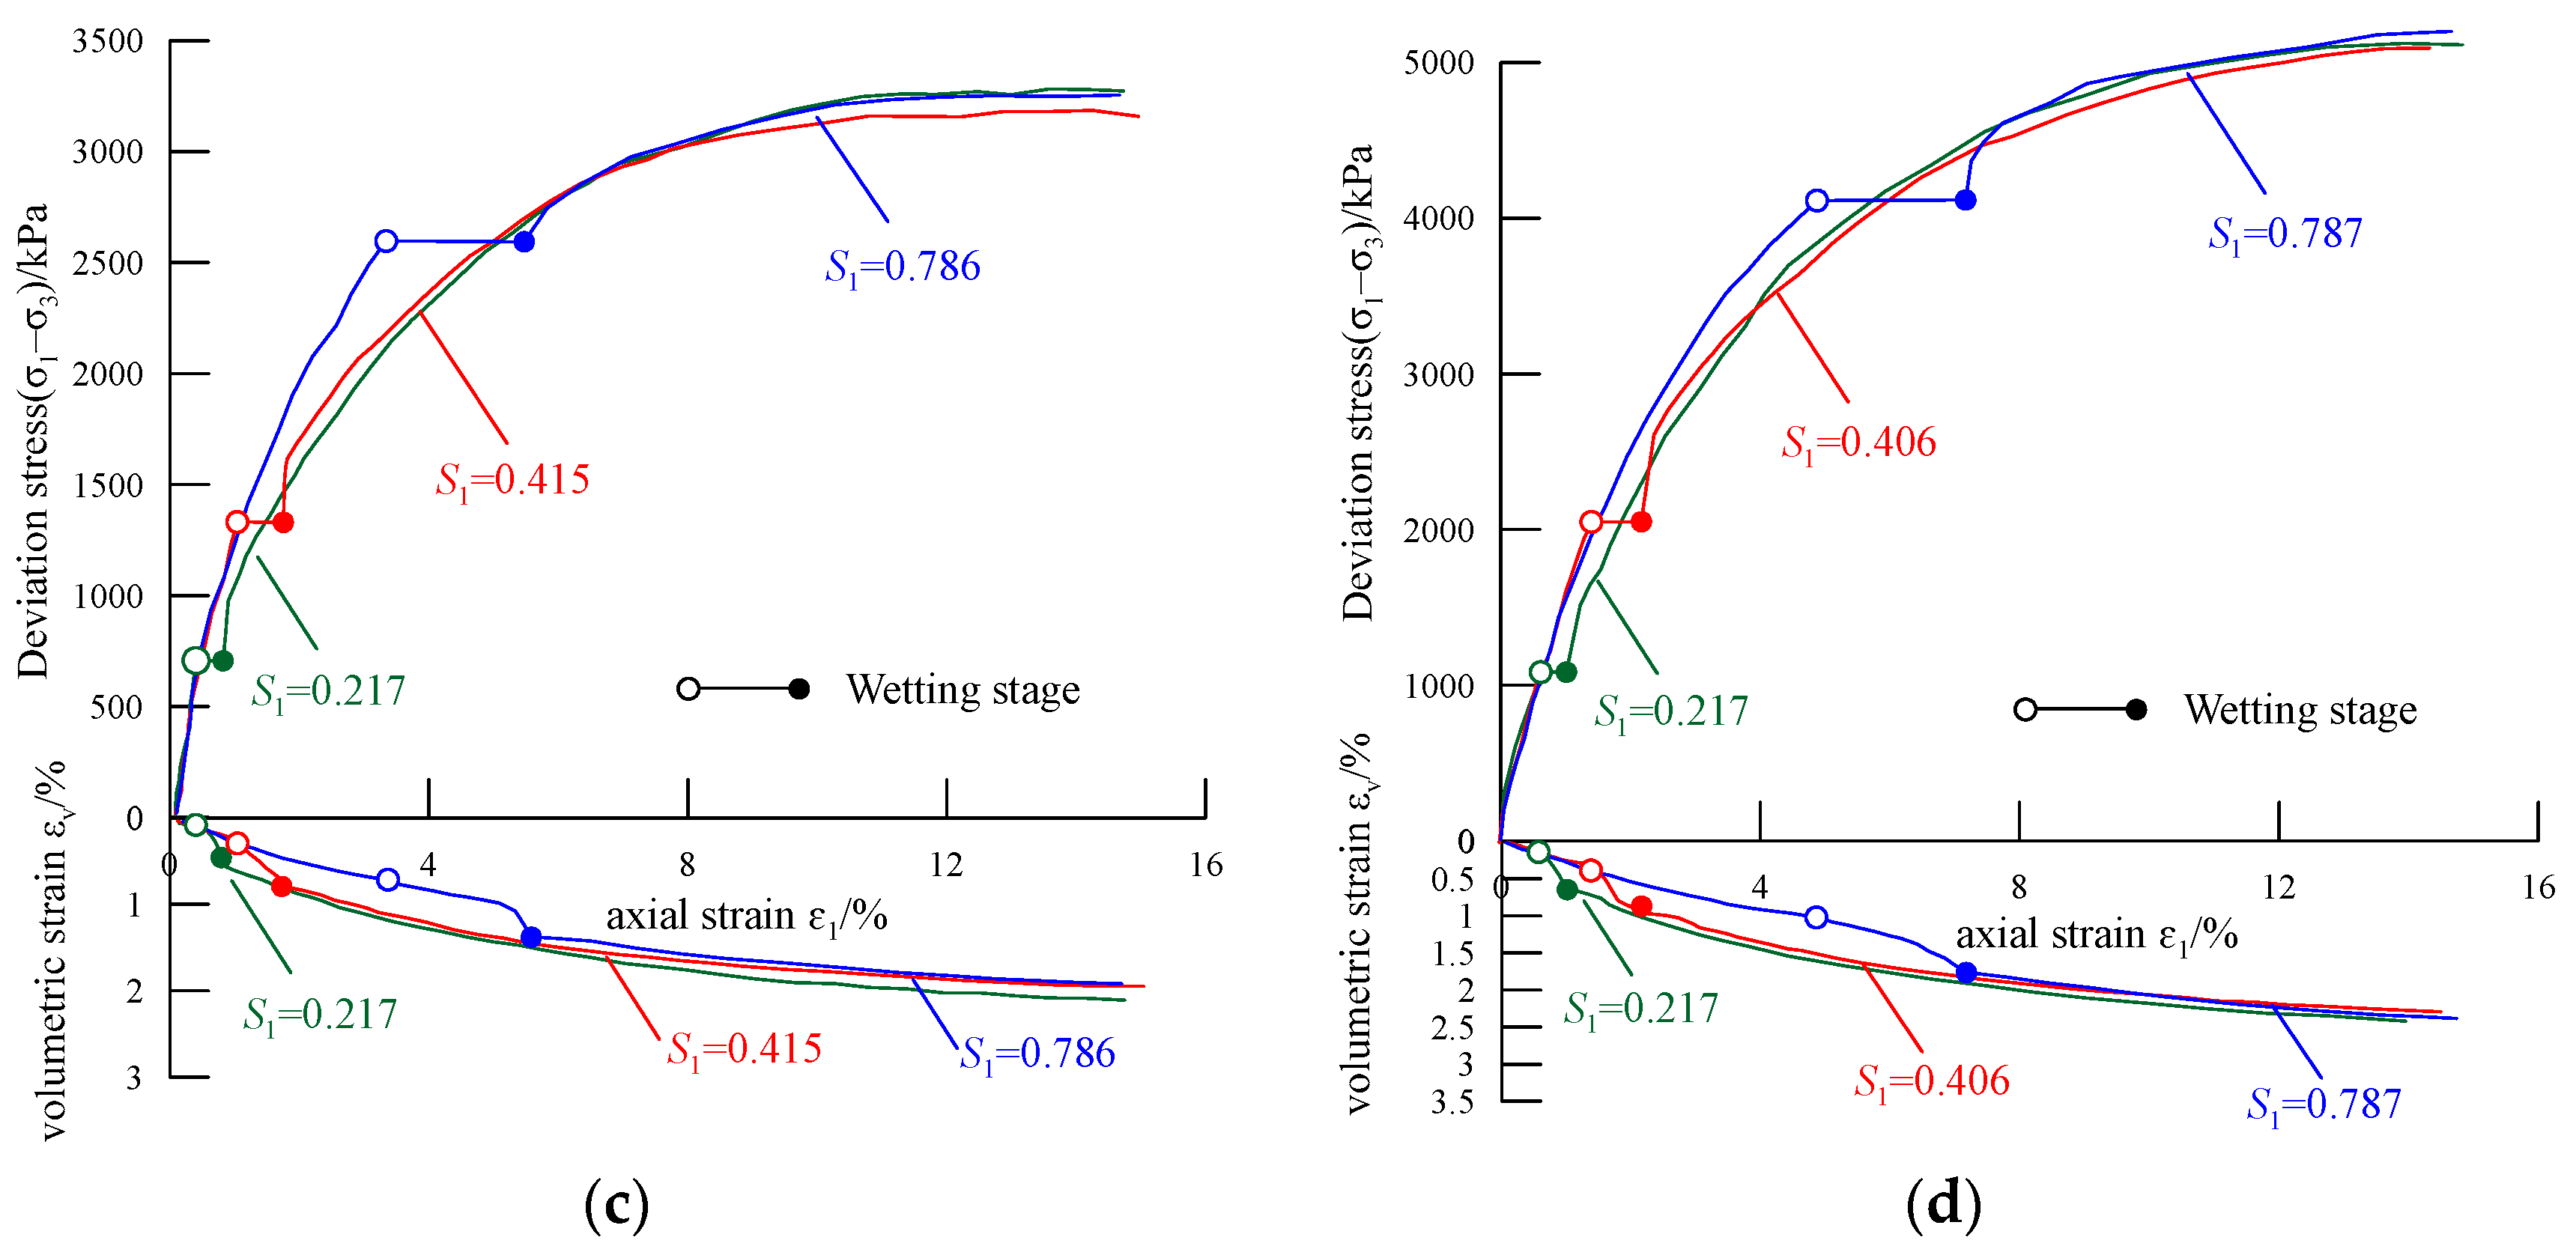
3.1. Experimental Results

Figure 3 shows the results of the stress–strain curve obtained from the results of the wetting tests. Similar deformation characteristics are observed in each group of tests. The deformation process goes through three different stages, i.e., the dry-state loading stage, the wetting state, and the post-wet-loading stage.
In the dry-state loading stage, the specimen is in a dry state and deforms under axial loading. The specimen enters the wetting stage when the axial stress reaches the required value. A constant axial stress was applied over the entire duration of the wetting state. According to Figure 3, the shear shrinkage of the volumetric strain in the wetting stage is more significant than that in the dry-state loading stage under the same stress state. After wetting, the sample reaches a saturated state. In the post-wet loading stage, the initial slope of the (σ1–σ3)~ε1 curve is significantly more steep than that of the dry-state loading curve under the same stress state. The slope of the (σ1–σ3)~ε1 curve represents the tangential modulus of the specimen, and the tangential modulus of the post-wet loading stage is larger than that of the dry-state loading stage, which indicates that wetting deformation causes the hardening of the gravelly soil core material. For the (σ1–σ3)~ε1 curves, the final peak stress of the samples is very close at different stress levels. For the ε v ε 1 curves, the increase in the total volume changes with an increasing stress level; however, their final volumetric strains are approximately equal. This indicates that the stress level during wetting does not affect the ultimate bearing capacity of the sample.

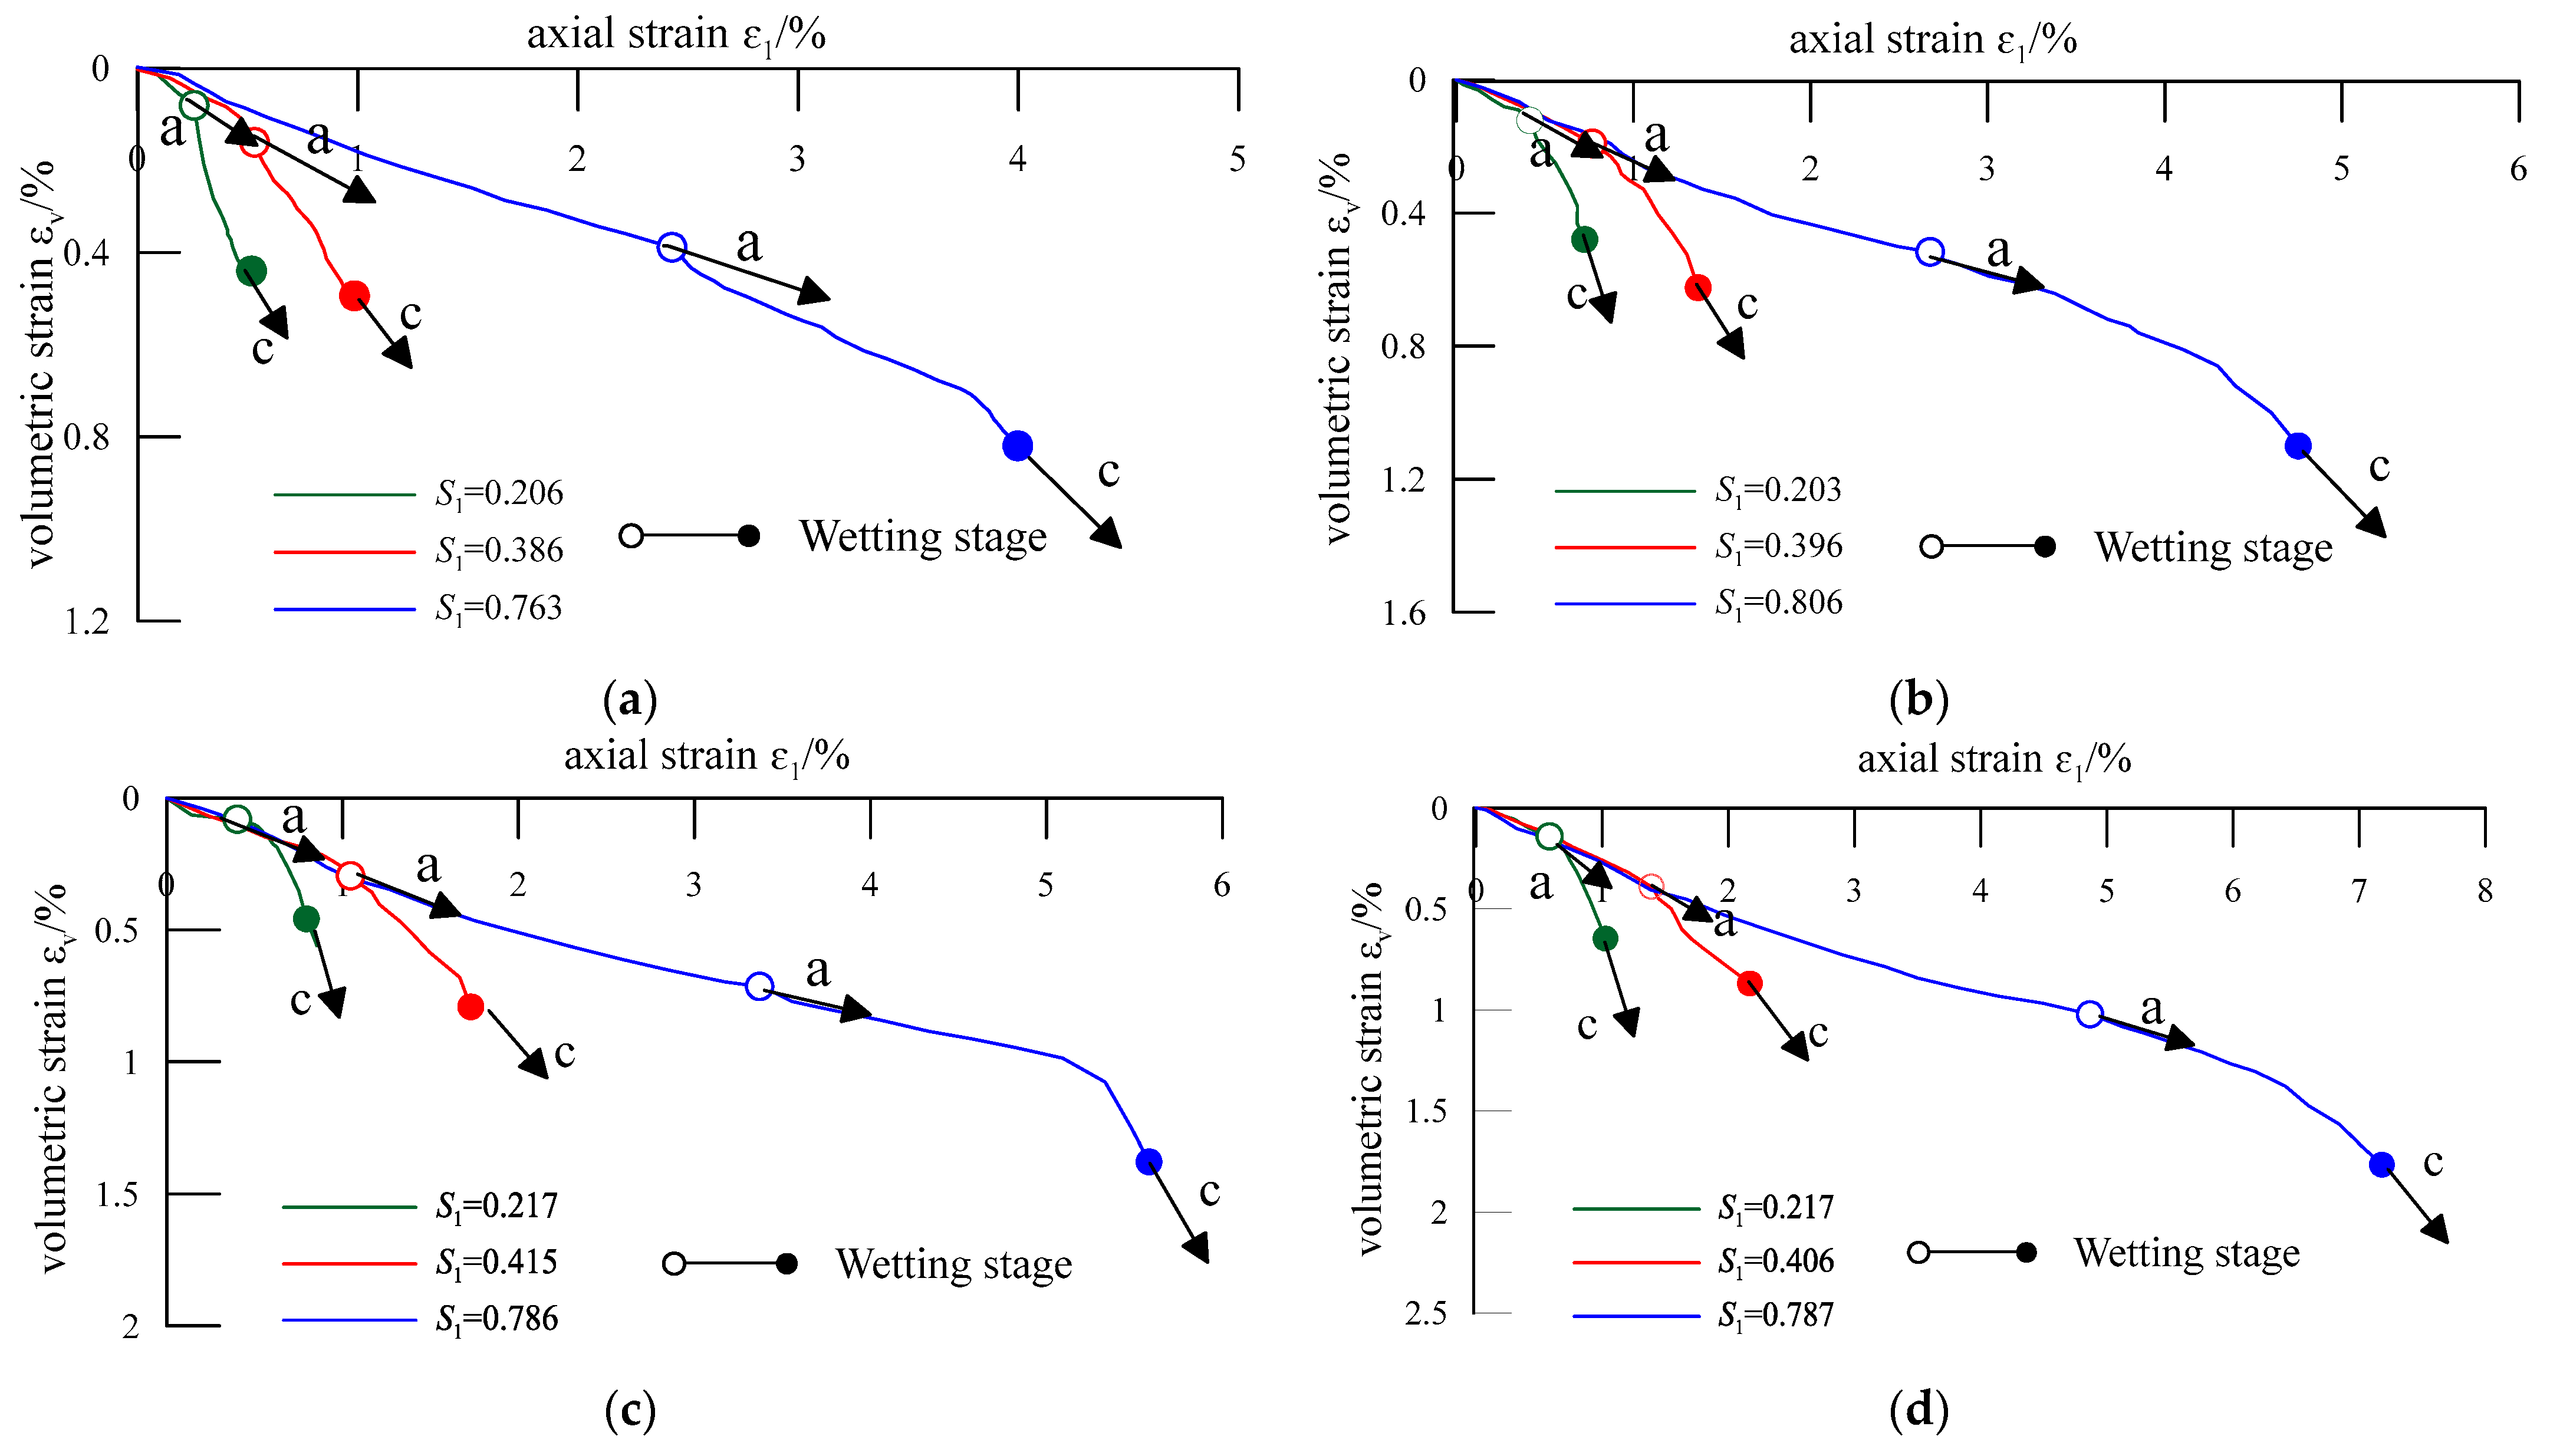
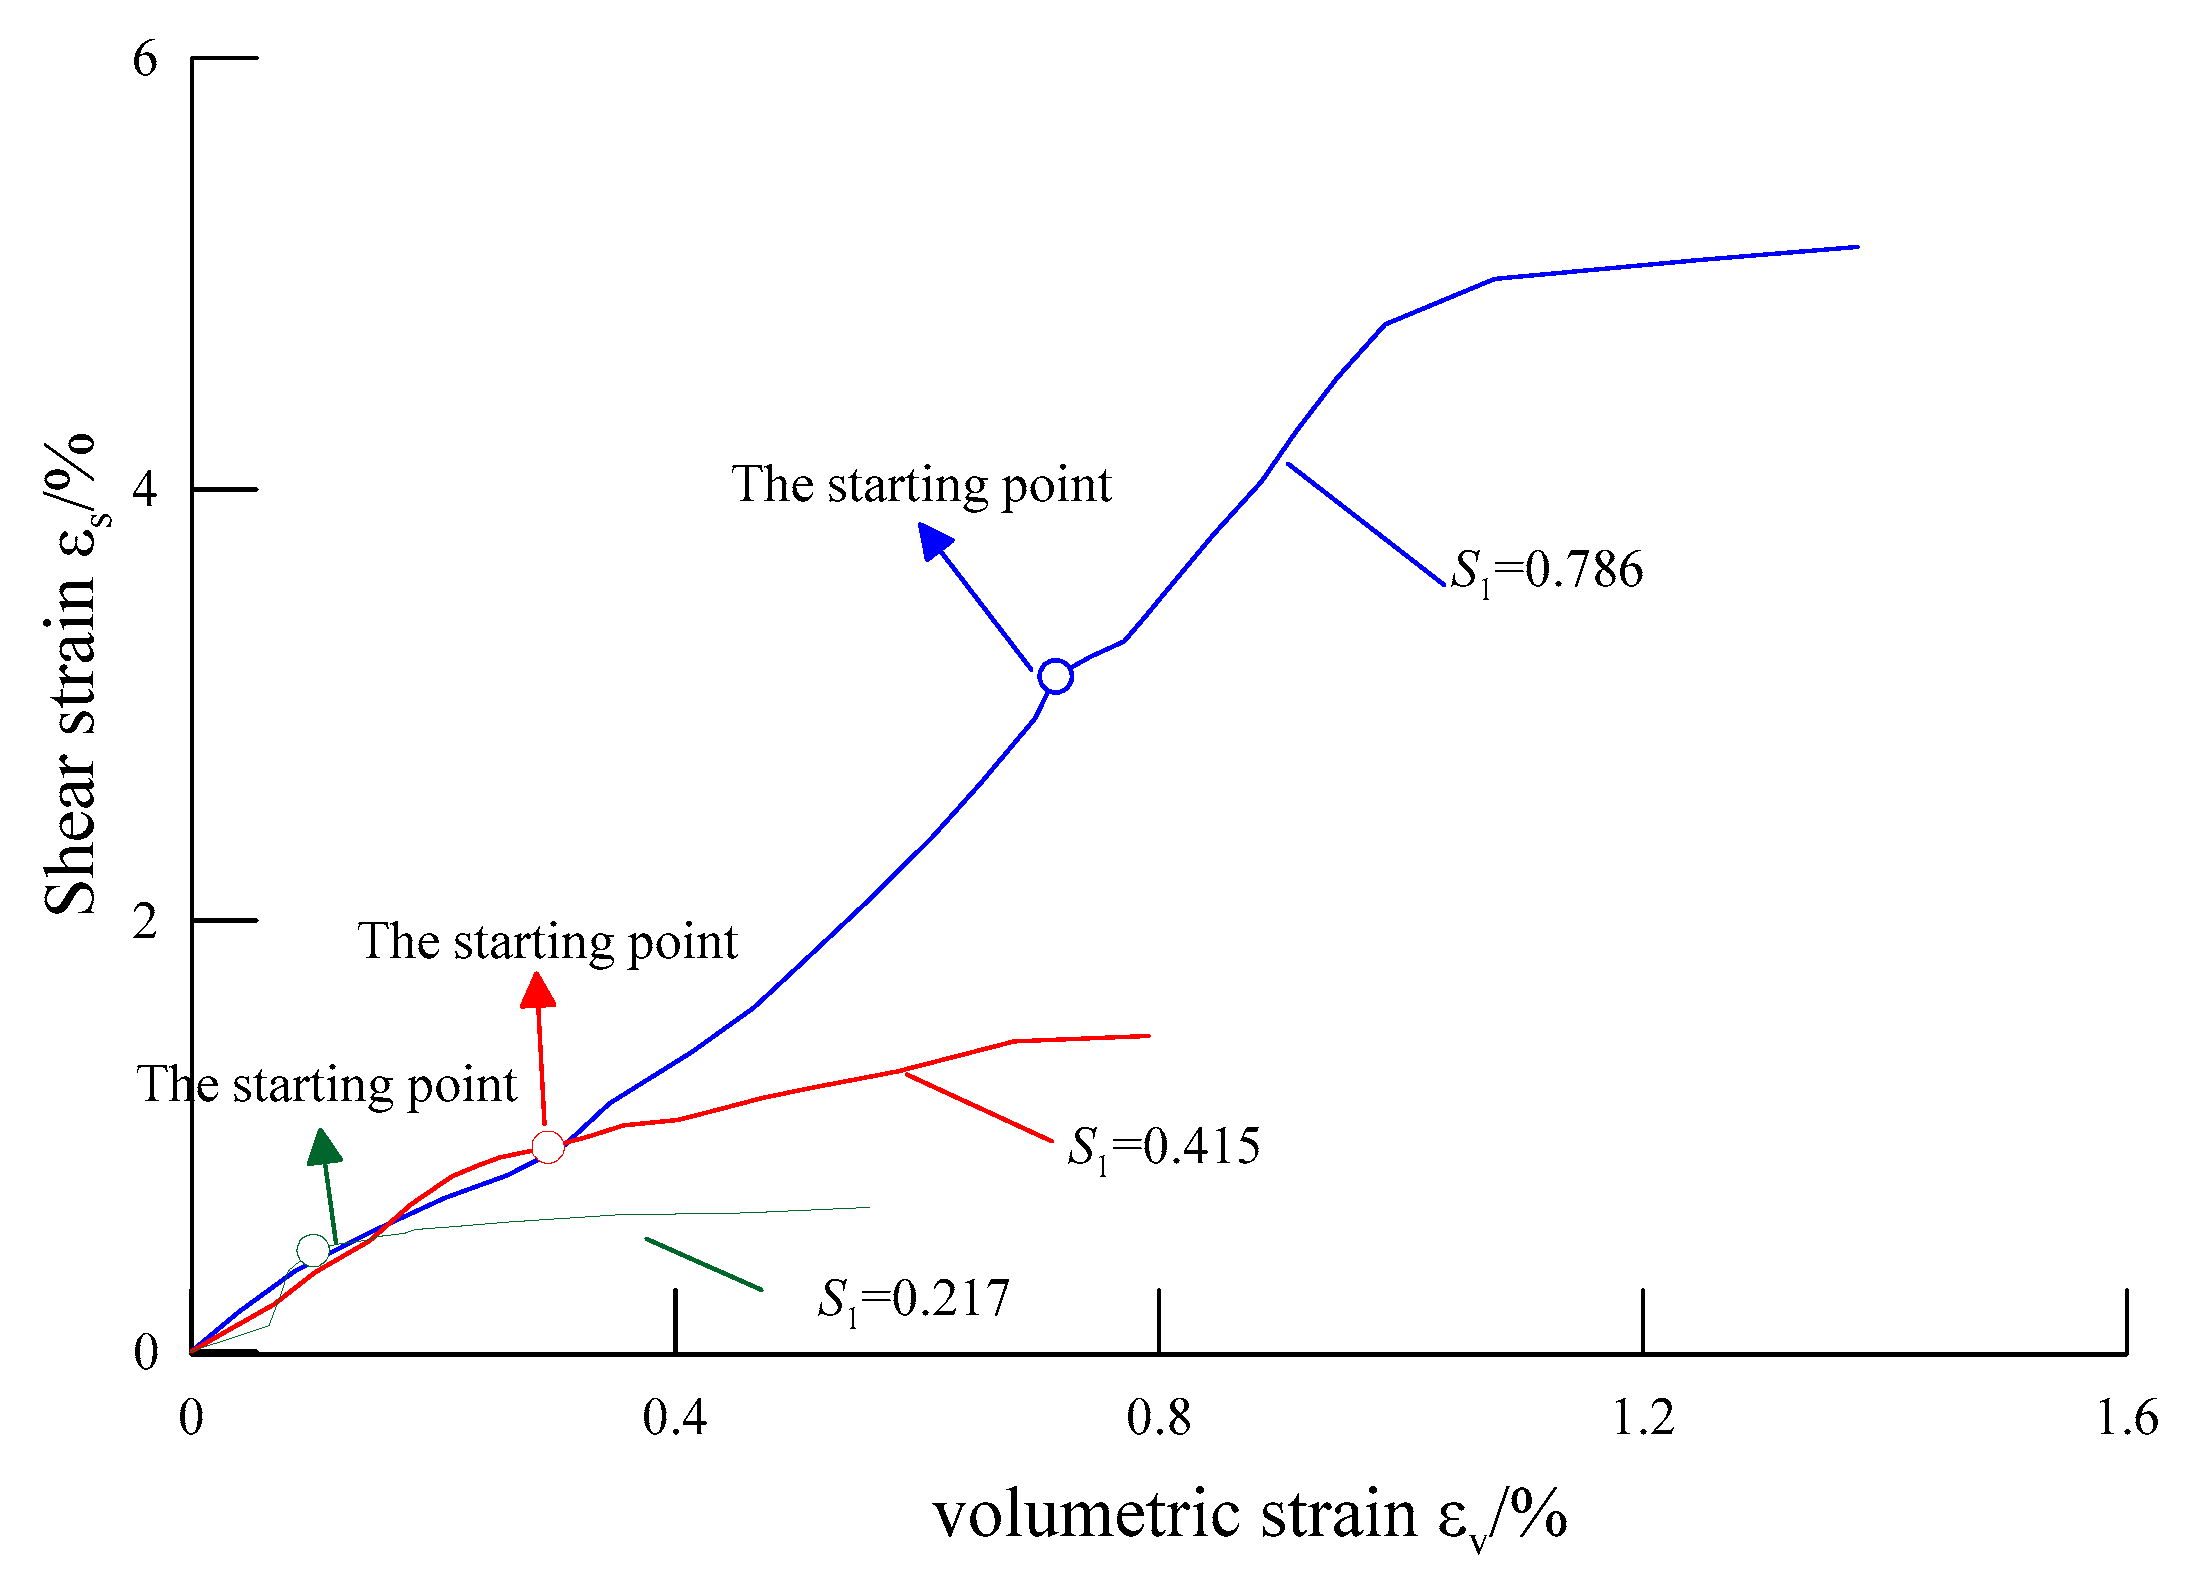
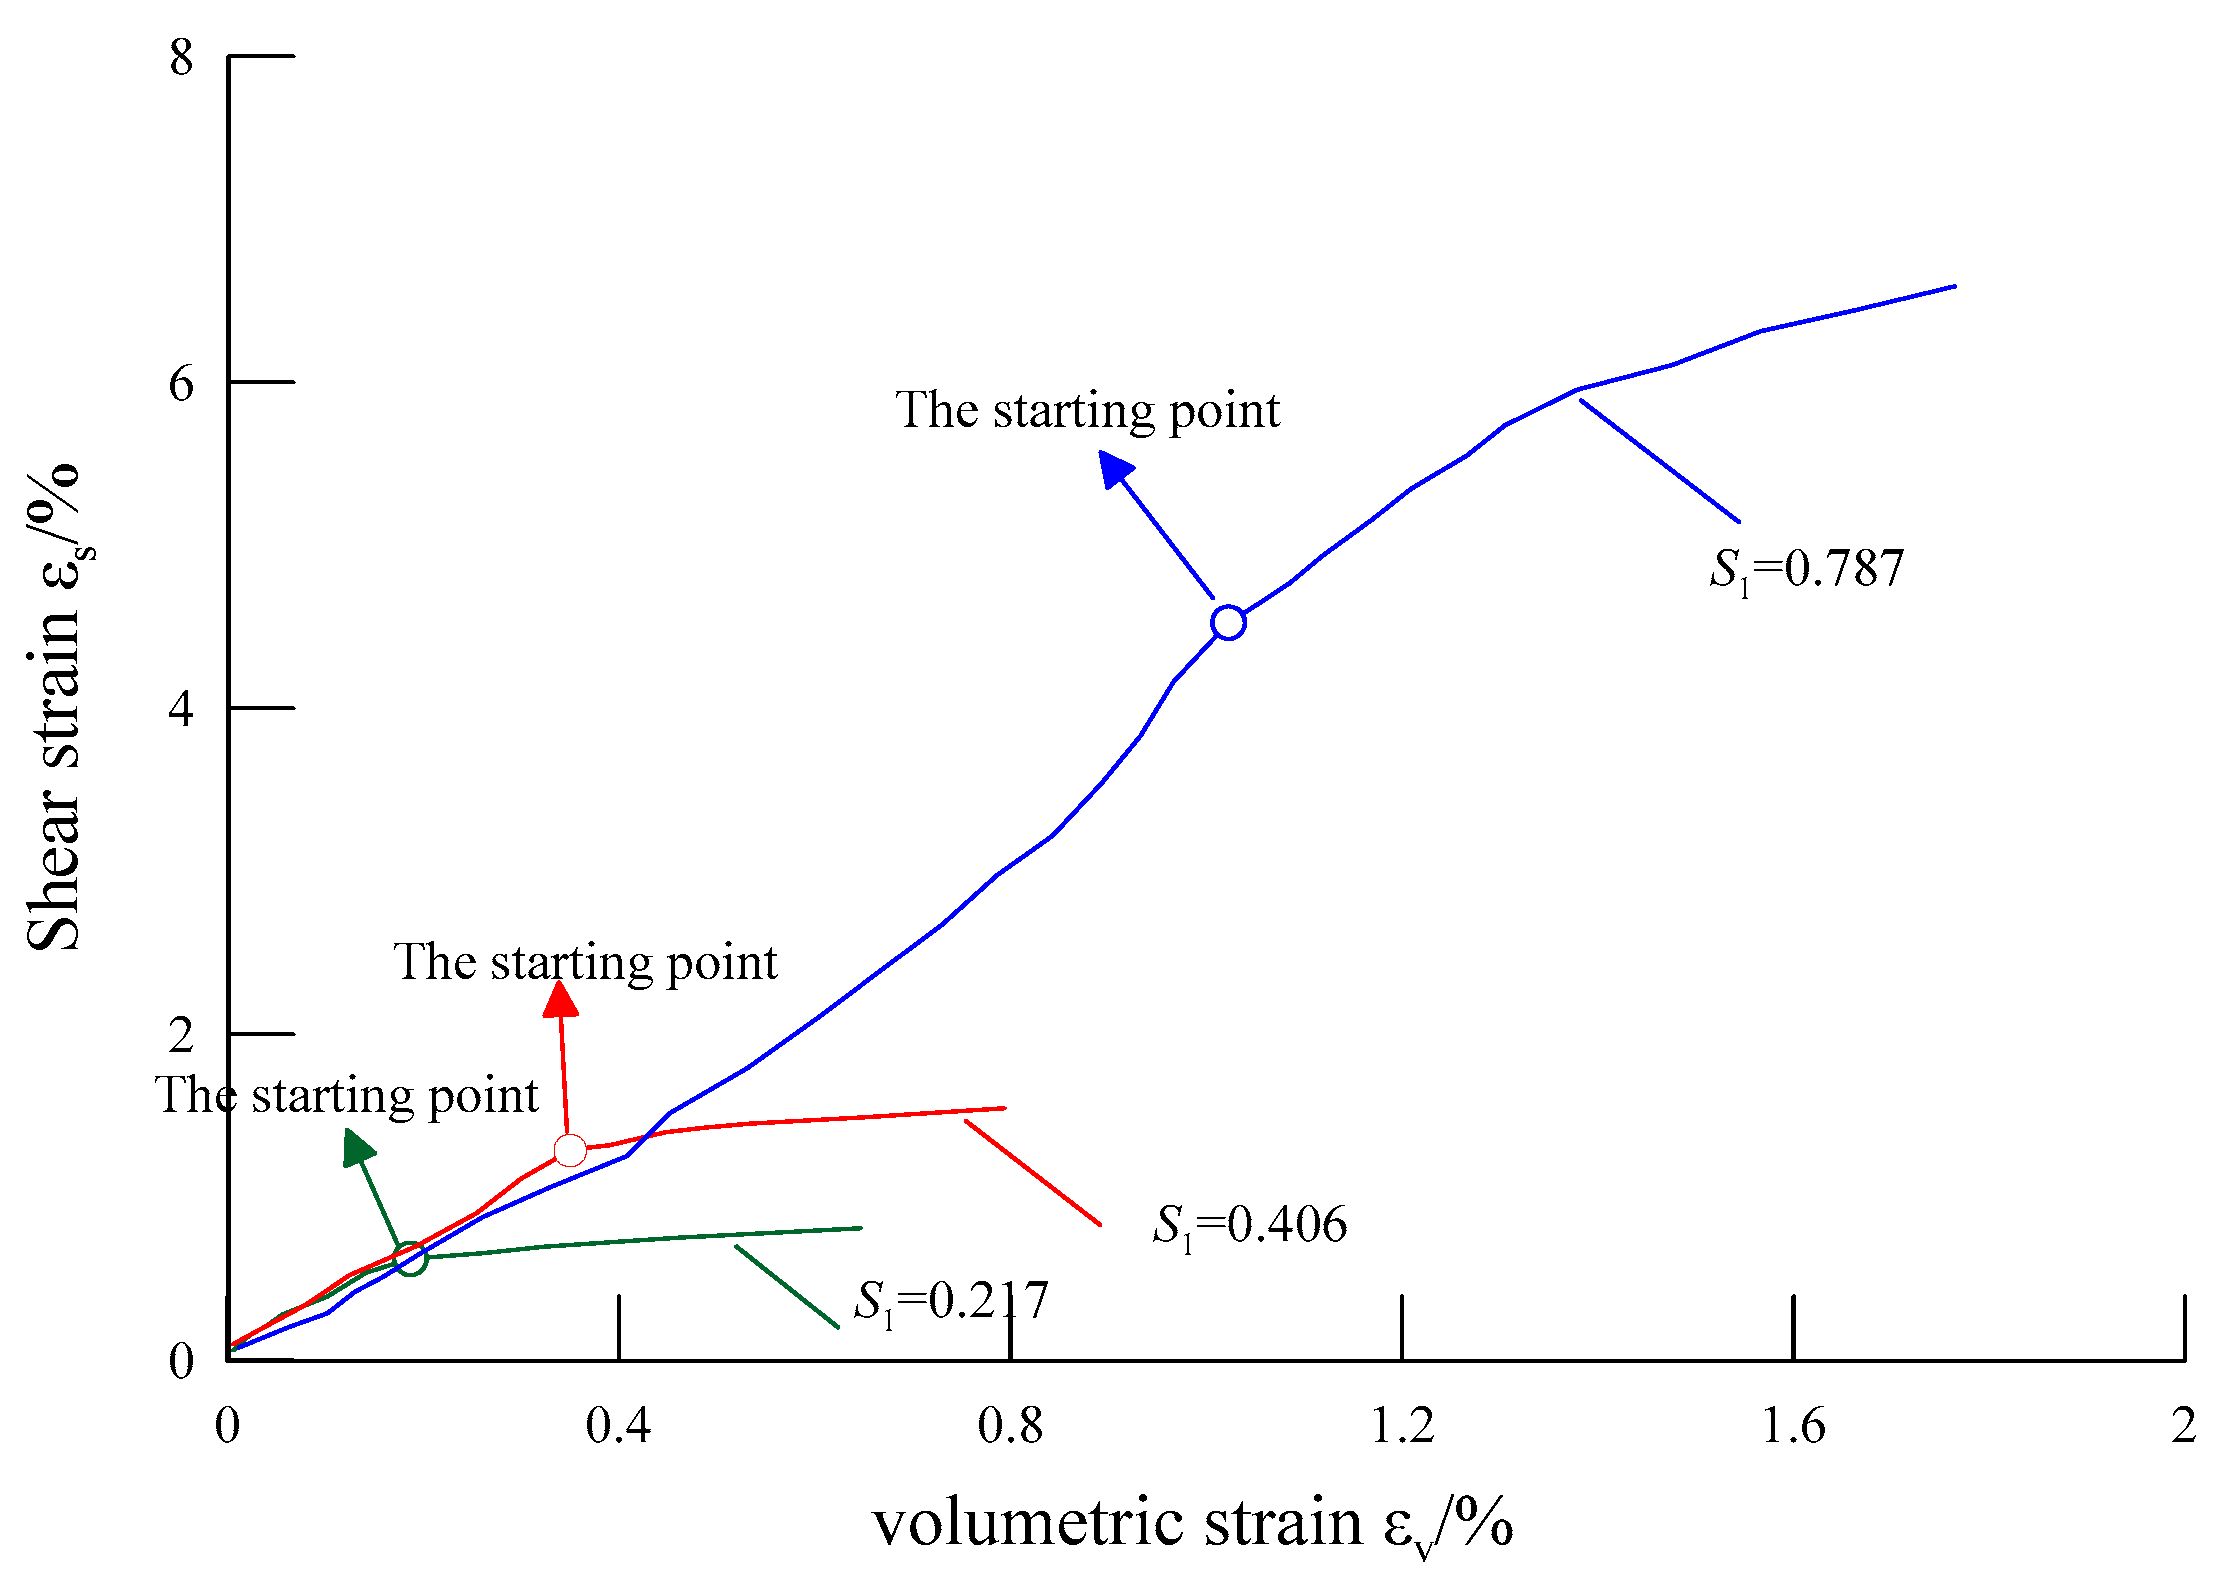
3.2. Deformation Characteristics of the Specimen

Determining the direction of the wetting strain increase is one of the core requirements of establishing the wetting calculation model of the gravelly soil core material. Assuming that no elastic deformation occurs during the wetting process, all strain is assumed to be plastic. Figure 4 shows the relationship between the volumetric strain, εv, and the axial strain, ε1, in the dry-state loading stage and wetting state under different confining pressures and stress levels. The direction of the wetting strain increase refers to the increase relationship between the wetting volumetric strain and the wetting axial strain; thus, it can be directly determined using the experimental data obtained from the wetting test. In Figure 4, arrow a represents the direction of the dry-state loading strain increase; arrow c represents the direction of the wetting deformation increase.
It is generally believed that the direction of the wetting strain increase remains unchanged throughout the wetting process [13,20], but the experimental results show the converse. According to Figure 4, the direction of the wetting deformation increase exhibits different behaviors under different stress levels. At low stress levels, compared with direction arrow a, the direction of the strain increase changes significantly when wetting begins. This suggests that the direction features of the wetting strain appear to differ from those displayed during dry-state loading. At high stress levels, the initial wetting strain increase direction is essentially consistent with that of the dry-state loading strain under the same conditions, and the strain increase direction significantly changes at a later stage of wetting deformation. Ding et al. compared rheological and wetting features and suggested that the characteristics in the later stage of wetting at high stress levels are similar to those displayed by the rheological behavior [22].
Figure 5 and Figure 6 illustrate the relationship between the volumetric strain and shear strain during the dry-state loading stage and in the wetting state under two typical confining pressures and three different stress levels. According to Figure 5 and Figure 6, the direction of the wetting plastic flow is typically linear at low stress levels, but, at high stress levels, in the early and late stages of plastic flow, this may occur in two different directions. From the above discussion, it can be seen that the development of the wetting strain direction is very complex. The direction of the wetting strain is not only related to the material itself, but also to the stress level. Different stress levels represent different initial states, corresponding to the different internal structures and strengths of the samples, and they influence the evolution of the wetting strain direction.

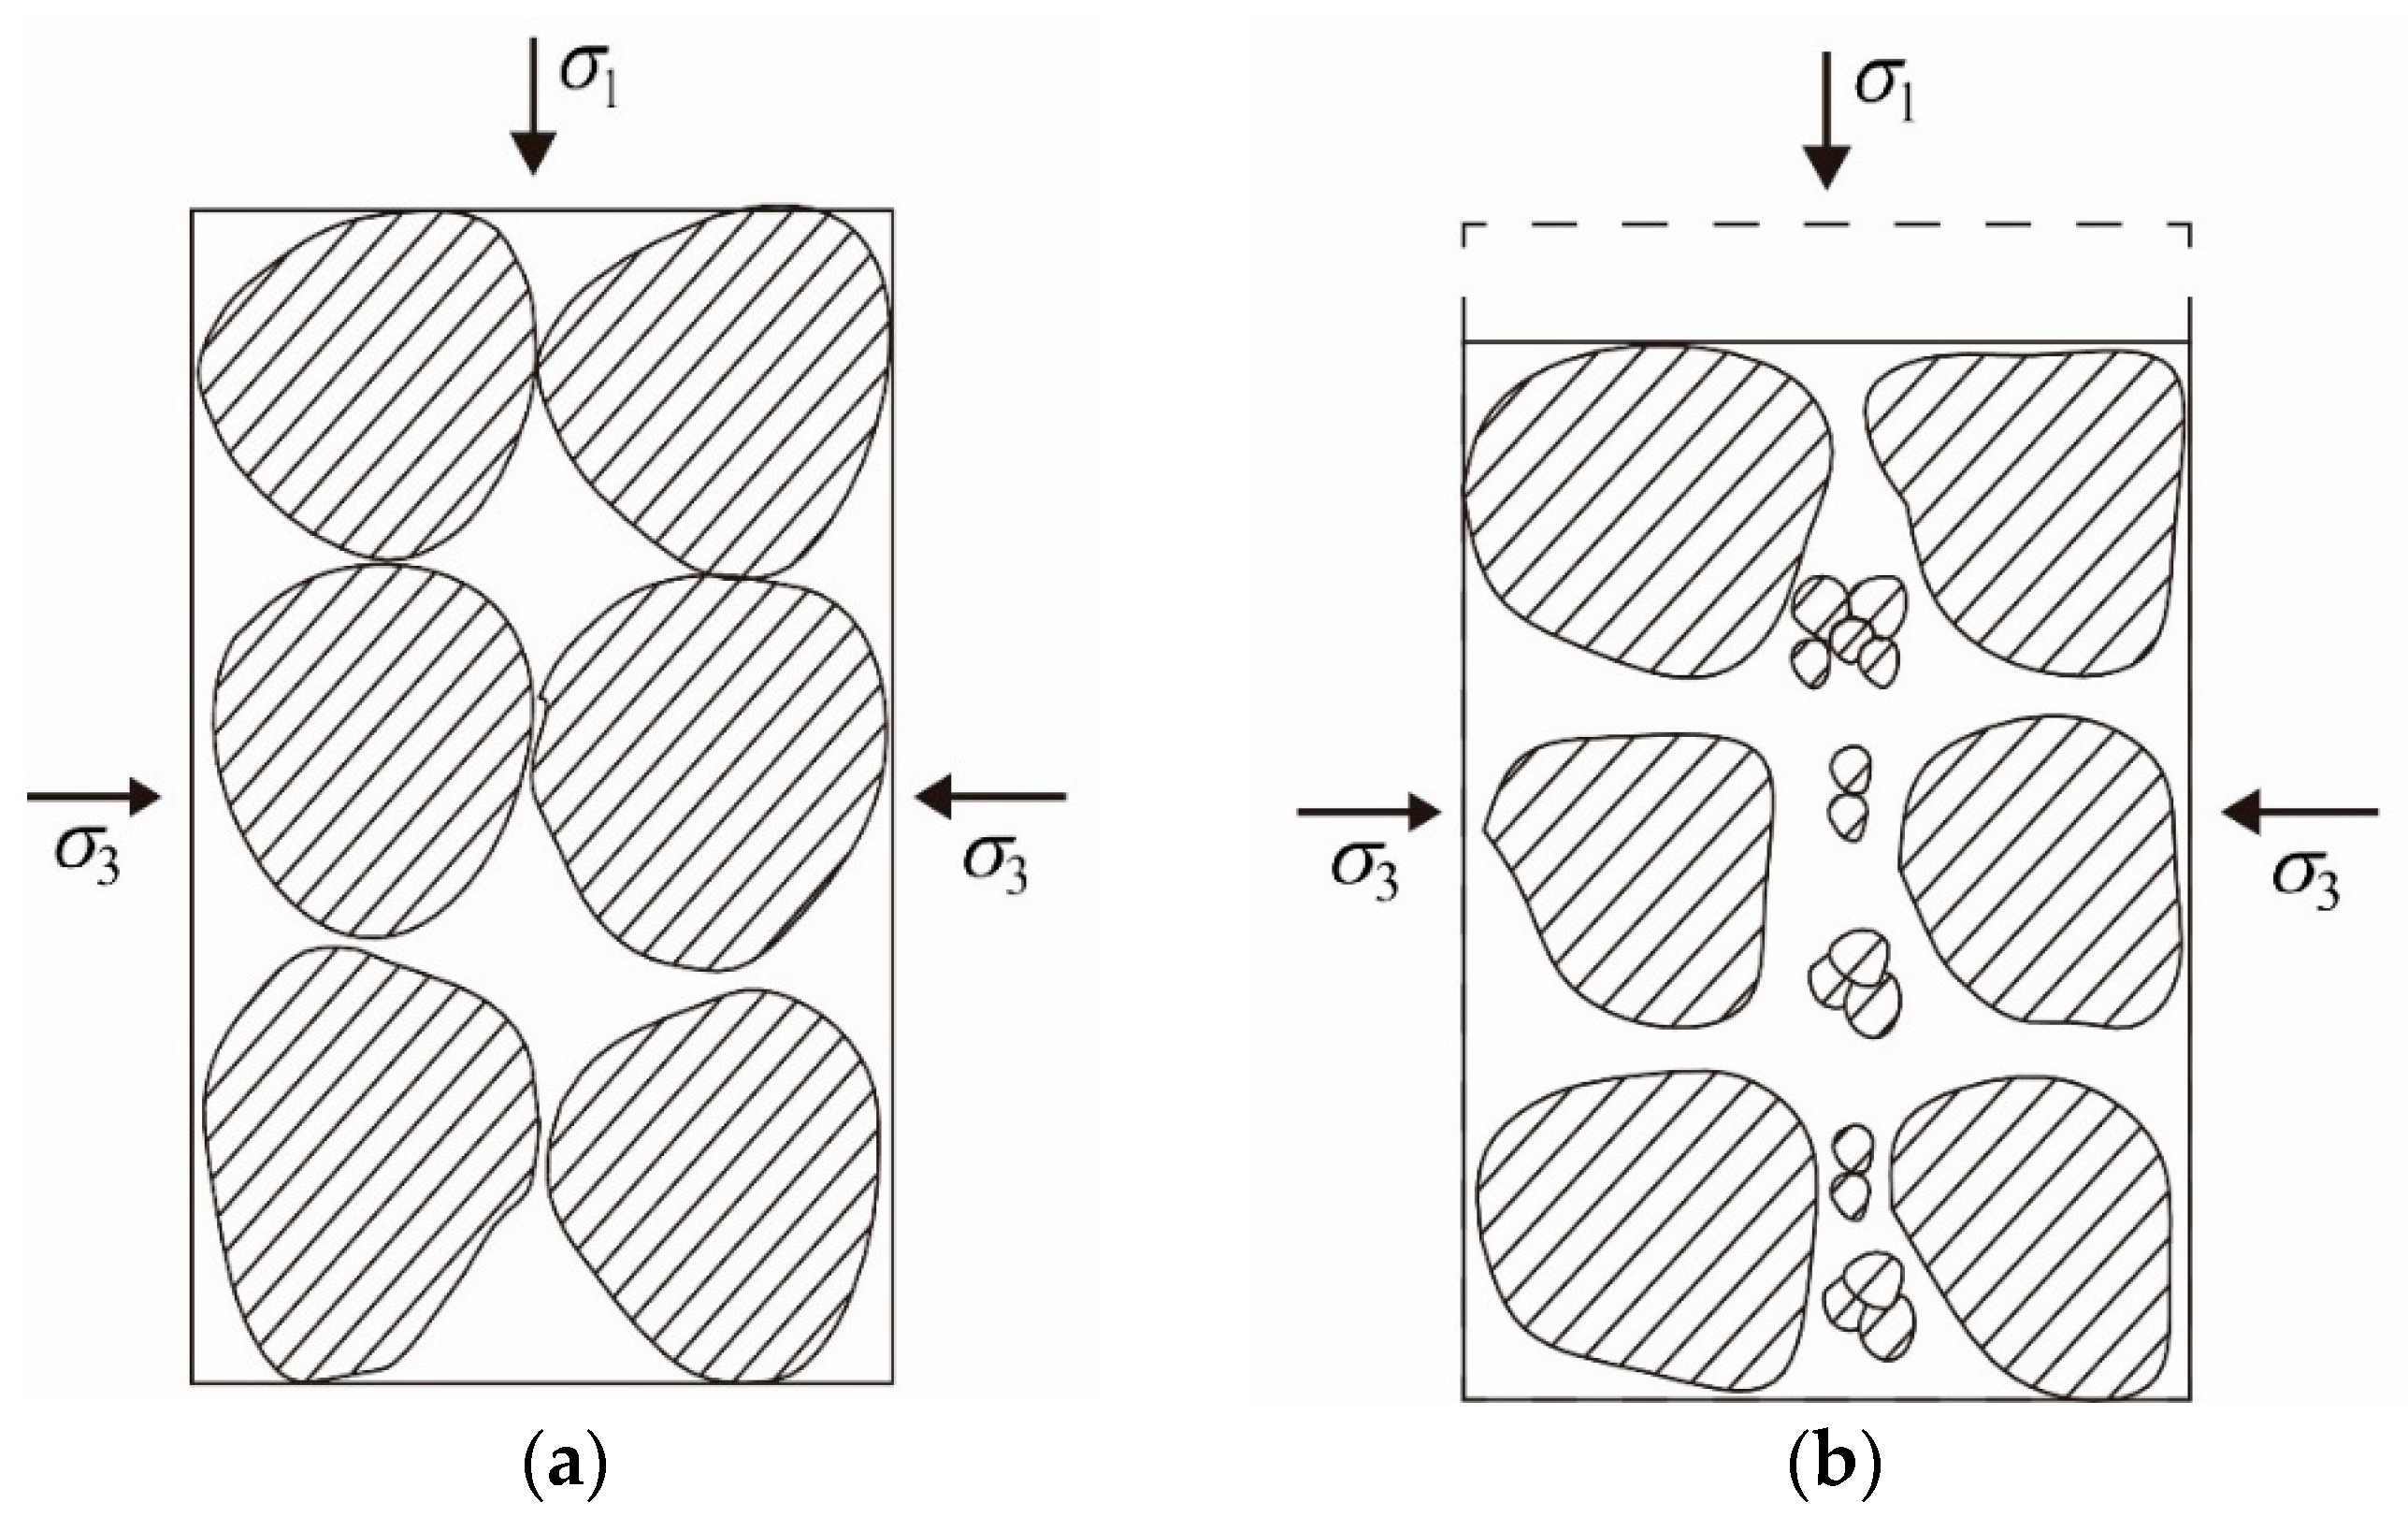
3.3. Discussion on Wetting Mechanism

The interaction of water with soil is what causes wetting deformation; as water enters soil particles, the strength and coefficient of the friction of the particles tend to decrease [14]. This weakening of the material is thought to be the source of wetting deformation. During the wetting process, soil particles soften upon encountering water, leading to changes in the original soil structure. Pre-existing microcracks within the soil particles may also rapidly expand, causing particle fracturing and a rearrangement into a new stable structure [15,16].
As shown in Figure 7, the dry specimen is in an equilibrium state before wetting. When wetting occurs, the strength of the specimen is reduced due to softening, the equilibrium state is broken, and additional stresses within the particles are generated. Thus, the specimen will be deformed until it reaches a new equilibrium state again under a constant external load. During this process, the particles are broken and rearranged; the weakened bearing capacity is reinforced. In the process of wetting, the sample is subjected to a cycle of water immersion, softening, particle breakage, and structural rearrangement. Due to the external load acting on the specimen being kept constant, the reduced bearing capacity due to the material weakening is equal to that restored via the rearrangement of the specimen particles. The specimen is returned to its pre-wetting strength through the two effects. Therefore, wetting does not affect the final bearing capacity of the specimen.
In the dry-state loading stage, particle rearrangement can increase the compactness of the specimen, leading to a denser initial state when wetting begins under a high stress level. Under high axial stress, there can be significant particle rearrangements, resulting in greater wetting deformation. However, the wetting direction is limited by high axial stress; the wetting deformation increase along the stress direction may be relatively small. Despite the particle rearrangement and denser initial state, wetting deformation may not exhibit a large change in the stress direction. Conversely, at low stress levels, the wetting direction is more free, allowing for a more pronounced incremental change along the stress direction. In this case, the wetting deformation may exhibit a more noticeable change along the applied stress direction. Therefore, the direction of wetting is significantly affected by the stress level.

4. Constitutive Modeling for Wetting

4.1. Calculation of Wetting Deformation

The continuous evolution of the strain direction during wetting has posed challenges to establishing constitutive models. In the practice of engineering, Shen’s wetting model [24] is usually used to characterize wetting deformation. In this model, the wetting volumetric strain, ε υ , is kept constant while the wetting shear strain, ε s , is considered to satisfy a hyperbolic relationship with the stress level, Sl.
ε s = d w S 1 1 S 1 ,
ε υ = c w ,
where ε υ is the total wetting volumetric strain, ε s is the total wetting shear strain, and d w and c w are parameters.
The wetting shear strain data can be fitted well with Equation (1). Figure 8 shows the wetting test data and fitting curve of this study. This equation can effectively fit the shear strain, as the wetting shear strain increases with an increasing stress level. When the stress level approaches 1, the shear strain tends towards infinity.
However, the wetting volumetric strain cannot be described by Equation (2), and the results given by scholars are also significantly different. The wetting volumetric strain is not constant and exhibits different behaviors in different experiments. Some researchers believe that the wetting volumetric strain is influenced by the confining pressure [33,34], while others suggest that it is influenced by both the confining pressure and stress level [35].
Figure 9 shows the relationship between the wetting strain ratio, ε υ / ε 1 , and the stress level, Sl. According to Figure 9, the wetting strain ratio gradually declines as the stress level increases, and it exhibits a nonlinear relationship with the stress level. It has been found that the wetting strain ratio, ε υ / ε 1 , has an exponential function relationship with the stress level, Sl:
ε υ ε 1 = a w exp ( b w S 1 ) ,
where ε 1 is the total wetting axial strain, and a w and b w are parameters that can be determined via the test.
Under the conventional triaxial conditions,
ε s = ε 1 1 3 ε υ
Substituting Equation (4) into Equation (3) yields
ε s ε v = 3 a w exp ( b w S 1 ) 3 a w exp ( b w S 1 )
Then, according to Equations (1) and (5), ε υ can be obtained as follows:
ε υ = d w 3 a w exp ( b w S 1 ) 3 a w exp ( b w S 1 ) S 1 1 S 1
Equation (6) is the final calculation model for the wetting volumetric strain. The model includes the three parameters of d w , a w , and b w .
The model parameters are determined by a set of experimental data with different confining pressure and stress levels. The wetting shear strain parameter, d w , was determined using Equation (1), and the results are shown in Figure 8. The wetting shear strain parameters, a w and b w , were determined using Equation (3), and the results are shown in Figure 9.

4.2. Evaluation of the Wetting Model

In this study, based on the results of the triaxial wetting tests conducted using the core wall material collected from a hydropower station, the model parameters are determined as d w = 0.508, a w = 2.136, and b w = −2.538. Based on the preceding discussion, according to the wetting axial strain, the wetting volumetric strain under different stress levels can be obtained from Equation (3). Table 2 lists both the test data and the fitting data results of the wetting volumetric strain. The fitting data accurately reflect the characteristics of the wetting volumetric strain, which demonstrates the rationality of Equation (3).
According to the discussion in Section 3.2, the wetting direction exhibits different behaviors under different stress levels. Therefore, assuming that the wetting direction is constant and neglecting the change in the wetting direction at high stress levels, the wetting model can be simplified by approximating it with a straight line. Meanwhile, the wetting shear strain can be calculated according to Equation (4).
Figure 10 and Figure 11 show the test results, as well as the corresponding model-simulated results, under the different confining pressures. The results show that the wetting calculation model satisfactorily reflects the characteristics of the wetting strain’s evolution. Due to the neglect of the wetting direction changes under high stress levels, the simulation results at high stress levels may show some deviations. However, they still provide an overall reflection of the wetting deformation characteristics of the gravelly soil core material.

5. Conclusions

Triaxial wetting tests were performed to investigate the wetting deformation mechanism of gravelly soil core material. Based on the test results, the characteristics of wetting deformation are discussed, and a new wetting deformation model is proposed. The main conclusions can be drawn as follows.
(1) The strain path during wetting differs from the strain path during the loading phase. The shear contraction characteristic of the volumetric strain is more pronounced during wetting compared to loading. At high stress levels, the evolution of the wetting strain direction lags behind that of the wetting deformation, and a significant volumetric contraction is observed in the later stages of wetting.
(2) The mechanism of the wetting deformation of the gravelly soil core materials was analyzed. Material weakening is thought to be the source of wetting deformation. The coupling effect of particulate rearrangement and wetted weakening returns the gravelly soil core material to its pre-wetting bearing capacity state while wetting deformation takes place.
(3) The relationship between the wetting strain ratio and stress level follows an exponential function. Based on this, a wetting calculation model suitable for gravelly soil core material has been derived, which can effectively predict the wetting deformation quantity and behavior.
A thorough grasp of the wetting deformation characteristics of the dam body materials would be beneficial for gaining a more precise understanding of the operational state of the dam as well as provide some reference values for future studies. In this study, only the gravel core wall materials were investigated to reveal the wetting deformation mechanism and characteristics. The wetting deformation of other core wall materials or dam body materials cannot be ignored, which is the aspect of this area of study that needs supplementary research in the future.

Author Contributions

Methodology, G.L. and Z.M.; validation, Y.Q., K.F. and Z.M.; writing—original draft preparation, Y.Q. and Z.M.; writing—review and editing Y.Q. and K.F. All authors have read and agreed to the published version of the manuscript.

Funding

This work is supported by the Science and Technology Major Project of Tibetan Autonomous Region of China (No. XZ202201ZD0003G) and the Department of Water Resources of Jiangxi Province Science and technology project (No. 202124ZDKT06).

Institutional Review Board Statement

Not applicable.

Informed Consent Statement

Not applicable.

Data Availability Statement

The data presented in this study are available in article.

Conflicts of Interest

The authors declare no conflict of interest.

References

  1. Shi, H.; Chen, J.; Liu, S.; Sivakumar, B. The Role of Large Dams in Promoting Economic Development under the Pressure of Population Growth. Sustainability 2019, 11, 2965. [Google Scholar] [CrossRef]
  2. Sánchez-Martín, J.; Galindo, R.; Arévalo, C.; Menéndez-Pidal, I.; Kazanskaya, L.; Smirnova, O. Optimized Design of Earth Dams: Analysis of Zoning and Heterogeneous Material in Its Core. Sustainability 2020, 12, 6667. [Google Scholar] [CrossRef]
  3. Jia, Y.F.; Yao, S.E.; Chi, S.C. Experimental study on wetting of coarse-grained soil under constant stress ratio path. Chin. J. Geotech. Eng. 2019, 41, 648–654. [Google Scholar] [CrossRef]
  4. Heitor, A.; Parkinson, J.; Kotzur, T. The Role of Soil Stabilisation in Mitigating the Impact of Climate Change in Transport Infrastructure with Reference to Wetting Processes. Appl. Sci. 2021, 11, 1080. [Google Scholar] [CrossRef]
  5. Riaz, S.; Kikumoto, M.; Basharat, M.; Putra, A.D. Wetting Induced Deformation of Soils Triggering Landslides in Pakistan. Geotech. Geol. Eng. 2021, 39, 5633–5649. [Google Scholar] [CrossRef]
  6. Roosta, R.M.; Alizadeh, A. Simulation of collapse settlement in rockfill material due to saturation. Int. J. Civ. Eng. 2012, 10, 93–99. [Google Scholar]
  7. Fu, Z.Z.; Chen, S.; Liu, S. Hypoplastic constitutive modelling of the wetting induced creep of rockfill materials. Sci. China Technol. Sci. 2012, 55, 2066–2082. [Google Scholar] [CrossRef]
  8. Li, Z. Study on Collapsibility of Earth Rock Dam during Initial Impoundment. Master’s Thesis, Tsinghua University, Beijing, China, 1986. [Google Scholar]
  9. Jia, Y.; Xu, B.; Chi, S.; Xiang, B.; Xiao, D.; Zhou, Y. Joint back analysis of the creep deformation and wetting deformation pa-rameters of soil used in the Guanyinyan composite dam. Comput. Geotech. 2018, 96, 167–177. [Google Scholar] [CrossRef]
  10. Zhang, B.Y.; Yu, Y.; Zhang, J. Some key technical problems of high earth-rock dam. In Proceedings of the 9th China Civil Engineering Society Academic Conference on Soil Mechanics and Geotechnical Engineering, Beijing, China, 25–28 October 2003. [Google Scholar]
  11. Nobari, E.S.; Duncan, J.M. Movements in dams due to reservoir filling. In Proceedings of the Specialty Conference on Performance of Earth and Earth-Supported Structures, Lafayette, IN, USA, 11–14 June 1972; ASCE: New York, NY, USA, 1972; pp. 797–815. [Google Scholar]
  12. Liu, Z.d. Some problems about the calculation of deformation of earth-rock dams. Chin. J. Geotech. Eng. 1983, 5, 1–13. [Google Scholar]
  13. Zuo, Y.Z.; Cheng, Z.L.; Pan, J.J.; Zhou, Y.F.; Zhao, N. Experiment and law analysis of three-axis wetting deformation of gravel soil core wall material. Chin. J. Geotech. Eng. 2020, 42, 37–42. [Google Scholar]
  14. Cheng, Z.L.; Zuo, Y.Z.; Ding, H.S.; Jiang, J.S.; Kong, X.Y. Experimental study on Wetting Characteristics of rockfill. Chin. J. Geotech. Eng. 2010, 32, 243–247. [Google Scholar]
  15. Nan, J.J.; Peng, J.B.; Zhu, F.J.; Zhao, J.Y.; Leng, Y.Q. Multiscale characteristics of the wetting deformation of Malan loess in the Yan’an area, China. J. Mt. Sci. 2021, 18, 1112–1130. [Google Scholar] [CrossRef]
  16. Ovalle, C.; Dano, C.; Hicher, P.Y.; Cisternas, M. An experimental framework for evaluating the mechanical behaviour of dry and wet crushable granular materials based on the particle breakage ratio. Can. Geotech. J. 2015, 52, 1–12. [Google Scholar] [CrossRef]
  17. Shao, X.Q.; Chi, S.C.; Tao, Y.; Zhou, X.X. DEM simulation of the size effect on the wetting deformation of rockfill materials based on single-particle crushing tests. Comput. Geotech. 2020, 123, 103429. [Google Scholar] [CrossRef]
  18. Kast, K.; Brause, J. Influence of the extent of Geological Disintegration in the Behavior of Rockfill. In Proceedings of the 11th International Conference on Soil Mechanics and Foundation, San Francisco, CA, USA, 12–16 August 1985; pp. 131–134. [Google Scholar]
  19. Jie, Y.X.; Zhang, Y.Y.; Yang, G.H. Calculation method of wet deformation of earth-rock materials. Rock Soil Mech. 2020, 40, 11–12. [Google Scholar] [CrossRef]
  20. Jia, Y.; Xu, B.; Chi, S.; Xiang, B.; Xiao, D.; Zhou, Y. Particle Breakage of Rockfill Material during Triaxial Tests under Complex Stress Paths. Int. J. Geomech. 2019, 19, 04019124. [Google Scholar] [CrossRef]
  21. Zuo, Y.Z.; Cheng, Z.L.; Pan, J.J.; Zhou, Y.F.; Zhao, N. Difficulties and solutions of wetting deformation test of gravelly soil core wall material. Rock Soil Mech. 2023, 44, 2170–2176. [Google Scholar] [CrossRef]
  22. Ding, Y.H.; Zhang, B.Y.; Qian, X.X.; Yin, Y.; Sun, S. Experimental study on wetting deformation characteristics of rockfill. Rock Soil Mech. 2019, 40, 2975–2988. [Google Scholar] [CrossRef]
  23. Yin, Y.; Wu, Y.K.; Ding, Y.H.; Zhang, B.Y.; Sun, S. Study on unsaturated wetting deformation characteristics of rockfill. Chin. J. Rock Mech. Eng. 2021, 40, 3455–3463. [Google Scholar]
  24. Shen, Z.J.; Xie, X. Stress-Strain Analysis on Tieshan Earth Dam; Nanjing Hydraulic Research Institute: Nanjing, China, 1989. [Google Scholar]
  25. Yin, Y.; Wu, Y.; Zhang, B.; Ding, Y.; Sun, X. Two-stage wetting deformation behaviour of rock-fill material. Environ. Geotech. 2019, 9, 94–107. [Google Scholar] [CrossRef]
  26. Bauer, E. Constitutive modelling of wetting deformation of rockfill materials. Int. J. Civ. Eng. 2018, 17, 481–486. [Google Scholar] [CrossRef]
  27. Chi, S.C.; Zhou, X.X. Wetting deformation model of rockfill. Chin. J. Geotech. Eng. 2017, 39, 48–55. [Google Scholar]
  28. Wu, Y.K.; Yin, Y.; Zhang, B.Y.; Sun, X.; Yu, Y.Z. Unsaturated Wetting Deformation Characteristics of a Granite Rockfill under Rainfall Conditions. Can. Geotech. J. 2022, 59, 1774–1792. [Google Scholar] [CrossRef]
  29. Zhu, J.G.; Mohamed, A.A.; Gong, X.; Xuan, X.Y.; Ji, E.Y. Triaxial experimental study on wetting characteristics of a SLATE coarse material. Chin. J. Geotech. Eng. 2013, 35, 170–174. [Google Scholar]
  30. Zhou, X.X.; Chi, S.C.; Jia, Y.F. Research on wetting deformation characteristics of coarse grained materials. Chin. J. Geotech. Eng. 2019, 41, 1943–1948. [Google Scholar]
  31. Zhang, H.Y.; Li, X.; Liu, J.L.; Han, P.J.; Yang, Y.G.; Ding, Z.L.; Han, L.W.; Zhang, X.Q.; Wang, S.S. Study on wetting deformation model of coarse-grained materials based on P-Z model and BP neural network. Front. Earth Sci. 2023, 11, 1187032. [Google Scholar] [CrossRef]
  32. Qiu, X.; Li, J.H.; Zeng, B.; Fu, H.Y.; Luo, Z.Y.; Chen, J.C.; Liu, Z.W. Wetting deformation characteristics of high liquid limit red clay under low stress condition. Rock Soil Mech. 2023, 44, 2028–2040. [Google Scholar] [CrossRef]
  33. Li, G.; Liu, Y. Three-dimensional finite element analysis of the wetting deformation of gravel sand material. In Proceedings of the 3rd Young People’s Conference of Geotechnical Mechanics and Engineering, Nanjing, China, 9–12 April 1998; pp. 195–200. [Google Scholar]
  34. Li, Q.; Yu, Y.; Zhang, B.; Shen, Z. Three-dimensional analysis for the wetting deformation of Gongboxia concrete faced rock-fill dam on the Yellow River. J. Hydroelectr. Eng. 2005, 24, 24–29. [Google Scholar] [CrossRef]
  35. Guo, W.L.; Chen, G.; Wu, Y.L.; Wang, J.J. Modeling the wetting deformation behavior of rockfill dams. Geomech. Eng. 2020, 22, 519–528. [Google Scholar] [CrossRef]
Figure 1. Grain size distributions of the prototype and tested material.
Applsci 13 13295 g001
Figure 2. Large-scale triaxial wetting testing apparatus.
Applsci 13 13295 g002
Figure 3. Results of triaxial wetting test: (a) σ3 = 400 kPa; (b) σ3 = 800 kPa; (c) σ3 = 1200 kPa; (d) σ3 = 2000 kPa.
Applsci 13 13295 g003aApplsci 13 13295 g003b
Figure 4. Characteristics of wetting deformation: (a) σ3 = 400 kPa; (b) σ3 = 800 kPa; (c) σ3 = 1200 kPa; (d) σ3 = 2000 kPa.
Applsci 13 13295 g004
Figure 5. Wetting strain path (σ3 = 1200 kPa).
Applsci 13 13295 g005
Figure 6. Wetting strain path (σ3 = 2000 kPa).
Applsci 13 13295 g006
Figure 7. The model of wetting deformation: (a) sample before wetting; (b) sample after wetting.
Applsci 13 13295 g007
Figure 8. Test data of wetting shear strain and the fitted curves.
Applsci 13 13295 g008
Figure 9. Test data of wetting strain ratio and fitted curves.
Applsci 13 13295 g009
Figure 10. Simulation results for the wetting volumetric strain: (a) σ3 = 400 kPa; (b) σ3 = 800 kPa; (c) σ3 = 1200 kPa; (d) σ3 = 2000 kPa.
Applsci 13 13295 g010
Figure 11. Simulation results for the wetting shear strain: (a) σ3 = 400 kPa; (b) σ3 = 800 kPa; (c) σ3 = 1200 kPa; (d) σ3 = 2000 kPa.
Applsci 13 13295 g011
Table 1. Experimental program of triaxial wetting test.
Confining Pressure/kPaShear Stress Level Sl
4000.206, 0.386, 0.763
8000.203, 0.306, 0.806
12000.217, 0.415, 0.786
20000.217, 0.406, 0.787
Table 2. The test results and fitted values of wetting volumetric strain.
σ3: kPaSlΔε1: %
(Test Data)
Δευ: %
(Test Data)
Δευ: %
(Fitted Data)
4000.2060.2290.3010.290
0.3560.4540.3630.393
0.7631.5700.4310.483
0.2030.3080.3570.393
8000.2030.3080.3570.393
0.3950.5980.4340.469
0.8052.0790.5830.576
12000.2170.3530.4810.435
0.4150.6830.4970.509
0.7862.2130.6630.643
20000.2170.3920.5160.483
0.4060.7620.6050.581
0.7872.3120.7420.670
Disclaimer/Publisher’s Note: The statements, opinions and data contained in all publications are solely those of the individual author(s) and contributor(s) and not of MDPI and/or the editor(s). MDPI and/or the editor(s) disclaim responsibility for any injury to people or property resulting from any ideas, methods, instructions or products referred to in the content.

