Article

New Insights into Bioactive Compounds of Wild-Growing Medicinal Plants

by
Omar Salem
1,
Lidia Szwajkowska-Michałek
1,
Anna Przybylska-Balcerek
1,*,
Tomasz Szablewski
2,
Renata Cegielska-Radziejewska
2,
Dariusz Świerk
3 and
Kinga Stuper-Szablewska
1
1
Department of Chemistry, Poznań University of Life Sciences, 60-637 Poznan, Poland
2
Department of Management of Food Quality and Safety, Poznań University of Life Sciences, 60-637 Poznan, Poland
3
Department of Landscape Architecture, Poznań University of Life Sciences, 60-637 Poznan, Poland
*
Author to whom correspondence should be addressed.
Appl. Sci. 2023, 13(24), 13196; https://doi.org/10.3390/app132413196
Submission received: 18 September 2023 / Revised: 6 October 2023 / Accepted: 28 November 2023 / Published: 12 December 2023
(This article belongs to the Section Applied Biosciences and Bioengineering)

Abstract

:
Plants contain bioactive substances and secondary metabolites that have a variety of functions, including antibacterial, antioxidant, anti-inflammatory, and anticancer activities. In this study, the content of bioactive compounds in five medicinal plants was determined, i.e., Plantago major L., Armoracia rusticana, Hypericum perforatum L., Rumex acetosa L., and Urtica dioica L., from 38 locations. Additionally, the antimicrobial effect of extracts of bioactive compounds from the above-mentioned plants was checked. The experiment used an original method of extracting bioactive compounds. Purpose of the research: the assessment of antimicrobial activity and chemical characterization of extracts obtained using our own method of isolating bioactive compounds from green parts of medical plants in Poland. Based on the research, the presence of bioactive compounds, i.e., phenolic acids and flavonoids, was found in the tested plant extracts. The results of this study suggest that the geographic parameters of the locations where these plants grow have different effects on their biochemical composition and biological activity. The results showed that all tested plants had significant antibacterial activities. Rumex acetose L. showed the highest antimicrobial activity against Escherichia coli and Salmonella enteritidis. These studies supplement the existing literature on the subject with information about the antimicrobial properties of the tested plant extracts that can be used in herbal medicine. The results have significant implications for the pharmaceutical, nutraceutical, and cosmetic sectors, establishing a foundation for future research in this area.

1. Introduction

Medicinal plants have been utilized in traditional folk medicine for a long time, with ancient civilizations depending on them for their medicinal properties and therapeutic effects [1]. These plants have played an essential role in treating various diseases and have been handed down through centuries, retaining knowledge of their medical benefits [2]. Secondary metabolites, referred to as bioactive compounds, are chemical entities in medicinal flora responsible for their curative properties [3]. These compounds possess numerous properties that make them valuable in medicine. These compounds demonstrate various antimicrobial, antioxidant, anti-inflammatory, and anticancer properties [4]. Identifying medicinal plants’ bioactive compounds is essenstial to determining their potential therapeutic applications; they contain substances to treat chronic and infectious diseases [5,6]. In our quest to isolate these substances, we focus on acid and base extraction, a proven method proficient in obtaining these compounds from plants [7]. Additionally, the study gives considerable attention to the antimicrobial attributes of these compounds using the minimum inhibitory concentration (MIC) method. This approach helps to identify the lowest concentration of a compound needed to prevent the growth of particular bacteria, further spotlighting the potential of these compounds in combatting various bacteria [8].
Aside from the medical arena, these bioactive compounds hold immense economic and industrial potential in the pharmaceutical, cosmetic, and food industries. The escalating demand for natural and plant-based ingredients has spearheaded a wave of research and development initiatives, promoting sustainable agricultural practices [1].
Historically celebrated medicinal plants such as Plantago major L. [9,10], Armoracia rusticana [11], Hypericum perforatum L. [12], Rumex acetosa [13], and Urtica dioica L. [14] provide an essential base for our study. This study’s principal finding is the significant difference in bioactive compounds between these plants and their extracts’ antimicrobial effectiveness against various bacteria.
In conclusion, understanding the ancient uses of medicinal plants, the properties of bioactive compounds, the extraction methods employed to isolate them, their economic potential, and their natural antimicrobial activity are crucial for further research and developing effective therapeutic interventions. Comprehending these aspects provides a solid foundation for further research and developing novel treatments.
Purpose of the research: the assessment of antimicrobial activity and chemical characterization of extracts obtained using our own method of isolating bioactive compounds from green parts of medical plants in Poland.
The use of traditional plants in folk medicine has so far been based on their use in the form of infusions and/or decoctions. As part of this study, extracts obtained using an innovative method [15,16] were analyzed, which increases the bioavailability and, thus, the bioreactivity of the biologically active substances contained in these plants. So far, the composition of these plants has been analyzed in terms of selected bioactive ingredients with medicinal properties. This study presents the results of the content of substances with mainly antimicrobial activity and was undertaken to present the relations between the content of bioactive compounds and different bacteria. These are the first research results in this field and have a pilot character.

2. Materials and Methods

2.1. Sample Collection

All wild plants were collected from Poland in 2021. Table S1 shows 38 localizations where different parts of plants (leaves and flowers) were picked. The leaves from four plants and flowers from Hypericum perforatum L. were carefully separated from the whole plant and subjected to natural air drying at room temperature 25 °C for one week. The dried samples were ground for 20 s at 500 rpm in a Grindomix GM 200 (Retsch GmbH, Haan, Germany). Then, it was maintained in tight packages at −20 °C until extraction.

2.2. Chemical Reagent

Acetonitrile and methanol were HPLC grade (Sigma-Aldrich, St. Louis, MO, USA). POCH S.A (Gliwice, Poland) supplied formic acid, diethyl ether, hydrochloric acid, and natrum hydroxide and deionized water has been prepared using a Millipore Milli-Q system (Millipore, Burlington, MA, USA). The following chemicals are considered as the standards, which include gallic acid, protocatechuic acid, 4-hydroxybenzoic acid, caffeic acid, 2,5-dihydroxybenzoic acid, katechin, vanillic acid, chlorogenic acid, vitexin, syringic acid, vanillin, salicylic acid, p-coumaric acid, ferulic acid, sinapinic acid, benzoic acid, rutin, quercetin, luteolin, t-cinnamic acid, apigenin, naringenin, and kaempferol and were purchased from the Sigma-Aldrich (St. Louis, MO, USA). Prior to injection into the UPLC system, these reference compounds were dissolved in methanol and filtered through a 0.22-µm membrane filter.

2.3. Phenolic Compounds Extraction Procedure

The extracts have been obtained using a novel technique of double hydrolysis (acidic and alkaline) and extraction of bioactive compounds from glycosidic bonds with diethyl ether [15,16]. In a 750 cm3 round bottom flask, 10 g of the dehydrated plant material has been placed. Over the flask, a reflux condenser was placed. The alkaline hydrolysis was followed by acid hydrolysis. Following that, 200 mL of 2 M aqueous sodium hydroxide solution and 50 mL of distilled water were added to the test tubes for the alkaline hydrolysis.
In a heating mantle, the sealed flasks were heated at 95 °C for 30 min. After approximately 20 min of cooling, the samples were neutralized with 100 mL of a 6 M aqueous hydrochloric acid solution (pH = 2) and cooled in the ice water. Diethyl ether (2 × 100 mL) was used to extract flavonoids from the inorganic (aqueous) phase. The ether extracts were continuously transferred to 250 cm3 round bottom distillation flasks and evaporated on a rotary evaporator. The second step of extraction was performed by acid hydrolysis. The aqueous phase was augmented with 150 mL of 6 M aqueous HCL solution and cooled in ice water after heating under the same condition for 30 min at 95 °C. Then, we followed the same steps mentioned before until obtaining the extracted product. The extract has been transferred quantitatively from the distillation flasks to 8 cm3 vials after rinsing the flasks 2 × 4 cm3 using diethyl ether. Next, the extracts were dehydrated under a gentle stream of nitrogen using RapidVap Evaporator (Labconco, Kansas, MO, USA). The dehydrated extracts have been stored at −80 °C till analysis. The extracts were thawed in the refrigerator for 12 h before being digested with a specific amount of MiliQ-grade distilled water to achieve the desired concentration [17,18].

2.4. Total Phenolic Content (TPC) and Total Flavonoids Content (TFC)

The total phenolic content was measured with the Folin–Ciocalteu reagent [16,17], 2 mL of the Folin–Ciocalteau reagent was added to 1 mL of the aqueous extract. After 3 min, the reaction environment was alkalized by adding 10 mL of a 10% sodium carbonate solution. After 30 min, the solutions were filled up to 25 mL, and their absorbance was measured at a wavelength of λ = 765 nm using a Hitachi U-2900 spectrophotometer (Schaumburg, IL, USA). The results were calculated as the mean of triplicates, in mg phenolic compounds per g of raw material expressed as gallic acid equivalent (GAE).

2.5. UPLC Analysis of Phenolic Compound

The phenolic compound content has been determined using an Acquity H class UPLC system equipped with a Waters Acquity PDA detector (Waters, Milford, MA, USA). An Acquity UPLC® HSS T3 C18 column (150 mm × 2.1 mm, particle size 1.8 μm) was used for the chromatographic separation (Watersy, Dublin, Ireland). The gradient eluents were performed using the following mobile phase composition: A, 0.1% aqueous formic acid; B, acetonitrile 0.1% formic acid (pH = 2). The gradient program looked like this: flow 0.4 mL/min 5% B (2 min), 5–16% B (5 min), 16% B (3 min), 16–20% B (7 min), 20–28% B (11 min) flow 0.45 mL/min, 28% (1 min). A 28–60% B (3 min) flow 5.0 mL/min, 60–95% B (1 min), 65% B (1 min), 95–5% B (0.1 min) flow 0.4 mL/min, 5% B (1.9 min).
The concentration levels of phenolic compounds were identified using an external standard at wavelengths λ = 320 (caffeic acid, chlorogenic acid, salicylic acid, sinapic acid, vitexin, p-cumaric acid, ferulic acid, rutin, apigenin, kaempferol, quercetin, luteolin), λ = 280 (gallic acid, syringic acid, vanillic acid, 4-hydroxybenzoic acid, vanillin, t-cinnamic acid, protocatechuic acid naringenin) and λ = 230 nm (benzoic acid, katechin). The concentration is given in mg/1 g of extract. The compounds were detected by comparing the retention times of the investigated peak to those of the standard, as well as by adding a specific amount of the standard to the tested sample and repeating the analyses. The following were the retention times for phenolic compounds, including flavonoids gallic acid −2.39, protocatechuic acid −5.09, 2,5-dihydroxybenzoic acid −7.96, 4-hydroxybenzoic acid −8.05. katechin −9.18, chlorogenic acid −9.19, vanillin −9.53, caffeic acid −9.79, syringic acid −10.53. vanillic acid −12.01, p-cumaric acid −13.09, ferulic acid −15.62, salicylic acid −15.94, benzoic acid −16.22, sinapic acid −16.62, vitexin −18.32, rutin −19.13, t-cinnamic acid −26.93, quercetin −29.68, luteolin −29.98, naringenin −31.53, apigenin −31.79, kaempferol −31.89. The detection level has been set at 1 µg/g [17,18,19].

2.6. Antimicrobial Activity

Minimum Inhibitor Concentration (MIC)

The minimum inhibitory concentrations (MIC) of the five plant extracts on the growth of Proteus mirabilis (PCM 1361), Escherichia coli (PCM 2793), Listeria innocua (DSM 20649), Micrococcus luteus (PCM 525), Pseudomonas fluorescens (PCM 3107), Pseudomonas fragii (PCM 1856), Salmonella enteritidis (PCM 941) have been measured using Bio screen C automated growth reader (Oy Growth Curves Ab Ltd., Turku, Finland). The dry extracts were dissolved in deionized water after evaporation, which was mentioned previously. Bacterial inoculants in the well plate with nutritional broth medium (nutritional broth P-0021, BTL company, Łódź, Poland) and a series of diluted hydrated extracts beginning from 5% and inoculated with medium bacterial growth were incubated on a plate for 72 h under appropriate conditions for individual groups of bacteria. The optical density (OD) in each cuvette was measured by the instrument. The MIC value was determined by taking the first concentration without turbidity [17,18,19].

2.7. Statistical Analysis
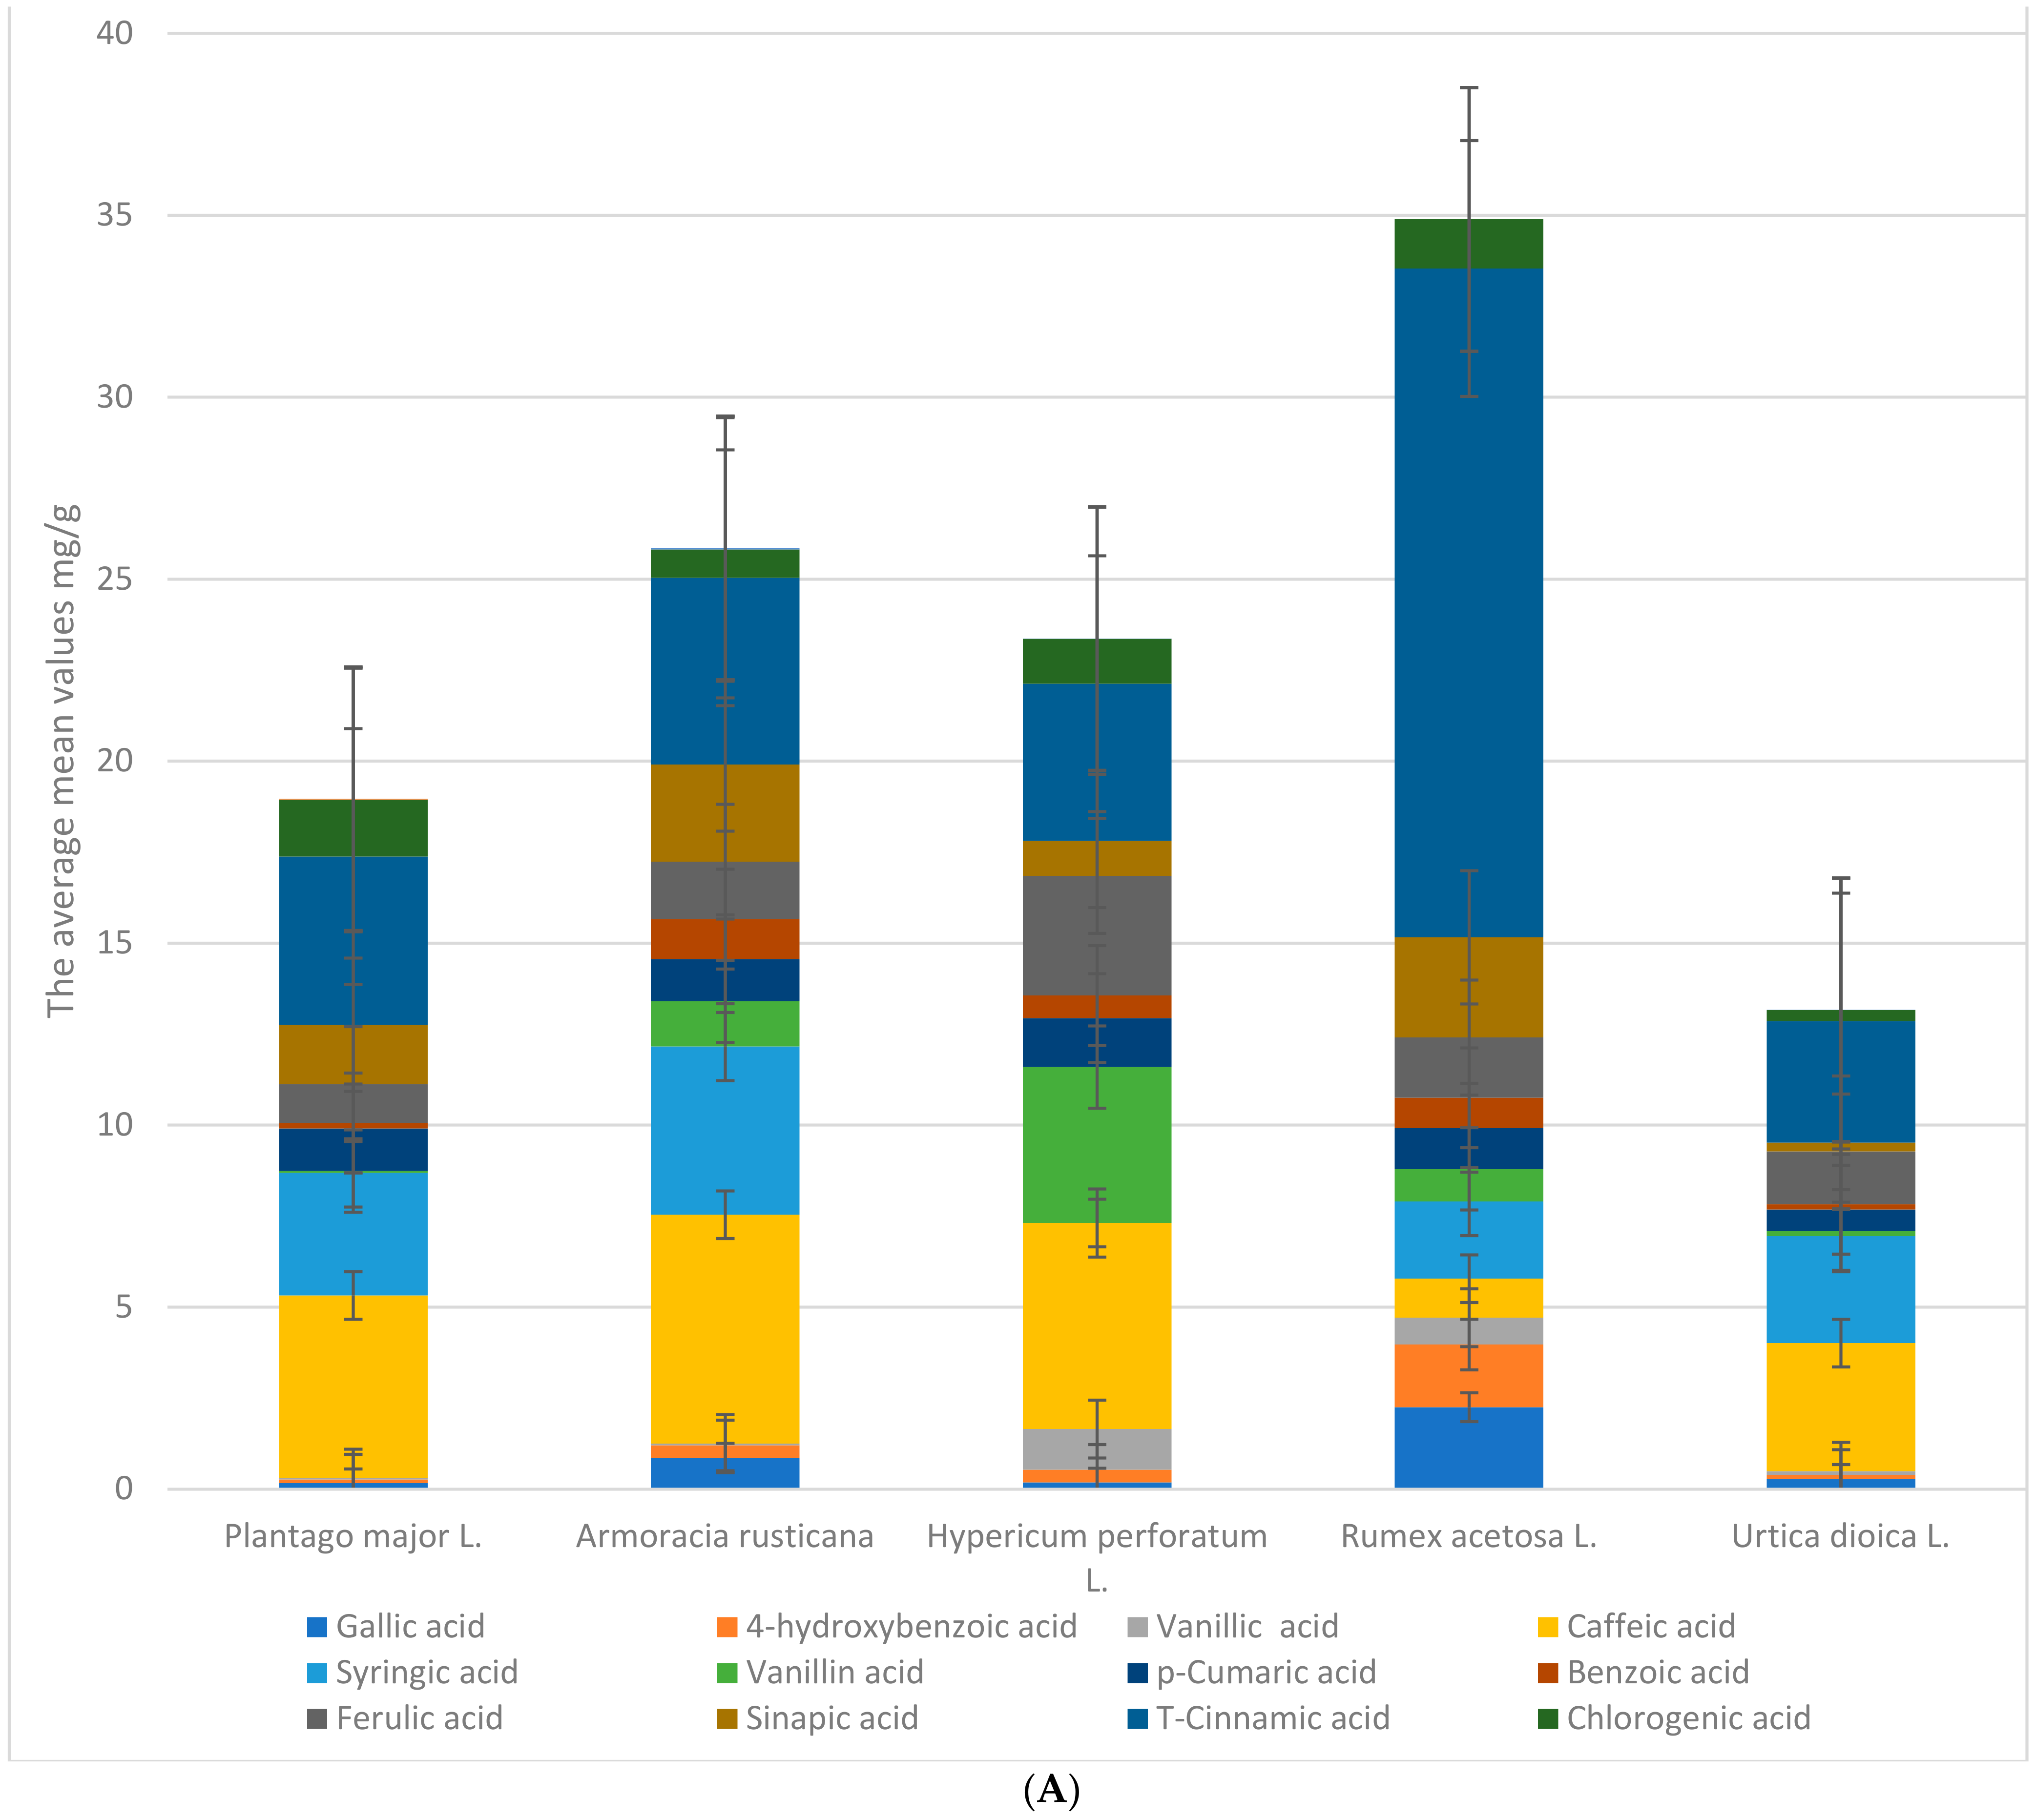
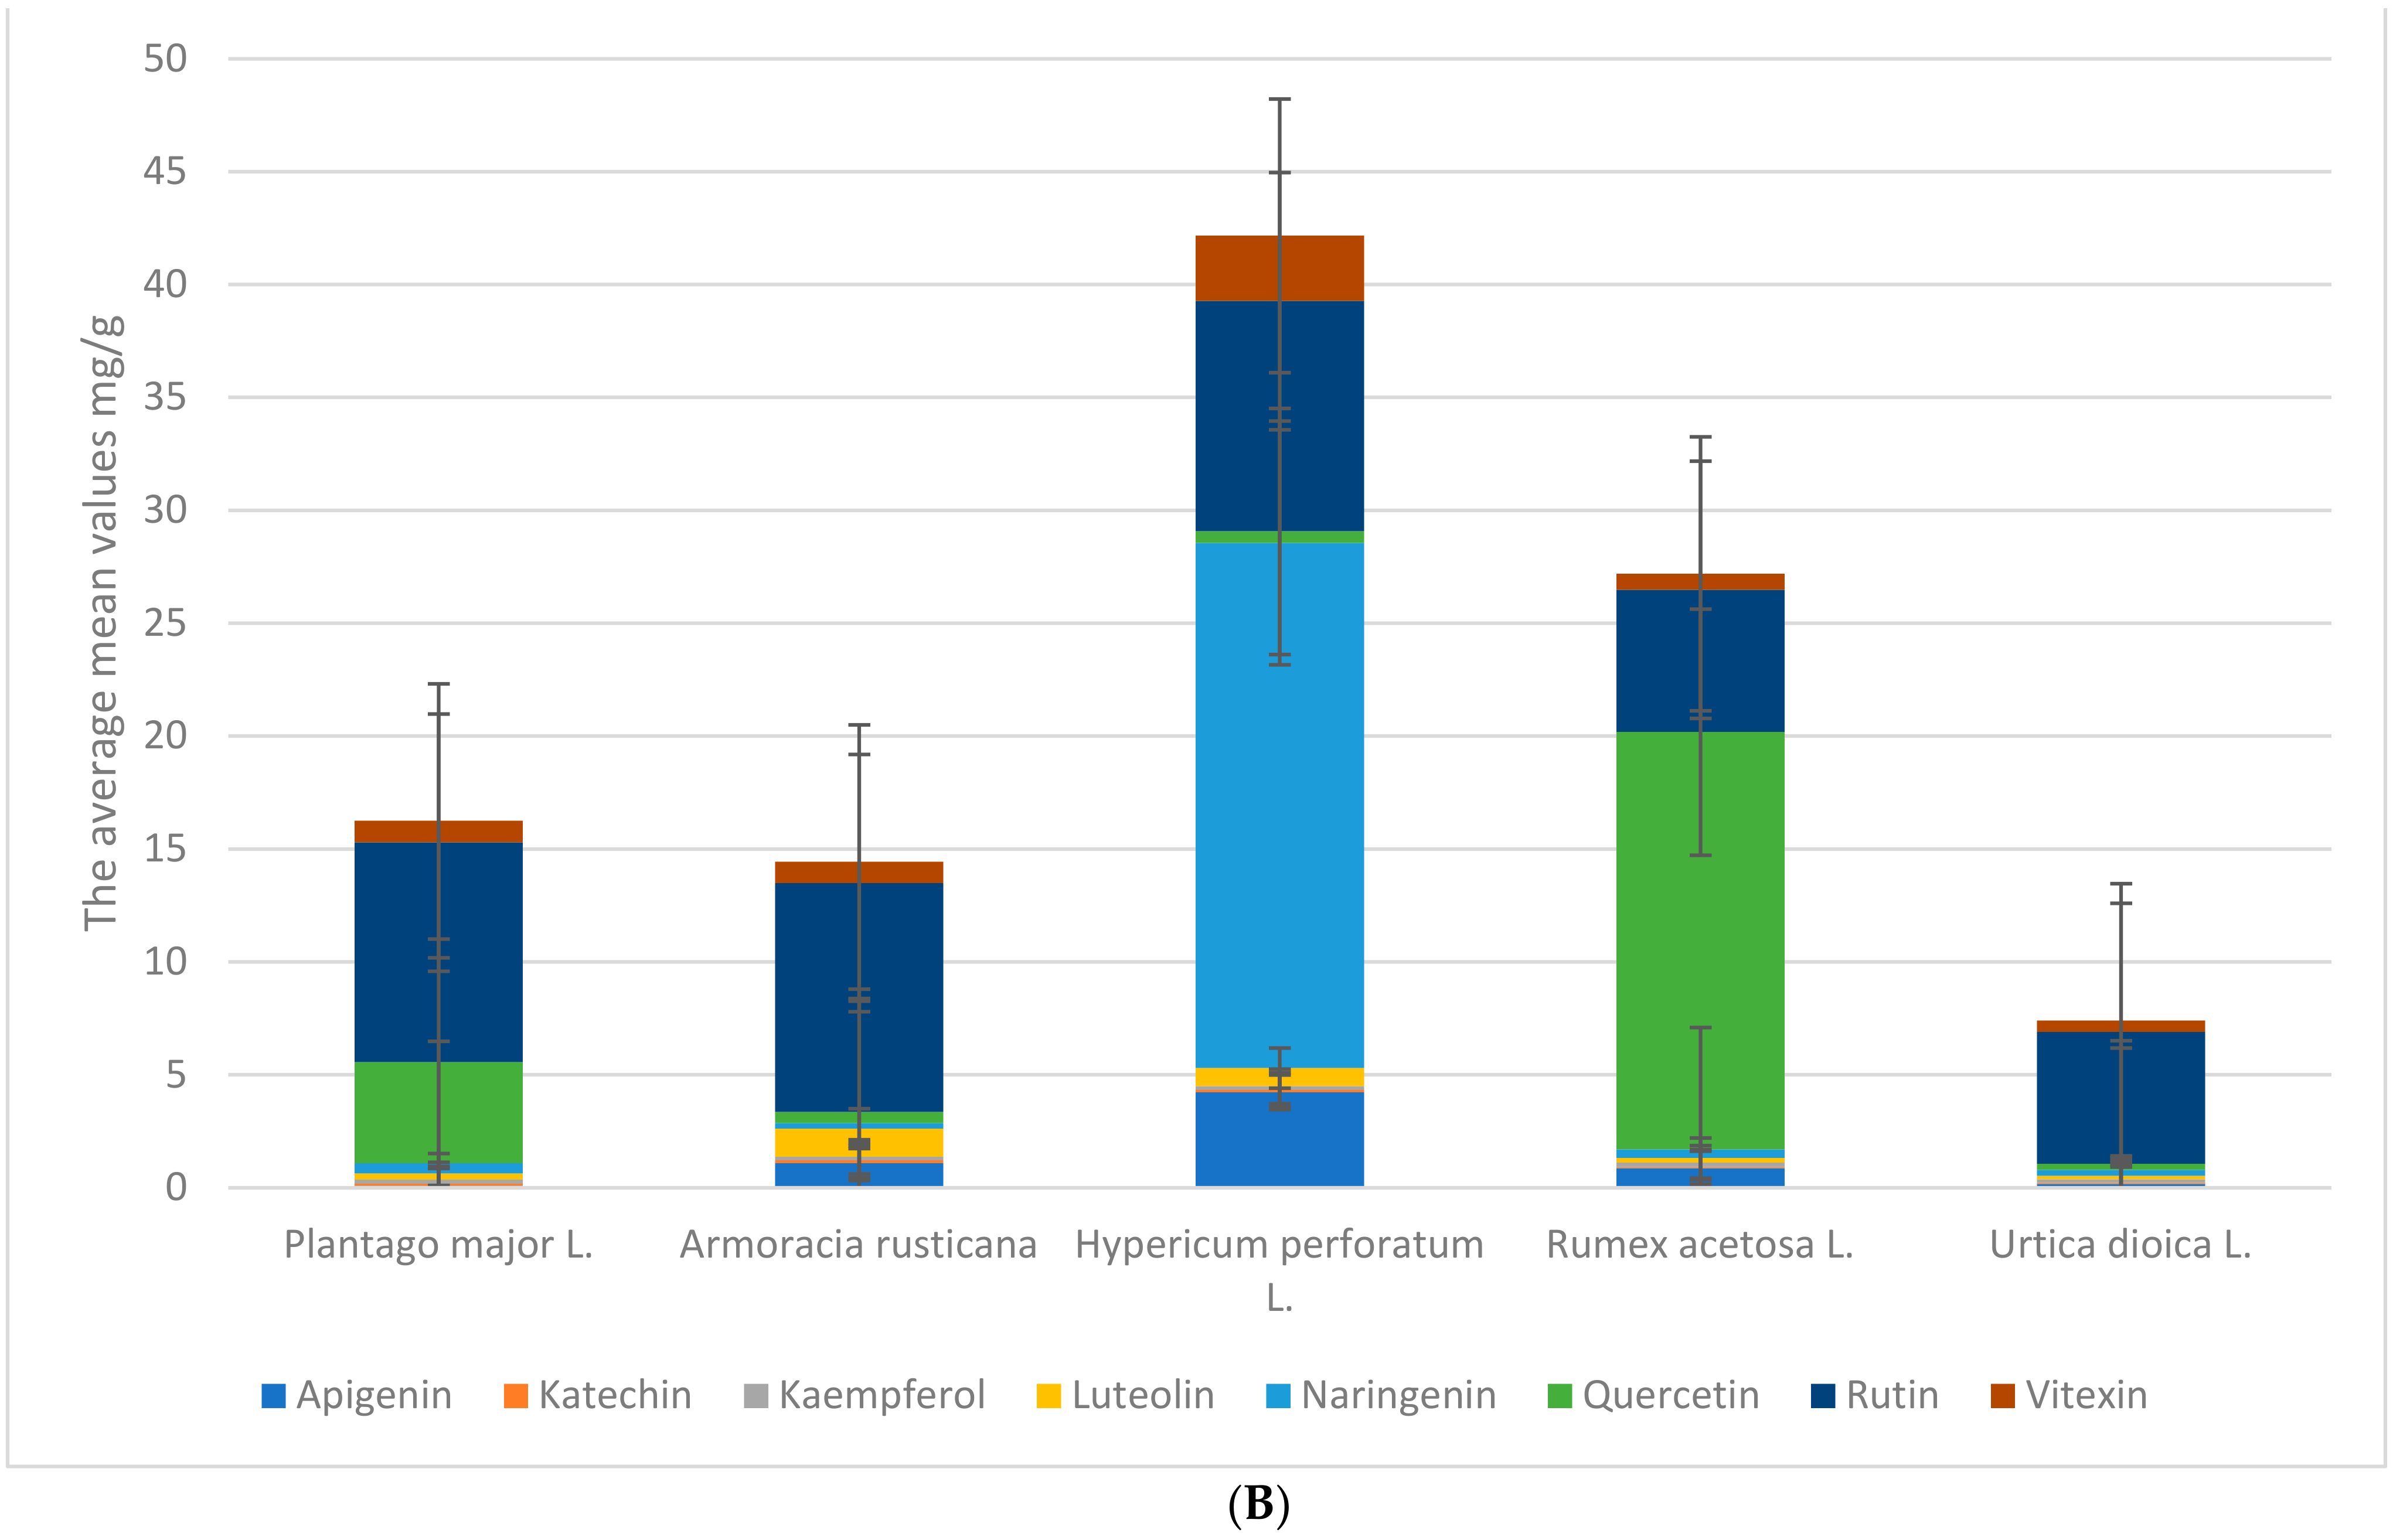
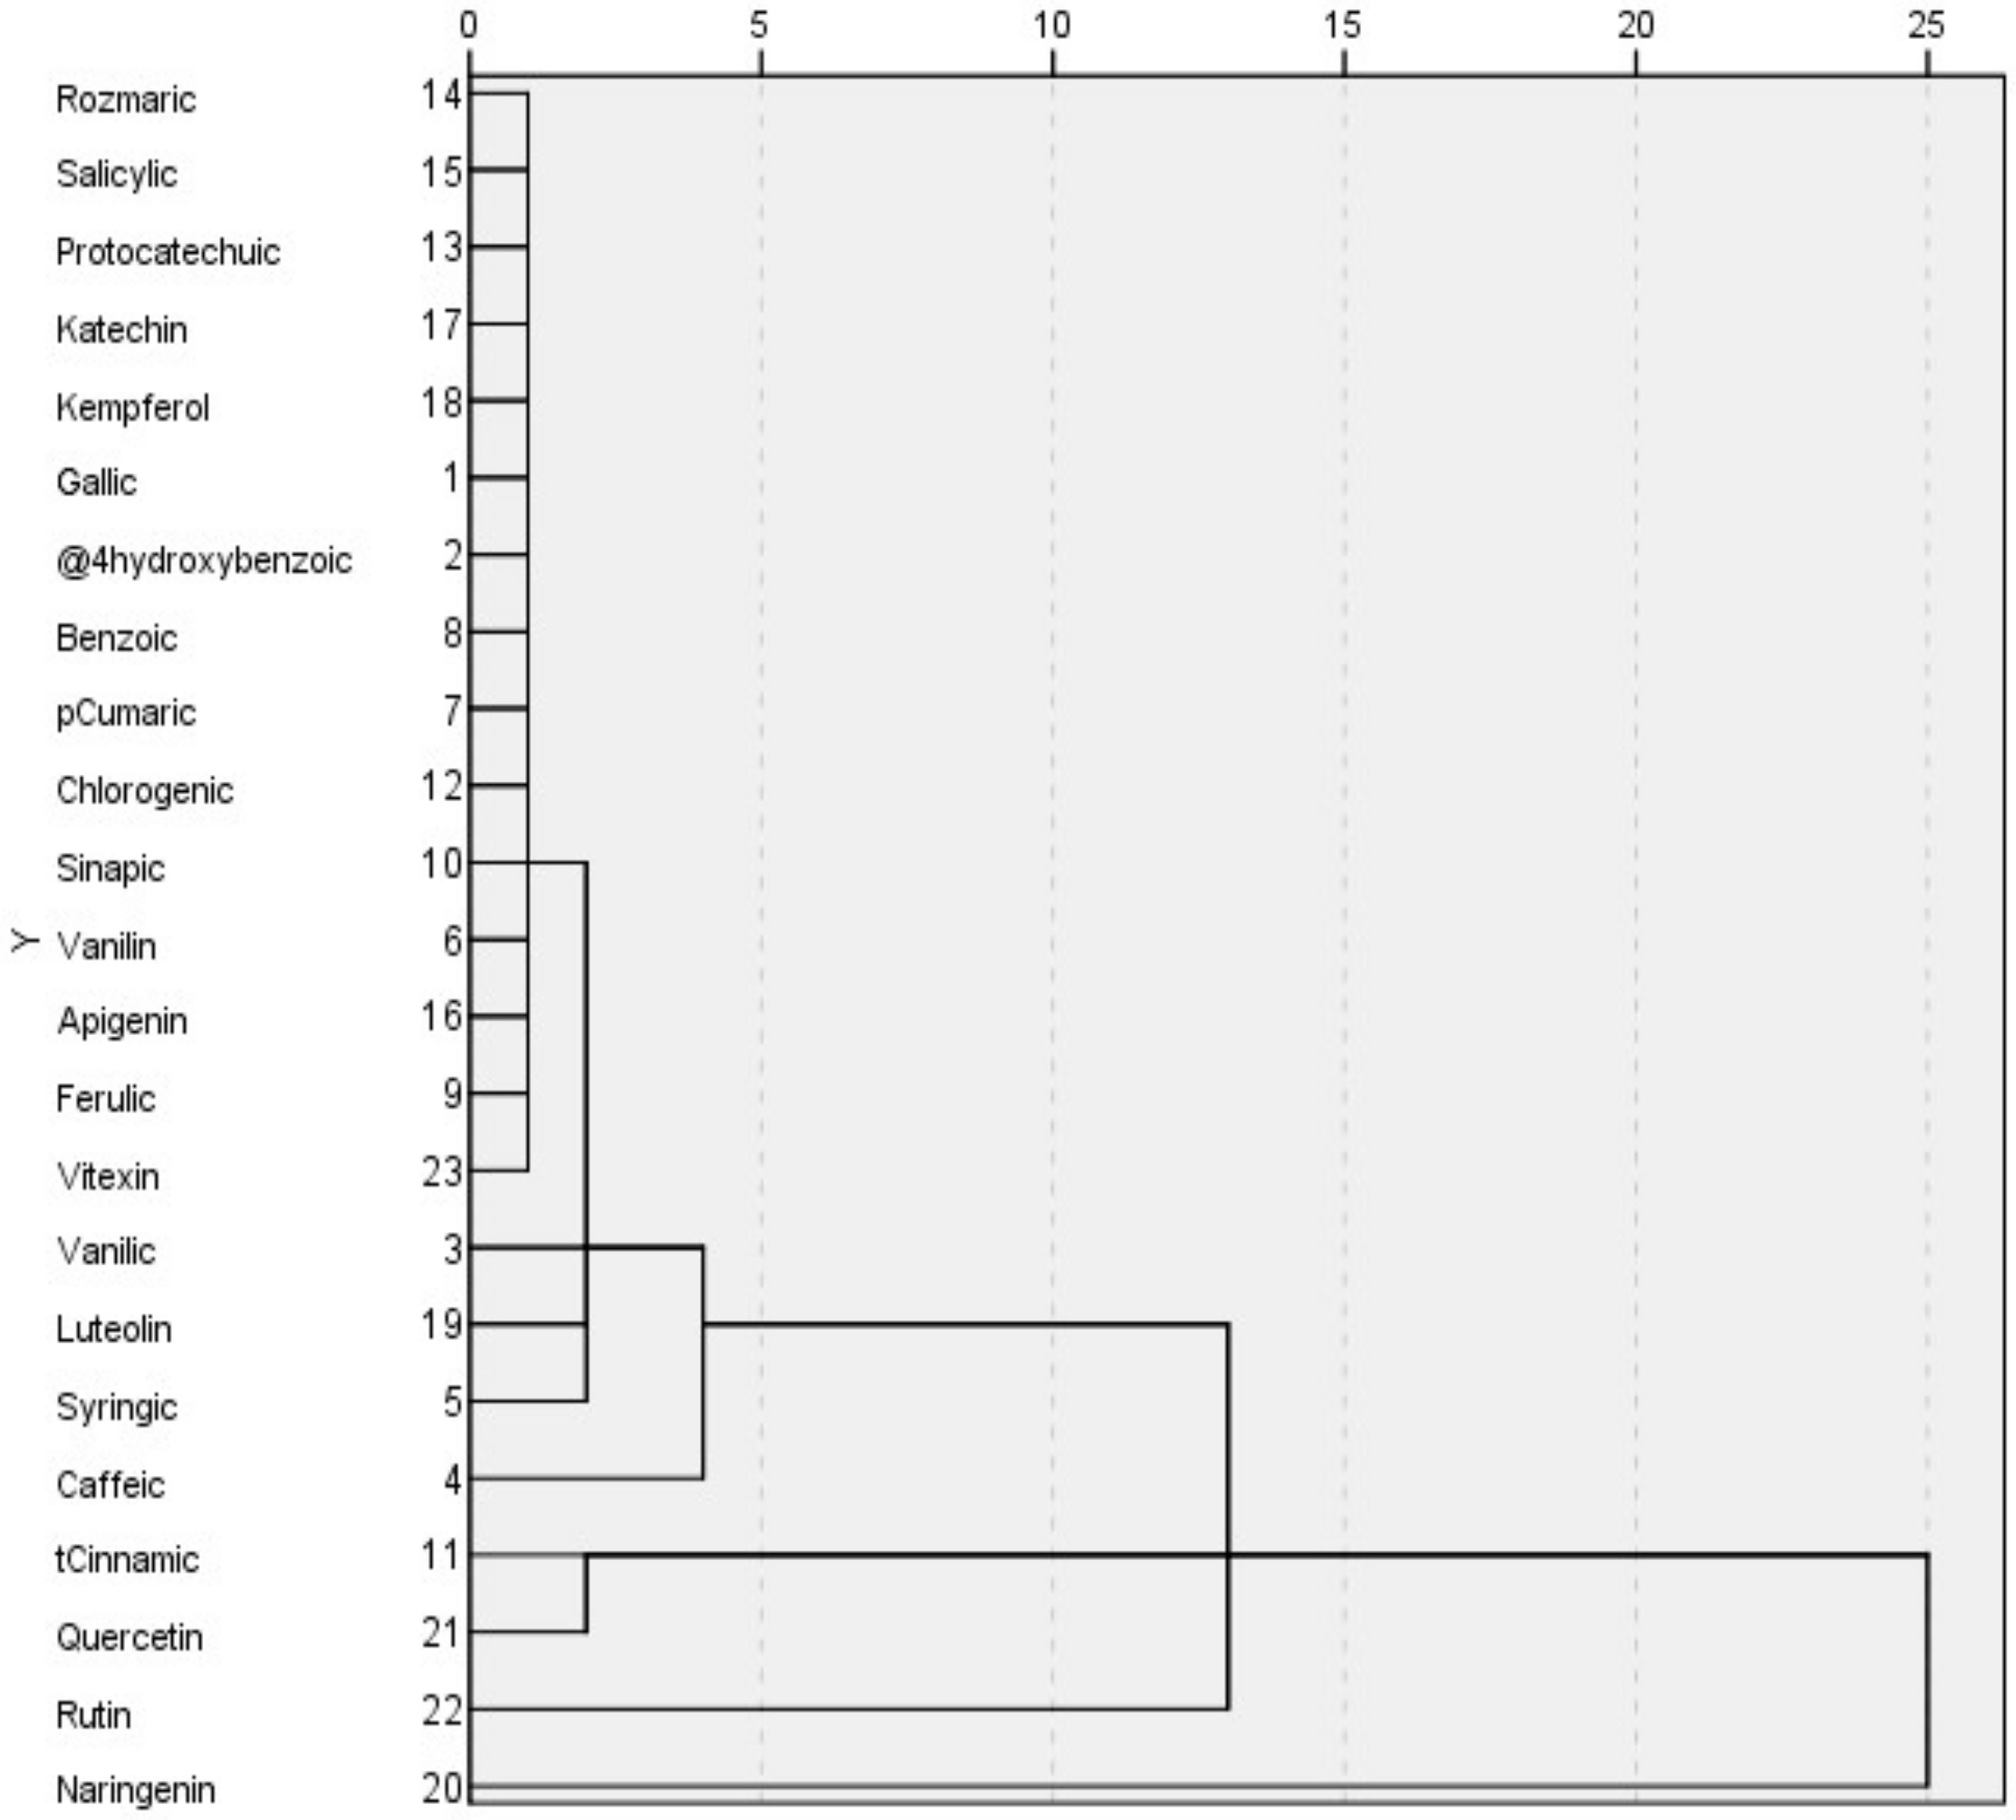
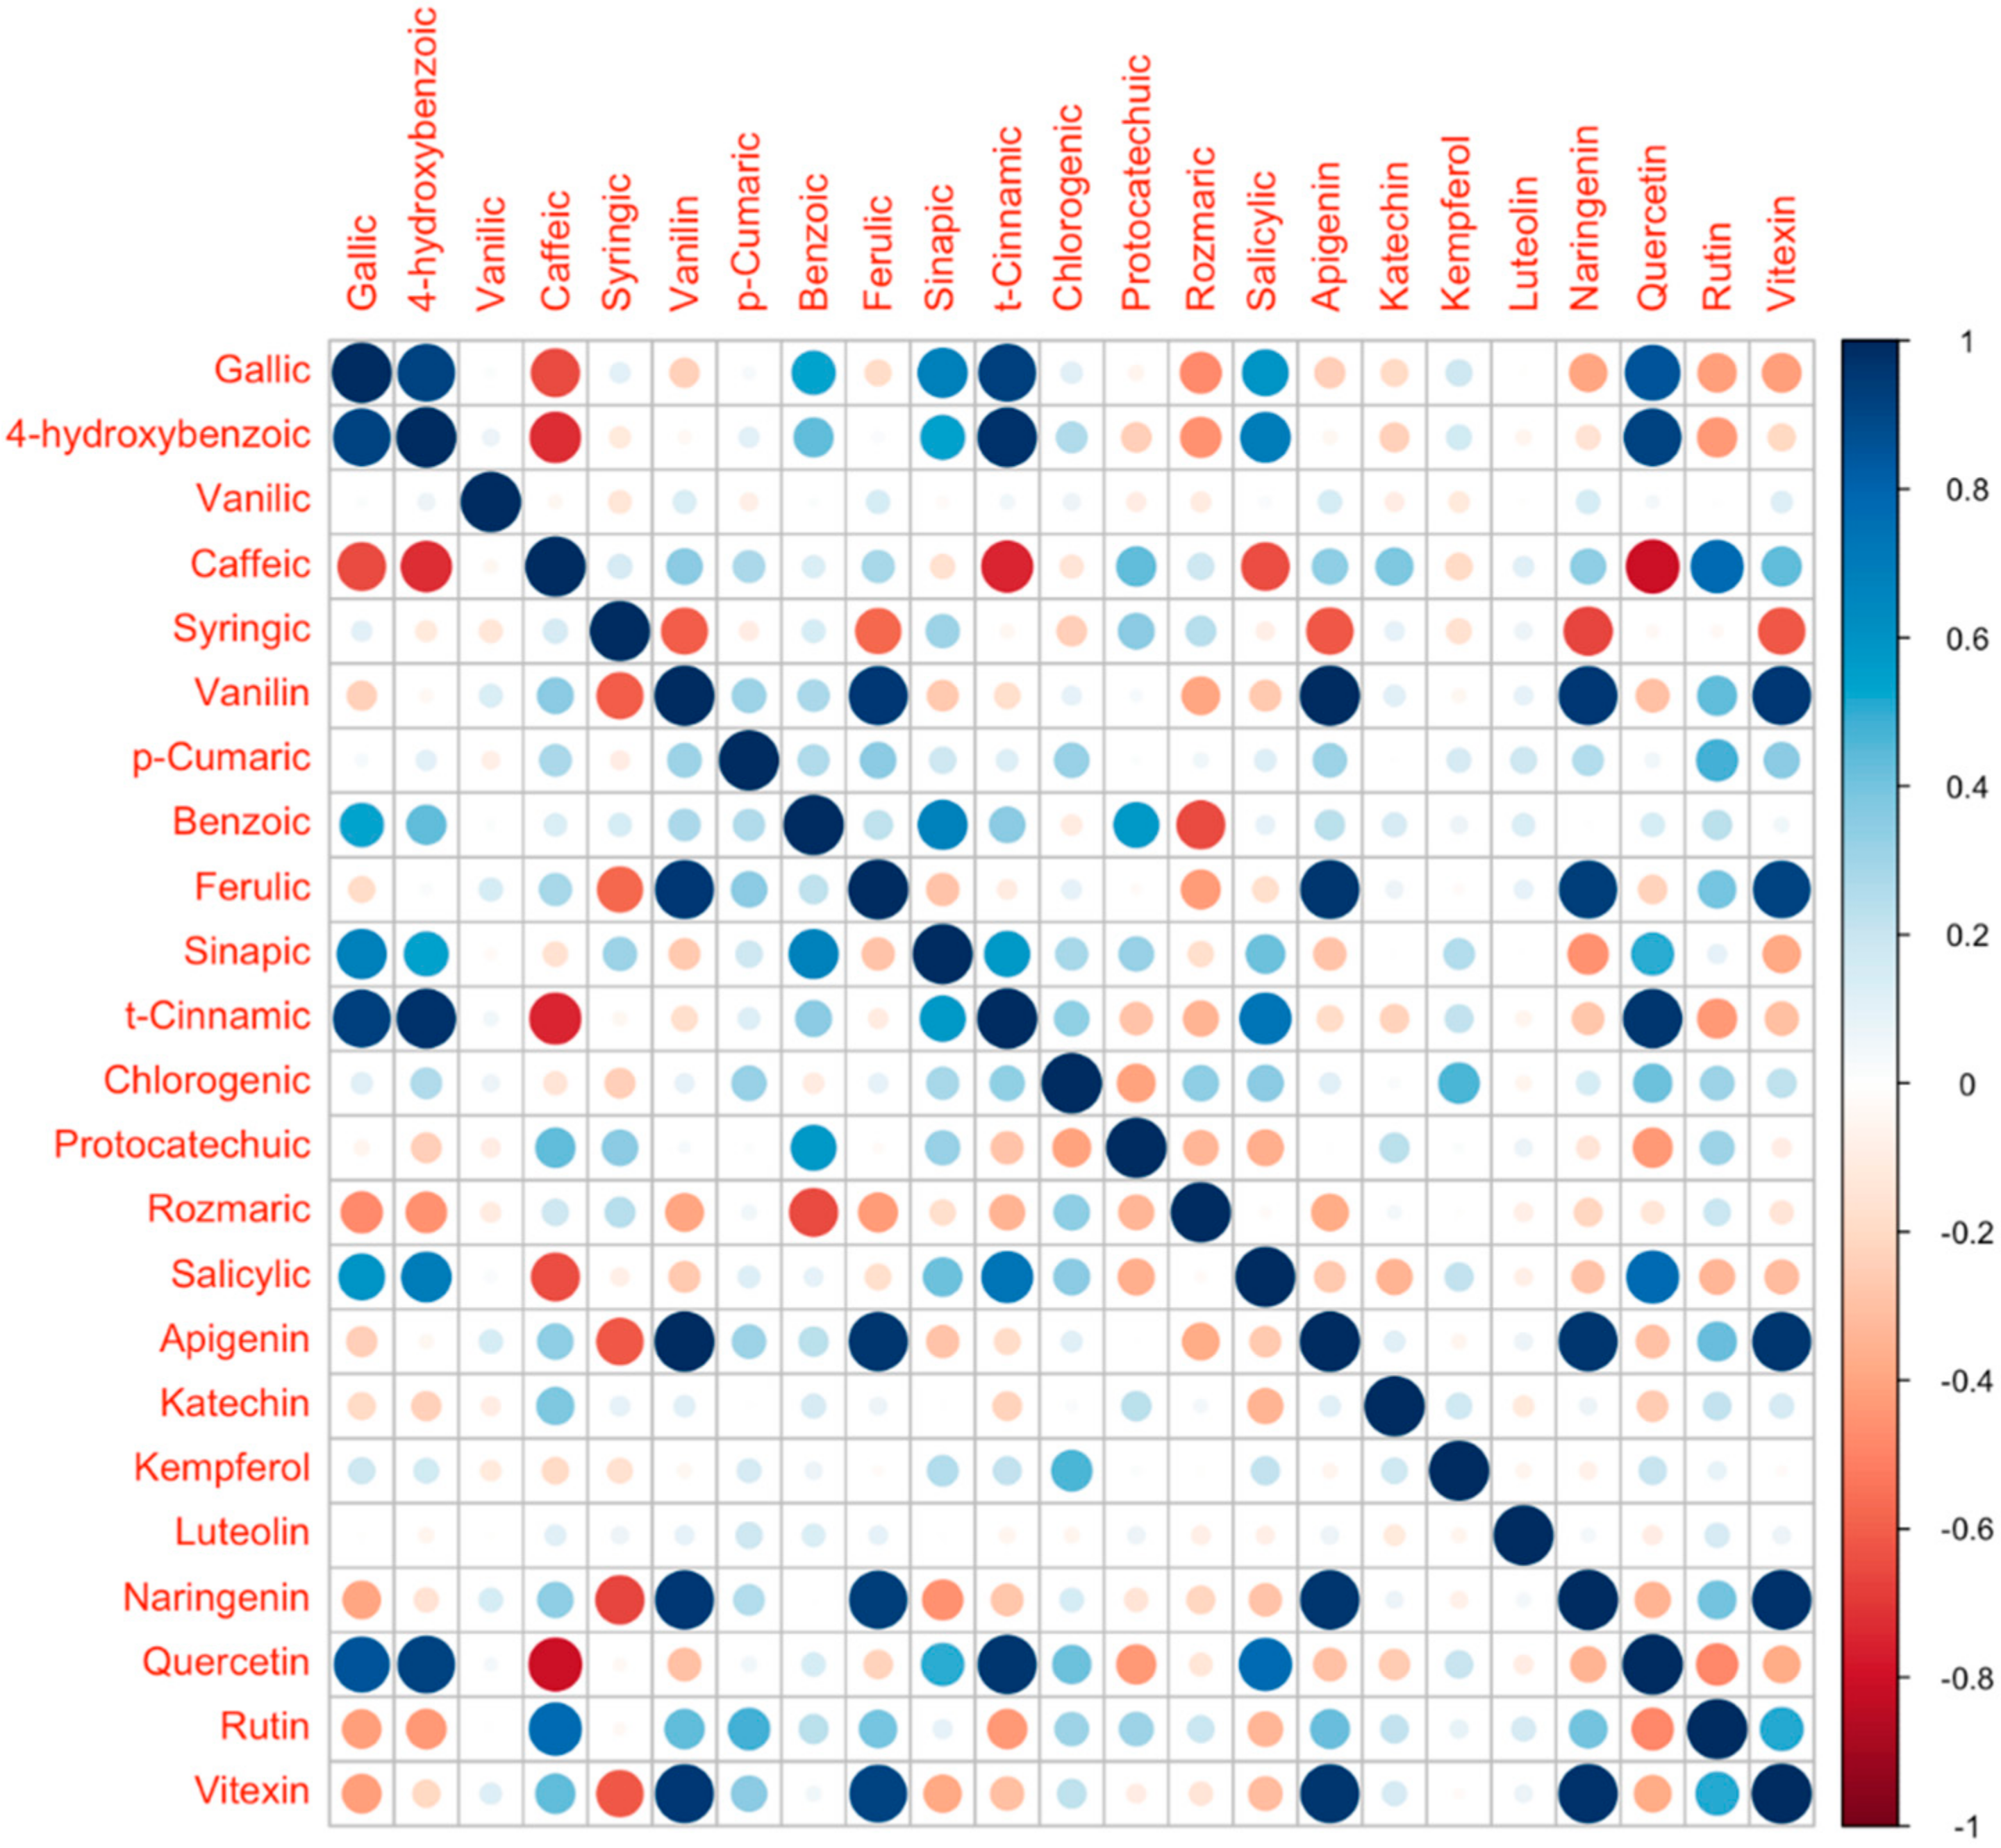
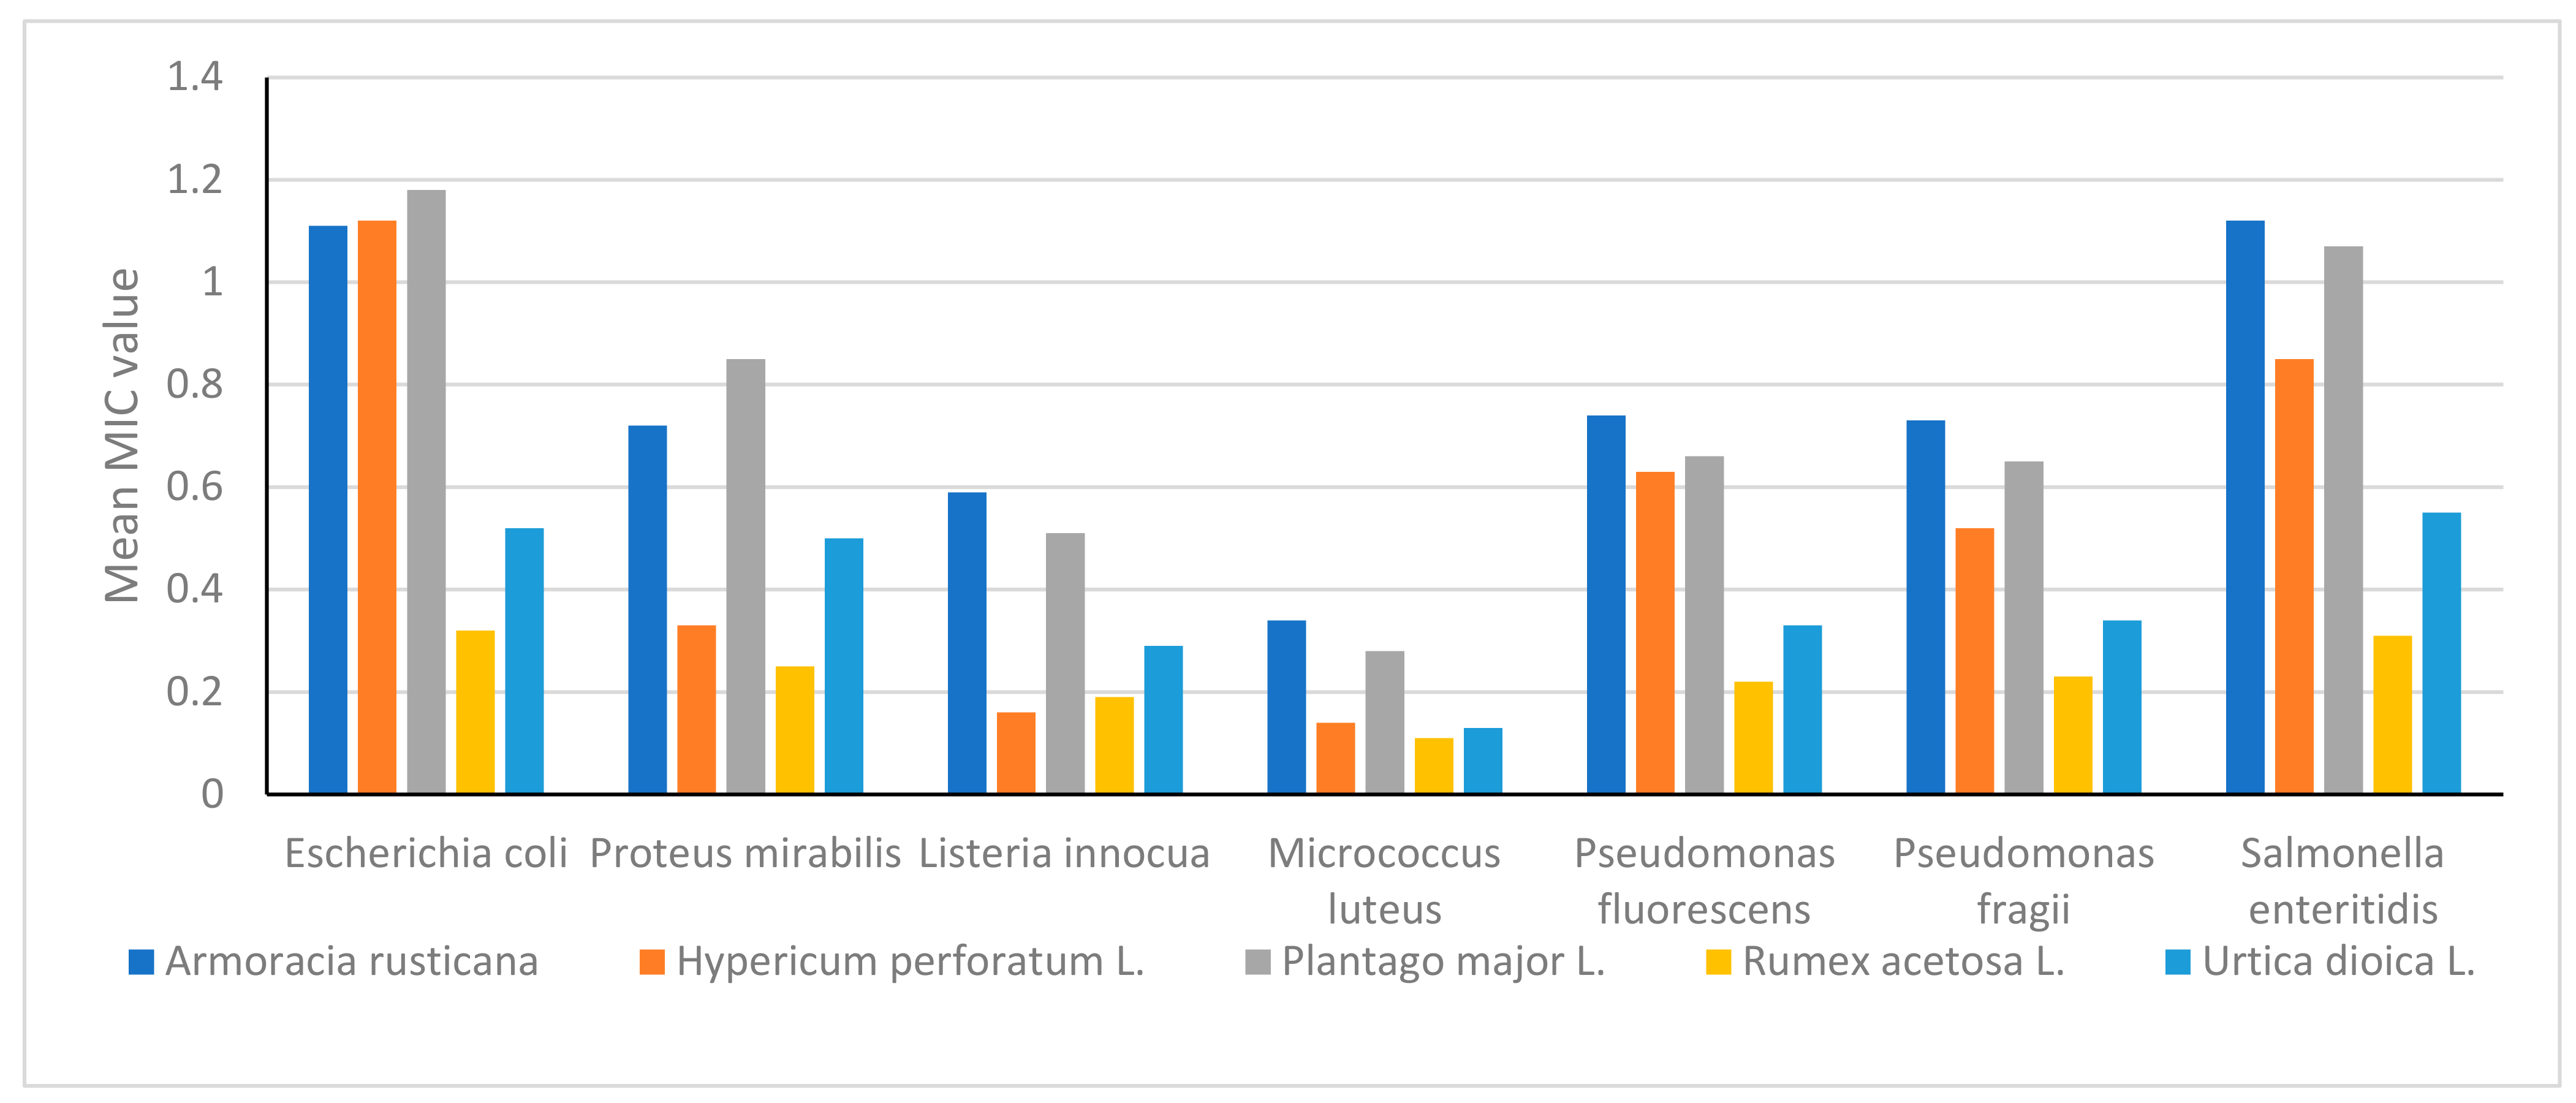
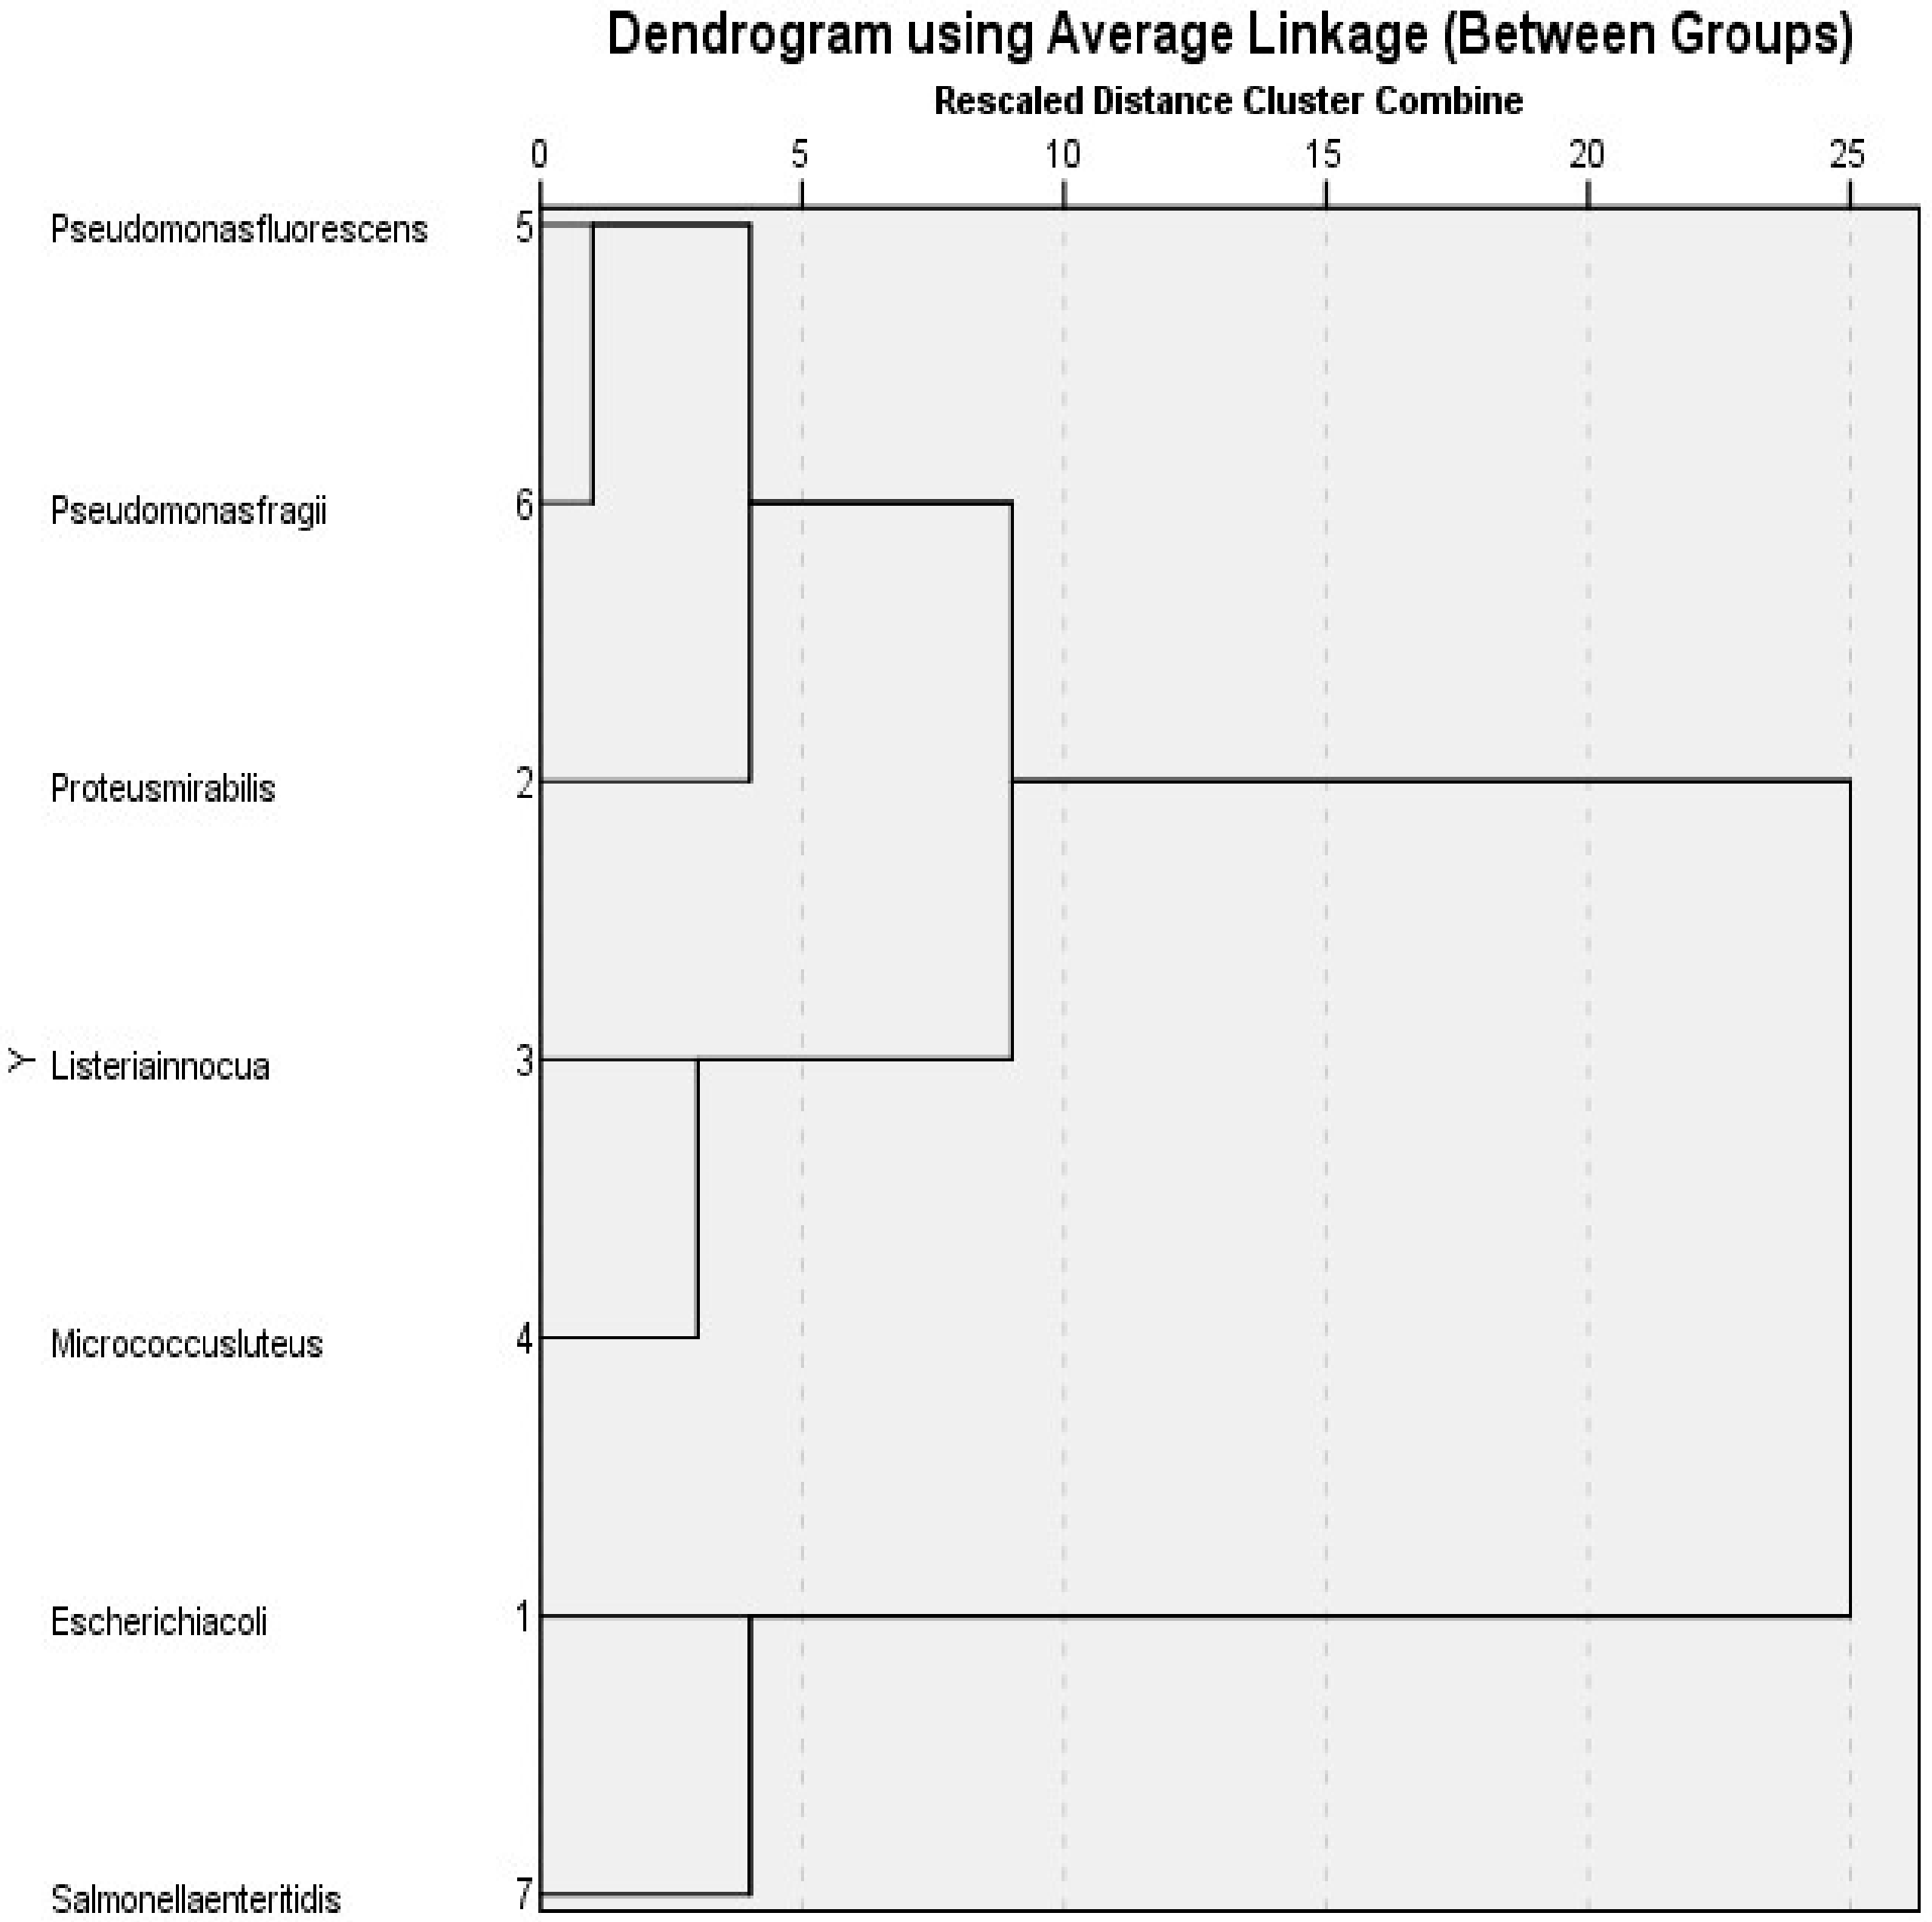
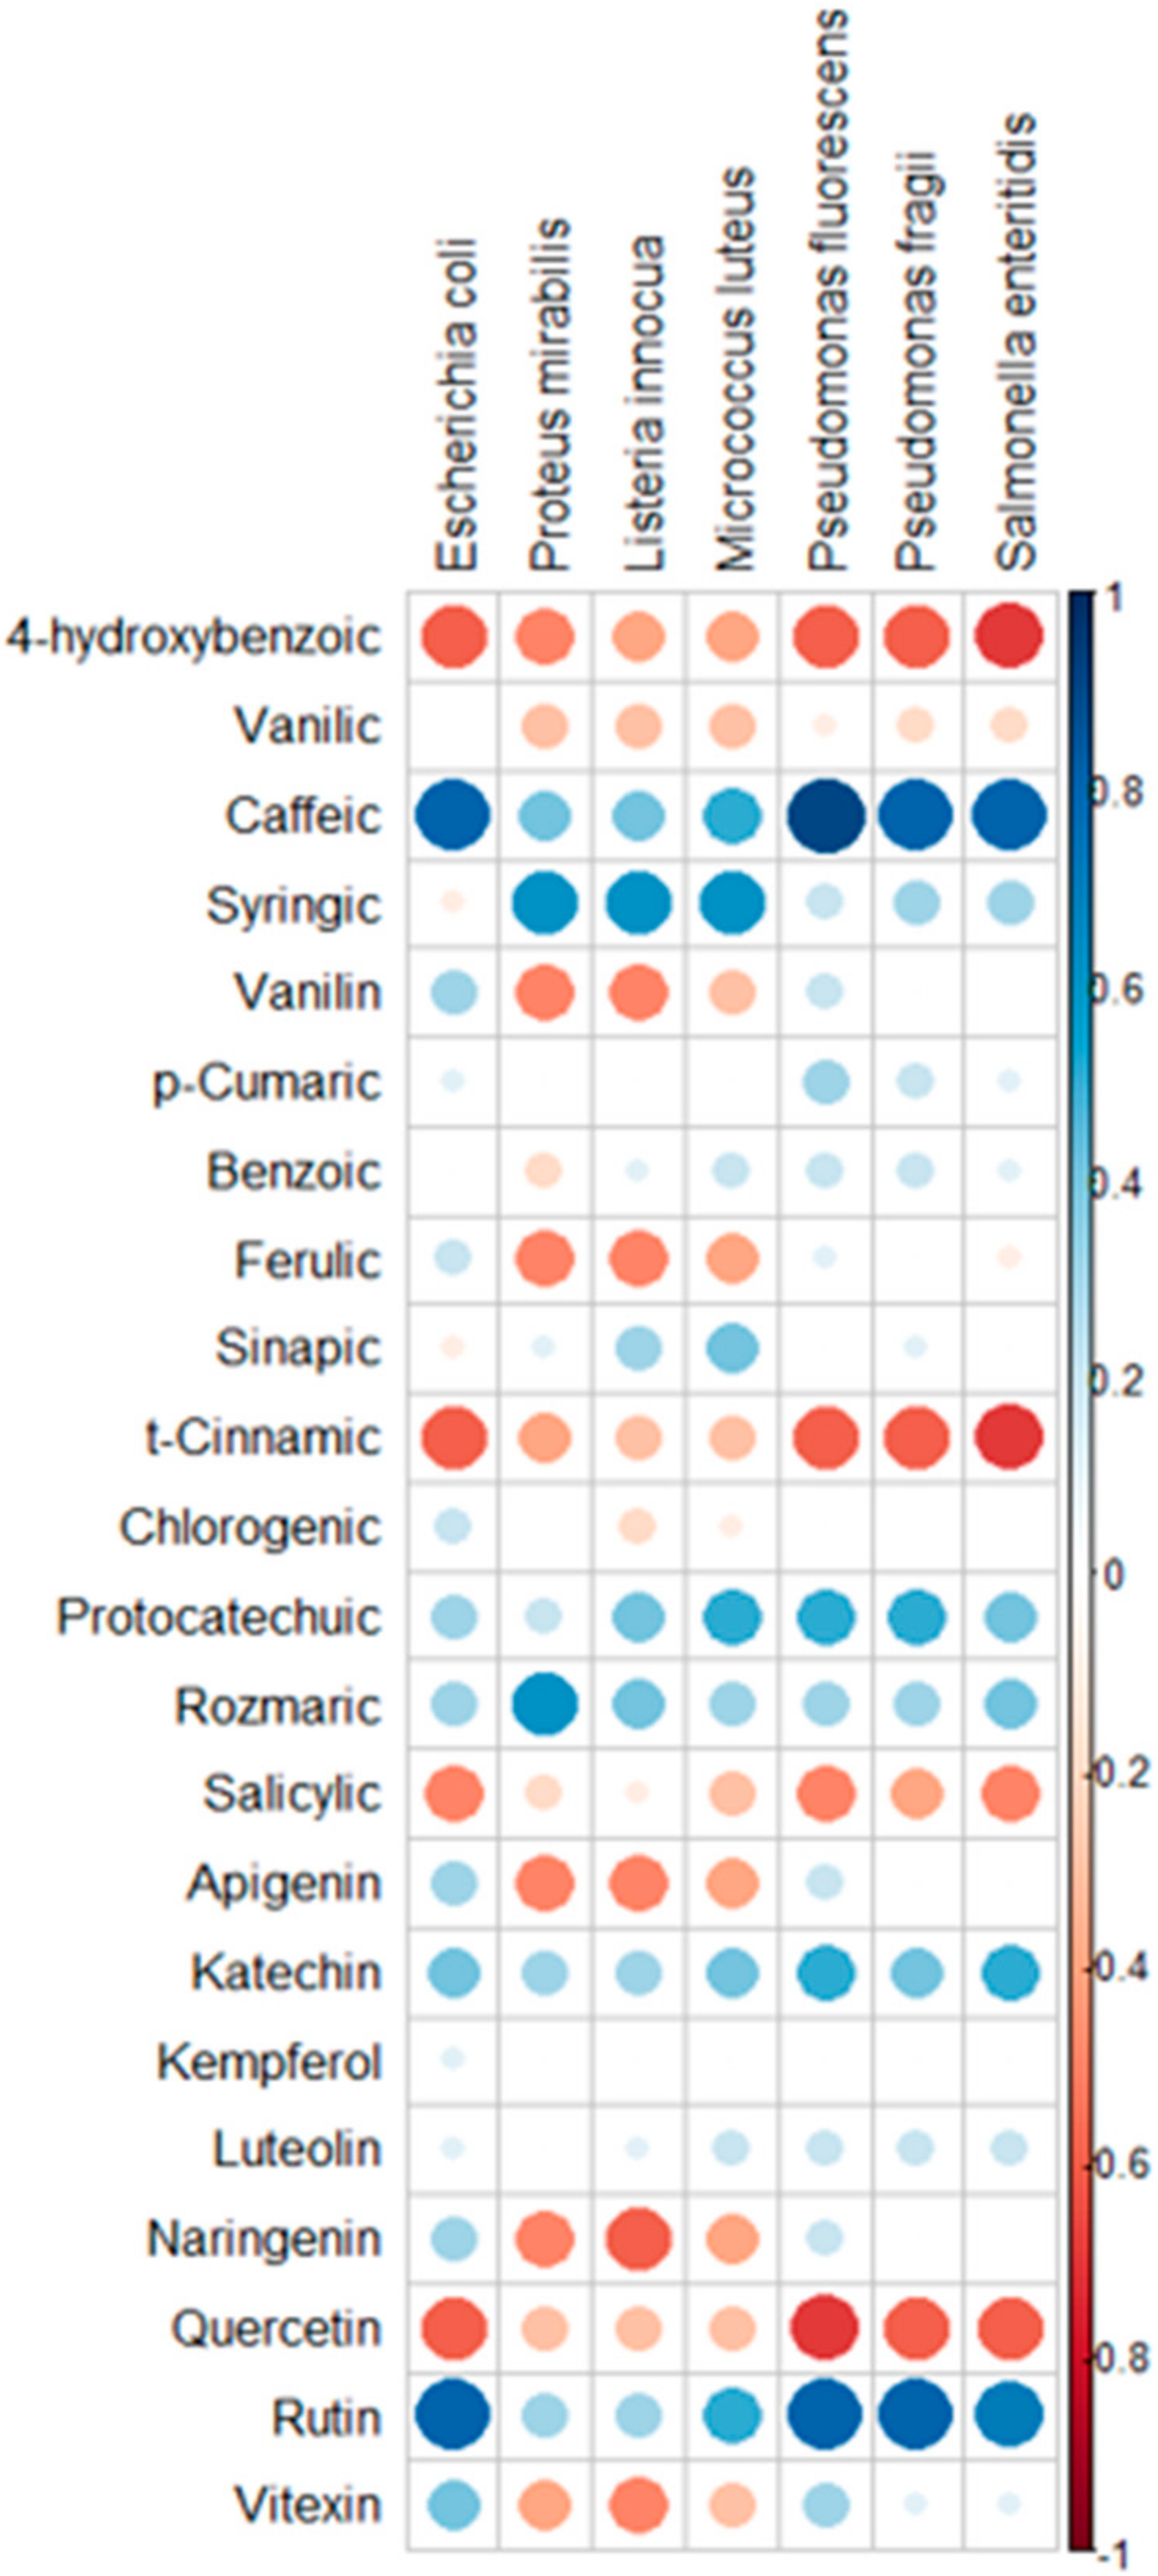
For the statistical analyses, box plots presenting mean values and standard deviations were prepared, and minimal and maximal values of observations were given. Dendrograms were used to show the existing regularities between the contents of bioactive compounds. This is a graphical method that shows the relationships and similarities that occur between the observed features. Principal component analysis (PCA) was used to enable data visualization. This is a technique that allows large data sets to be analyzed, providing opportunities for interpretation while preserving the maximum amount of information. In the research results presented here, we use the first two principal components to plot the data in two dimensions and visually identify clusters of closely related data points. The use of heat maps made it possible to summarize the results of the experiment and present them in a simplified way and create a visually appealing form of data analysis, as well as to analyze the relationships between variables. Software was used in the work: SPSS software version 26 (IBM SPSS, New York 10504-1722, New York, NY, USA), Minitab statistical software (version 17, Minitab, LLC. Brandon, UK) and RStudio (RStudio, version 4.2.2. Boston, MA, USA).

3. Results

Chemical Analysis

All samples were collected from different locations in Poland. The five species of plant are represented by 38 samples that were extracted from 10 g of plant-dried materials and analyzed using UPLC to identify the profile of polyphenols and their concentrations (mg/g), followed by antimicrobial analysis to determine the minimum inhibitor concentration (MIC). Figure 1A,B show the mean bioactive compound values, standard deviation, and minimum and maximum values of Plantago major L. in eight locations. Gallic acid, 4-hydroxybenzoic acid, vanillic acid, caffeic acid, syringic acid, vanillin, p-coumaric acid, benzoic acid, ferulic acid, sinapic acid, t-cinnamic acid, chlorogenic acid, protocatechuic acid, rosmarinic acid, salicylic acid, apigenin, catechin, kaempferol, luteolin, naringenin, quercetin, and rutin are listed in Figure 1A,B. The average amount of gallic acid in Plantago major L. is 0.16 ± 0.08. Based on Figure 1A,B, vanillic acid ranges from 0.01 to 0.08. We have observed that rutin 9.73 ± 0.92, t-cinnamic acid, chlorogenic acid, and syringic acid are Plantago major L.’s most abundant bioactive compounds. Protocatechuic acid and salicylic acid are not present in the plant. While rosmarinic acid has the lowest mean value at 0.03, vanillic acid has a low standard deviation, and syringic acid has the highest one at 2.28.
Figure 1B suggests that we have examined that the concentration of Total Phenolic Acid Content (TPC) is slightly higher than the Total Flavonoid Content (TFC) of the Plantago major L. samples. These findings imply that, in comparison to the other plants studied, Plantago major L. has a moderate content of TPC and TFC. Although the standard deviations show some variation in the content between the samples, the total amount of flavonoids variation is relatively small. When compared to Armoracia rusticana and Hypericum perforatum L., Plantago major L. has a relatively low mean of total phenolic compounds and TFC.
Figure 1A,B show the mean bioactive compound values of Armoracia rusticana from nine locations, in addition to the standard deviation and minimum and maximum values. The list shows bioactive compounds like gallic, caffeic, syringic, and sinapic acids, as well as flavonoids like luteolin and quercetin. Each location calculates the compound’s mean values. Rutin had the highest mean values of the compounds in Figure 1A,B, ranging from 7.77 to 11.67 across locations. Syringic acid had the second-highest mean value, and caffeic acid, sinapic acid, t-cinnamic acid, and vanillin had a high mean concentration. Protocatechuic, rosmarinic, and salicylic acids were found in low concentrations. Protocatechuic and salicylic acids were absent in some places. Rutin, caffeic acid, t-cinnamic acid, and sinapic acid are Armoracia Rusticana’s most abundant bioactive compounds, according to these figures. Vanillin has a low standard deviation, while luteolin has a higher one. Some compounds had different mean values in different locations. These differences in mean values suggest that bioactive compound composition may depend on its geographical origin.
Figure 2 suggests that we have examined the TPC and TFC of samples of Armoracia rusticana. These findings imply that the TPC and TFC of Armoracia rusticana are relatively high. However, the high total flavonoid standard deviation indicates that there is a lot of variation in the flavonoid content between the samples when interpreting the findings and coming to conclusions about the samples’ bioactivity.
Figure 1A,B show the mean concentrations (in mg/g extract), standard deviation, and minimum and maximum values of various phenolic compounds in Hypericum perforatum (St. John’s Wort) plants collected from 10 different locations. In general, the mean concentrations of phenolic compounds in the Hypericum perforatum plants varied across the different locations. Some compounds, such as syringic acid, protocatechuic acid, rosmarinic acid, and salicylic acid, were not detected in all locations.
Among the phenolic compounds in Figure 1A,B that were detected in the plants, the most abundant were naringenin and rutin, with mean concentrations ranging from 19.52 to 30.34 mg/g and from 7.63 to 12.52 mg/g, respectively. Caffeic acid and t-cinnamic acid were also present in relatively high concentrations. The other phenolic compounds were generally present in lower concentrations, with mean values ranging from 0.01 to 4.97 mg/g. According to Figure 1A,B, syringic acid has a low standard deviation, while vanillic acid has a higher one. Unlike Armoracia rusticana, Hypericum perforatum L. has naringenin and luteolin.
Figure 2 suggests that we have examined the TPC and TFC of samples of Hyperium perforatum L. These findings imply that the total phenolic and TFC of Hypericum perforatum L. are relatively high. The standard deviations show some content variability between the samples. The mean TFC is significantly higher than the mean TPC. Compared to Armoracia rusticana, Hypericum perforatum L. has a relatively lower mean TPC but a much higher mean TFC.
The average values and standard deviations for the various bioactive compounds found in Rumex acetosa L. are displayed in Figure 1A,B. The figures contain a list of 23 different substances; the mean values for the various compounds range from 0 to 18.49 mg/g and have been recorded. The figures also include the minimum and maximum values for each compound. For instance, the minimum and maximum values for rutin are 5.01 mg/g and 38.21 mg/g, respectively, and the mean value is 6.3 mg/g with a standard deviation of 1.13 mg/g, which is considered lower than the rutin present in the other plants. The minimum and maximum values of mg/g extract for quercetin are 13.94 mg/g and 24.76 mg/g, respectively, with a mean value of 18.49 mg/g and a standard deviation of 3.69; furthermore, salicylic, rosmarinic, and protocatechuic acid have not been recorded in any location.
Based on the results given in Figure 2, we can say that we have examined the TPC and TFC of the Rumex acetosa L. sample, with a standard deviation of 6.47 mg/g and a mean content of 34.88 mg/g TPC, which is greater than the concentration of TFC. These findings imply that in comparison to Armoracia rusticana, Hypericum perforatum L., and Plantago major L., Rumex acetosa L. has a relatively high mean TPC and TFC.
Protocatechuic acid (0.01 mg/g) had the lowest mean value, while rosmarinic acid and salicylic acid were absent in Nettles, according to Figure 1A,B. The standard deviation values varied greatly among various compounds. The minimum and maximum values for each compound also varied greatly, with t-cinnamic acid having the highest minimum value (3.06 mg/g) and rutin having the highest maximum value (6.81 mg/g).
From Figure 2, we have examined the TPC and TFC of samples of Urtica dioica L. The average amount of all phenolic acid contents is 13.16 mg/g, and the concentration of TFC content on average is lower than the concentration of TPC. These findings imply that, in comparison to the other plants we have studied, Urtica dioica L. has a relatively low content of both TPC and TFC.
In comparison, we can recall that for the TPC and TFC in Plantago major L., Armoracia rusticana, Hypericum perforatum L., Rumex acetosa L., and Urtica dioica L., based on all Tables show the mean, standard deviation, and minimum and maximum values. Rumex acetosa L. had the greatest mean value for TPC and the second-highest mean value for TFC when all five plants were compared. The highest mean value for TFC and the third highest mean value for TPC were both found in Hypericum perforatum L. The lowest mean values were found in Urtica dioica L. for both total phenolic and total flavonoid content. Additionally, the mean values for TFC and TPC in Plantago major L. were both relatively low.
In Figure 2 above, we have compared TPC and TFC in five different plants, including Armoracia rusticana, Hypericum perforatum L., Plantago major L., Rumex acetosa L., and Urtica dioica L. The mean and standard deviation for each compound in each plant are displayed in Figure 1A,B. When compared to other plants, Rumex acetosa L. has the highest mean TPC value (34.88); the TFC values range from 7.42 to 42.16 for Urtica dioica L. and Hypericum perforatum L., respectively. The cluster bar plot (Figure 1A,B and Figure 2), which includes error bars on each bar, visually conveys the same data as the tables in the Supplementary Section, which enables a quicker comparison of the TPC and TFC values among the various plants. The plot also demonstrates the high degree of variability in the TPC values for Rumex acetosa L. and Armoracia rusticana. Overall, these findings imply that TPC and TFC levels vary among the various plants regardless of the sample locations and that these levels may be crucial in determining the bioactivity of the plants.
From Figure 3 and Figure 4, the heatmap with dendrogram links provides a more detailed breakdown of the chemical compounds and their relationships within the different plant groups. The dendrogram links show the clustering of the different compounds based on their similarities. In the heatmap given in Figure 4, the data information was presented graphically with colors: blue represents the least similarity, red represents the greatest similarity on the color scale, and the intensity of the color is proportional to the compound concentration in the plant.
From Figure 4, for instance, looking at the chart, Rumex acetosa L. is seen to have a very strong positive relationship within its group. The compounds 30 Rumex acetosa L., 28 Rumex acetosa L., 33 Rumex acetosa L., 31 Rumex acetosa L., and 32 Rumex acetosa L. all have a correlation greater than 0.9, indicating a strong relationship. On the other hand, Hypericum perforatum L. has a very low relationship, ranging from 0–0.2, with other compounds. The same relationship was observed for different groups, starting from t-cinnamic, 4-hydroxybenzoic, gallic, quercetin, salicylic, luteolin, vanillic, protocatechuic, apigenin, vanillin, vitexin, naringenin, TFC, and ferulic. In contrast, all other groups have a high correlation with each other. This suggests that these groups may share similar chemical properties.
The strongest positive correlation with flavonoids is found in Hypericum perforatum L., while Rumex acetosa L. has a strong positive relationship with TPC values. There is no positive or negative relationship between TFC and the majority of TPC values and Urtica dioica L. Overall, the heatmap provides a more in-depth view of the relationships between the chemical compounds and plant groups, allowing for a more detailed analysis of the chemical properties and similarities between the different compounds.
The below biplot in Figure 5 shows that the variables are related to each other with respect to principal component one and principal component two. The data presented in Figure 5 indicate that changes in “kwasy” content to “rosliny” are most influenced by Vanilin, ferulic Apigenin, Naringeninand, and Vitexin, and these acids are positively correlated. At the same time, the change in acid content within the plants under study is very much influenced by the content of acids in the group: 4-hydroxybenzonic, gallic, t-Cinnamic, and Quercin, whose contents are positively correlated with each other. The content of acids in this group is negatively correlated with the content of Caffeic. Vanillic has the least impact on the overall change in acid content.
These variables are positively correlated in the second and third quadrants but negatively correlated in the first and fourth quadrants. Figure 5 shows how much of the data’s variability is captured by the biplot’s two dimensions. In this case, the two dimensions explain 53% of the data variation, suggesting that the biplot may be missing dimensions.
Microbial analyses in Figure 6 indicate that we used the minimum inhibitory concentration (MIC) method to examine the effects of Armoracia rusticana, extracted against seven different bacterial strains. Figure 6 displays each bacteria strain’s mean, standard deviation, and minimum and maximum values.
The MIC value with the lowest value represents the best bacterial growth inhibition, according to the data. With a mean MIC value of 0.34 ± 0.06%, the Armoracia rusticana. Extract from Figure 6 appears to be the most effective against Micrococcus luteus. Additionally, L. innocua and P. fragii are relatively resistant to it and are less effective against the other strains. The MIC values for Proteus mirabilis, Listeria innocuous, Pseudomonas fluorescens, Pseudomonas fragii, and Salmonella enteritidis ranged from 0.5 to 1.2.%. The results are consistent across various measurements, as shown by the low standard deviations for the MIC values. According to Figure 6, Armoracia rusticana has the highest MIC value of 1.6 for Escherichia coli. In contrast, the lowest MIC value of 0.2 was observed for M. luteus. In general, Armoracia rusticana has a higher MIC value for all the microorganisms when compared to Plantago major L., Hypericum perforatum L., Rumex acetosa L., and Urtica dioica L.
Figure 6 indicates the MIC values for Hypericum perforatum L are extracted against the bacterial strains, according to the data. With mean MIC values of 0.14 and 0.16, the Hypericum perforatum L. extract from Figure 6 appears to be the most effective against Micrococcus luteus and Listeria innocua. It also works moderately against Proteus mirabilis, P. fragii, and P. fluorescens. With mean MIC values ranging from 0.85 to 1.12, it is less effective against Escherichia coli and Salmonella enteritidis. The highest MIC value was observed for E. coli, with a value of 1.6, while the lowest MIC value was observed for M. luteus, with a value of 0.05. Hypericum perforatum L has the lowest MIC values compared to Armoracia rusticana, Plantago major L., Rumex acetosa L., and Urtica dioica L. for Listeria innocua.
Based on Figure 6, the Plantago major L. extract performed well against bacterial strains. The table displays each bacteria strain’s mean according to the data. The mean MIC value of the Plantago major works against Proteus mirabilis, Listeria innocua, Pseudomonas fluorescens, and Pseudomonas fragii. In contrast, the highest MIC value was observed for Escherichia coli, with a value of 1.6, while the lowest MIC value was observed for Micrococcus luteus. Plantago major L. has a lower MIC value for Escherichia coli and Proteus mirabilis when compared to Armoracia rusticana but a higher MIC value for the other five strains.
In Figure 6, it appears that we have been examining Rumex acetosa L. extract when performed against seven strains. The Rumex acetosa L. extract from Figure 6 appears to be the most effective against Micrococcus luteus. It is also the only one that works effectively against all strains, with mean values ranging from 0.11 to 0.32. The maximum MIC value was observed for Escherichia coli, with a value of 0.43, while the minimum MIC value was observed for Micrococcus luteus, based on the data from Figure 6. Rumex acetosa L. has the strongest inhibitor effect against all microorganisms compared to Armoracia rusticana, Hypericum perforatum L., Plantago major L., and Urtica dioica L.
Figure 6 above indicates the impact of Urtica dioica L. extract and displays a mean MIC moderately effective against Listeria innocua (mean MIC = 0.29) but is marginally effective against the other strains, including Escherichia coli. With a mean MIC of 0.55, it is less effective against Salmonella enteritidis and Urtica dioica L. but more effective against all strains when compared to Armoracia rusticana, P. major L., and Hypericum perfortum L. The maximum MIC value was observed for Salmonella enteritidis, with a value of 0.6%, while the lowest MIC value was observed for Micrococcus luteus, with a value of 0.1%.
Figure 7 shows the average mean values across all extract samples against the seven strains of bacteria. Looking at Figure 7, it appears that Rumex acetosa L. has the lowest mean MIC value for all bacterial strains. Generally, Urtica dioica L. has the lower mean MIC value for Listeria innocua (0.29) and Escherichia coli (0.52; when compared to P. major L., Armoracia rusticana has the highest mean MIC value for Salmonella enteritidis (1.12), while Planta major L. has the highest mean MIC value for Proteus mirabilis (0.85). Listeria innocua has a low sensitivity to Armoracia rusticana at 0.59%. Rumex acetose L. has the highest inhibitor growth effect against Salmonella enteritidis at 0.31%, according to the data displayed in Figure 7. It is important to note that the mean MIC values for each plant vary depending on the bacteria strain, suggesting that each plant may have specific antimicrobial properties against certain bacteria.
Figure 7 shows a cluster bar chart of the mean MIC values of various plants for various microorganisms based on the data displayed in Figure 7. Each bar on the graph represents the mean MIC value of a specific plant for a specific microorganism. The chart shows that there are some differences in the mean MIC values among various plants and microorganisms. For instance, Rumex acetosa L. has the lowest mean MIC value for Micrococcus luteus, while Urtica dioica L. appears to have a relatively low mean MIC value for Escherichia coli, Proteus mirabilis, and Listeria innocua. It is also obvious that some microorganisms respond differently to plant extracts. For instance, Micrococcus luteus appears to be the most susceptible microorganism and has the lowest mean MIC values for most plants, whereas Salmonella enteritidis shows the highest resistance of all strains against the five plant extracts as well as the highest mean MIC values for all plants.
Overall, the cluster bar chart highlights the differences in antimicrobial activity between various plants and microorganisms while providing a clear and simple-to-read summary of the MIC data. The graph could serve as a roadmap for further research into the specific antimicrobial traits of the plants and serve as a way to find potential candidates for the creation of novel antimicrobial agents.
The dendrogram presented above in Figure 8 illustrates the hierarchical clustering of microorganisms based on their similarity in terms of MIC values. The dendrogram divided the strains into three distinct groups in response to plant extracts, starting from the top of the figure. Clusters 1 and 7 (Salmonella enteritidis and Escherichia coli) are found close to each other with a rescaled distance cluster of four and have nearly identical MIC values among all samples. Clusters 3 and 4 (Listeria innocua and Micrococcus luteus) are even closer, with a rescaled distance cluster of three, suggesting that Micrococcus luteus should be used as a control sample. Pseudomonas fluorescens and Pseudomonas fragii (Clusters 5 and 6, respectively) are the two closest clusters, with a rescaled distance of one. The rescaled cluster distance between Pseudomonas fluorescens and Proteus mirabilis is four, while the combined distance to Listeria innocua is eight. The highest distance observed between clusters is twenty-five, while the lowest distance is one. Finally, based on the graph, this information is crucial for understanding the data’s underlying structure and identifying groups among the microorganisms.
The results of assessing the content of bioactive compounds in 38 extracts for seven variables are presented in Figure 9 and Figure 10. They indicate that all bioactive compounds have a similar impact on the content of bacteria. Of these, the highest values were observed for Escherina coli, Pseudomonas fluorescence, and Listeria innocua. The first principal component describes 77.4% of the total variation in the data, whereas the second principal component describes 14.2% of the variation. Escherichia coli, Pseudomonas fluorescens, Salmonella enteridis, and Pseudomonas fragii are four organisms that are positively correlated. A similar trend we can observe in the group is of Micrococcus luteus, Proteus mirabilis, and Listeria innocua. As the content of one of these components increases, the content of the others increases.

4. Discussion

This study was designed to qualitatively and quantitatively assay the phytochemical content of plant parts of Plantago major L., Armoracia rusticana, Hypericum perforatum L., Rumex acetosa L., and Urtica dioica L., obtained from various geographical locations, and to assess the antimicrobial activities of extracts obtained from each plant variety, quantified by their minimum inhibitory concentrations (MIC) against seven microorganisms; Escherichia coli, Proteus mirabilis, Listeria innocua, Micrococcus luteus, Pseudomonas fluorescens, Pseudomonas fragii, and Salmonella enteritidis.
Qualitative analysis of Plantago major L. extracts revealed the presence of a host of phytochemical compounds, including gallic acid, 4-hydroxybenzoic acid, vanillic acid, caffeic acid, syringic acid, vanillin, p-coumaric acid, benzoic acid, ferulic acid, sinapic acid, t-cinnamic acid, chlorogenic acid, protocatechuic acid, rosmarinic acid, salicylic acid, apigenin, catechin, kaempferol, luteolin, naringenin, quercetin, and rutin. This is in conformity with the submissions of [9], who reported the presence of flavonoids, alkaloids, terpenoids, phenolic compounds (caffeic acid derivatives), iridoid glycosides, fatty acids, polysaccharides, and vitamins in Plantago major L. plant parts.
The individual phytochemicals were also found to vary among different locations; syringic acid demonstrated the highest variability of all identified phytochemicals. The plant also has a mean polyphenolic content ranging from 29.04 mg/g to 41.09 mg/g, and an average phenolic acid and flavonoid content of 18.96 and 16.26, respectively, was reported. The obtained results are in contrast with the reports of [20], who found that Plantago major L. leaves contain about 13 mg/g of total phenolic content and 6.4 mg/g of flavonoids.
Similarly, several polyphenolic acids, flavonoids, and other bioactive phytochemicals were identified from extracts of Armoracia rusticana. Syringic acid and rutin content, with standard deviations of 2.08 and 1.42 mg/g, respectively, were found to vary the most in the nine Armoracia rusticana varieties studied. The variations in phytochemical content observed have already been implied in the findings of [21], who demonstrated the susceptibility of Armoracia rusticana to environmental factors like rainfall, CO2, and light intensity, among others. The authors studied the “agronomic characteristics of two horseradish (Armoracia rusticana) accessions grown in an open field under rainfed Mediterranean conditions”. In this study, the total phenolic and TFC content of the plant was obtained to be 25.86 and 14.42 mg/g, respectively. The total phenolic content of Armoracia rusticana has previously been determined to be between 0.19 and 31.93 mg/g of extract, while the flavonoid content ranged between 7.71 and 89.29 mg/g [22].
Hypericum perforatum L. was obtained from ten locations, and a significant variability was observed in the phytochemical composition of the plant extract. TPC and TFC have been reported in the literature to range from 182.93 to 125.99 mg/g and from 15.2 to 14.84 mg/g, respectively [23]. Rumex acetosa L. recorded the highest variability in quercetin (SD = 3.69 mg/g) and t-cinnamic acid (SD = 3.48 mg/g) content from varieties obtained in seven locations. The average TPC (SD = 34.88 mg/g) and TFC (SD = 27.18 mg/g) recorded are significantly higher than what has been reported in the past, with a 2021 study finding 3.34 mg of TPC and 1.90 mg/g of TFC [24].
Urtica dioica plants obtained from four locations also had similar results to what has been observed in the four other plants studied. Rutin was the most variable phytochemical, with a standard deviation of 1.13 mg/g, while caffeic (0.63 mg/g) and syringic acid (0.58 mg/g) both also recorded slightly elevated variance compared to other polyphenols. TPC was recorded as 13.16 mg/g, which is consistent with [25], which reported a range of 5.92 mg/g to 23.23 mg/g in Urtica dioica plants harvested in the Tuzla area (Bosnia and Herzegovina) in June 2020. TFC was also found to be 7.42 mg/g, in contrast to [25], which reported 0.81 mg/100 g—3.05 mg/100 g, and [25], which reported 43.3 ± 0.37 mg/g.
Statistically, the p-values are all lower than 0.05, signifying a 95% confidence level, and so the variability observed in these phytochemicals among the plants and within the various varieties is statistically significant. Conversely, kaempferol demonstrated that these results are not statistically significant, owing to the p-value of 0.506 recorded (based on the institution of statistical significance at p ≤ 0.05). Similarly, vanillic acid and luteolin had p-values of 0.372 and 0.498, respectively, causing the variabilities obtained to be statistically insignificant at a 95% confidence level.
With regards to the microbial activities of the five plants and their varieties under investigation, the results obtained within the Armoracia rusticana varieties showed the lowest microbial activity against Micrococcus luteus and Listeria innocua. All other microorganisms demonstrated relatively lower susceptibility to the plant extracts, with MICs ranging from 0.72 to 1.12%. These results further lend credence to reports of the antimicrobial properties of Armoracia rusticana plant parts and formulations against microorganisms, including Enterococcus faecalis, Staphylococcus aureus, Escherichia. coli, Proteus mirabilis, Proteus vulgaris, Pseudomonas aeruginosa, Salmonella enteritidis, Bacillus megatherium, and Listeria monocytogenes [26,27,28]. We investigated the antibacterial activities of isothiocyanates extracted from Armoracia rusticana roots against four strains of antibiotic-resistant bacteria: methicillin-resistant Staphylococcus aureus (MRSA), vancomycin-resistant S. aureus (VRSA), multidrug-resistant Acinetobacter baumanii (MRAB), and multidrug-resistant Pseudomonas aeruginosa (MRPA) using a broth microdilution method; the extract was able to inhibit the growth of the organism like other susceptible antibiotics. Mickymaray et al. [26] carried out an investigation to evaluate the In Vitro Antioxidant and Bactericidal Efficacy of 15 Common Spices as a novel alternative for urinary tract infections. Armoracia rusticana was among the four spices that gave the highest MIC values against Enterobacter aerogenes, Staphylococcus aureus, and Proteus mirabilis using the disc diffusion method. From the selected studies, the antimicrobial activities of Armoracia rusticana have since been proven, and the result of this work puts more emphasis on that.
Hypericum perforatum also had significant activity against Micrococcus luteus and Listeria innocua. With other microorganisms, the plant recorded relatively higher MICs. The antimicrobial properties of Hypericum perforatum have already been reported against numerous bacteria in the past, including Staphylococcus oxford aureus, Streptococcus mutans, Streptococcus sanguis, Salmonella typhi, Shigella dysenteriae, Yersinia enterocolitica, Enterococcus faecalis, Escherichia coli, Streptococcus pyogenes, Streptococcus viridans, Micrococcus luteus, Moraxella catarrhalis, and Lactobacillus acidophilus [29,30]. In a study to demonstrate the in vitro antibacterial and phytochemical screening of Hypericum perforatum extract as a potential antimicrobial agent against multidrug-resistant (MDR) strains of Staphylococcus aureus (MRSA), Enterococcus faecalis, Escherichia coli, and Klebsiella pneumonia, an agar diffusion assay was used to measure the minimum inhibitory concentration (MIC).
Hypericum perforatum, in the study by Okmen et al. [29], which sought to determine the antibacterial effects of Hypericum perforatum L. extracts against mastitis pathogens, the extract demonstrated a maximal inhibition zone against two bacteria (Coagulase-negative Staphylococci 33 and 37; CNS 33 and 37). The results from this study offer credence to the result obtained, showing that Hypericum perforatum has a good antimicrobial profile.
Plantago major L. also recorded the highest antimicrobial activity against several microorganisms, including Escherichia coli, Staphylococcus aureus, Bacillus cereus, Bacillus subtilis, Staphylococcus epidermidis, Klebsiella pneumonia, Pseudomonas aeruginosa, Proteus mirabilis, Salmonella enteritidis, and Listeria monocytogenes, have been recorded in the literature [31,32,33]. In the assessment of the Plantago major L. extract for antimicrobial activities, the results showed that the MIC of the aqueous extract was between 0.022 mg/mL and 0.045 mg/mL for Staphylococcus aureus and between 0.09 mg/mL and 0.181 mg/mL for both Escherichia coli and Listeria monocytogenes using the disc diffusion method [31]. Plantago major extract had a high inhibition zone, which was exhibited on Staphylococcus aureus and Bacillus cereus, while moderate activities of 13.3 and 11.3 mm for the same fraction were obtained, respectively, against Pseudomonas aeruginosa and Acinetobacter bowie. Klebsiella pneumonia, Proteus mirabilis, and Salmonella typhimurium exhibited low susceptibility in comparison with the other strains in the study by Karima et al. [34] using disc diffusion and micro-dilution methods.
Similarly, the highest antimicrobial activity of Rumex acetosa L. against all strains had a significant effect against Salmonella enteritidis compared to the other extracts, while the highest antimicrobial activity of Urtica dioca L. was recorded against L. innocua, with each plant demonstrating relatively lower but fairly significant activity against the other strains. The antimicrobial properties of Rumex acetosa L. against staphylococci and Gram-negative bacteria, including Escherichia coli, Proteus mirabilis, Pseudomonas aeruginosa, as well as fungi Candida spp., or Trichophyton mentagrophytes, have been reported using the agar dilution method [35]. Urtica dioca L. has also demonstrated antimicrobial activity against Acinetobacter calcoaceticus, Bacillus cereus, Bacillus spizizenii, Micrococcus spp., Vibrio parahaemolyticus, Escherichia coli, Bacillus subtilis, methicillin-resistant Staphylococcus aureus, Klebsiella pneumonia, and Salmonella paratyphi B [36,37]. On average, Rumex acetosa L. appeared to demonstrate the highest antimicrobial activity, with a mean MIC of approximately 0.28%, followed by Urtica dioca L., which has an average MIC of 0.38%. Escherichia coli also appeared to be the microorganism most resistant to the plant extracts, with a mean MIC of 0.85%, while Micrococcus. luteus was the most susceptible. Statistical significance is recorded, with all microorganisms recording a p-value well below 0.05.
The role environmental factors play in the phytochemical composition of various plant parts has been demonstrated on numerous occasions in the literature. Environmental factors such as light intensity, CO2 concentration, average temperature, and soil content, among others, play pivotal roles in the growth and production of phytochemicals in plants [38]. Using High-Performance Liquid Chromatography (HPLC), Mass Spectrometry (MS), 1,1-diphenyl-2-picrylhydrazyl (DPPH), Thiobarbituric acid (TBA) assays, and other techniques, studies have found statistically significant differences in phytochemical compositions, which could influence the therapeutic functions of Plantago major L. [39,40], Hypericum perforatum [41], and Urtica dioica [42].
Similarly, Karimi et al. [43,44] reported that light intensity was an important factor in the production and antioxidant activity of flavonoids and phenolic phytochemicals in Labisia pumila Benth, a plant with known antifungal, antibacterial, antioxidant, and anti-inflammatory properties [43,44]. Importantly, soil composition has been indicated as an important factor in the metabolism of plants and, hence, the nature of phytochemical secondary metabolites produced in their plant parts.
It is a widely accepted theory that various environmental factors, either separately or in combination, can have direct and indirect influences on the phytochemical composition of plants. Understanding how these factors affect a plant’s phytochemical profile is useful in identifying bioactive constituents of natural origin intended to be studied for their potential medicinal and therapeutic applications [45]. This study [46] submitted that the genetic make-up, stage of development, and surrounding environmental factors frequently lead to spatial–temporal variations in the chemical profile of plants.
The chemical composition of medicinal plant material also varies noticeably depending on harvesting methods, post-harvest processing, storage conditions, widespread pesticide usage, frequent adulteration, and microbial contamination. The authors further stated that for a complete set of quality assurance for medicinal plant material, DNA-based diagnosis, quantitative profiling of chemical markers, and traditional purity measures should be used. Therefore, it has become crucial to use an integrated strategy of DNA barcoding and quantitative metabolomics to evaluate the potency, purity, consistency, and safety of medicinal plants. In addition, controlling the quality and guaranteeing the stability of herbal medicines are significant problems for the herbal business because there are numerous factors that might impact the concentration of active compounds in herbal materials and products.
It is now possible to produce homogeneous medicinal herbal products because of the rapid development of sophisticated analytical techniques and industrial technologies, including in vitro cell culture, plant breeding, plant cell bioreactor, and organ culture, among others. In vitro plant tissue cultivation guarantees independence from geographic circumstances by removing the need to rely on wild plants. Moreover, the utilization of plants for the synthesis of more designed substances, including vaccines and a variety of medications, is made possible through plant transformation. Using plant tissue culture, several phytochemicals like anthocyanins, paclitaxel, scopolamine, shikonin, coumarins, alkaloids, and others have been produced for medicinal purposes. Additionally, scientists contend that bioreactors are novel biotechnology setups that, in promoting the large-scale production of desired secondary metabolites, can contribute to biodiversity and reduce the man-to-equipment ratio requirement of conventional in vitro culture setups [47,48,49].

5. Conclusions

This study investigated the antibacterial capabilities of various plants against food spoilage as well as human pathogenic microorganisms. The focus was to determine the level of antibacterial activity that each plant demonstrated and to what extent it differed among various varieties from distinct locations. The results showed that all the plants under investigation exhibited significant antibacterial activity. Rumex acetose L. recorded the highest antimicrobial activity against Escherichia coli and Salmonella enteritidis.
While this finding is useful, it is important to note that the phytochemical composition of the plants was found to vary significantly among plant varieties obtained from different locations. Even though all the plants demonstrated antibacterial activity, different varieties of the plants had varying degrees of effectiveness against bacteria. Micrococcus luteus showed the lowest resistance to all plant samples. Both Gram-negative and Gram-positive bacteria were evaluated, and the results indicated that these plants could potentially be effective against a wide range of bacteria. However, the different chemical compositions of the plants may explain the statistically significant disparities in their antimicrobial activities.
The findings of this study imply that the geographical parameters of the locations where these plants grow have a slightly strong influence on their biochemical makeup and biological activities. Therefore, in order to fully understand the potential value of medicinal plants, it is crucial to investigate and compare the phytochemical profiles of different varieties of the same plant obtained from different locations. Such findings could advance our understanding of how to maximize the therapeutic benefits of medicinal plants in disease management.
Furthermore, all the plants demonstrated significant antimicrobial activity against the pathogens for which they were tested. Their activities, measured in terms of minimum inhibitory concentrations, appeared to be comparable to what has earlier been reported in the literature. Interestingly, all the plants seemed to exhibit the highest antimicrobial activity (marked by relatively low MICs) against M. luteus and L. innocua. However, they also exhibited significant activities against other microorganisms, including Escherichia coli, Proteus mirabilis, Pseudomonas fluorescens, Pseudomonas fragii, and Salmonella enteritidis. These results demonstrate the value of the plants as medicinal plants of potential clinical and therapeutic value as antimicrobial agents against the aforementioned pathogens. A pertinent recommendation for further research would be to aim to elucidate the particular phytochemicals from the plants that affect the antimicrobial activities observed and to quantify the extent to which synergism among two or more phytochemicals influences the antimicrobial properties of the plant. This is in order to standardize the plants for clinical use.

Supplementary Materials

The following supporting information can be downloaded at: https://www.mdpi.com/article/10.3390/app132413196/s1, Table S1: The Location and arial parts of the samples in Poland; Table S2: The average mean values mg/g for the whole Plantago major L.; Table S3: Total phenolic acid content mg/g and total flavonoid content mg/g in the Plantago major L. extract; Table S4: The average mean mg/g values for the whole Armoracia rusticana; Table S5: Total phenolic acid content and total flavonoid content mg/g in the Armoracia rusticana extract; Table S6: The average mean mg/g values for the whole Hypericum perforatum L. extract; Table S7: Total phenolic acid content TPC mg/g and total flavonoid content TFC mg/g in the Hypericum perforatum L. extract; Table S8: The average mean values mg/g for the whole Rumex acetosa L. extract; Table S9: Total phenolic acid content mg/g and total flavonoid content mg/g in the Rumex acetosa L. extract; Table S10: The average mean mg/g values for the whole Urtica dioica L. extract; Table S11: Total phenolic acid content mg/g and total flavonoid content mg/g in the Urtica dioica L. extract; Table S12: The minimum inhibitory concentrations (MIC) [%] in five plants extract.

Author Contributions

Conceptualization, O.S., L.S.-M. and K.S.-S.; Methodology, O.S., L.S.-M. and A.P.-B.; Software, D.Ś.; Validation, A.P.-B.; Formal analysis, O.S., L.S.-M., A.P.-B. and T.S.; Investigation, R.C.-R.; Resources, T.S. and R.C.-R.; Data curation, T.S. and D.Ś.; Writing—original draft, O.S., L.S.-M. and A.P.-B.; Writing—review & editing, T.S., R.C.-R. and K.S.-S.; Visualization, A.P.-B.; Supervision, R.C.-R.; Project administration, K.S.-S.; Funding acquisition, K.S.-S. All authors have read and agreed to the published version of the manuscript.

Funding

This research received no external funding.

Institutional Review Board Statement

Not applicable.

Informed Consent Statement

Not applicable.

Data Availability Statement

Data are contained within the article and Supplementary Materials.

Conflicts of Interest

The authors declare no conflict of interest.

References

  1. Süntar, I. Importance of ethnopharmacological studies in drug discovery: Role of medicinal plants. Phytochem. Rev. 2020, 19, 1199–1209. [Google Scholar] [CrossRef]
  2. Xiong, Y.; Long, C. An ethnoveterinary study on medicinal plants used by the Buyi people in Southwest Guizhou, China. J. Ethnobiol. Ethnomed. 2020, 16, 46. [Google Scholar] [CrossRef] [PubMed]
  3. Lowe, H.; Steele, B.; Bryant, J.; Fouad, E.; Toyang, N.; Ngwa, W. Antiviral activity of Jamaican medicinal plants and isolated bioactiv compounds. Molecules 2021, 26, 607. [Google Scholar] [CrossRef] [PubMed]
  4. Tran, N.; Pham, B.; Le, L. Bioactive Compounds in Anti-Diabetic Plants. Biology 2020, 9, 252. [Google Scholar] [CrossRef] [PubMed]
  5. Fu, Y.; Luo, J.; Qin, J.; Yang, M. Screening techniques for the identification of bioactive compounds in natural products. J. Pharm. Biomed. Anal. 2019, 168, 189–200. [Google Scholar] [CrossRef] [PubMed]
  6. Moussaoui, F.; Alaoui, T. Evaluation of antibacterial activity and synergistic effect between antibiotic and the essential oils of some medicinal plants. Asian Pac. J. Trop. Biomed. 2016, 6, 32–37. [Google Scholar] [CrossRef]
  7. Lomovsky, O.I.; Lomovskiy, I.O.; Orlov, D.V. Mechanochemical solid acid/base reactions for obtaining biologically active preparations and extracting plant materials. Green Chem. Lett. Rev. 2017, 104, 171–185. [Google Scholar] [CrossRef]
  8. Kowalska-Krochmal, B.; Dudek-Wicher, R. The minimum inhibitory concentration of antibiotics: Methods, interpretation, clinical relevance. Pathogens 2021, 10, 165. [Google Scholar] [CrossRef]
  9. Adom, M.B.; Taher, M.; Mutalabisin, M.F.; Amri, M.S.; Abdul Kudos, M.B.; Wan Sulaiman, M.W.A.; Sengupta, P.; Susanti, D. Chemical constituents and medical benefits of Plantago major. Biomed. Pharmacother. 2017, 96, 348–360. [Google Scholar] [CrossRef]
  10. Mazzutti, S.; Riehl, C.A.S.; Ibañez, E.; Ferreira, S.R.S. Green-based methods to obtain bioactive extracts from Plantago major and Plantago lanceolata. J. Supercrit. Fluids 2017, 119, 211–220. [Google Scholar] [CrossRef]
  11. Stillo, P.; Icka, P.; Damo, R. Armoracia rusticana Gaertn., Mey. & Scherb. A neglected multiuseful species. BSHN 2018, 26, 312–322. [Google Scholar]
  12. Seyis, F.; Yurteri, E.; Özcan, A.; Cirak, C. Altitudinal impacts on chemical content and composition of Hypericum perforatum, a prominent medicinal herb. S. Afr. J. Bot. 2020, 135, 391–403. [Google Scholar] [CrossRef]
  13. Korpelainen, H.; Pietiläinen, M. Sorrel (Rumex acetosa L.): Not Only a Weed but a Promising Vegetable and Medicinal Plant. Bot. Rev. 2020, 86, 234–246. [Google Scholar] [CrossRef]
  14. Almasi, H.; Zandi, M.; Beigzadeh, S.; Haghju, S.; Mehrnow, N. Chitosan films incorporated with nettle (Urtica dioica L.) extract-loaded nanoliposomes: II. Antioxidant activity and release properties. J. Microencapsul. 2016, 33, 449–459. [Google Scholar] [CrossRef] [PubMed]
  15. Kurasiak-Popowska, D.; Graczyk, M.; Przybylska-Balcerek, A.; Stuper-Szablewska, K.; Szwajkowska-Michałek, L. An Analysis of Variability in the Content of Phenolic Acids and Flavonoids in Camelina Seeds Depending on Weather Conditions, Functional Form, and Genotypes. Molecules 2022, 27, 3364. [Google Scholar] [CrossRef] [PubMed]
  16. P Przybylska-Balcerek, A.; Szablewski, T.; Szwajkowska-Michałek, L.; Świerk, D.; Cegielska-Radziejewska, R.; Krejpcio, Z.; Suchowilska, E.; Tomczyk, Ł.; Stuper-Szablewska, K. Sambucus nigra Extracts—Natural Antioxidants and Antimicrobial Compounds. Molecules 2021, 26, 2910. [Google Scholar] [CrossRef] [PubMed]
  17. Przybylska-Balcerek, A.; Frankowski, J.; Stuper-Szablewska, K. Bioactive compounds in sorghum. Eur. Food Res. Technol. 2019, 245, 1075–1080. [Google Scholar] [CrossRef]
  18. Dziedzinski, M.; Kobus-Cisowska, J.; Szymanowska, D.; Stuper-Szablewska, K.; Baranowska, M. Identification of Polyphenols from Coniferous Shoots as Natural Antioxidants and Antimicrobial Compounds. Molecules 2020, 25, 3527. [Google Scholar] [CrossRef]
  19. Stuper-Szablewska, K.; Szablewski, T.; Przybylska-Balcerek, A.; Szwajkowska-Michałek, L.; Krzyżaniak, M.; Świerk, D.; Cegielska-Radziejewska, R.; Krejpcio, Z. Antimicrobial Activities Evaluation and Phytochemical Screening of Some Selected Plant Materials Used in Traditional Medicine. Molecules 2023, 28, 244. [Google Scholar] [CrossRef]
  20. Przybylska-Balcerek, A.; Szablewski, T.; Cegielska-Radziejewska, R.; Góral, T.; Kurasiak-Popowska, D.; Stuper-Szablewska, K. Assessment of Antimicrobial Properties of Phenolic Acid Extracts from Grain Infected with Fungi from the Genus Fusarium. Molecules 2022, 27, 1741. [Google Scholar] [CrossRef]
  21. Kobeasy, I.; El-salam, S.M.A. Biochemical studies on Plantago major L. Int. J. Biodivers. Conserv. 2011, 3, 83–91. [Google Scholar]
  22. Stuper-Szablewska, K.; Przybylska, A.; Kurasiak-Popowska, D.; Perkowski, J. Ferulic acid. Properties, determination and application in cosmetics. Przem. Chem. 2017, 96, 2070–2076. [Google Scholar] [CrossRef]
  23. Tomsone, L.; Kruma, Z. Comparison of different solvents for isolation of phenolic compounds from horseradish (Armoracia rusticana L.) leaves. Res. Rural Dev. 2013, 1, 104–110. [Google Scholar]
  24. Sekeroglu, N.; Urlu, E.; Kulak, M.; Gezici, S.; Dang, R. Variation in total polyphenolic contents, DNA protective potential and antioxidant capacity from aqueous and ethanol extracts in different plant parts of Hypericum perforatum L. Indian J. Pharm. Educ. Res. 2017, 51, S1–S7. [Google Scholar] [CrossRef]
  25. Puccinelli, M.; Pezzarossa, B.; Pintimalli, L.; Malorgio, F. Selenium Biofortification of Three Wild Species, Rumex acetosa L., Plantago coronopus L., and Portulaca oleracea L., Grown as Microgreens. Agronomy 2021, 11, 1155. [Google Scholar] [CrossRef]
  26. Begić, S.; Horozić, E.; Alibašić, H.; Bjelić, E.; Seferović, S.; Kozarević, E.C.; Ibišević, M.; Zukić, A.; Karić, E.; Softić, M. Antioxidant Capacity and Total Phenolic and Flavonoid Contents of Methanolic Extracts of Urtica dioica L. by Different Extraction Techniques. Int. Res. J. Pure Appl. Chem. 2020, 21, 207–214. [Google Scholar] [CrossRef]
  27. Pourmorad, F.; Hosseinimehr, S.J.; Shahabimajd, N. Antioxidant activity, phenol and flavonoid contents of some selected Iranian medicinal plants. Afr. J. Biotechnol. 2006, 5, 1142–1145. [Google Scholar]
  28. Mickymaray, S.; Al Aboody, M.S. In vitro antioxidant and bactericidal efficacy of 15 common spices: Novel therapeutics for urinary tract infections? Medicina 2019, 55, 289. [Google Scholar] [CrossRef]
  29. Nedorostova, L.; Kloucek, P.; Kokoska, L.; Stolcova, M.; Pulkrabek, J. Antimicrobial properties of selected essential oils in vapour phase against foodborne bacteria. Food Control 2009, 20, 157–160. [Google Scholar] [CrossRef]
  30. Kim, H.Y.; Phan-a-god, S.; Shin, I.S. Antibacterial activities of isothiocyanates extracted from horseradish (Armoracia rusticana) root against Antibiotic-resistant bacteria. Food Sci. Biotechnol. 2015, 24, 1029–1034. [Google Scholar] [CrossRef]
  31. Okmen, G.; Balpınar, N. The Biological Activities of Hypericum perforatum L. Afr. J. Tradit. Complement. Altern. Med. 2017, 14, 213–218. [Google Scholar] [CrossRef] [PubMed]
  32. Saddiqe, Z.; Naeem, I.; Maimoona, A. A review of the antibacterial activity of Hypericum perforatum L. J. Ethnopharmacol. 2010, 131, 511–521. [Google Scholar] [CrossRef] [PubMed]
  33. Suchowilska, E.; Wiwart, M.; Przybylska-Balcerek, A.; Stuper-Szablewska, K. The profile of bioactive compounds in the grain of various x Tritordeum genotypes. J. Cereal Sci. 2021, 102, 103352. [Google Scholar] [CrossRef]
  34. Osman, K.; Mohamed, J.; Hing, H. Effects of Methanol, Ethanol and Aqueous Extract of Plantago major on Gram Positive Bacteria, Gram Negative Bacteria and Yeast Biomedicine View Project Protective Effect of Palm Vitamin E on Streptozotocin Induced Diabetic Rats. 2008. Available online: https://www.researchgate.net/publication/308597277 (accessed on 13 April 2023).
  35. Özkan, O.; Metiner, K.; Ak, S. Antibacterial effects of ethanol and acetone extract of Plantago major L. on gram positive and gram negative bacteria. Kafkas Univ. Vet. Fak. Derg. 2012, 18, 503–505. [Google Scholar] [CrossRef]
  36. Karima, S.; Farida, S.; Mihoub, Z.M. Antioxidant and antimicrobial activities of Plantago major. Int. J. Pharm. Pharm. Sci. 2015, 7, 58–64. Available online: https://journals.innovareacademics.in/index.php/ijpps/article/view/5032 (accessed on 29 April 2023).
  37. Wegiera, M.; Kosikowska, U.; Malm, A.; Smolarz, H.D. Antimicrobial activity of the extracts from fruits of Rumex L. species. Cent. Eur. J. Biol. 2011, 6, 1036–1043. [Google Scholar] [CrossRef]
  38. Modarresi-Chahardehi, A.; Ibrahim, D.; Sulaiman, S.F.; Mousavi, L. Screening antimicrobial activity of various extracts of Urtica Dioica. Rev. Biol. Trop. 2012, 60, 1567–1576. [Google Scholar] [CrossRef]
  39. Singh, R.; Dar, S.A.; Sharma, P. Sabzar Antibacterial Activity. Res. J. Med. Plant 2012, 6, 123–135. [Google Scholar]
  40. Ghasemzadeh, A.; Jaafar, H.Z.E.; Bukhori, M.F.M.; Rahmat, M.H.; Rahmat, A. Assessment and comparison of phytochemical constituents and biological activities of bitter bean (Parkia speciosa Hassk.) collected from different locations in Malaysia. Chem. Cent. J. 2018, 12, 12. [Google Scholar] [CrossRef]
  41. Zubair, M.; Ekholm, A.; Nybom, H.; Renvert, S.; Widen, C.; Rumpunen, K. Effects of Plantago major L. leaf extracts on oral epithelial cells in a scratch assay. J. Ethnopharmacol. 2012, 3, 825–830. [Google Scholar] [CrossRef]
  42. Zubair, M.; Nybom, H.; Ahnlund, M.; Rumpunen, K. Detection of genetic and phytochemical differences between and within populations of Plantago major L. (plantain). Sci. Hortic. 2012, 136, 9–16. [Google Scholar] [CrossRef]
  43. Filippini, R.; Piovan, A.; Borsarini, A.; Caniato, R. Study of dynamic accumulation of secondary metabolites in three subspecies of Hypericum perforatum. Fitoterapia 2010, 81, 115–119. [Google Scholar] [CrossRef] [PubMed]
  44. Rasool, A.A.; Muhammad, K.A. Estimation of some plant secondary products in Urtica dioica L., Viola odorata L. and Melissa officinalis L. Naturally Grown in Hawraman-Kurdistan Region of Iraq. J. Agric. Sci. Technol. B 2013, 3, 480. Available online: https://www.researchgate.net/publication/318672929 (accessed on 17 May 2023).
  45. Karimi, E.; Jaafar, H.Z.E.; Ahmad, S. Antifungal, anti-inflammatory and cytotoxicity activities of three varieties of labisia pumila benth: From microwave obtained extracts. BMC Complement. Altern. Med. 2013, 13, 20. [Google Scholar] [CrossRef] [PubMed]
  46. Karimi, E.; Jaafar, H.Z.E.; Ghasemzadeh, A.; Ibrahim, M.H. Light intensity effects on production and antioxidant activity of flavonoids and phenolic compounds in leaves, stems and roots of three varieties of Labisia pumila Benth. Aust. J. Crop Sci. 2013, 7, 1016–1023. [Google Scholar]
  47. Liu, W.; Yin, D.; Li, N.; Hou, X.; Wang, D.; Li, D.; Liu, J. Influence of environmental factors on the active substance production and antioxidant activity in Potentilla fruticosa L. and its quality assessment. Sci. Rep. 2016, 6, 28591. [Google Scholar] [CrossRef] [PubMed]
  48. Dhami, N.; Mishra, A.D. Phytochemical variation: How to resolve the quality controversies of herbal medicinal products? J. Herb. Med. 2015, 5, 118–127. [Google Scholar] [CrossRef]
  49. Ruffoni, B.; Pistelli, L.; Bertoli, A.; Pistelli, L. Plant cell cultures: Bioreactors for industrial production. Adv. Exp. Med. Biol. 2010, 698, 203–221. [Google Scholar] [CrossRef]
Figure 1. (A) The average mean mg/g values phenolic acids for the whole extracts of plants. (B) The average mean mg/g values flavonoids for the whole extracts of plants.
Applsci 13 13196 g001aApplsci 13 13196 g001b
Figure 2. Comparison of total phenolic acid (TPC) and total flavonoid (TFC) mg/g extract in tested plants.
Applsci 13 13196 g002
Figure 3. Dendrogram for the comparison of content of bioactive compounds.
Applsci 13 13196 g003
Figure 4. Heatmap of the content of the compound concentration in the plant.
Applsci 13 13196 g004
Figure 5. Principal component analysis (PCA) was performed on 38 extracts for 23 variables compounds.
Applsci 13 13196 g005
Figure 6. Correlation Matrix conducted on 23 compounds across all samples (RStudio Version: 4.2.2).
Applsci 13 13196 g006
Figure 7. The cluster bar chart for the average mean value of MIC % of five plant extracts against 7 bacterial strains.
Applsci 13 13196 g007
Figure 8. Dendrogram based on MIC values.
Applsci 13 13196 g008
Figure 9. Principal component analysis (PCA) was performed on 38 extracts for 7 variables strains of bacteria for finding the optimal principal components (Figure has been obtained by RStudio Version: 4.2.2.).
Applsci 13 13196 g009
Figure 10. Correlation matrix conducted on 23 compounds and potential effect against Bacterial strains.
Applsci 13 13196 g010
Disclaimer/Publisher’s Note: The statements, opinions and data contained in all publications are solely those of the individual author(s) and contributor(s) and not of MDPI and/or the editor(s). MDPI and/or the editor(s) disclaim responsibility for any injury to people or property resulting from any ideas, methods, instructions or products referred to in the content.

