
Parallax of Head-Up Displays and Visual Safety for Driving


Abstract
:Featured Application
Abstract
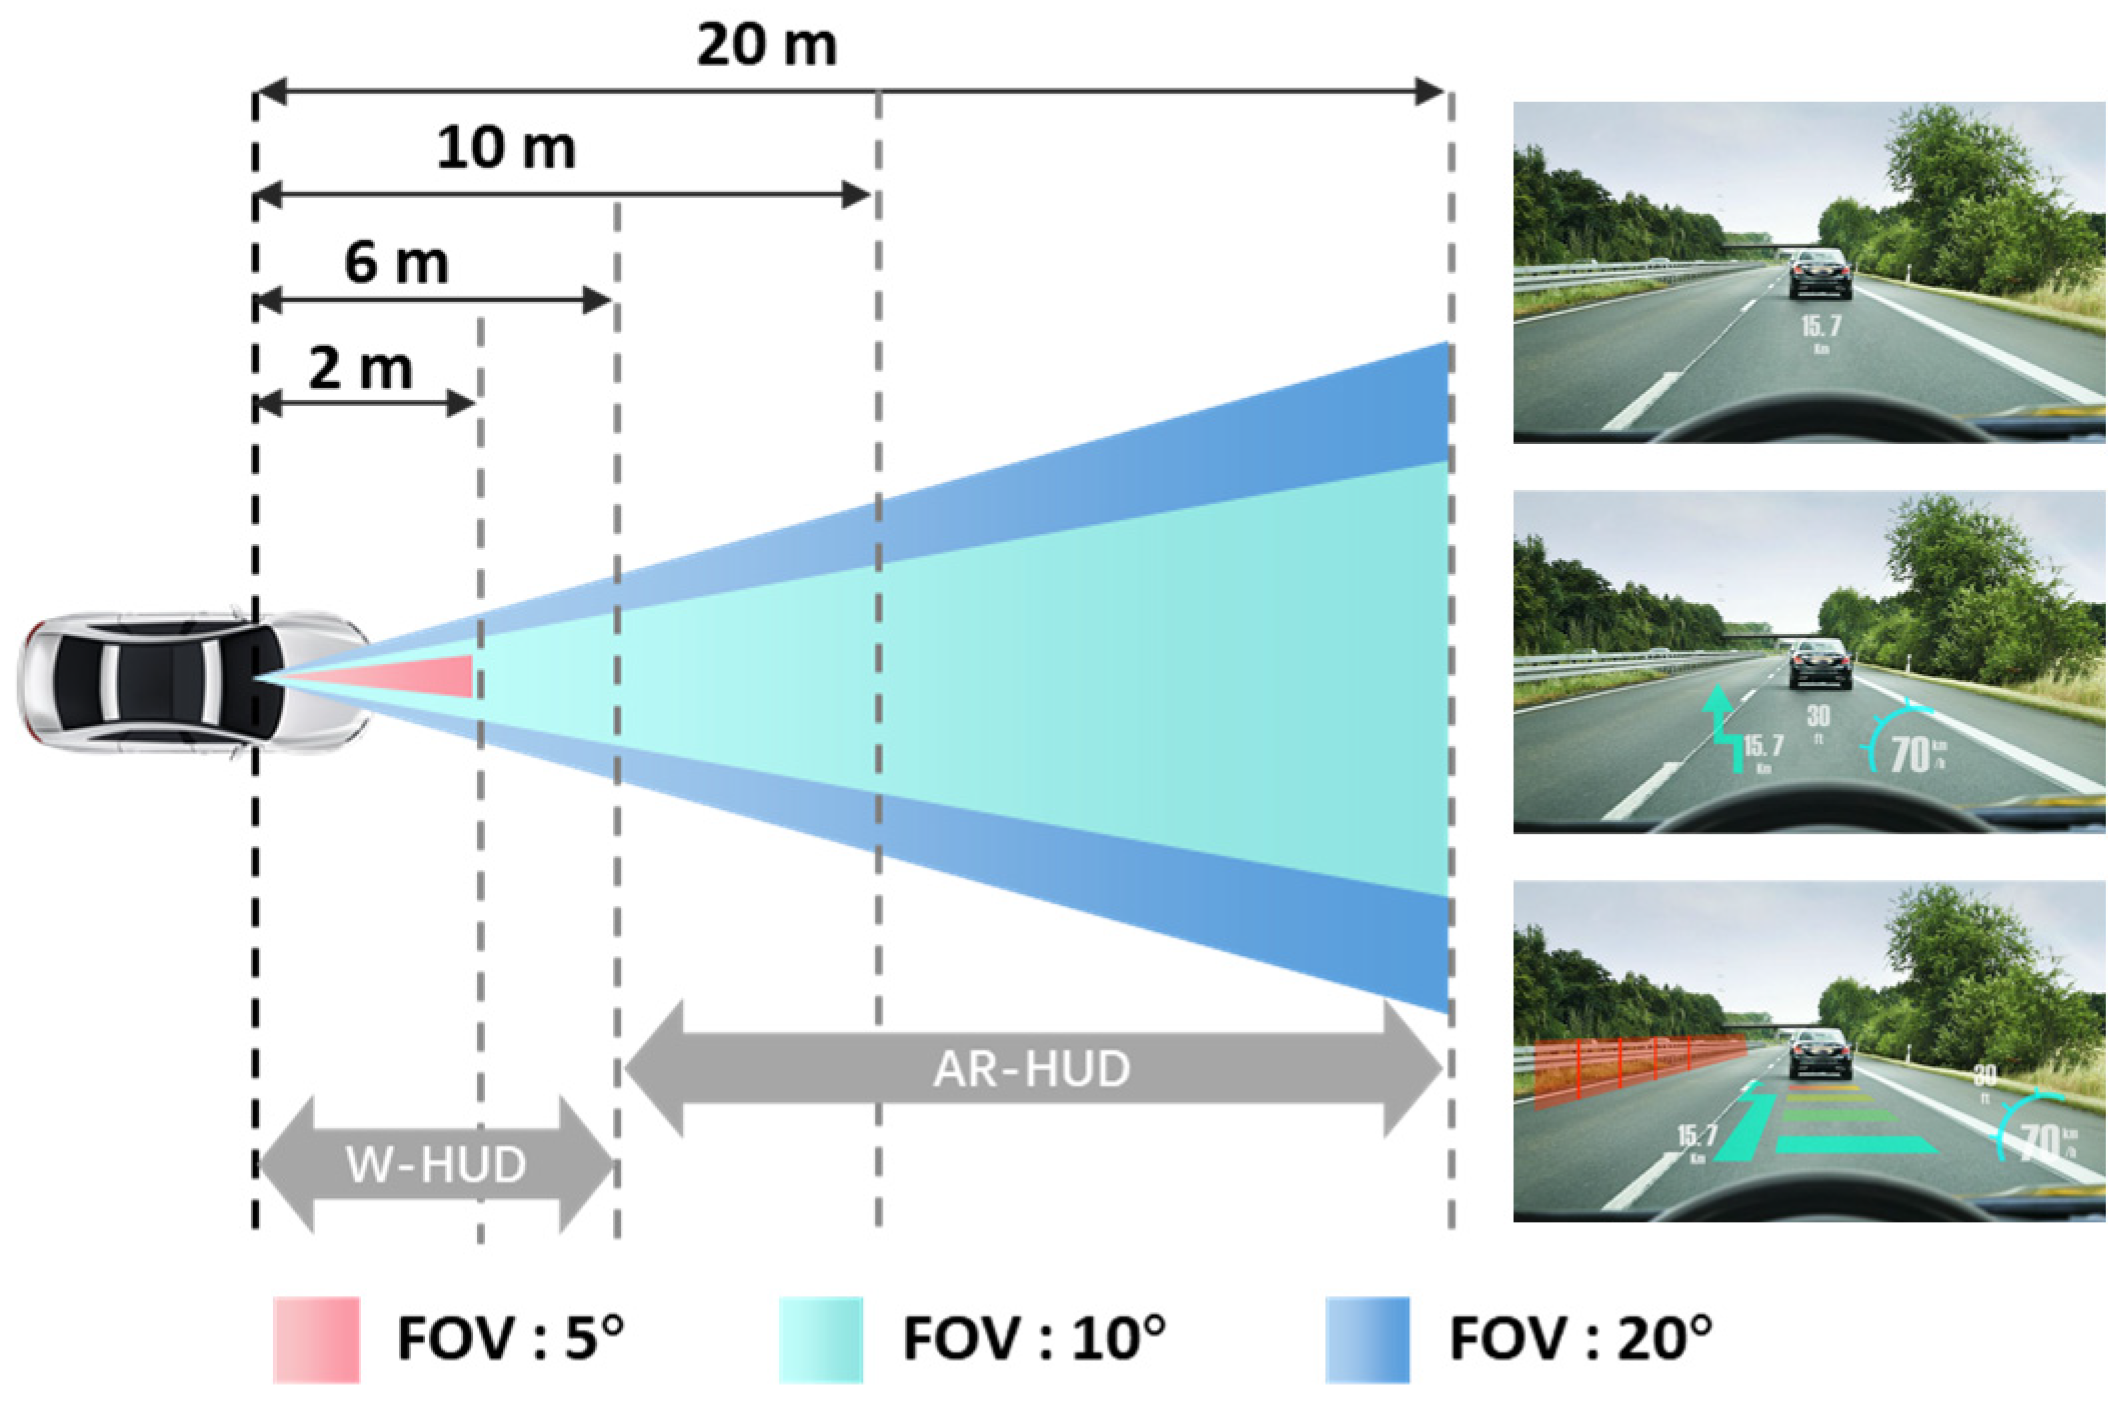
1. Introduction
- (1)
- The effect of overall parallax variation on visual fatigue and task performance in a 2D virtual display of a HUD;
- (2)
- The effect of parallax variance in neighboring positions on visual fatigue and task performance in a 2D display of a HUD and the range of accepted parallax;
- (3)
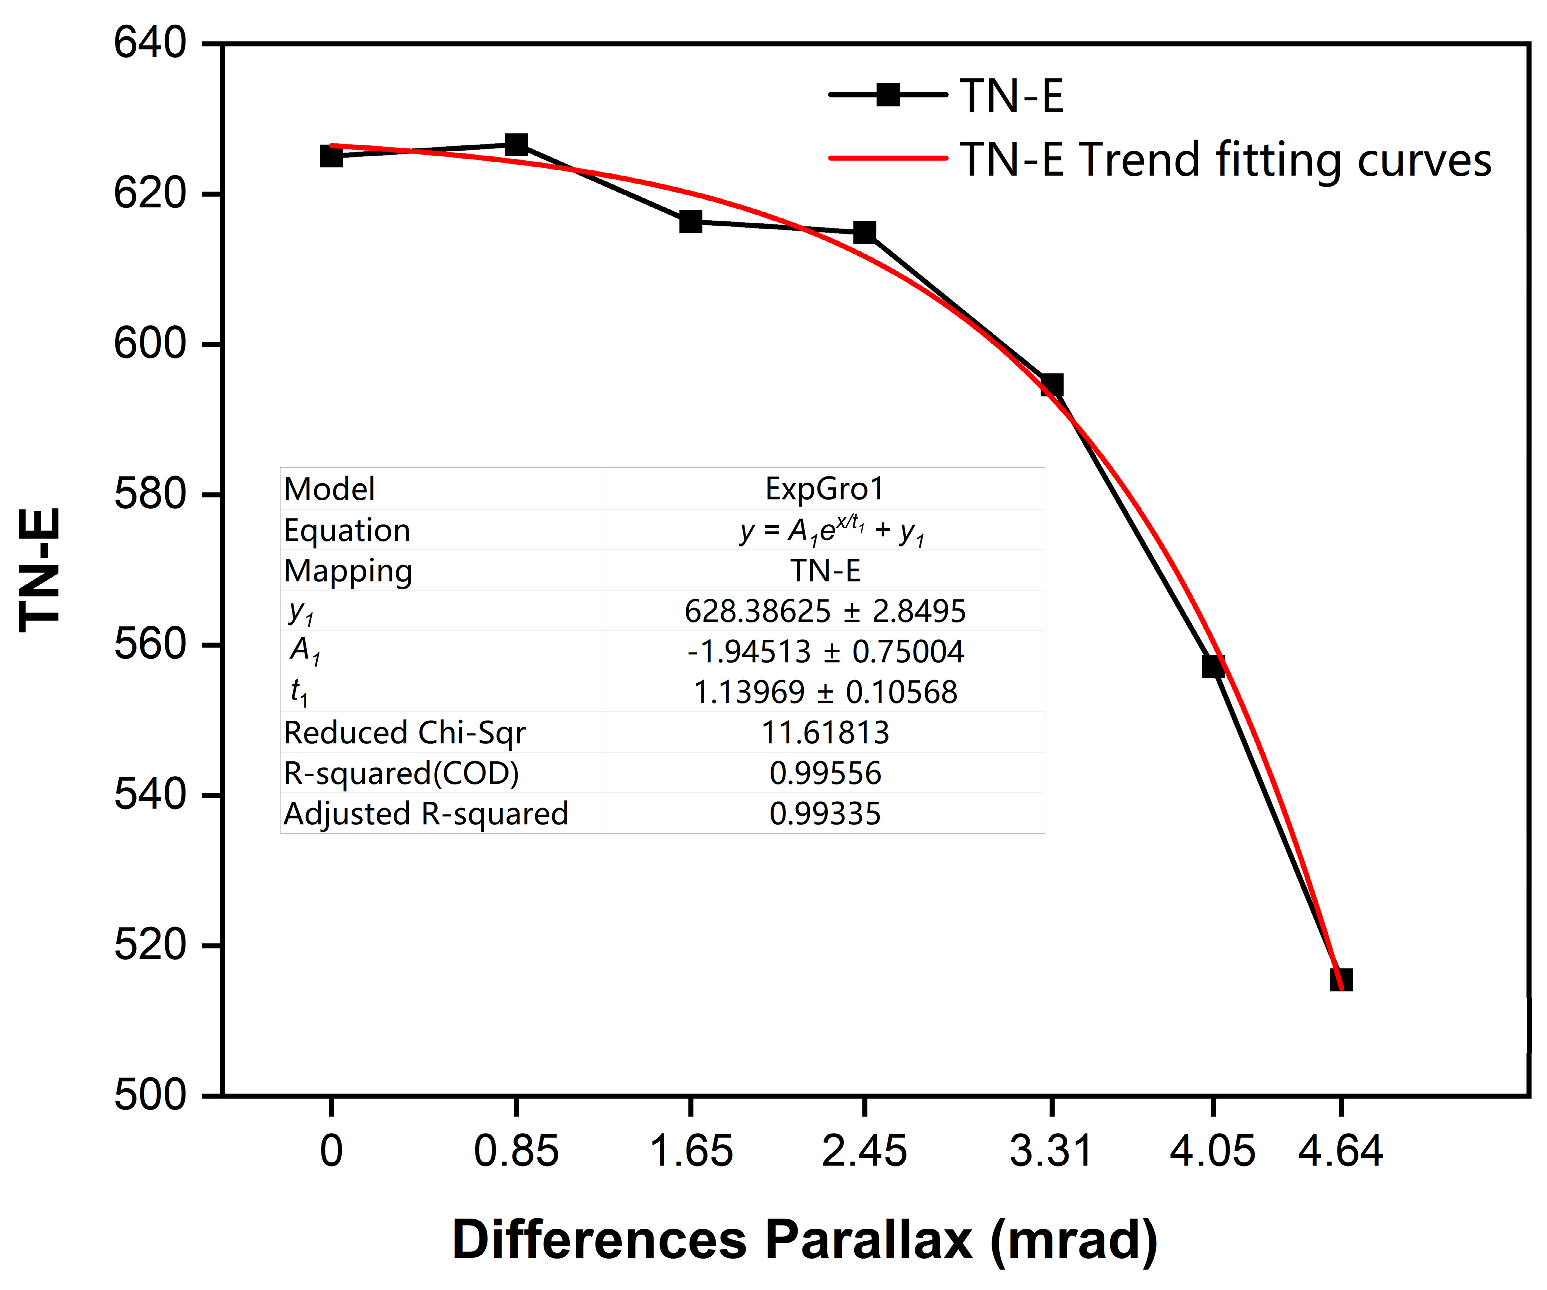
- The correlation between parallax and visual performance and the model of this correlation.
2. Materials and Methods
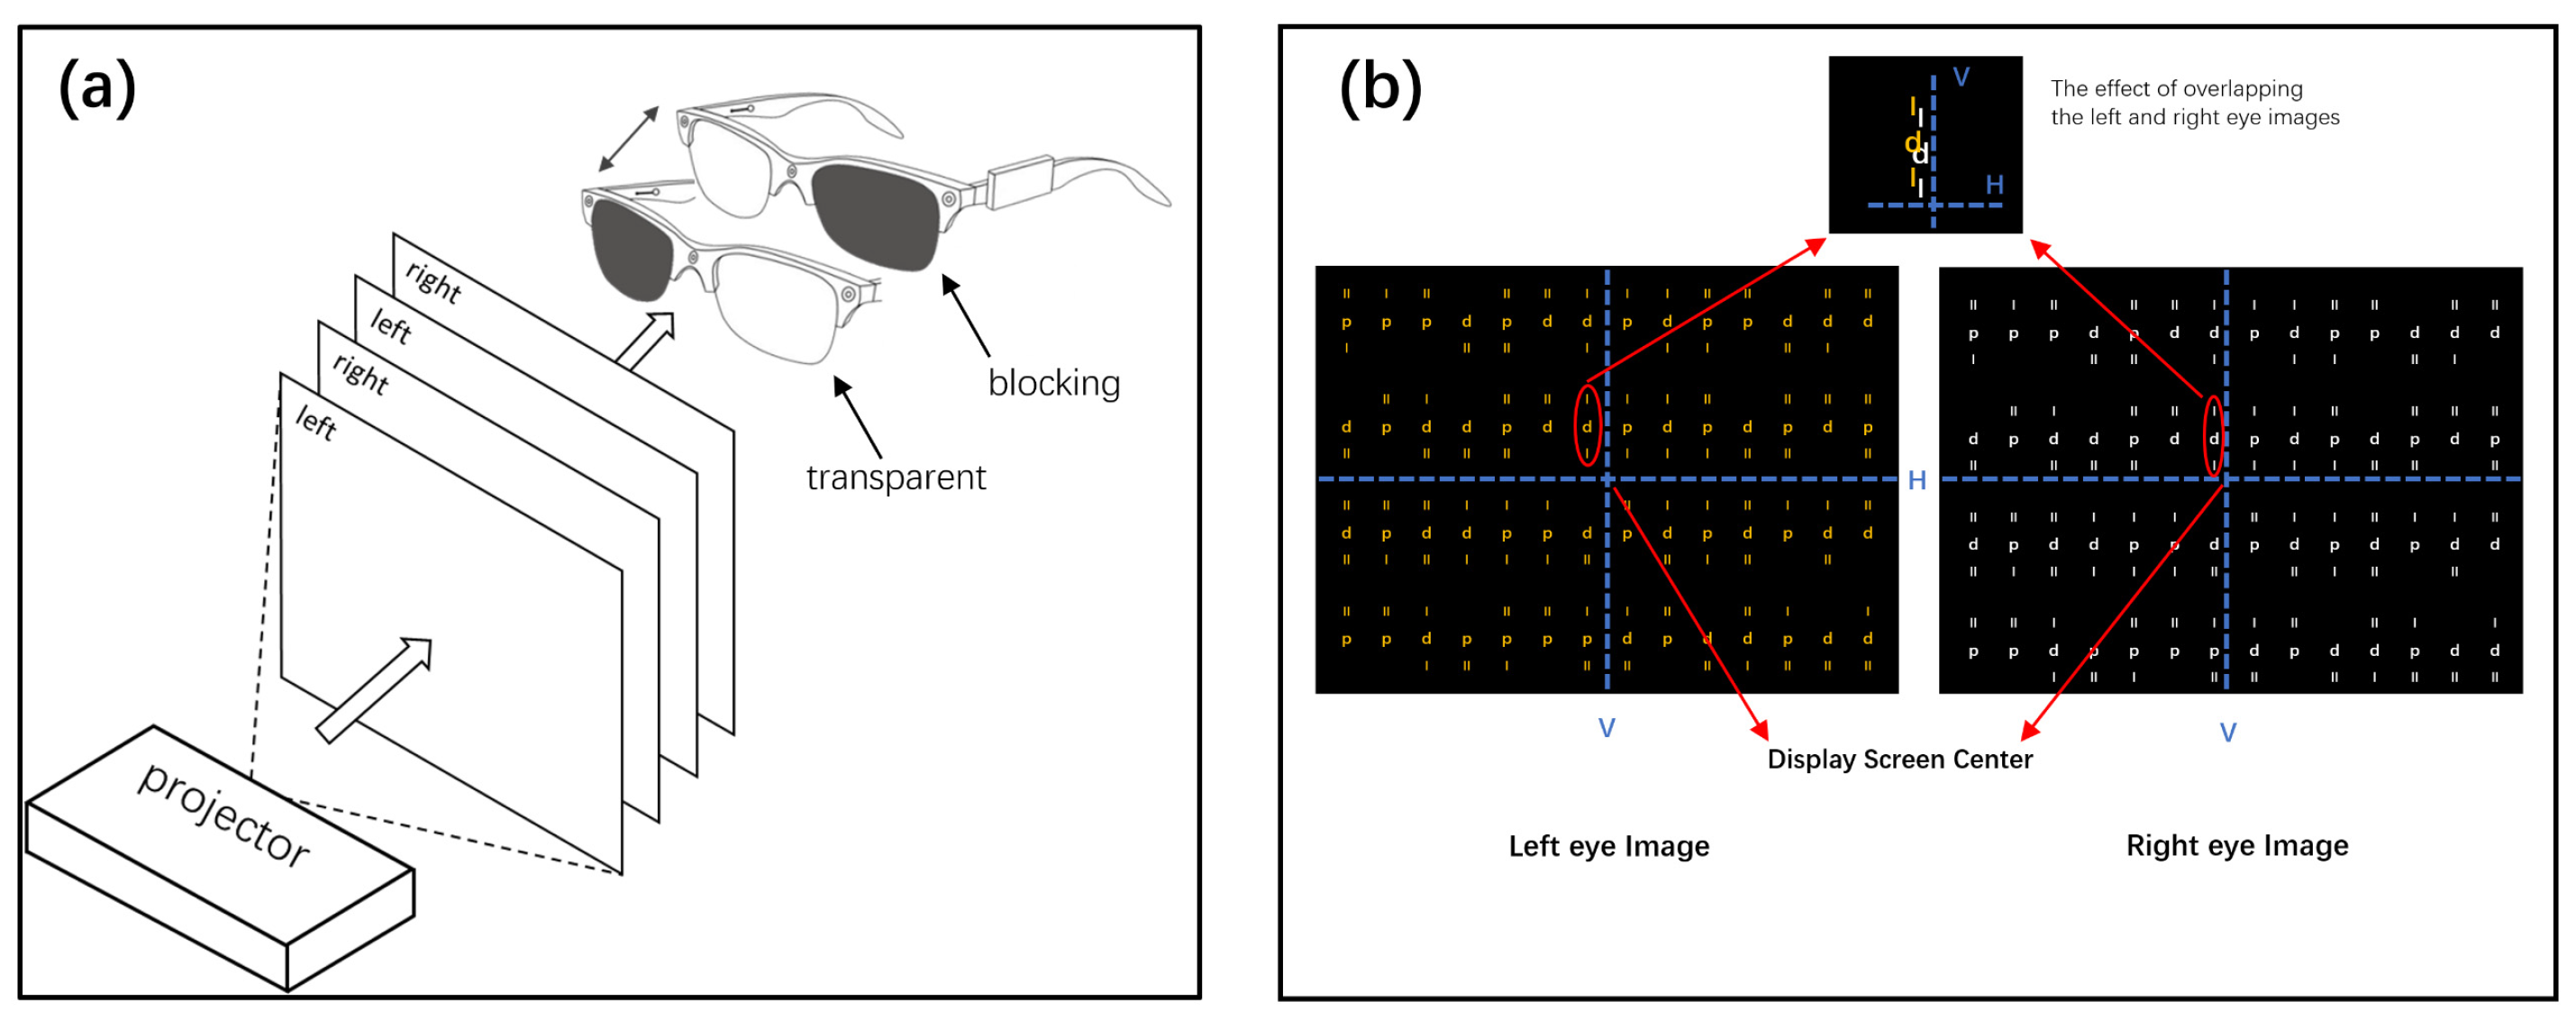
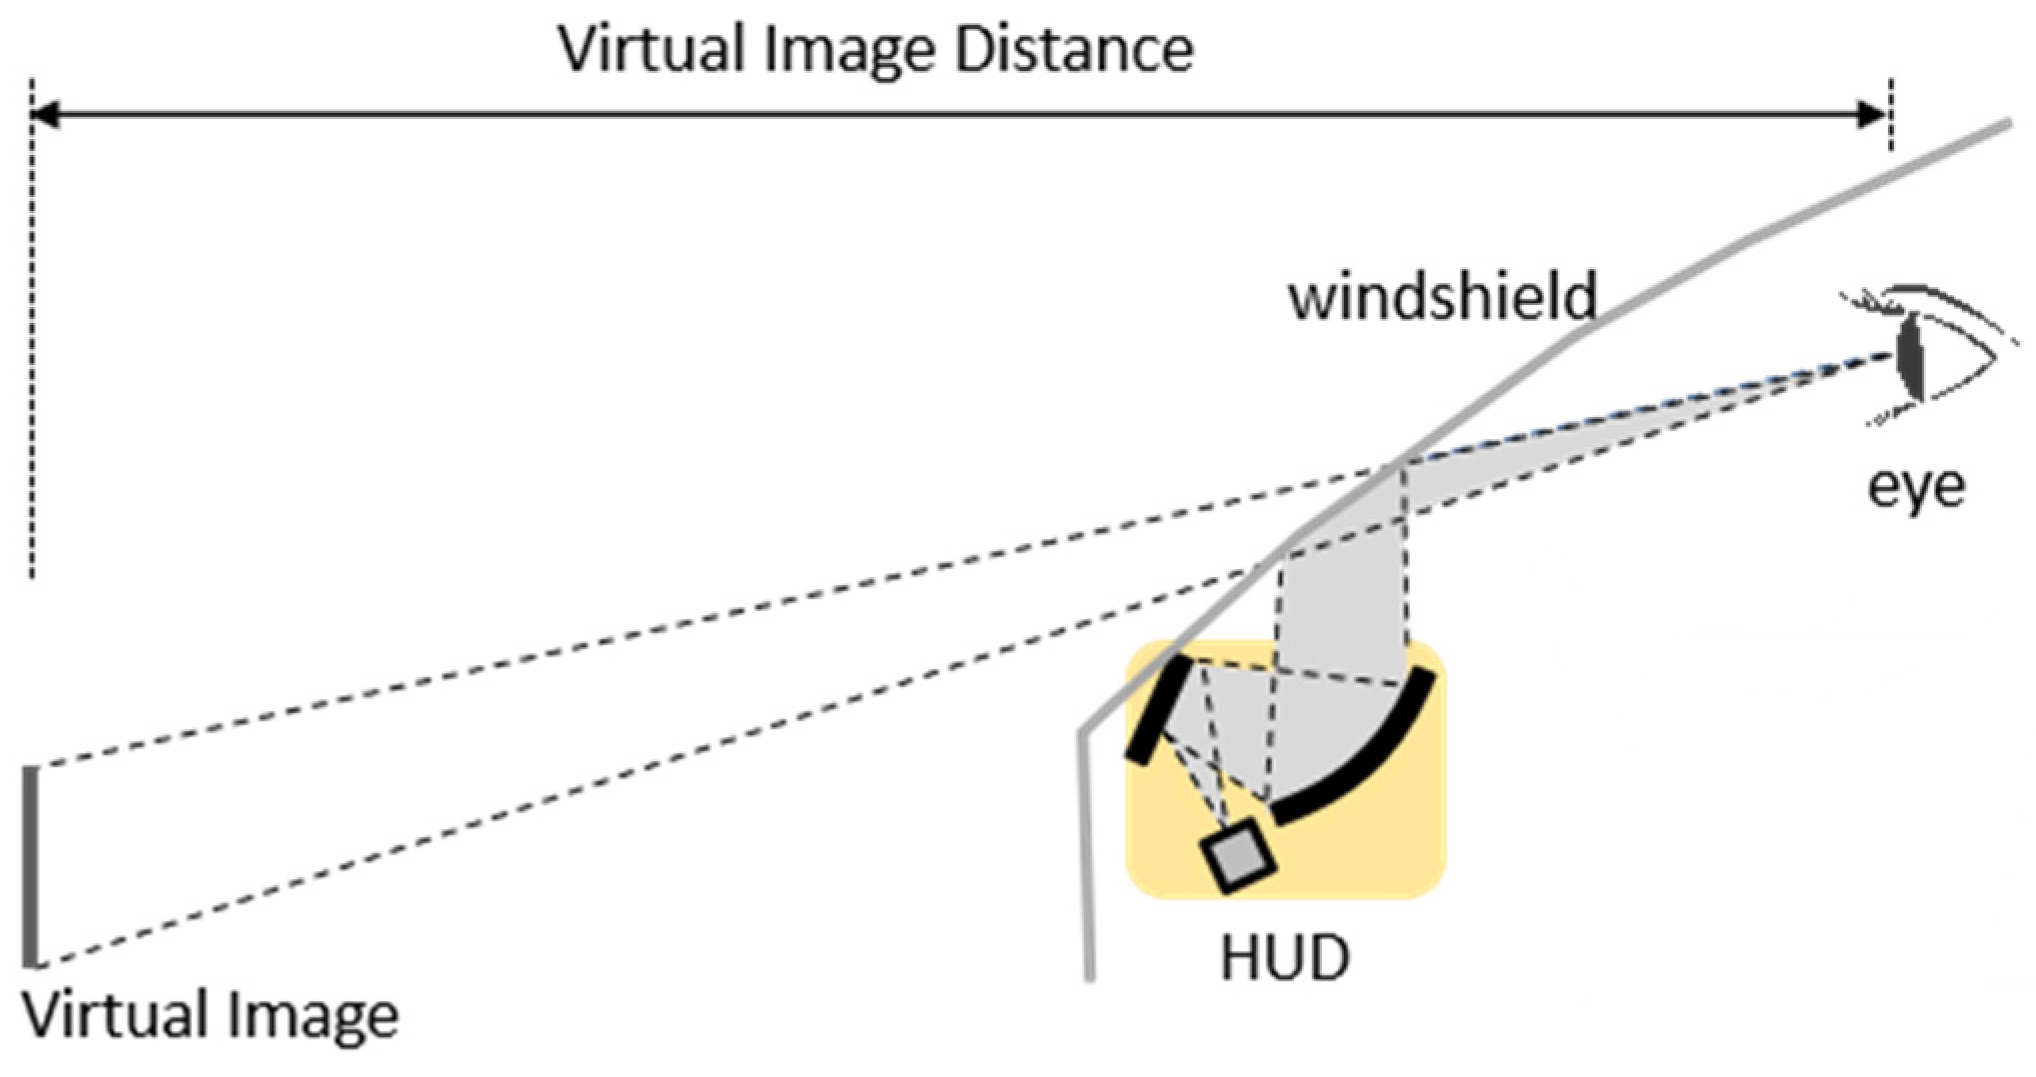
2.1. Experimental Setup
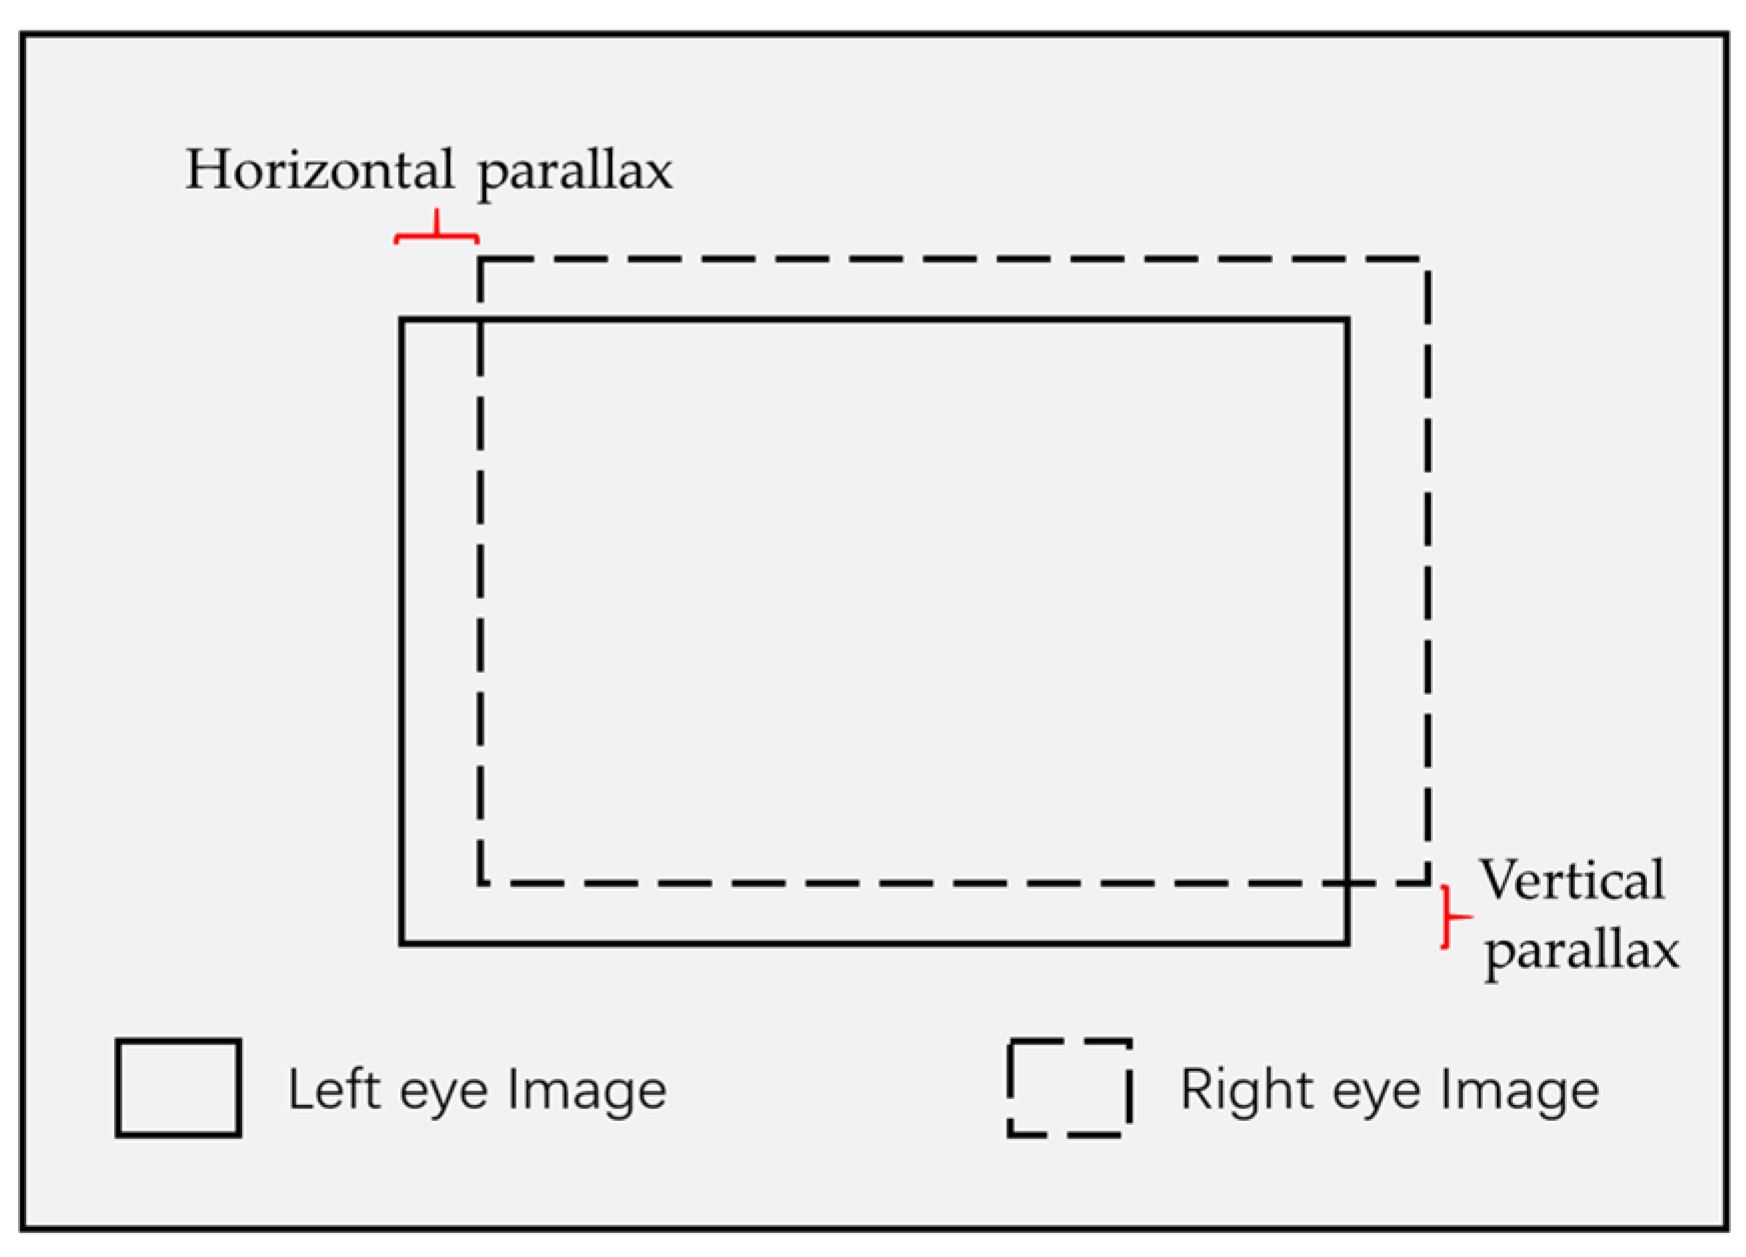
2.2. Evaluation Method
- (1)
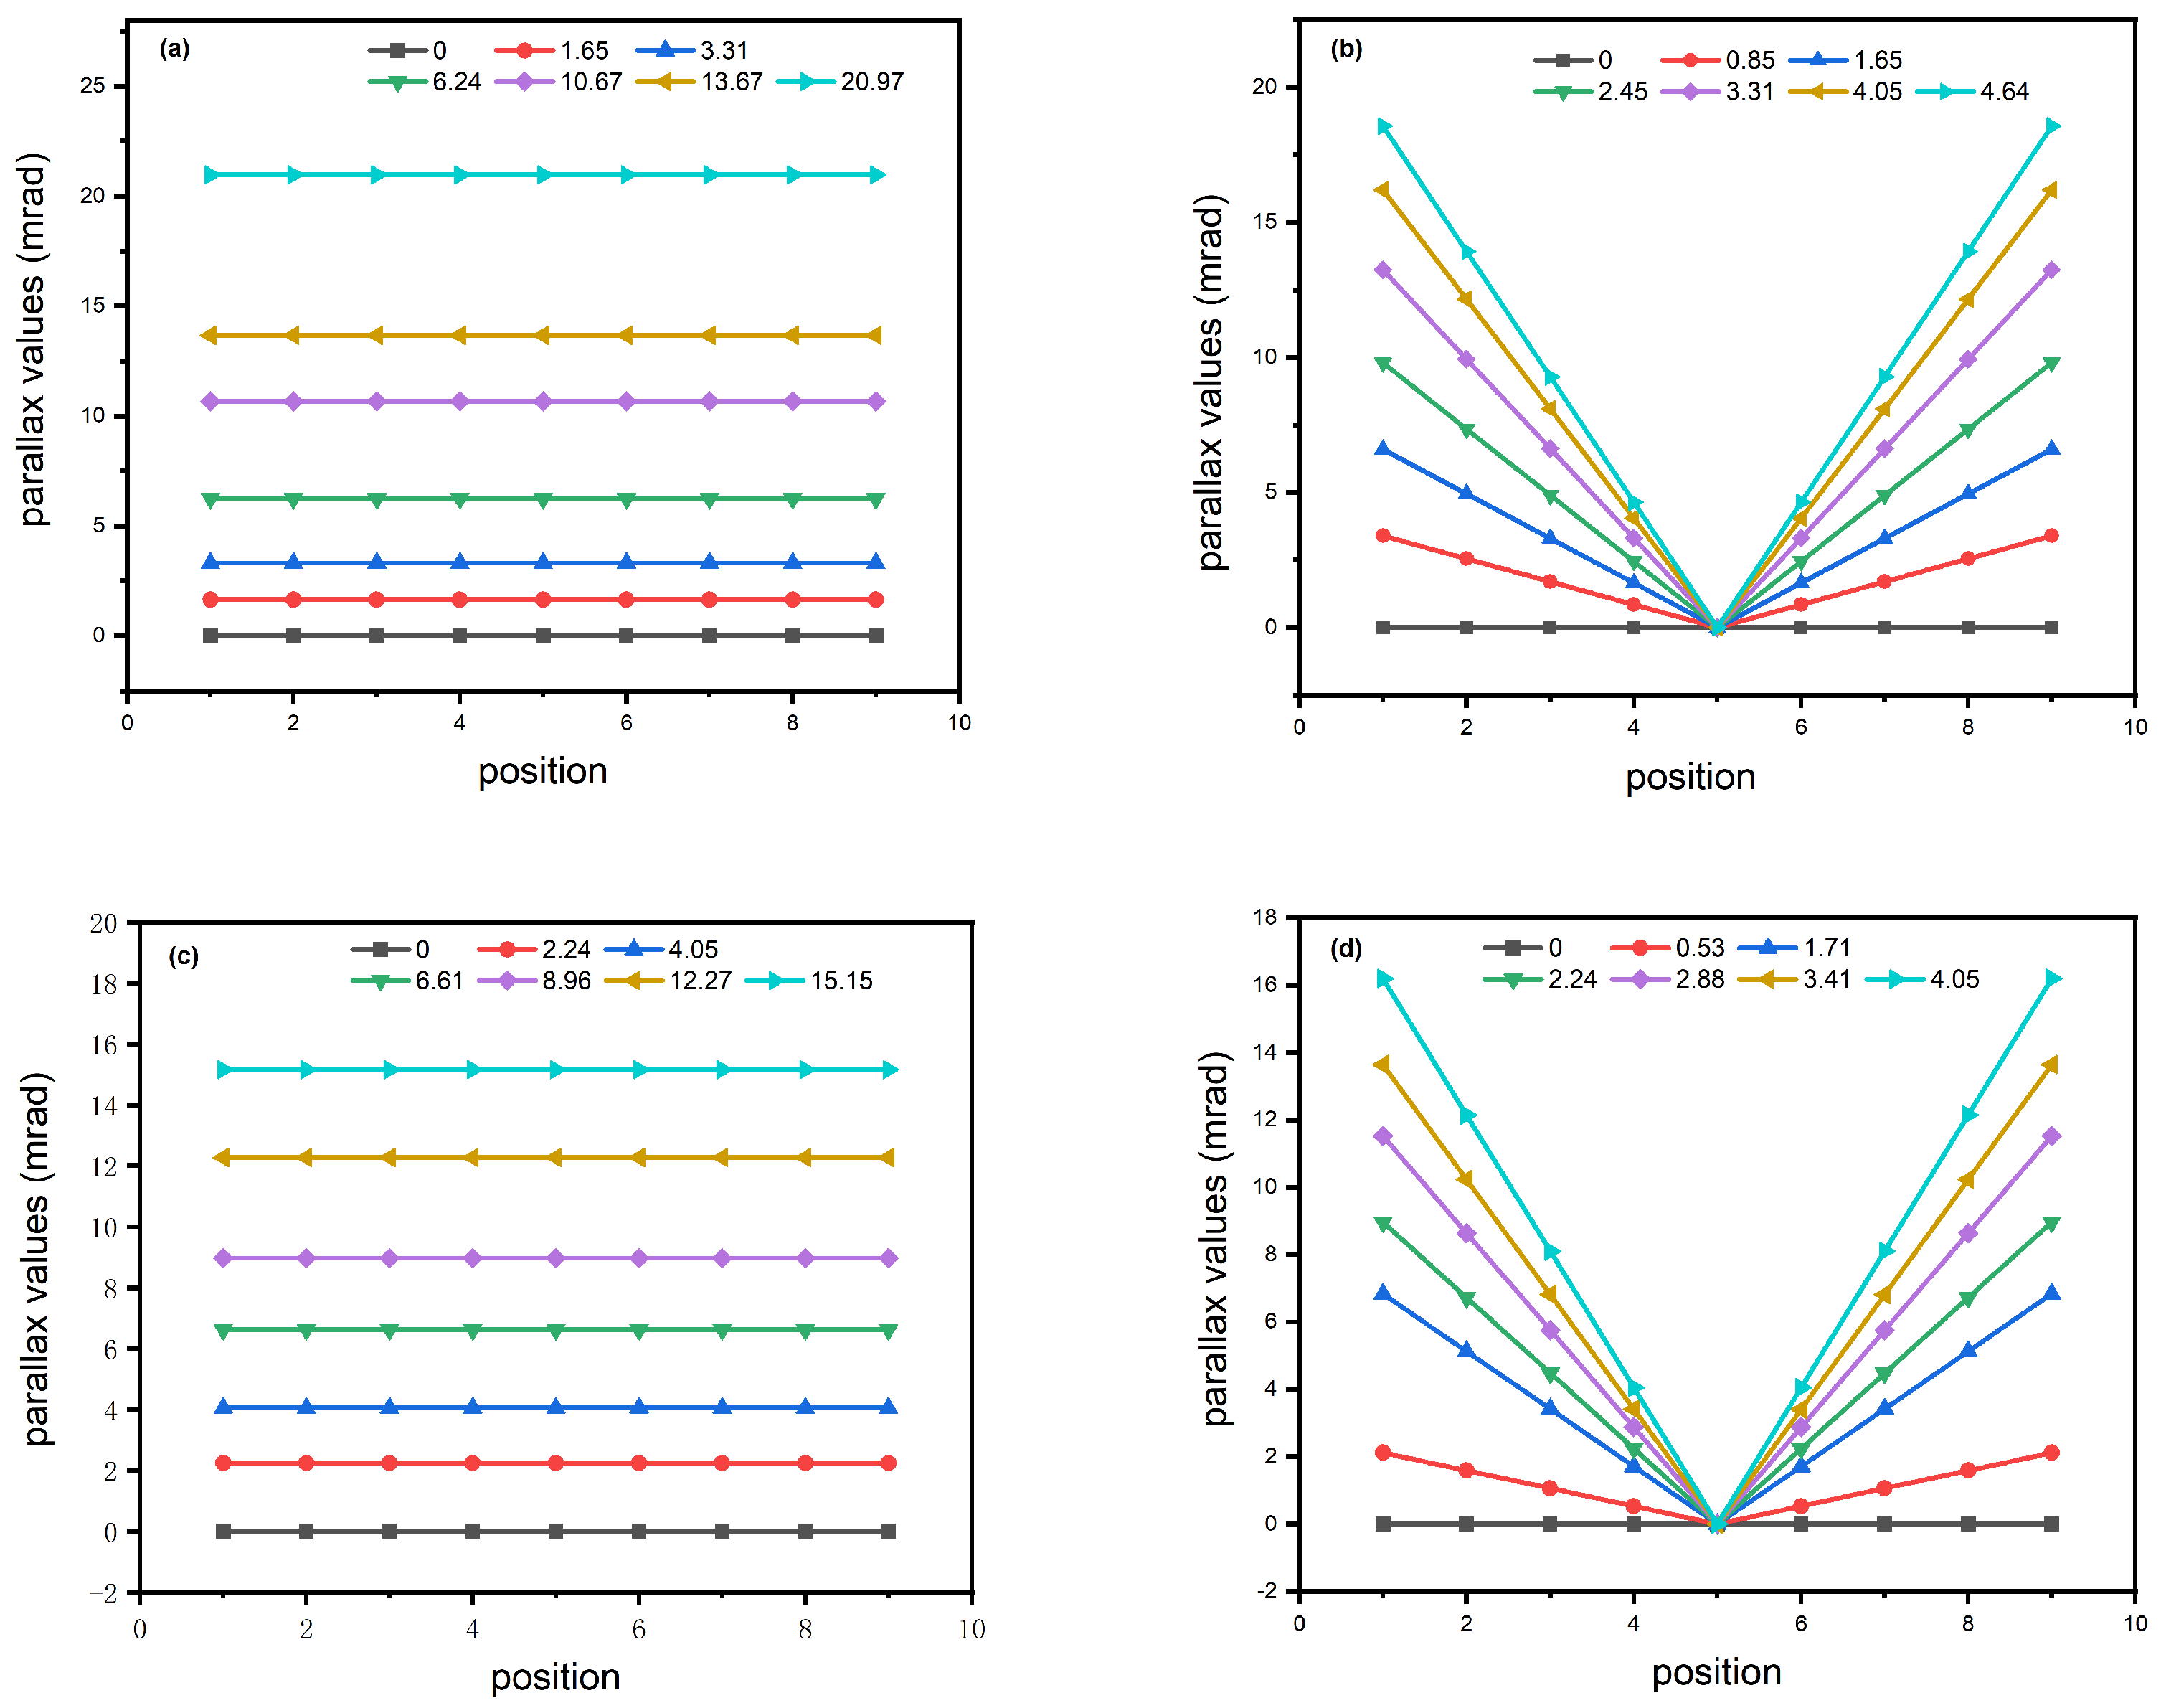
- Overall horizontal parallax change: the overall parallax of the image remained the same, and seven different parallax conditions were set.
- (2)
- Stepped horizontal parallax variation: the central and edge parallaxes of the image showed a trend of stepped variation, with the central parallax being smaller than the edge parallax; there were different levels of variation, with a total of seven levels being set.
- (3)
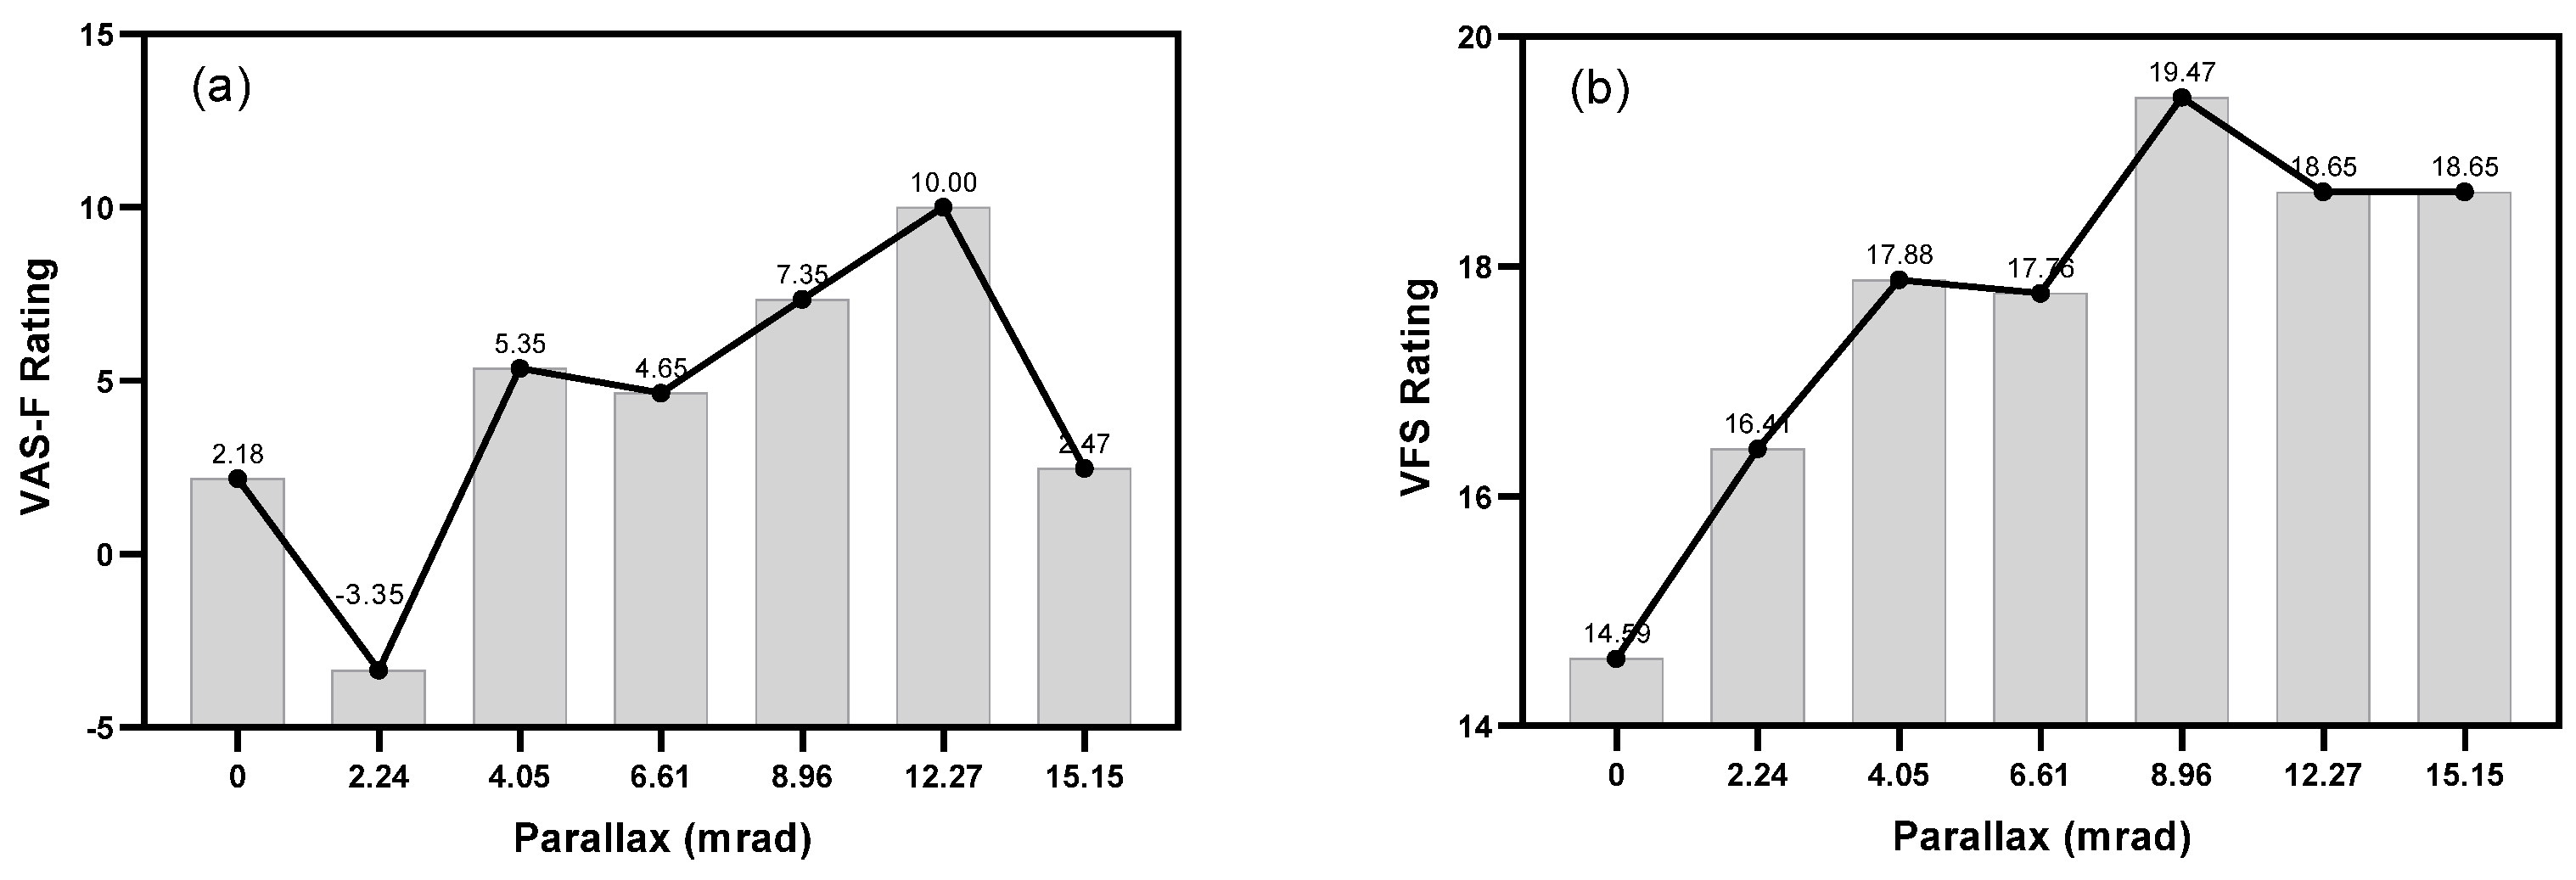
- Overall vertical parallax variation: the overall parallax of the image remained the same, and seven different parallax conditions were set.
- (4)
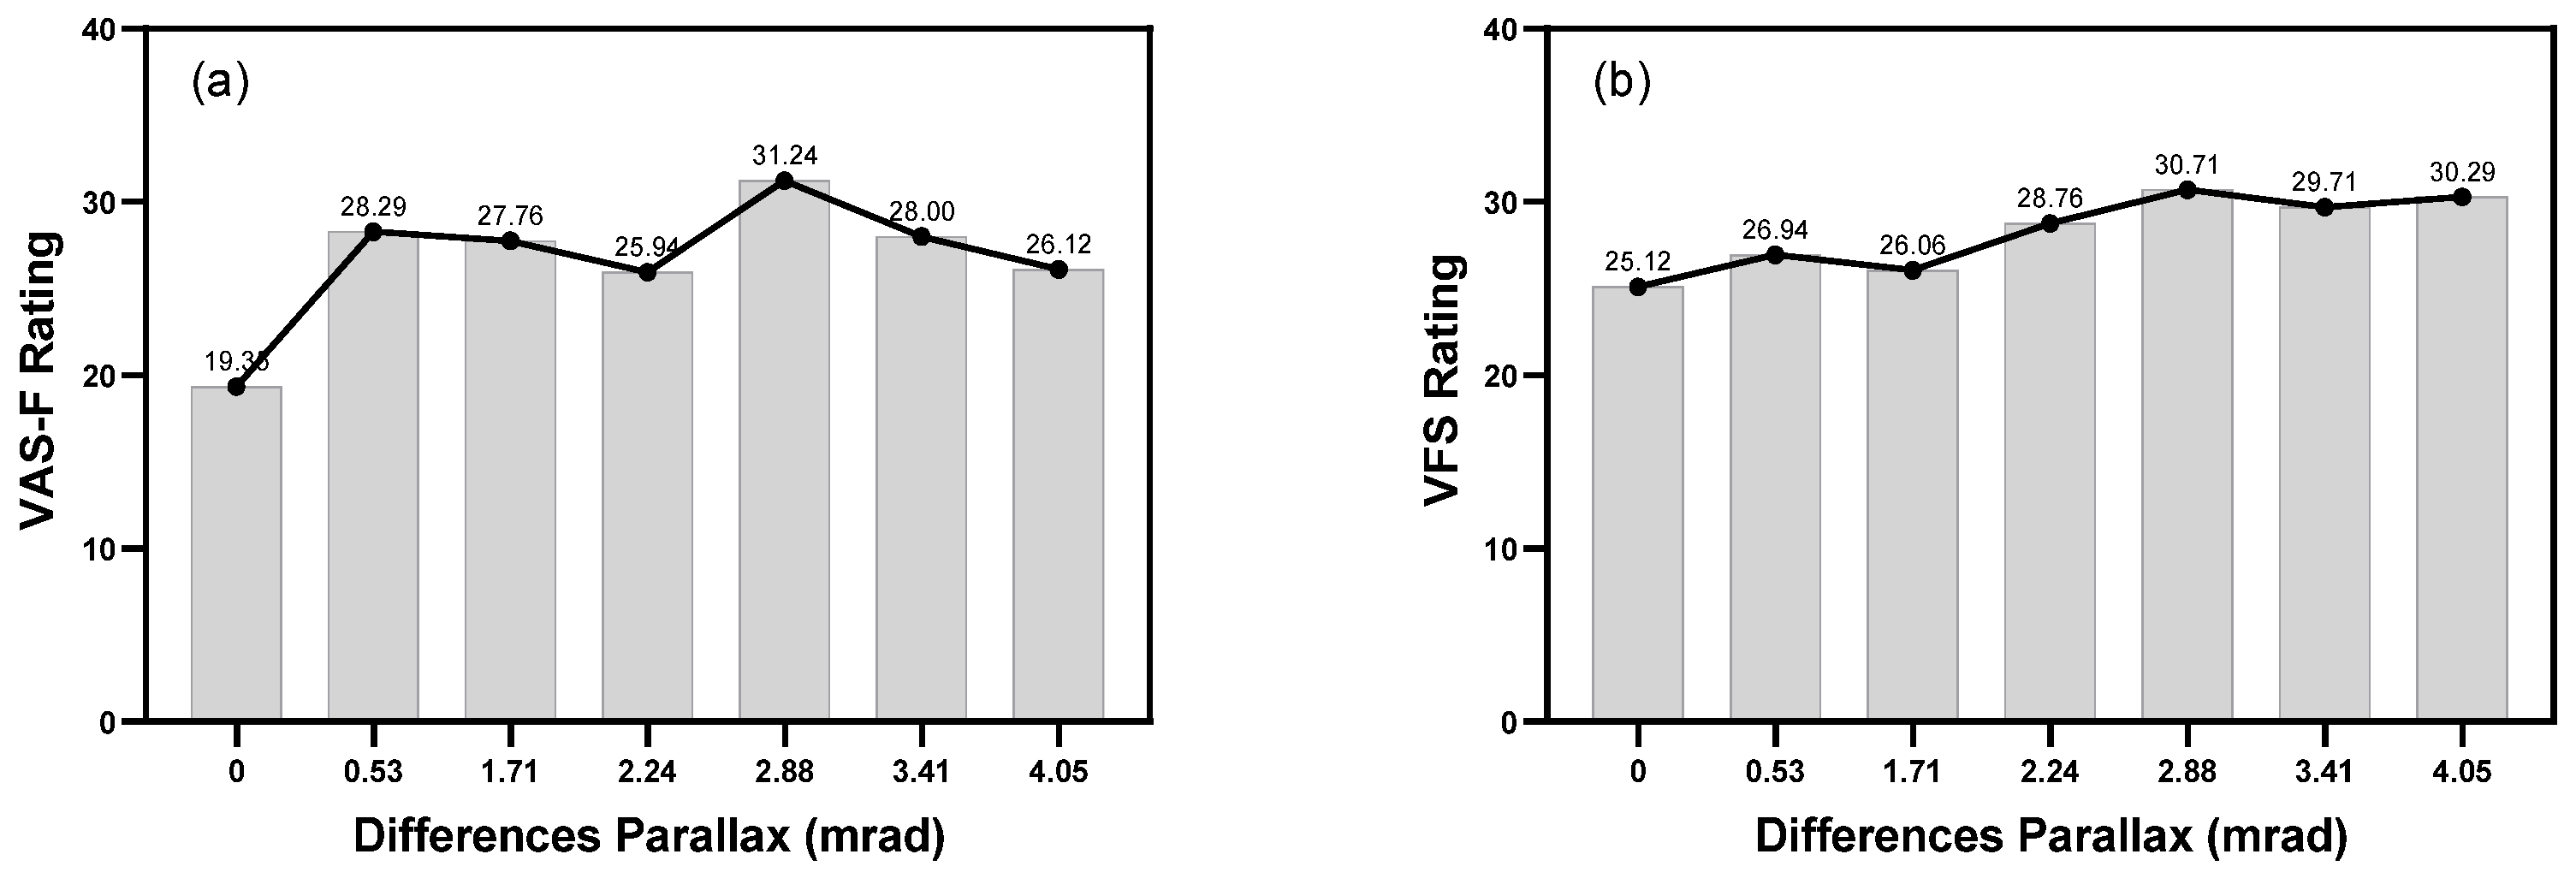
- Stepped vertical parallax variation: the central and edge parallaxes of the image showed a trend of step variation, with the central parallax being smaller than the edge parallax; the variation step level was different, with a total of seven levels being set.
2.3. Participants
2.4. Experiment Procedure
2.5. Data Analysis
3. Results
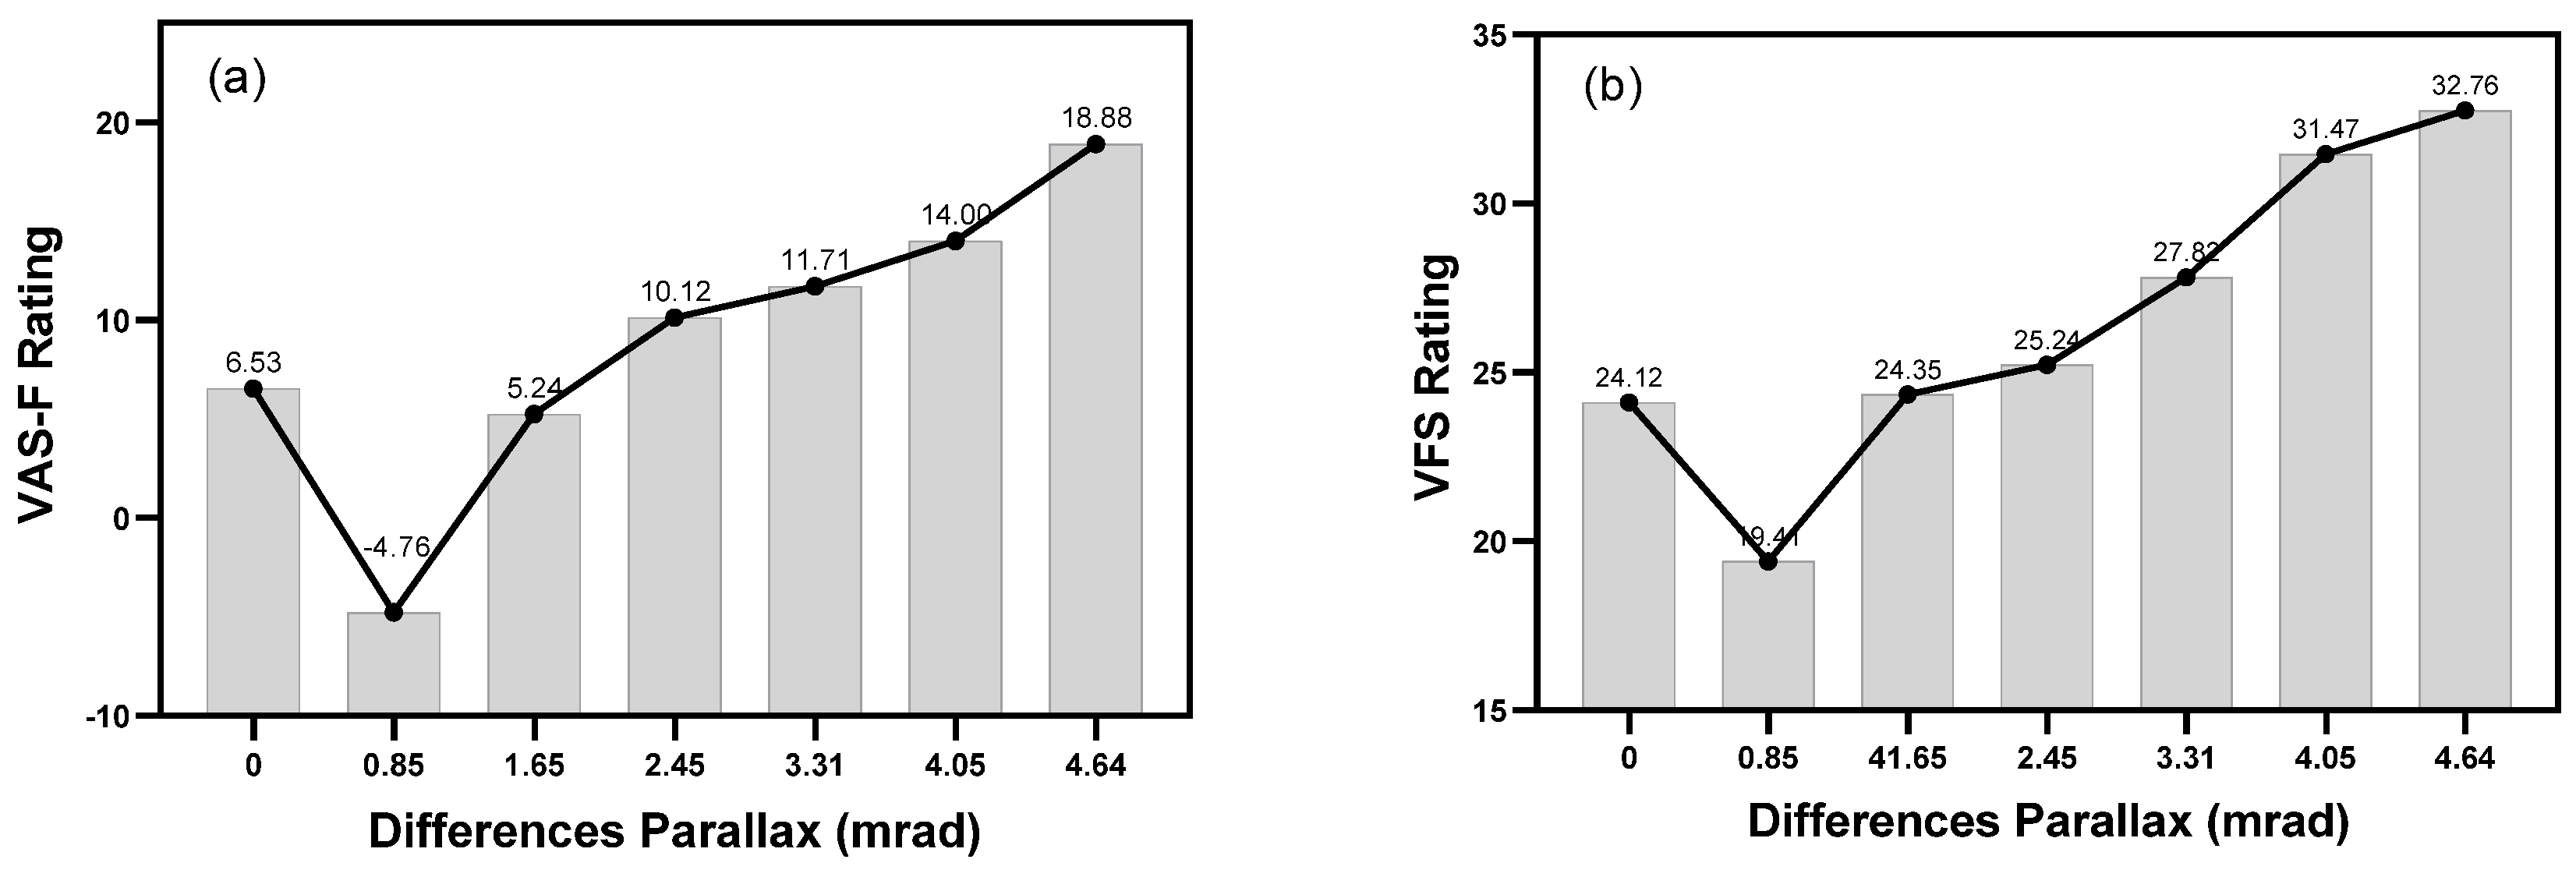
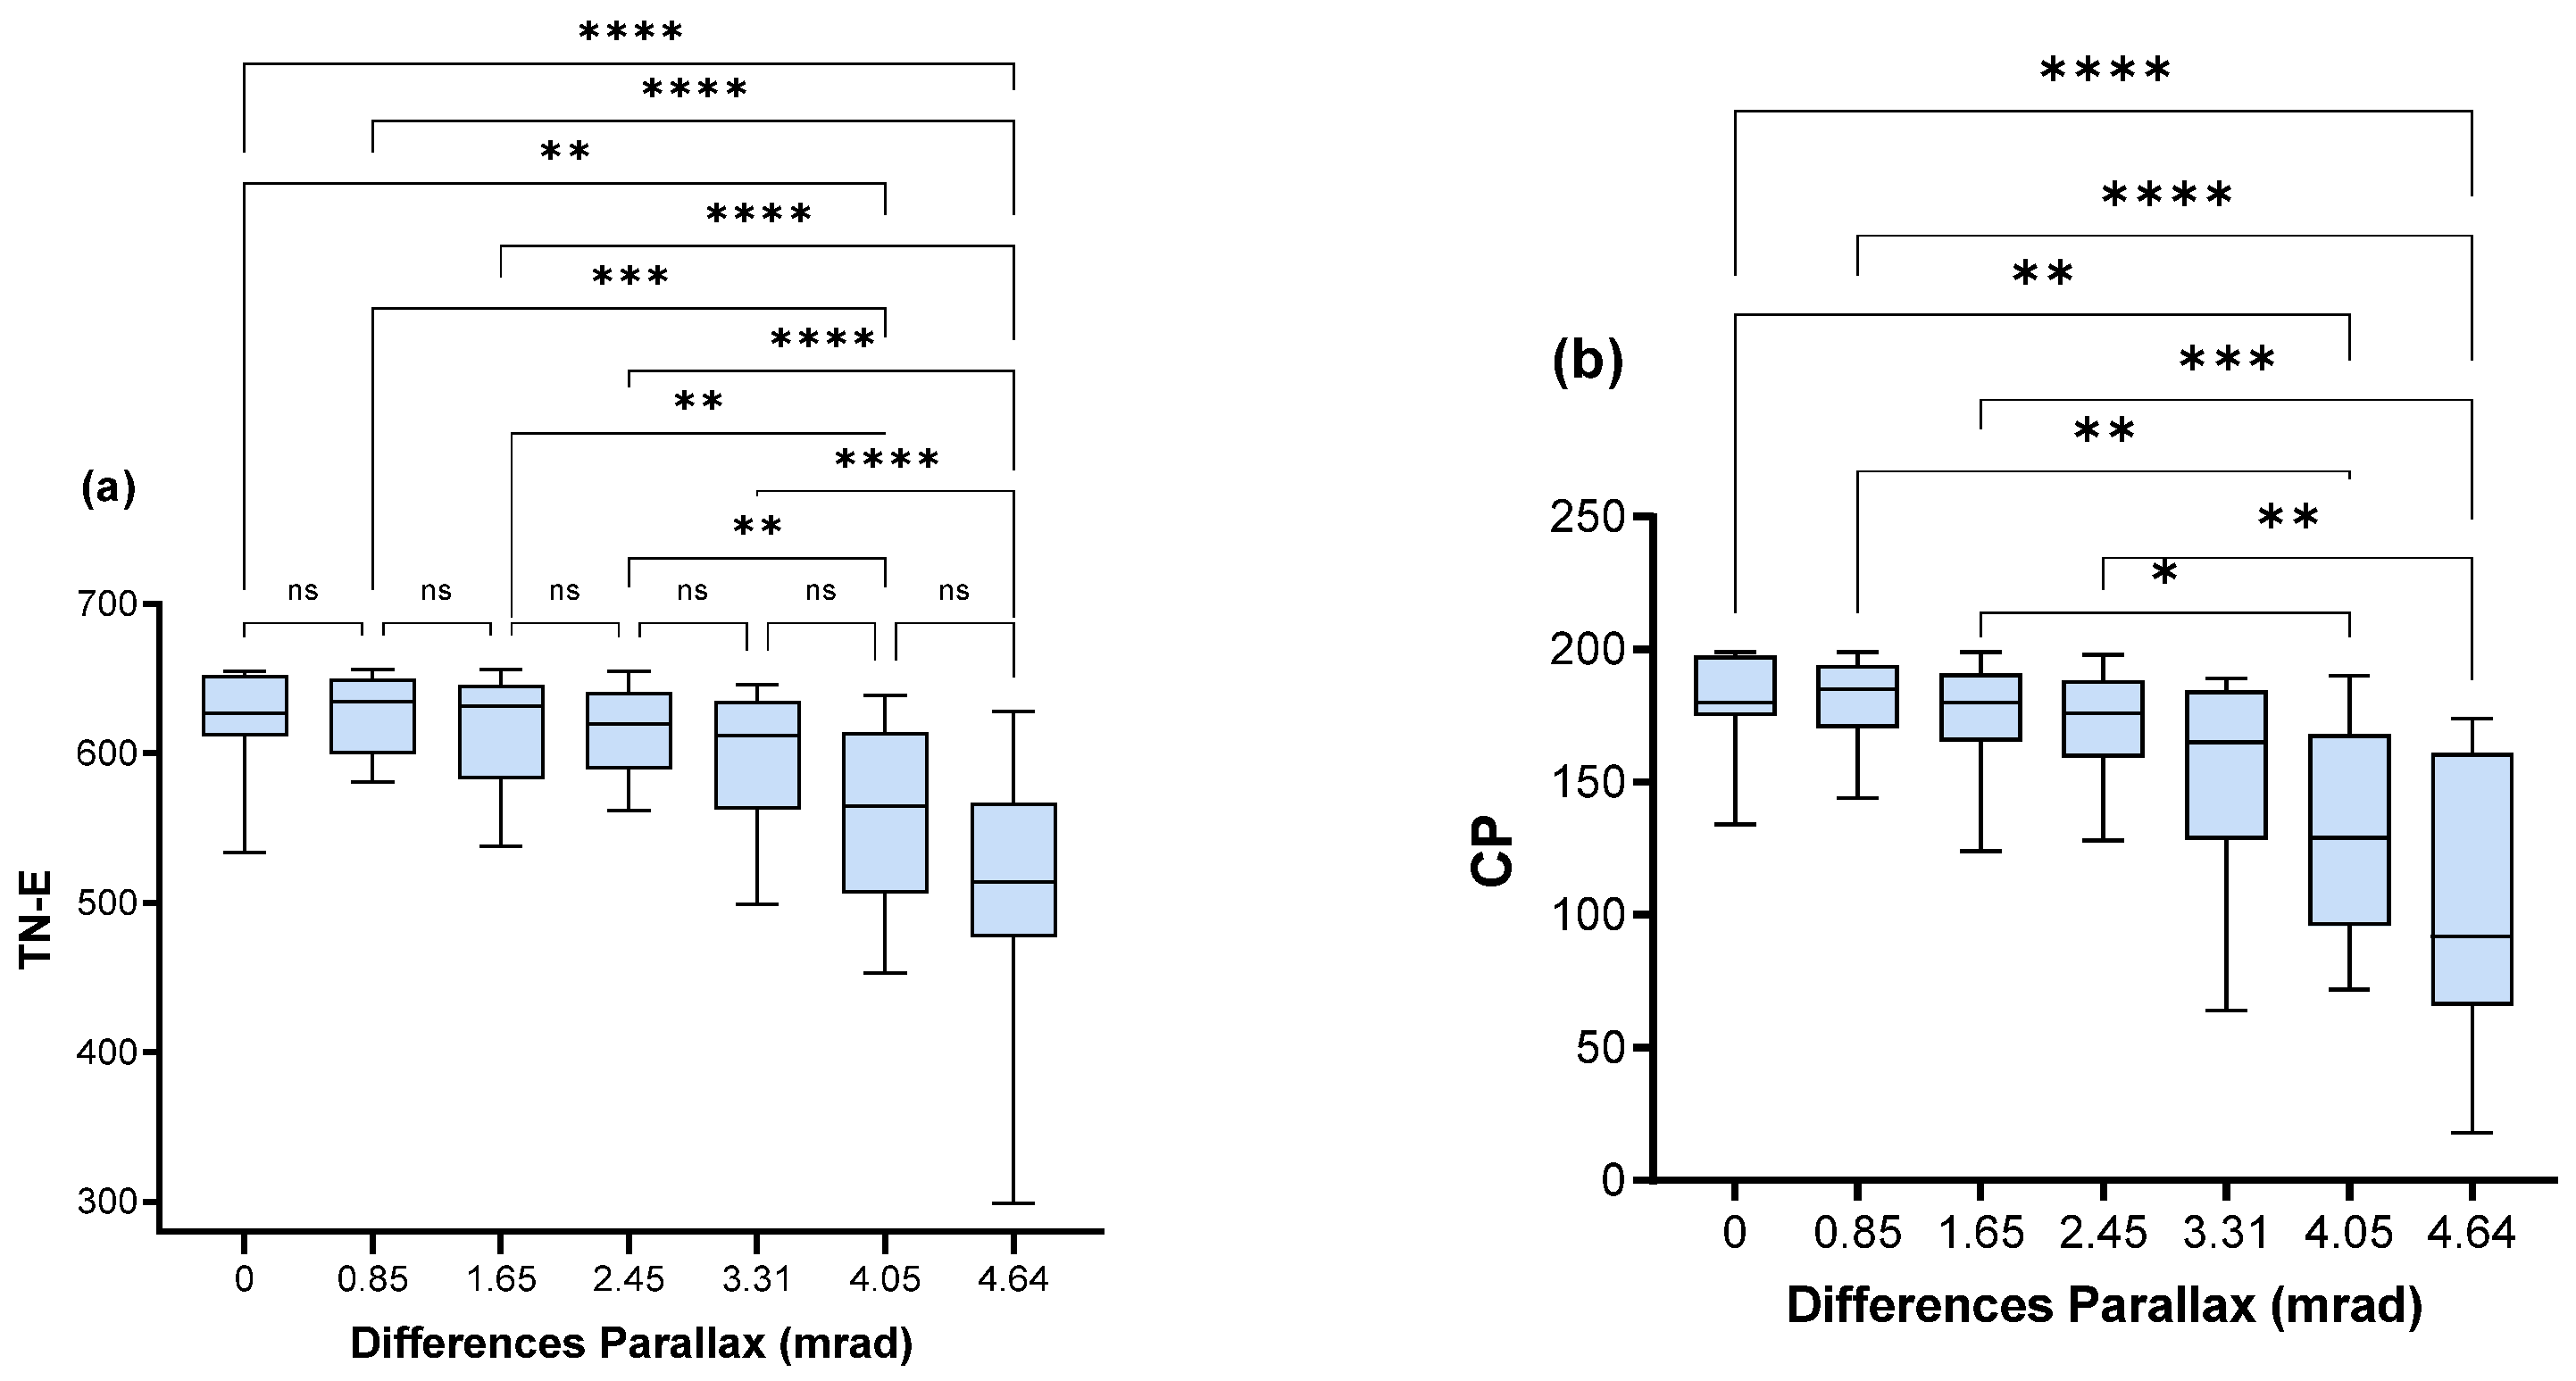
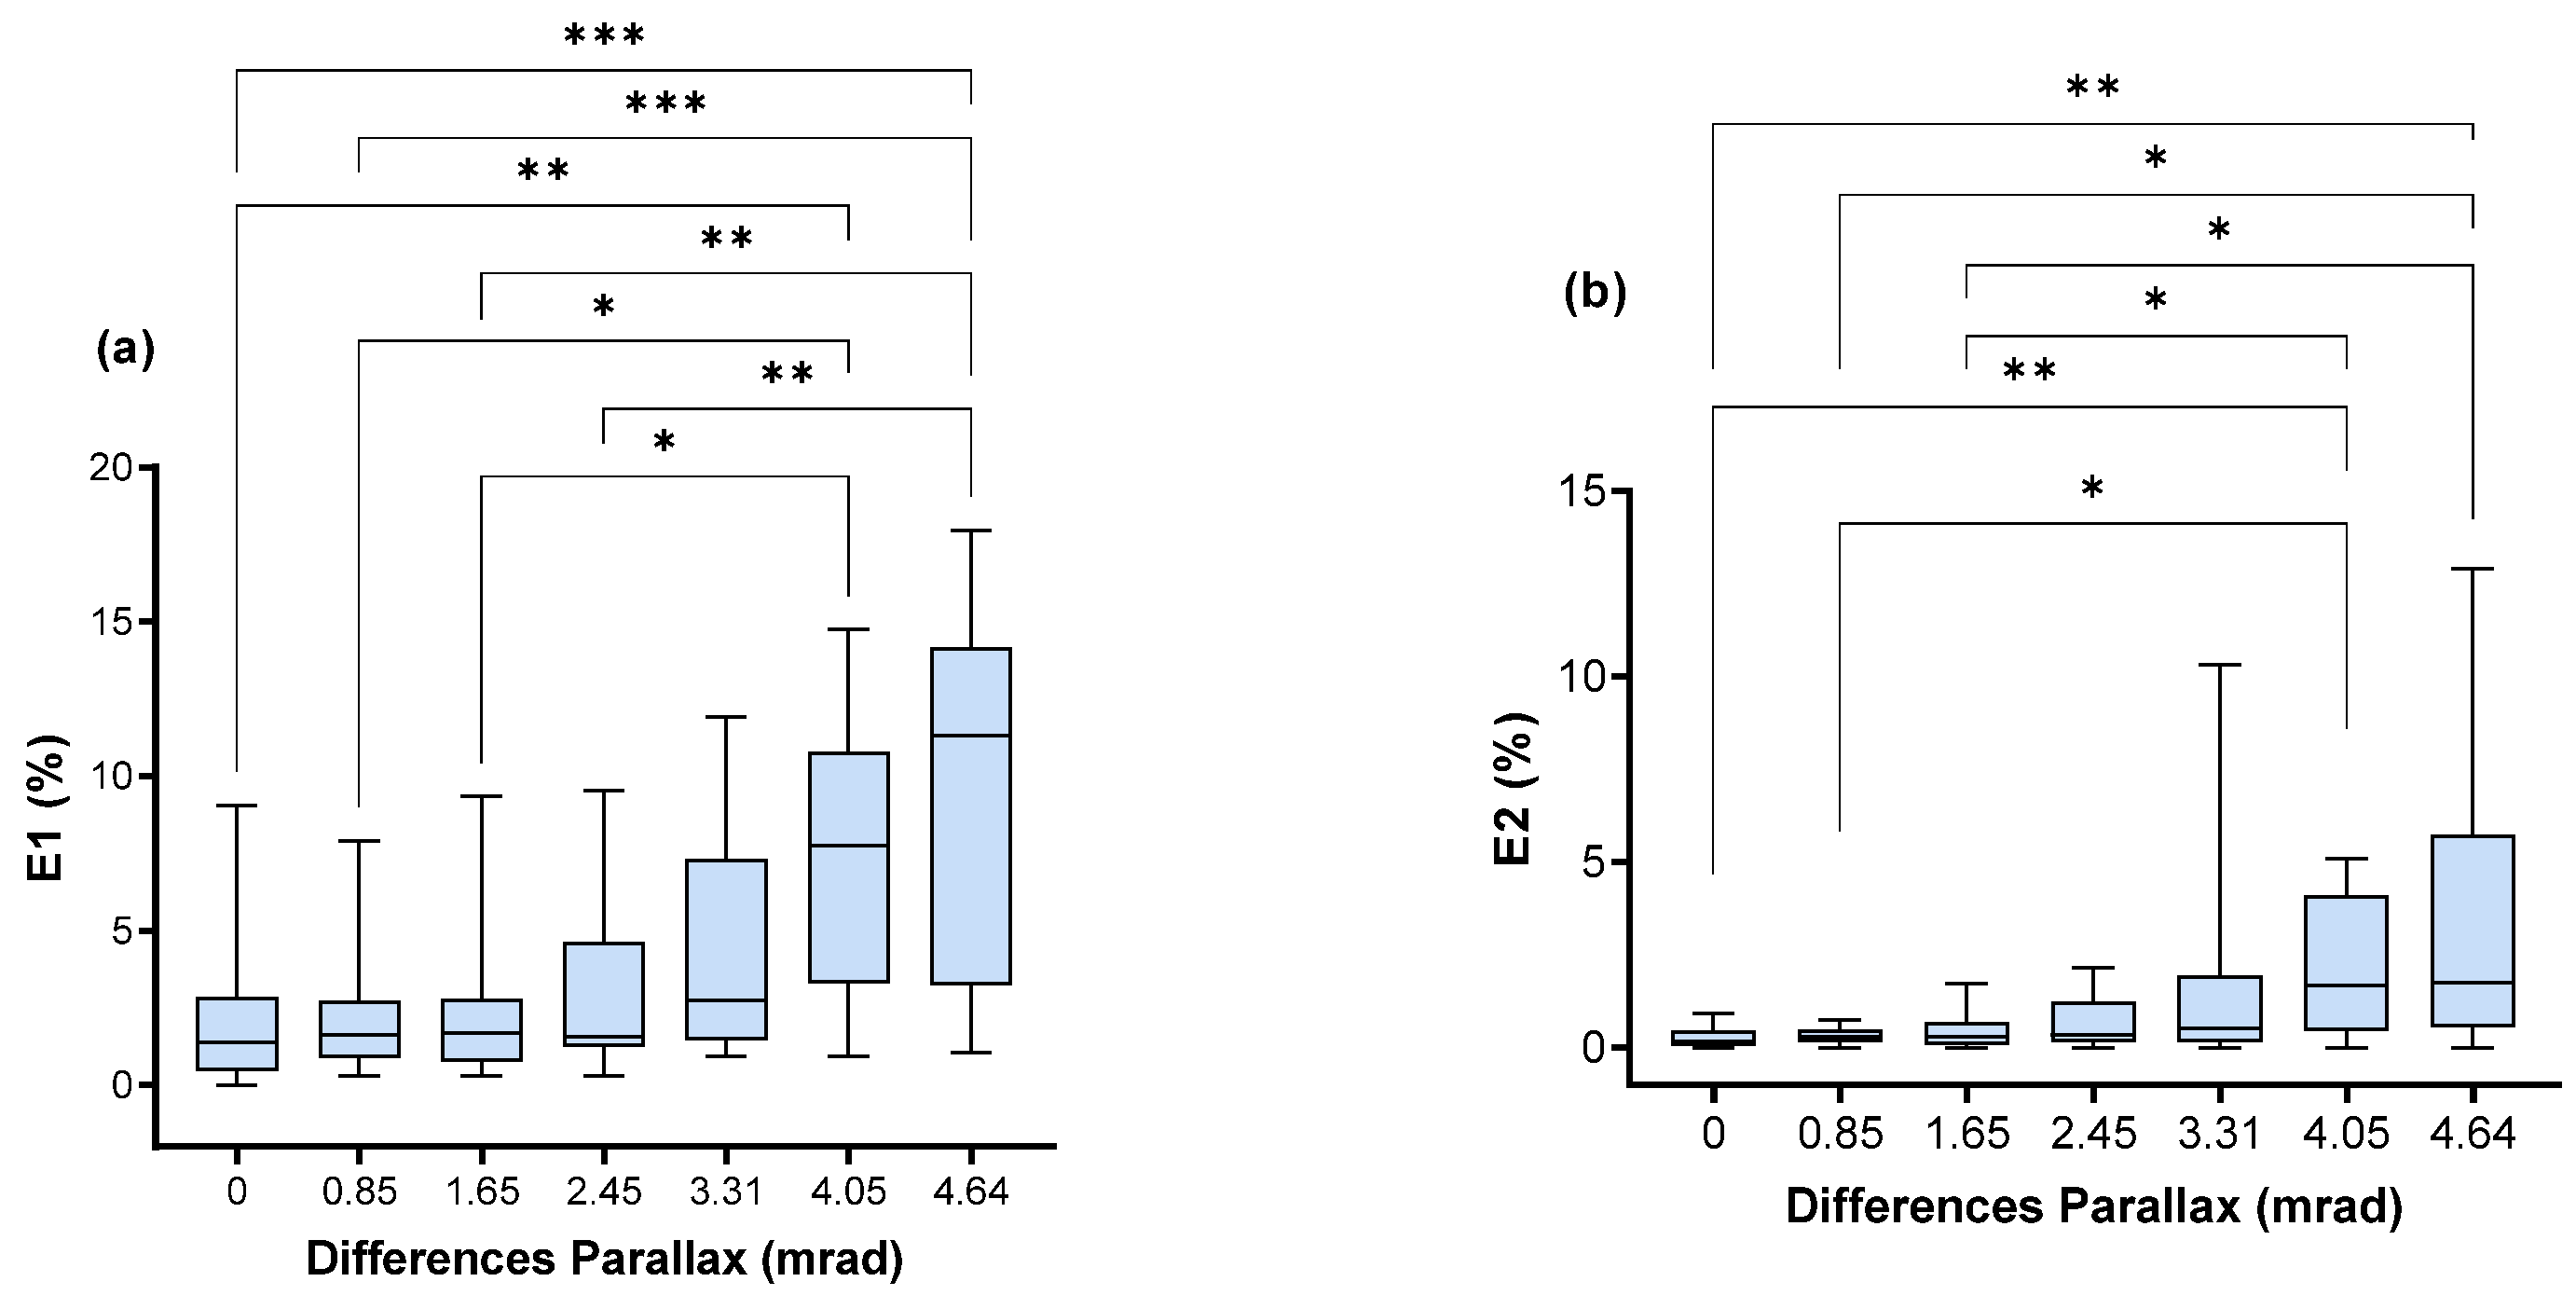
3.1. Horizontal Parallax
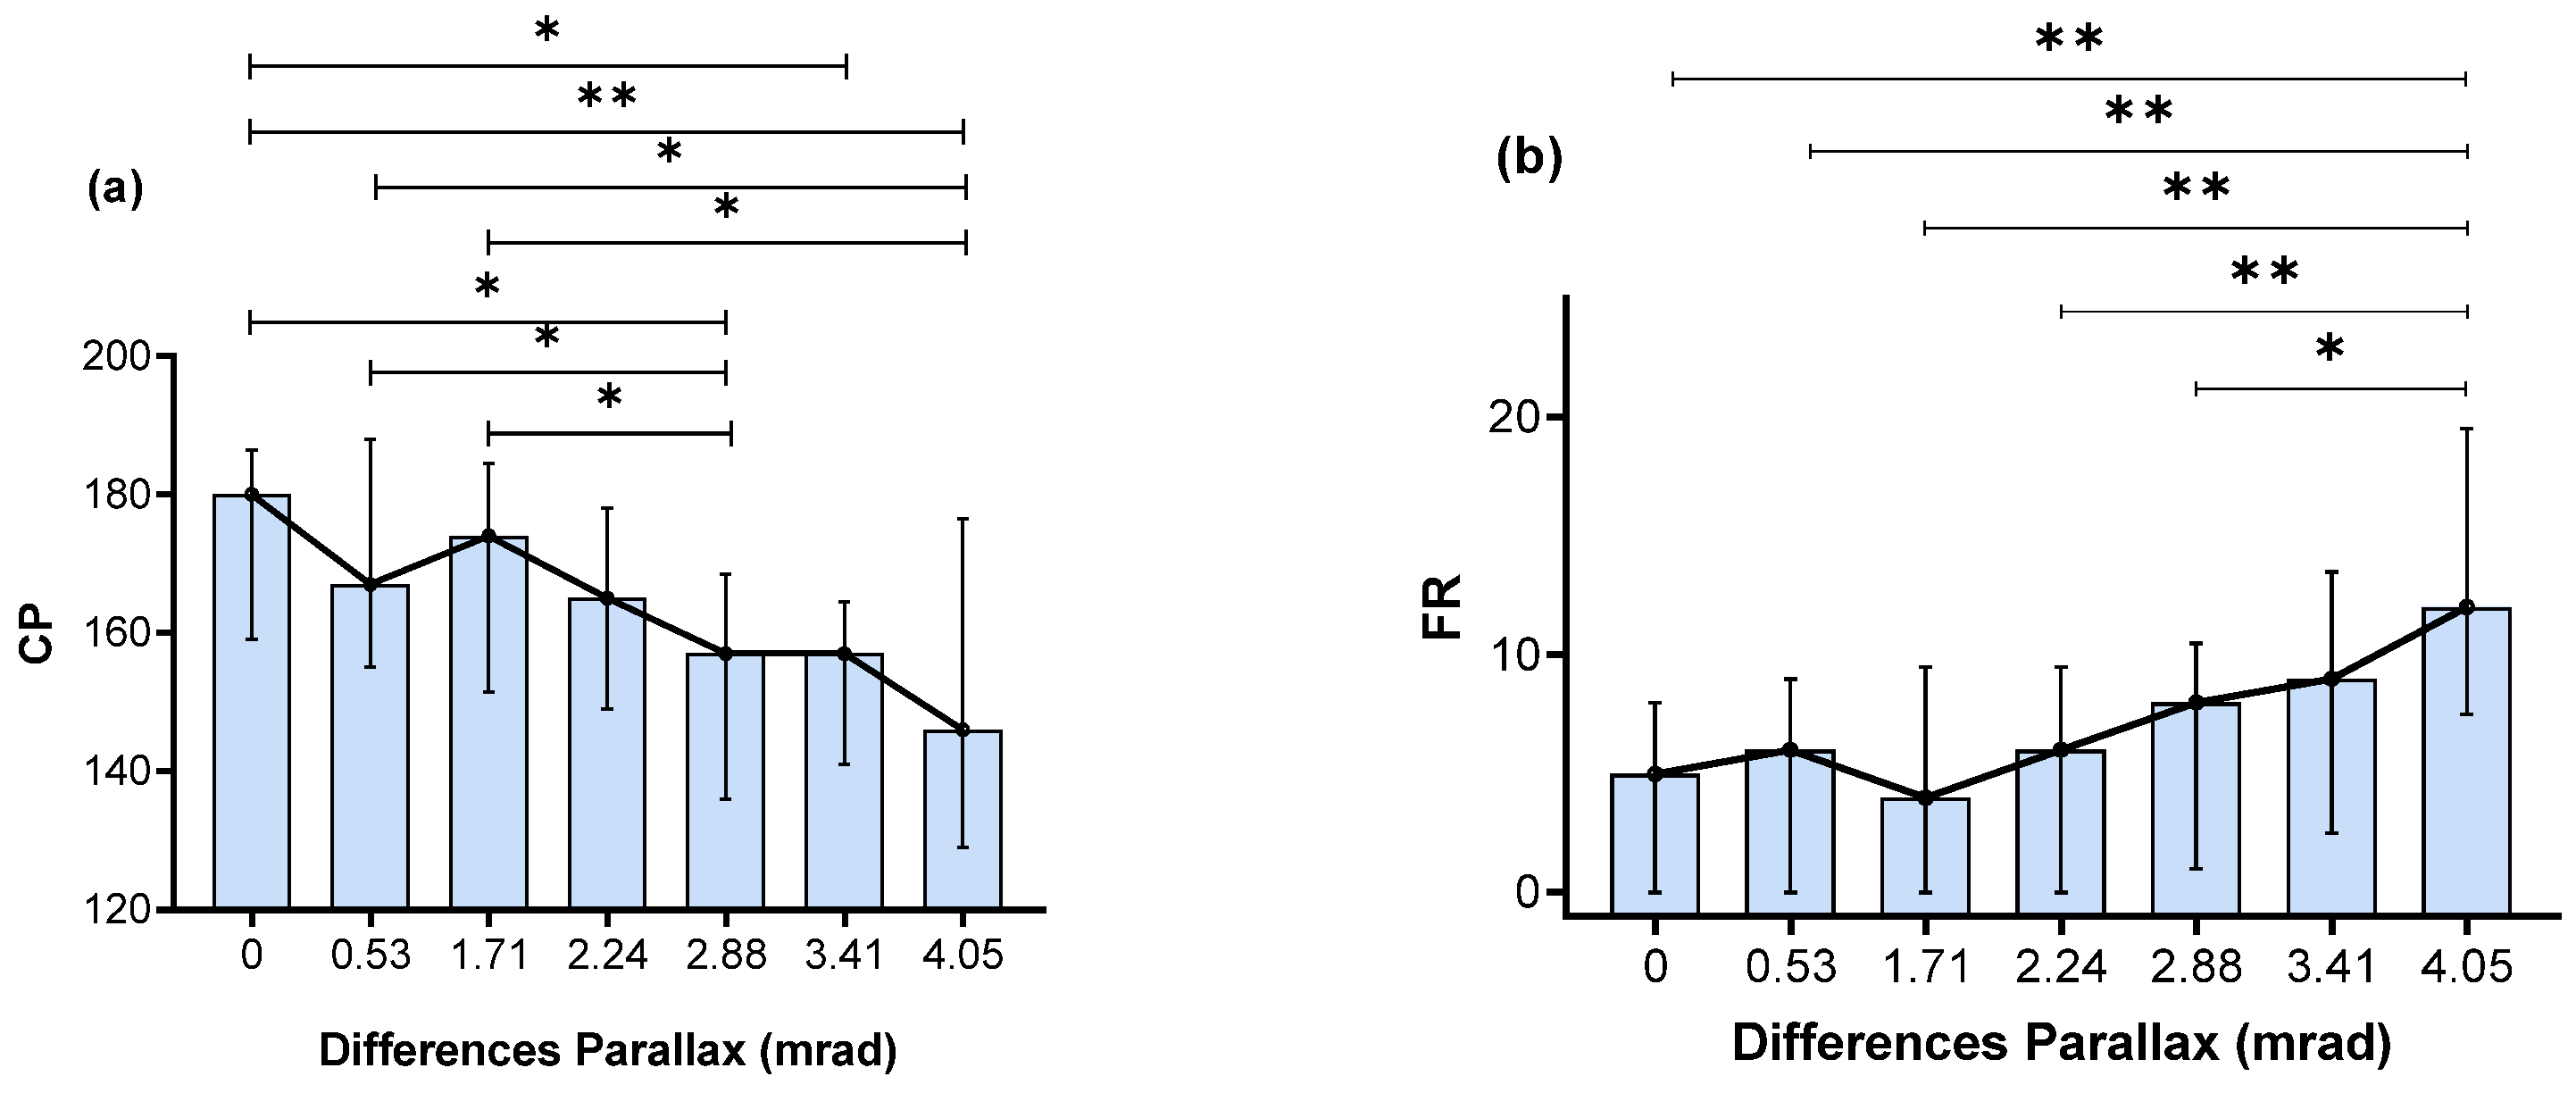
3.2. Vertical Parallax
4. Discussion
5. Conclusions
Supplementary Materials
Author Contributions
Funding
Institutional Review Board Statement
Informed Consent Statement
Data Availability Statement
Conflicts of Interest
References
- Deng, N.; Ye, J.; Chen, N.; Yang, X. Towards Stereoscopic On-vehicle AR-HUD. Vis. Comput. 2021, 37, 2527–2538. [Google Scholar] [CrossRef]
- Yamin, P.A.; Park, J.; Kim, H.K. Towards a Human-Machine Interface Guidance for in-Vehicle Augmented Reality Head-up Displays. ICIC Express Lett. 2021, 15, 1313–1318. [Google Scholar]
- Blankenbach, K. Requirements and System Aspects of AR-Head-Up Displays. IEEE Consum. Electron. Mag. 2019, 8, 62–67. [Google Scholar] [CrossRef]
- Zhou, T.; Qiao, W.; Hua, J.; Chen, L. Status and Prospect of Augmented Reality Head-Up Display. Laser Optoelectron. Prog. 2023, 60. [Google Scholar]
- Kim, K.-H.; Park, S.-C. Optical System Design and Evaluation for an Augmented Reality Head-up Display Using Aberration and Parallax Analysis. Curr. Opt. Photonics 2021, 5, 660–671. [Google Scholar]
- Kim, K.-H.; Park, S.-C. Optical System Design for a Head-up Display through Analysis of Distortion and Biocular Parallax. Korean J. Opt. Photonics 2020, 31, 88–95. [Google Scholar]
- Zhao, Z.; Cheng, D.; Yang, T.; Wang, Q.; Hou, Q.; Gu, L.; Wang, Y. Design and evaluation of a biocular system. Appl. Opt. 2019, 58, 7851–7857. [Google Scholar] [CrossRef]
- Liu, Y.; Guo, X.; Fan, Y.; Meng, X.; Wang, J. Subjective assessment on visual fatigue versus stereoscopic disparities. J. Soc. Inf. Disp. 2021, 29, 497–504. [Google Scholar] [CrossRef]
- Zhou, M.; Cheng, D.; Wang, Q.; Chen, H.; Wang, Y. Design of an off-axis four-mirror system for automotive head-up display. In Proceedings of the Applied Optics and Photonics China (AOPC) Conference—MEMS, THz MEMS, and Metamaterials and AI in Optics and Photonics, Beijing, China, 30 November–2 December 2020. [Google Scholar]
- Kim, H.; Lee, M.; Kim, G.J.; Hwang, J.-I. The Impacts of Visual Effects on User Perception with a Virtual Human in Augmented Reality Conflict Situations. IEEE Access 2021, 9, 35300–35312. [Google Scholar] [CrossRef]
- Pladere, T.; Luguzis, A.; Zabels, R.; Smukulis, R.; Barkovska, V.; Krauze, L.; Konosonoka, V.; Svede, A.; Krumina, G. When virtual and real worlds coexist: Visualization and visual system affect spatial performance in augmented reality. J. Vis. 2021, 21, 17. [Google Scholar] [CrossRef] [PubMed]
- Silva, A.R.; Farias, M.C.Q. Perceptual quality assessment of 3D videos with stereoscopic degradations. Multimed. Tools Appl. 2019, 79, 1603–1623. [Google Scholar] [CrossRef]
- Sugita, N.; Sasaki, K.; Yoshizawa, M.; Ichiji, K.; Abe, M.; Homma, N.; Yambe, T. Effect of viewing a three-dimensional movie with vertical parallax. Displays 2018, 58, 20–26. [Google Scholar] [CrossRef]
- Erkelens, I.M.; MacKenzie, K.J. 19-2: Vergence-Accommodation Conflicts in Augmented Reality: Impacts on Perceived Image Quality. SID Symp. Dig. Tech. Pap. 2020, 51, 265–268. [Google Scholar] [CrossRef]
- Hirota, M.; Kanda, H.; Endo, T.; Miyoshi, T.; Miyagawa, S.; Hirohara, Y.; Yamaguchi, T.; Saika, M.; Morimoto, T.; Fujikado, T. Comparison of visual fatigue caused by head-mounted display for virtual reality and two-dimensional display using objective and subjective evaluation. Ergonomics 2019, 62, 759–766. [Google Scholar] [CrossRef] [PubMed]
- Wang, Y.; Potemin, I.S.; Zhdanov, A.; Bogdanov, N.; Zhdanov, D.; Livshits, I. Analysis of the visual perception conflicts in designing mixed reality systems. In Proceedings of the Optical Design and Testing Viii, Beijing, China, 11–13 October 2018; SPIE/COS Photonics Asia: Beijing, China, 2018; Volume 10815, p. 108150U. [Google Scholar]
- Faul, F.; Erdfelder, E.; Lang, A.-G. G* Power 3: A flexible statistical power analysis program for the social, behavioral, and biomedical sciences. Behav. Res. Methods 2007, 39, 175–191. [Google Scholar] [CrossRef] [PubMed]
- Doshida, Y.; Itabashi, M.; Takei, T.; Takino, Y.; Sato, A.; Yumura, W.; Maruyama, N.; Ishigami, A. Reduced Plasma Ascorbate and Increased Proportion of Dehydroascorbic Acid Levels in Patients Undergoing Hemodialysis. Life 2021, 11, 1023. [Google Scholar] [CrossRef] [PubMed]
- Kei, C.P.; Nordin, N.A.M.; Aziz, A.F.A. The effectiveness of home-based therapy on functional outcome, self-efficacy and anxiety among discharged stroke survivors. Medicine 2020, 99, e23296. [Google Scholar] [CrossRef]
- Jackson, G.R.; Owsley, C.; McGwin, G. Aging and dark adaptation. Vis. Res. 1999, 39, 3975–3982. [Google Scholar] [CrossRef]
- Lamb, T.; Pugh, E. Dark adaptation and the retinoid cycle of vision. Prog. Retin. Eye Res. 2004, 23, 307–380. [Google Scholar] [CrossRef]
- Kalloniatis, M.; Luu, C. Light and Dark Adaptation; University of Utah Health Sciences Center: Salt Lake City, UT, USA, 1995. [Google Scholar]
- Brickenkamp, R.; Zillmer, E.A. D2 Test of Attention; U.S. Hogrefe & Huber Publishers: Cambridge, MA, USA, 1998; pp. 3–12. [Google Scholar]
- Hou, D.; Luo, M.; Hao, L.; Lin, Y. Applicability Analysis of Human Health Evaluation Methods in Light Environment Research. Zhaoming Gongcheng Xuebao 2021, 32, 76–93. [Google Scholar]
- Shahid, A.; Wilkinson, K.; Marcu, S.; Shapiro, C.M. (Eds.) Visual Analogue Scale to Evaluate Fatigue Severity (VAS-F). In STOP, THAT and One Hundred Other Sleep; Springer: New York, NY, USA, 2012; pp. 399–402. [Google Scholar]
- Lee, K.A.; Hicks, G.; Nino-Murcia, G. Validity and reliability of a scale to assess fatigue. Psychiatry Res. 1991, 36, 291–298. [Google Scholar] [CrossRef]
- Benedetto, S.; Carbone, A.; Drai-Zerbib, V.; Pedrotti, M.; Baccino, T. Effects of luminance and illuminance on visual fatigue and arousal during digital reading. Comput. Hum. Behav. 2014, 41, 112–119. [Google Scholar] [CrossRef]
- Heuer, H.; Hollendiek, G.; Kröger, H.; Römer, T. Rest position of the eyes and its effect on viewing distance and visual fatigue in computer display work. Z. Exp. Angew. Psychol. 1989, 36, 538–566. [Google Scholar]
- Fredenburg, P.; Harwerth, R.S. The relative sensitivities of sensory and motor fusion to small binocular disparities. Vis. Res. 2001, 41, 1969–1979. [Google Scholar] [CrossRef]


| No. | Variable Name | Parallax Value (mrad) |
|---|---|---|
| 1 | Overall horizontal parallax | 0, 1.65, 3.31, 6.24, 10.61, 13.67, 20.97 |
| 2 | Overall vertical parallax | 0, 2.24, 4.05, 6.61, 8.96, 12.27, 15.15 |
| No. | Variable Name | Differences Parallax Value (mrad) |
|---|---|---|
| 1 | Stepped horizontal parallax | 0, 0.85, 1.65, 2.45, 3.31, 4.05, 4.64 |
| 2 | Stepped vertical parallax | 0, 0.53, 1.71, 2.24, 2.88, 3.41, 4.05 |
| Parallax (Median) | TN | E1 | E2 | TN-E | CP | FR |
|---|---|---|---|---|---|---|
| 0 (n = 17) | 652.000 | 1.380 | 0.180 | 627.000 | 180.000 | 5.000 |
| 0.85 (n = 17) | 652.000 | 1.640 | 0.310 | 635.000 | 185.000 | 6.000 |
| 1.65 (n = 17) | 652.000 | 1.680 | 0.300 | 632.000 | 180.000 | 4.000 |
| 2.45 (n = 17) | 644.000 | 1.580 | 0.340 | 620.000 | 176.000 | 6.000 |
| 3.31 (n = 17) | 649.000 | 2.760 | 0.520 | 612.000 | 165.000 | 8.000 |
| 4.05 (n = 17) | 627.000 | 7.750 | 1.670 | 565.000 | 129.000 | 9.000 |
| 4.64 (n = 17) | 614.000 | 11.300 | 1.760 | 514.000 | 92.000 | 12.000 |
| Kruskal–Wallis test statistic H-value | 13.956 | 38.112 | 30.650 | 43.342 | 45.950 | 15.079 |
| p-value | 0.030 * | 0.000 ** | 0.000 ** | 0.000 ** | 0.000 ** | 0.020 * |
| Parallax (Median) | TN | E1 | E2 | TNE | CP | FR |
|---|---|---|---|---|---|---|
| 0 (n = 17) | 642.000 | 1.850 | 0.470 | 617.000 | 180.000 | 5.000 |
| 0.53 (n = 17) | 625.000 | 2.080 | 0.610 | 603.000 | 167.000 | 6.000 |
| 1.71 (n = 17) | 631.000 | 2.110 | 0.470 | 608.000 | 174.000 | 4.000 |
| 2.24 (n = 17) | 635.000 | 2.910 | 0.910 | 608.000 | 165.000 | 6.000 |
| 2.88 (n = 17) | 619.000 | 3.180 | 0.760 | 590.000 | 157.000 | 8.000 |
| 3.41 (n = 17) | 606.000 | 4.140 | 0.560 | 566.000 | 157.000 | 9.000 |
| 4.05 (n = 17) | 630.000 | 3.960 | 1.080 | 564.000 | 146.000 | 12.000 |
| Kruskal–Wallis test statistic H-value | 6.031 | 9.798 | 12.370 | 11.476 | 14.293 | 15.079 |
| p | 0.420 | 0.133 | 0.054 | 0.075 | 0.027 * | 0.020 * |
Disclaimer/Publisher’s Note: The statements, opinions and data contained in all publications are solely those of the individual author(s) and contributor(s) and not of MDPI and/or the editor(s). MDPI and/or the editor(s) disclaim responsibility for any injury to people or property resulting from any ideas, methods, instructions or products referred to in the content. |
© 2023 by the authors. Licensee MDPI, Basel, Switzerland. This article is an open access article distributed under the terms and conditions of the Creative Commons Attribution (CC BY) license (https://creativecommons.org/licenses/by/4.0/).
Share and Cite
Song, J.; Fan, Z.; Xu, W.; Ji, Z.; Lin, Y. Parallax of Head-Up Displays and Visual Safety for Driving. Appl. Sci. 2023, 13, 13189. https://doi.org/10.3390/app132413189
Song J, Fan Z, Xu W, Ji Z, Lin Y. Parallax of Head-Up Displays and Visual Safety for Driving. Applied Sciences. 2023; 13(24):13189. https://doi.org/10.3390/app132413189
Chicago/Turabian StyleSong, Jun, Zihang Fan, Wei Xu, Zhengxin Ji, and Yandan Lin. 2023. "Parallax of Head-Up Displays and Visual Safety for Driving" Applied Sciences 13, no. 24: 13189. https://doi.org/10.3390/app132413189
APA StyleSong, J., Fan, Z., Xu, W., Ji, Z., & Lin, Y. (2023). Parallax of Head-Up Displays and Visual Safety for Driving. Applied Sciences, 13(24), 13189. https://doi.org/10.3390/app132413189