Abstract
In performance-based design for domestic buildings, there is a growing need for real-time comparison between the Available Safe Egress Time and Required Safe Egress Time through the integration of fire and evacuation simulations. Therefore, the utilization of the Consolidated Model of Fire and Smoke Transport (CFAST) has been discussed as an alternative to the Fire Dynamics Simulator (FDS), which has high computational costs; requires sufficient experience in the numerical calculation of fire dynamics, along with various input parameters; and has limitations in coupling with evacuation simulations. In this study, the prediction performance of CFAST for the activation times of smoke and heat detectors was evaluated. Specifically, it is essential to configure the mass movement between adjacent computational regions for smoke concentration. For achieving adequate predictive performance, the temperature should be determined according to the ceiling jet velocity generated by the fire source. Therefore, a method for setting a computational domain that can produce reasonable prediction results while considering the characteristics of CFAST for different types of smoke and heat detectors is proposed.
1. Introduction
Fire safety design typically involves performance-based design (PBD), in which engineering simulations are employed to mitigate building fire risks for high-rise or exceptional buildings. In PBD, the fire safety of a structure is evaluated by comparing the Available Safe Egress Time (ASET) and Required Safe Egress Time (RSET) obtained through fire and evacuation simulations. The timeline technique is applied to evaluate the time factor for life safety in buildings in high-fire risk scenarios. The ASET and RSET are calculated separately through fire and evacuation simulations, and the ASET must significantly exceed the RSET to ensure safe evacuation [1]. Widely used tools for fire simulation include the Fire Dynamics Simulator (FDS) [2] and Consolidated Model of Fire and Smoke Transport (CFAST) [3], which were developed and validated by the U.S. National Institute of Standards and Technology (NIST). Evacuation simulations are conducted using tools such as Pathfinder [4] and Simulex [5] developed by Thunderhead Engineering, as well as buildingEXODUS [6]. However, the temperatures and chemical concentrations predicted in these fire evacuation simulations do not account for the expected positions of evacuees.
In South Korea, there is a critical demand for prediction results in PBD based on diverse fire scenarios specific to various buildings. FDS has been extensively employed because of its constant validation with numerous large-scale fire experiments [7] and its reliance on the large eddy simulation technique [2,8], allowing efficient interpretation of complex and abnormal fire phenomena. For obtaining reliable predictive outcomes through FDS, precision in both the physical and numerical input factors is essential. Specifically, the heat release rate per unit area (HRRPUA) significantly affects numerical solutions [9]. Multiple user-demanded input factors, such as the visibility, CO and CO2 concentrations, and soot yields resulting from fire phenomena, are crucial for alignment with fire safety standards. Experimental measurements and databases for the heat release rate (HRR), CO yield, and soot yield of various combustible materials under different fire conditions have been reported [10]. Additionally, physically measured input factors from experiments have been employed to accurately predict fire detector activation times in PBD for building RSET [11,12]. Despite utilizing seemingly similar fire scenarios, the diversity in input factors at the discretion of PBD practitioners leads to significantly different risk evaluations. Moreover, the grid size significantly affects the accuracy of the numerical solutions, indicating the importance of varied numerical experiences for the reliable interpretation of results.
CFAST is a zone model applied as a representative fire modeling tool that divides a fire region into an upper hot layer and a lower cold layer. It assumes uniform properties by considering the relationship between the heat and mass flows across their boundaries. It assumes that each zone is a single control volume and uses mass and energy conservation laws to consider changes over time through empirical correlations. There is an entry barrier because of the requirement for an understanding of fire dynamics to conceptually simplify the fire behavior. The tool has excellent predictive performance for small calculation domains but may exhibit reduced reliability for larger or irregularly shaped areas because of its requirement for similar compartment dimensions [13]. However, it offers ease of operation with minimal education, compatibility with low-performance computers, and minimal computational cost. Compared with other analytical tools, it is known for its rapid calculations and superior predictive performance for small calculation domains. Fire engineers and researchers have verified the accuracy of CFAST through experiments and reported cost-effective outcomes [14,15,16]. Thus, CFAST provides a straightforward means to understand fire dynamics trends and obtain clear results despite its simplifying assumptions.
This study is part of a project aimed at developing a program for fire safety managers to create evacuation plans for buildings in the event of a fire. To assess the ASET and RSET within the same domain in real time through fire and evacuation simulations, the suitability of relatively simple analysis tools such as CFAST was examined. Even with limited knowledge of fire engineering and models, we hope to provide a setup method for predicting the appropriate activation times of smoke and heat detectors when modeling a corridor fire. The assumption of uniform physical quantities in zone modeling for each zone emphasizes caution in fire modeling in areas with high horizontal aspect ratios, such as corridors [13]. Therefore, we reviewed the empirical correlations applied to predict the activation times of smoke and heat detectors in CFAST. Despite identical computational areas, the physics predicted by CFAST can yield varying results depending on the setup, offering design strategies with good predictive performance for the smoke and heat detector activation times.
2. Conditions and Methods for Fire Simulation
2.1. Fire Simulation Conditions
Prediction results for smoke and heat dispersion were obtained using FDS (version 6.7.9) and CFAST (version 7.7.0) to evaluate the performance of different fire models. We compared the smoke concentration and temperature predictions of CFAST with those of FDS for the computational domain of a corridor shape with a high aspect ratio, as shown in Figure 1. Figure 1a is the calculation domain considered in FDS, which is set to 3.6 m (x) × 2.4 (y) × 2.4 (z) based on the ISO 9705 compartment size, and a corridor geometry extending 12 m in the longitudinal direction (x) is considered. To directly compare the prediction results of FDS and CFAST, openings in the compartments were not considered. Smoke and heat detectors were installed at 2.4 m intervals, following the ISO 9705 standard size, to predict the smoke concentration and temperature. Figure 1b illustrates the computational domain of CFAST, where the “compartments” feature of CFAST was employed. An area covering a distance equal to the width of the compartment (W) was set in accordance with ISO 9705. Four conditions were considered, including a corridor shape divided at intervals equivalent to the width (1W, 2W, and 5W). This nomenclature was assigned to these conditions. Furthermore, under all the conditions, a 1.0 m square fire source was located at the center of ISO 9705.
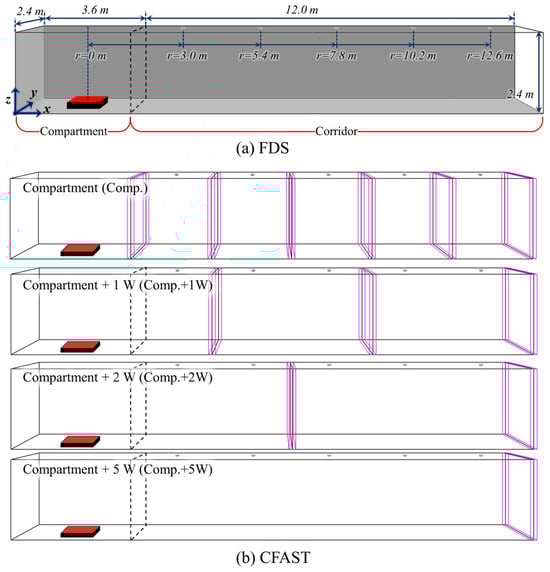
Figure 1.
Schematic and scale of the computational domain for heat and smoke diffusion.
Various fire conditions were applied to the fire simulation inputs to evaluate the predicted activation times of the smoke and heat detectors, as shown in Figure 2. Importantly, the generation of smoke and the temperature rise during the initial fire stage can vary significantly according to the fire growth rate. Four conditions—slow, medium, fast, and ultrafast—from NFPA 92 B [17] were considered, with the same maximum heat release rate (HRRmax) of 1.0 MW. Each fire scenario was configured to reach the HRR of 1.0 MW and maintain it for 1000 s before termination. With these different fire growth curves set as boundary conditions, the appropriate initial stage of the fire was considered, and the activation times of the smoke and heat detectors were evaluated. Additionally, the smoke concentrations, temperatures, and flow rates at fire detector locations were predicted to estimate their activation times. The fuel selected for the fire growth curve implementation was n-heptane (C7H16). Details regarding the properties of the additional fuel [18,19] and input parameters for the fire detector prediction methods are presented in Table 1. These input parameters for heat and smoke detectors were set according to a database of experimentally measured results from previous studies.
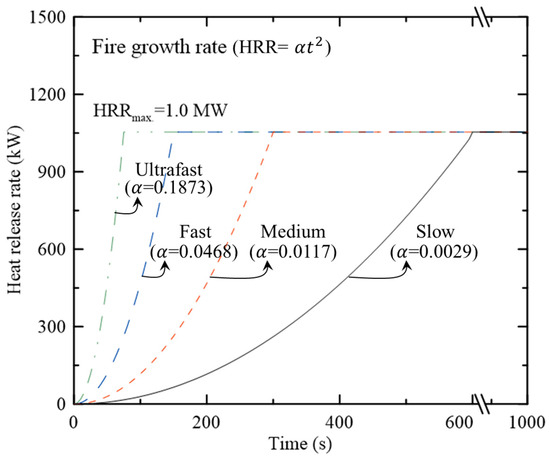
Figure 2.
Fire conditions considered for the predictive performance comparison of FDS and CFAST.

Table 1.
Summary of Simulation Conditions for Combustion and Fire Detector Properties.
The selection of the grid size is important for ensuring the reliability of the prediction results of FDS, which can then be compared with the prediction results of CFAST [20]. In fire simulations, the grid size can be determined according to the characteristic fire diameters in Equation (1) [21]. Generally, good prediction results can be achieved when 4–16 grids [22] or 10–20 grids [23] are set up inside .
Here, under standard conditions (20 °C, 1 atm), represents the air density (kg/m3), represents the specific heat (kJ/kg·K), represents the absolute temperature (K), represents the gravitational acceleration (m/s2), and represents the maximum HRR of the fire source used in this study. With the maximum HRR applied in this study as the reference, i.e., = 0.05 m, the selected grid size is deemed sufficient, considering a method that uses the characteristic fire diameter, which includes 16 grid cells. The final computational area in FDS (Figure 1a) comprised a uniform grid system of 0.05 m3, consisting of 718,848 cells. This allowed the assessment of the predictive performance of CFAST for physical quantities, such as the smoke concentration and temperature, through a comparison. Regarding computational cost, FDS had a computation time of approximately 3360 min, while CFAST was 100,800 times shorter.
2.2. Fire Detector Numerical Models Based on Fire Models
Depending on the type of fire model, FDS and CFAST have differences in the numerical methods applied to predict the activation times of smoke and heat detectors. FDS employs the Heskestad and Cleary models to predict the activation times of smoke detectors. The Heskestad model [24] is a first-order accuracy model that calculates the characteristic time () when smoke generated by a fire travels a distance through the detector at velocity to reach the detector.
Here, a delay exists in the characteristic time () between the smoke concentration at the detector ( and the smoke layer (). The detector is triggered when exceeds a threshold. In addition, the Cleary model [25] adds the mixing time inside the detector to the Heskestad model, which considers delays that may be caused by the geometry of the detector or internal flow.
Here, represents the time at which smoke enters the smoke detector, and represents the mixing time in the smoke detector chamber. Additionally, empirical constants derived through experimentation, such as and , are applied considering the inflow and mixing of smoke particles according to the shape of the smoke detector. (obscuration per meter, %/m)—a common input in both numerical models—is an experimentally measured value. When it exceeds the set value, the detector is activated, as given by Equation (4) [2,9]:
where is the specific extinction coefficient (m2/kg), represents the density of smoke particulate matter (mg/m3), and represents the distance. As is sensitive to variations in the type of fuel and ventilation conditions, the application of empirically measured values is crucial. However, in this study, an average value of 8700 m2/kg was applied, considering various fuels and conditions [2,8].
The activation time of a heat detector in FDS is determined using Equation (5), which considers factors such as the air velocity () at the detector location, response time index (RTI), gas temperature (), and predicted temperature at the detector (link temperature, ). These elements all contribute to the prediction of the activation time of the heat detector [26,27]. Users can specify the RTI and activation temperature according to the installation location of the heat detector and an experimentally measured database [2,8,28].
The algorithm applied by CFAST to predict the activation time of a smoke detector is given by Equation (6), and it is relatively simpler than FDS. In contrast to FDS, it does not account for factors such as the delay in smoke reaching the detector location, temperature, or airflow within the detector chamber as smoke moves from the fire source to the detector [13].
Here, represents the smoke concentration (optical smoke density, m−1), derived from the relationship between and (mass of soot per unit volume, kg/m3). Additionally, relatively simplistically predicts compared with FDS, and if exceeds a predefined threshold, the detector is activated [13].
The method of predicting the smoke concentration and temperature in CFAST depending on the utilization of the “compartments” function is illustrated in Figure 3. From the perspective of smoke concentration, utilizing the “compartments” feature allows the implementation of smoke movement in defining the calculation domain. As shown in Figure 3a, when the “compartments” functionality is utilized, a boundary separating high-temperature upper layers and lower-temperature, adequately oxygenated lower layers leads to similar physical quantities in zones of uniform volume centered around that boundary. Additionally, as depicted in Figure 3b, the use of the “compartments” feature allows mass transfer to be set up between adjacent compartments. CFAST applies the principles of mass and energy conservation. If the domain is divided into “compartments” accounting for zones with and without the fire source, the smoke concentrations in both the upper and lower regions can be calculated using the Bernoulli equation for predicting airflow velocities in the ventilation section.
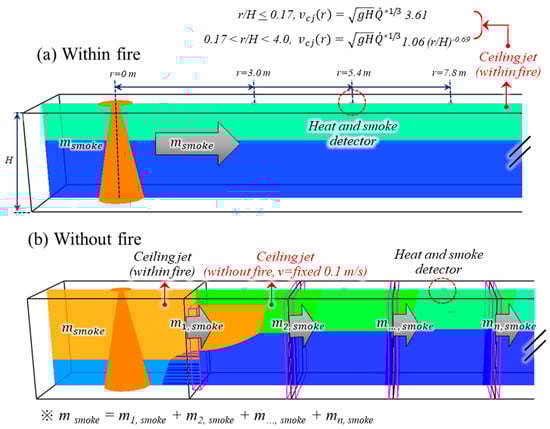
Figure 3.
Comparison of the numerical models for smoke and heat detection used in CFSAT.
Temperature and airflow were not considered when determining the smoke concentration. Hence, if the fire and area of interest are distant, this function can be used to predict suitable smoke concentrations. Heat detectors are predicted using the same physical quantities and algorithms as FDS, but the approach for obtaining the velocity differs; Equations (7) and (8) are employed [13].
Here, represents the ceiling jet flow rate (m/s), which depends on the distance (r) from the fire to the heat detector within the fire compartment and the height (H) of the calculation area, and represents the gravitational acceleration (m/s2), which is outlined schematically in Figure 3a for clarity. CFAST employs an empirical correlation to derive , considering the relationship between the radial distance (r) from the fire center and the specified height (H) of the calculation area. It is categorized according to the ratio r/H from the fire center axis: when r/H is ≤0.17 and when it exceeds 0.17 but remains ≤4.0. In other words, if the distance between the fire and the area of interest is relatively close, the velocity is calculated using Equation (7), and if they are distant, Equation (8) is applied. Moreover, as shown in Figure 3b, even when the fire is extremely close, if the heat detector is not within the fire compartment, is fixed at 0.1 m/s [13]. Consequently, to accurately predict smoke transport, it is crucial to appropriately segment the fire and the area of interest. Temperature prediction focuses on configuring the calculated area to consider .
In Equations (7) and (8), [27] is a dimensionless number related to the HRR of the fire, which is given by Equation (9). The terms in this equation represent the density of the surrounding air (, kg/m3), specific heat (, kJ/kg·K), absolute temperature (, K), gravitational acceleration (, m/s2), maximum HRR of the fire (, kW), and height (H, m) of the calculation area. In this study, we utilized = 1.211 kg/m3, = 1.0068 kJ/kg·K, = 9.813 m/s2, and H = 2.4 m [29].
Figure 4 presents an examination of the point at which the derived from these correlations converged to 0.1 m/s as a function of the HRR and distance from the fire. An arbitrary categorization into four stages based on a maximum HRR of 1000 kW was applied. The fixed height was 2.4 m, and was determined according to the distance variation. For a relatively low heat release rate of 100 kW, a velocity of 0.1 m/s was observed when r/H exceeded 30, corresponding to a distance of 70 m from the fire. When the maximum HRR of 1000 kW is considered, a velocity of 0.1 m/s occurs when r/H exceeds 100, which corresponds to a distance of >250 m from the fire. Therefore, the fixation of V (0.1 m/s by CFAST in areas not within the fire room) appears to be an assumption for regions that are minimally influenced by the flame-induced pressure and upper- and lower-layer temperatures. According to these results, it is recommended to exercise caution when employing the “compartments” function to segment the calculation area from the fire room in engineering simulations, except in cases where the heat detectors and the fire source are very distant.
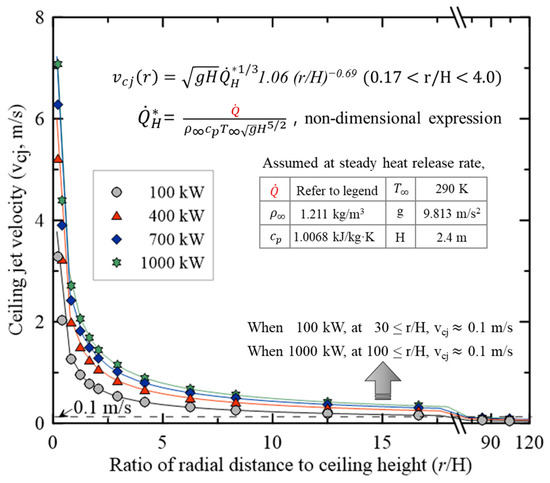
Figure 4.
Comparison of the ceiling jet flow calculation results for changes in the maximum HRR.
3. Results and Analysis
3.1. Predictive Performance of Fire Detectors Based on Fire Models
Figure 5 presents the activation times of the smoke and heat detectors based on fire growth rate variations obtained using FDS and CFAST, as part of prior research on diverse fire scenarios. The calculation domain adopted in this study featured a corridor-shaped compartment divided into compartment widths (Comp.) for both the FDS and CFAST analyses. As indicated by the smoke detector activation time results in Figure 5a, CFAST tended to overpredict the activation time as the fire grew rapidly and the detector moved farther from the fire source. However, overall, the smoke detector activation times obtained via CFAST were similar to those obtained using FDS. Compared with the relatively complex FDS, which considers characteristic lengths, delay times, and the time taken for smoke to enter the chamber, CFAST only considers yet exhibited similar activation times. In Figure 5b, the results obtained via CFAST exhibit a large discrepancy compared with the FDS predictions for the heat detector. This result can be fully expected from the empirical correlation in CFAST to predict the activation time of the heat detectors, as previously mentioned. This is because a fixed velocity of 0.1 m/s was applied, rather than the exact velocity considered in the empirical correlation, as the fire room and the area of interest were separated.
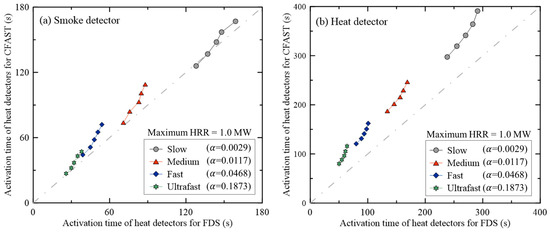
Figure 5.
Comparison of activation times for smoke and heat detectors according to the design of the computational domain in CFAST.
Figure 6 presents a comparison of the smoke and heat detector activation times in FDS based on different compartmentalization methods concerning the calculation domain settings in CFAST. As indicated by the predicted smoke detector activation times in Figure 6a, under the slow fire conditions, the ‘Comp.’ condition aligned closely with the FDS predictions. However, for ‘Comp.+5W’, the fire room and smoke detector were located in the same zone and exhibited identical smoke concentration values, indicating that the detectors were simultaneously activated. Smoke detectors situated in spaces adjacent to the fire room exhibited a maximum overprediction of 23 s. Furthermore, at a distance of 7.8 m from the fire, a minimum underprediction of 10 s was observed, and it was anticipated that this difference would increase with the distance from the fire. This implies that for accurate calculation of RSET, the calculation area must be properly partitioned when the smoke detector is a sufficient distance from the fire source.
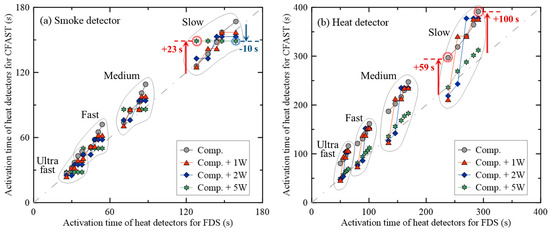
Figure 6.
Comparison of the activation times of smoke and heat detectors according to the design of the computational domain in CFAST.
For the slow fire condition, as shown in Figure 6b, CFAST overpredicted the heat detector activation time for ‘Comp.’ by 59–100 s depending on the distance. The reason for this large difference from the FDS results is that CFAST assumed that the space separated from the fire room had a of 0.1 m/s, even if it was adjacent to the fire room. For ‘Comp.+5W’, the predictions from FDS and CFAST were similar, because CFAST used a built-in empirical correlation to calculate the temperature as the fire and detector were set in the same fire room even though they were far apart. To appropriately predict the temperature, which is significantly affected by velocity, close attention must be paid to the division between the fire room and the areas of interest. Ultimately, for smoke detectors, a suitable division from the fire room is necessary if they are a sufficient distance from the fire. For the prediction of the heat detectors, they must be within the same calculation area as the fire.
3.2. Predictive Performance of Fire Models for Physical Quantities
Figure 7 shows the predicted smoke concentrations from both FDS and CFAST, corresponding to the simulations performed on a compartmentalized area including fire and non-fire spaces (Comp.). The accuracy of the predictions was evaluated using a slow fire. As indicated by Figure 7a, the smoke concentration predictions based on distance differed between the two fire models. It can be seen that as time passes, the smoke concentration predicted by CFAST appears to overpredict compared to the results from FDS. However, in this study, we are interested in the smoke concentration predicted at the beginning of the fire from the perspective of validating the prediction performance of smoke detectors activated at the beginning of the fire. The calculated smoke concentration at the moment of smoke detector activation is 0.16 m−1, and the smoke concentration at the beginning of the fire is shown in Figure 7b. The results show that the FDS tends to underpredict in the early stages of the fire, but the range of smoke concentrations at which the detectors trigger is very similar. This difference is attributed to the energy and mass conservation principle—particularly in cases where hallways are partitioned, causing mass transfer between adjacent compartments. However, it is necessary to perform additional analysis by applying various configurations of the computational areas before interpreting these results as signs of superior predictive capability in engineering applications.
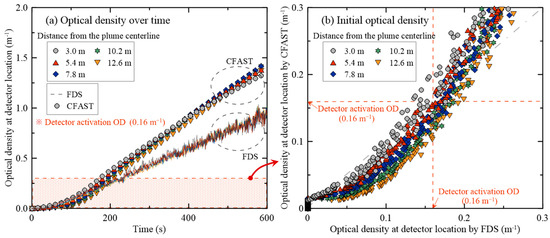
Figure 7.
Comparison of smoke densities at the detector location predicted using FDS and CFAST.
The raw data for the gas temperature and velocity predicted at the locations of the heat detectors are presented in Figure 8 as a physical quantity applied to predict the activation time of the heat detectors. This is the result of a computational domain (Comp.+5W) where the fire room and corridor geometry is set as a single space, as the flow rate is an essential consideration in the rule of thumb for predicting smoke detector activation times in CFAST. As shown in Figure 8a, CFAST significantly overpredicted the temperature near the fire compared with FDS. However, as the distance from the fire increased, the temperature predictions of FDS and CFAST became remarkably similar. Figure 8b shows the predicted velocities at the heat detector locations at an interval of 2.4 m starting from a distance of 3.0 m from the fire centerline. Overall, FDS predicted higher velocities than CFAST. In this context, the CFAST empirical correlation for predicting velocities only provides a prediction for r/H below 4.0. Here, the distances of 10.2 and 12.6 m from the fire exceeded the r/H of 4.0; nonetheless, the velocities were appropriately predicted using this methodology.
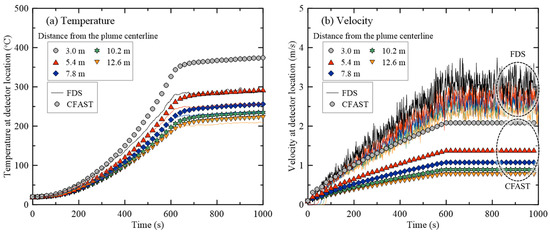
Figure 8.
Comparison of temperatures and velocities over time at the detector location predicted by FDS and CFAST.
Figure 9 presents the results for the gas temperatures and velocities predicted by FDS and CFAST at the locations of the heat detectors. As shown in Figure 9a, except for the locations close to the fire source, where the predicted temperatures of CFAST were relatively high, most of the predictions aligned closely with the FDS results. In addition, as shown in Figure 9b, CFAST tended to underestimate the velocities. These results indicate the limitations of CFAST in predicting velocities using empirical correlations compared with FDS, which divides the physical conditions of each cell in a three-dimensional grid as functions of time with respect to mass, momentum, and energy. Furthermore, the results at 10.2 and 12.6 m from the fire in CFAST suggest that the interpretation of velocities using the same empirical correlation remains unchanged even when the distance (r/H) from the fire exceeds the applied range of 4.0.
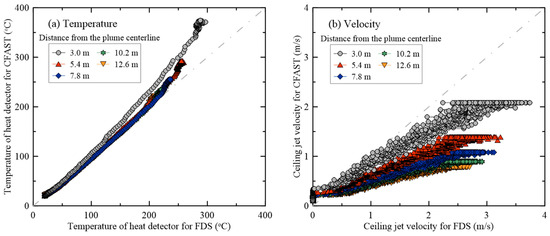
Figure 9.
Comparison of temperatures and velocities over time at the detector location predicted by FDS and CFAST.
Figure 10 shows the partitioning of the fireroom and corridor area in CFAST, presenting the results based on variations. CFAST uses different methods to apply within the same space, limiting to 0.1 m/s for this condition. The activation times of the detectors predicted by FDS and CFAST were compared for fixed flow rate changes in spaces without fire. When increased, the prediction results of FDS and CFAST were remarkably similar, whereas the activation time predicted with fixed at 0.1 m/s exhibited a discrepancy of approximately 100 s. In subsequent research, we will evaluate the prediction results by applying simple empirical correlations obtained from large-horizontal-aspect-ratio corridor fire experiments to the CFAST. Specifically, it is anticipated that the predictive performance of CFAST can be enhanced by applying empirical correlations that consider only the distance between the fire source and area of interest, rather than the mere presence of the fire source within the same space.
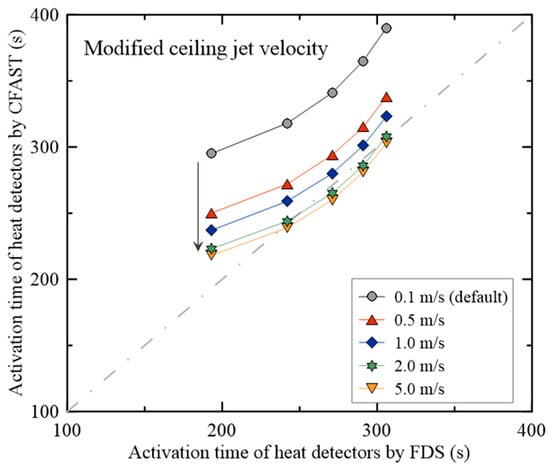
Figure 10.
Comparison of activation times of heat detectors predicted by FDS and CFAST for changes in the fixed ceiling jet flow.
4. Conclusions
This study was conducted as part of a project to develop a program for fire safety managers to establish evacuation plans in the event of a fire outbreak in a building. A program with low computational costs and the ability to integrate fire evacuation simulations in real time was required, prompting the use of CFAST. The objective was to compare the prediction accuracies of FDS and CFAST for the smoke and heat detector activation times, which are crucial factors applied as key parameters for determining the RSET in the fire risk assessment of buildings. The major results of this study are as follows.
To improve the prediction performance of smoke and heat detectors using CFAST, the results were compared and reviewed with FDS results for the same computational domain. A limitation of CFAST is that in multiple computational domains, the flow velocity is fixed depending on the presence or absence of a fire source in the same space. Therefore, if the area of interest is separated from the fire room, even if the area is very close to the source, the flow rate is fixed at 0.1 m/s. In addition, FDS and CFAST use different methods to predict the temperature and smoke concentrations.
The smoke concentration required by the smoke detector can be set such that mass moves between each adjacent compartment, provided the computational domain is appropriately partitioned with the fire room, due to CFAST’s application of mass and energy conservation. In addition, because the temperature and flow rate are not considered in the smoke concentration calculation, partitioning the calculation area without a fixed flow rate can improve the prediction of the appropriate smoke detector activation time.
The empirical correlation for predicting the activation times of heat detectors was observed to be significantly influenced by the velocity. Therefore, particular attention should be paid to the partitioning between the fire source and the areas of interest, as a constant velocity is applied according to the presence of a fire within the designated computational region. Additionally, when the fire source is in the same compartment, the velocity is determined using an empirical correlation that considers both the distance from the fire and the height of the calculation region, producing results that are similar to those of FDS.
Based on these results, it can be suggested that CFAST, requiring significantly lower computational costs than FDS, can estimate the activation times for smoke and heat detectors. In addition, our results expected that the information can be utilized to identify trends in fire engineering technology and fire dynamics in general.
Author Contributions
Conceptualization, C.-H.H.; methodology, H.-Y.J. and C.-H.H.; validation, H.-Y.J. and C.-H.H.; formal analysis, C.-H.H.; investigation, H.-Y.J. and C.-H.H.; resources, C.-H.H.; data curation, H.-Y.J.; writing—original draft preparation, H.-Y.J.; writing—review and editing, C.-H.H.; visualization, H.-Y.J.; supervision, C.-H.H.; project administration, C.-H.H.; funding acquisition, C.-H.H. All authors have read and agreed to the published version of the manuscript.
Funding
This paper was supported by the “National Fire Agency” R&D program (20016433).
Institutional Review Board Statement
Not applicable.
Informed Consent Statement
Not applicable.
Data Availability Statement
The data presented in this study are available on request from the corresponding author. The data are not publicly available due to restrictions on privacy.
Conflicts of Interest
The authors declare no conflict of interest.
References
- McGuire, J.H.; Tamura, G.T. Simple analysis of smoke-flow problems in high rise buildings. Fire Technol. 1975, 11, 15–22. [Google Scholar] [CrossRef]
- McGrattan, K.; Hostikka, S.; McDermott, R.; Floyd, J.; Weinschenk, C.; Overholt, K. Fire Dynamics Simulator User’s Guide, NIST SP 1019, 6th ed.; NIST: Gaithersburg, MD, USA, 2015. [Google Scholar]
- Peacock, R.D.; Reneke, P.A.; Forney, G.P. CFAST–Consolidated Fire and Smoke Transport (Version 7), Volume 2: User’s Guide, NIST TN 1889v2; NIST: Gaithersburg, MD, USA, 2021. [Google Scholar]
- Thunderhead Engineering. Pathfinder User Manual; Thunderhead Engineering: Manhattan, KS, USA, 2020. [Google Scholar]
- IES Virtual Environment. Egress: Simulex User Guide; IES Virtual Environment: Glasgow, UK, 2015. [Google Scholar]
- Galea, E.R.; Lawrence, P.J.; Gwynne, S.; Filippidis, L.; Blackshields, D.; Cooney, D. BuildingEXODUS v6.3 User Guide; GUEL Subsidiary of the University of Greenwich: London, UK, 2017. [Google Scholar]
- Brohez, S.; Caravita, I. Fire induced pressure in airthigh houses: Experiments and FDS validation. Fire Saf. J. 2020, 114, 103008. [Google Scholar] [CrossRef]
- McGrattan, K.; Hostikka, S.; McDermott, R.; Floyd, J.; Weinschenk, C.; Overholt, K. Fire Dynamic Simulator; Technical Reference Guide, NIST SP 1018-1, 6th ed.; NIST: Gaithersburg, MD, USA, 2015. [Google Scholar]
- NRC; EPRI. Verification and Validation of Selected Fire Models for Nuclear Power Plant Applications; NUREG-1824; EPRI 1011999; Final Report; NIST: Gaithersburg, MD, USA, 2007. [Google Scholar]
- Mun, S.Y.; Hwang, C.H.; Kim, S.C. CO and soot yields of wood combustibles for kitchen fire simulation. Fire Sci. Eng. 2019, 33, 76–84. [Google Scholar] [CrossRef]
- Jang, H.Y.; Hwang, C.H. Revision of the input parameters for the prediction models of smoke detectors based on the FDS. Fire Sci. Eng. 2017, 31, 44–51. [Google Scholar] [CrossRef]
- Yoon, K.Y.; Han, H.S.; Mun, S.Y.; Park, C.H.; Hwang, C.H. DB construction of activation temperature and response time index for domestic fixed-temperature heat detectors in ceiling jet flow. Fire Sci. Eng. 2020, 34, 35–42. [Google Scholar] [CrossRef]
- Peacock, R.D.; McGrattan, K.; Forney, G.P.; Reneke, P.A. CFAST Consolidated Fire and Smoke Transport–(Version 7), Volume 1: Technical Reference Guide, NIST TN 1889v1; NIST: Gaithersburg, MD, USA, 2021. [Google Scholar]
- Floyd, J. Comparison of CFAST and FDS for Fire Simulation with the HDR T51 and T52 Tests; US Department of Commerce, Technology Administration, NIST: Gaithersburg, MD, USA, 2002. [Google Scholar]
- Patterson, N.M. Assessing the Feasibility of Reducing the Grid Resolution in FDS Field Modelling; University of Canterbury: Christchurch, New Zealand, 2002. [Google Scholar]
- Williamson, J.; Beyler, C.; Floyd, J. Validation of Numerical Simulations of Compartment Fires with Forced or Natural Ventilation Using the Fire and Smoke Simulator (FSSIM), CFAST and FDS. Fire Saf. Sci. 2011, 10, 1277–1288. [Google Scholar] [CrossRef]
- James, A.M. Smoke Management for Covered Malls and Atria. Fire Technol. 1990, 26, 223–243. [Google Scholar]
- Babrauskas, V. Heat release rates. In SFPE Handbook of Fire Protection Engineering, 3rd ed.; DiNenno, P.J., Ed.; National Fire Protection Association: Quincy, MA, USA, 2002. [Google Scholar]
- Tewarson, A. Generation of heat and chemical compounds in fires. In SFPE Handbook of Fire Protection Engineering, 3rd ed.; DiNenno, P.J., Ed.; National Fire Protection Association: Quincy, MA, USA, 2002. [Google Scholar]
- Hwang, C.H. Large Eddy Simulation of Turbulent Premixed Flames in a Practical Combustor. Ph.D. Dissertation, Inha University, Incheon, Republic of Korea, 2006. [Google Scholar]
- Bounagui, A.; Benichou, N.; McCartney, C.; Kashef, A. Optimizing the Grid Size Used in CFD Simulations to Evaluate Fire Safety in Houses. In Proceedings of the 3rd NRC Symposium on Computational Fluid Dynamics, High Performance Computing and Virtual Reality, Ottawa, ON, Canada, 1 December 2003; pp. 1–8. [Google Scholar]
- NRC; EPRI. Nuclear Power Plant Fire Modeling Analysis Guidelines; NUREG-1934; EPRI 1023259; Final Report; NIST: Gaithersburg, MD, USA, 2012. [Google Scholar]
- McGrattan, K.; Floyd, J.; Forney, G.; Baum, H.; Hostikka, S. Improved Radiation and Combustion Routines for a Large Eddy Simulation Fire Model. In Fire Safety Science, Proceedings of the Seventh International Symposium, Worcester, MA, USA, 16–21 June 2003; NIST: Gaithersburg, MD, USA, 2005; pp. 827–838. [Google Scholar]
- Heskestad, G. Generalized Characterization of Smoke Entry and Response for Products of Combustion Detectors. In Proceedings of the 7th International Conference on Problems of Automatic Fire Detection, Rheinish-Westfalischen Hochschule Aachen, Aachen, Germany, 31 March–1 April 1975; pp. 267–310. [Google Scholar]
- Cleary, T.; Grosshandler, W.; Chernovsky, A. Smoke Detector Response to Nuisance Aerosols. In Proceedings of the 11th International Conference on Automatic Fire Detection “AUBE ‘99”, Duisberg, Germany, 16–18 March 1999; pp. 32–41. [Google Scholar]
- Heskestad, G.; Bill, R.G. Quantification of Thermal Responsiveness of Automatic Sprinklers Including Conduction Effects. Fire Saf. J. 1988, 14, 113–125. [Google Scholar] [CrossRef]
- Pomeroy, A.T. Analysis of the Effects of Temperature and Velocity on the Response Time Index of Heat Detectors. Masters’s Thesis, University of Maryland, College Park, MD, USA, 2010. [Google Scholar]
- Combustion & Fire Dynamics Lab. Available online: http://www.kfiredb.com/html/ (accessed on 22 March 2018).
- Heskestad, G. Engineering relations for fire plumes. Fire Saf. J. 1984, 7, 25–32. [Google Scholar] [CrossRef]
Disclaimer/Publisher’s Note: The statements, opinions and data contained in all publications are solely those of the individual author(s) and contributor(s) and not of MDPI and/or the editor(s). MDPI and/or the editor(s) disclaim responsibility for any injury to people or property resulting from any ideas, methods, instructions or products referred to in the content. |
© 2023 by the authors. Licensee MDPI, Basel, Switzerland. This article is an open access article distributed under the terms and conditions of the Creative Commons Attribution (CC BY) license (https://creativecommons.org/licenses/by/4.0/).