Abstract
In this study, the primary objective is to analyze fatigue crack propagation in linear elastic fracture mechanics using the SMART crack growth module in the ANSYS Workbench, employing the finite element method. The investigation encompasses several crucial steps, including the computation of stress intensity factors (SIFs), determination of crack paths, and estimation of remaining fatigue life. To thoroughly understand crack behavior under various loading conditions, a wide range of stress ratios, ranging from R = 0.1 to R = 0.9, is considered. The research findings highlight the significant impact of the stress ratio on the equivalent range of SIFs, fatigue life cycles, and distribution of deformation. As the stress ratio increases, there is a consistent reduction in the magnitude of the equivalent range of stress intensity factor. Additionally, a reciprocal relationship is observed between the level of X-directional deformation and the number of cycles to failure. This indicates that components experiencing lower levels of deformation tend to exhibit longer fatigue life cycles, as evidenced by the specimens studied. To verify the findings, the computational results are matched with the crack paths and fatigue life data obtained from both experimental and numerical sources available in the open literature. The extensive comparison carried out reveals a remarkable level of agreement between the computed outcomes and both the experimental and numerical results.
1. Introduction
The assessment of fatigue analysis is of utmost importance in determining the structural integrity and long-term durability of diverse engineering components that experience cyclic loading. A thorough comprehension of the crack growth mechanisms under diverse loading conditions is crucial for the precise prediction of fatigue life and for ensuring the safe operation of critical structures [1,2,3]. In order to mitigate significant damage, it is crucial to calculate the three-dimensional fatigue crack growth (FCG) and determine the permissible lifespan of structures that have cracks. The stress ratio (R) is computed by comparing the minimum stress to the maximum stress experienced during each loading cycle. Based on experimental data, it has been observed that the FCG is significantly affected by both the stress ratio (R) and the range of SIFs [4,5]. The stress ratio (R) is a crucial parameter in fatigue analysis as it quantifies the ratio of the minimum stress to the maximum stress encountered during a loading cycle. This parameter plays a pivotal role in characterizing the loading conditions and exerts a notable influence on the fatigue behavior and lifespan of a component. The selection of an appropriate stress ratio is crucial as it significantly influences the fatigue life of a material or component. To accurately estimate fatigue crack growth, several factors need to be taken into account, including stress level, load frequency, load ratio, and material type.
The load ratio is a factor that exerts a noteworthy influence on the growth of fatigue cracks and exhibits a distinct effect on the occurrence of threshold behavior [6,7,8,9,10,11]. Furthermore, the range of stress intensity factors represents the disparity between the maximum and minimum stress intensity factors experienced during each loading cycle. These factors play a crucial role in determining the rate of fatigue crack growth and are vital considerations in evaluating the durability and structural integrity of materials subjected to cyclic loading [12,13,14]. In this context, the investigation of stress ratios, deformation levels, and stress intensity factors (SIFs) becomes imperative to comprehensively analyze the fatigue life of materials. The strong correlation between FCG and LEFM forms a fundamental framework for understanding and analyzing crack behavior in materials, specifically within the linear elastic regime [15,16]. In linear elastic fracture mechanics (LEFM), three commonly used criteria exist to analyze crack propagation: the Maximum Tangential Stress (MTS) Criterion, the Maximum Shear Stress Ratio (MSSR) Criterion, and the Extension of the Maximum Tangential Stress (Ex-MTS) Criterion. These criteria and their respective explanations can be found in detail in references [17,18]. Numerous numerical techniques have demonstrated success in modeling and simulating engineering challenges, particularly in the field of fracture mechanics, where finding optimal solutions can be difficult due to the singularity of the stress field near the crack tip. These techniques include the Extended Finite Element Method (XFEM) [19,20,21,22], Finite Element Method (FEM) [16,23,24,25], Discrete Element Method (DEM) [26,27,28], a mesh-free method [29], and Boundary Element Method (BEM) [30]. Numerous numerical methods have been proposed for analyzing the FCG in the modified compact tension specimen under constant amplitude loading conditions. Recent research conducted by Baptista et al. [31] has shown the effectiveness of artificial neural networks in predicting the path and life of FCG in different geometries of the MCTS. The study highlights the importance of incorporating additional experimental data to further improve the training process. Gomes and Miranda [32] conducted a study where they employed both the dual boundary element method and finite element method using two software tools, namely BemCracker2D and Quebra2D. These methods were utilized to simulate two-dimensional crack growth in the MCTS.
Fatigue crack growth analysis is of paramount importance in the field of structural engineering as it ensures the safety and reliability of diverse components and structures. Traditionally, fatigue crack growth analysis involved extensive physical testing, which could be both time-consuming and expensive; however, with advancements in numerical simulation techniques, engineers and researchers now have a powerful tool at their disposal to predict and analyze crack behavior in a more efficient and cost-effective manner. The utilization of numerical simulation, particularly with ANSYS Workbench 19.2, offers numerous advantages for FCG analysis. The software’s comprehensive capabilities, time and cost efficiency, ability to conduct parametric studies, validation and verification features, and its status as an industry standard make it a preferred choice for engineers and researchers in the field. Engineers can effectively improve the safety, reliability, and performance of structures subjected to fatigue loading conditions by leveraging the capabilities of ANSYS Workbench. This software platform offers a range of powerful tools and simulations that enable engineers to analyze, optimize, and predict the behavior of designs under fatigue conditions. While ANSYS Workbench [33,34,35,36,37,38,39] is a prominent software for FCG analysis, it is important to acknowledge that there are other software tools available in the field with their own unique strengths and areas of application. Examples of such software tools include ABAQUS [40,41], FRANC3D [42], ZENCRACK [43], COMSOL [44], BEASY [45], and NASTRAN [46]. Certainly, this article primarily emphasizes the importance of ANSYS Workbench in the FCG analysis. The main objective is to investigate the intricate relationship among stress ratios, stress intensity factors, and crack growth in the context of fatigue analysis. By conducting a comprehensive analysis of these factors, a deeper comprehension of the fatigue behavior of materials and components can be attained. The stress ratio range of 0.1 to 0.9 is selected because it represents a wider range of real-world loading conditions. The outcomes of this study will contribute to the advancement of more precise fatigue life prediction models and provide insights for designing and maintaining practices that guarantee structural integrity and reliability. The research gap in this study pertains to a lack of specific information regarding the existing knowledge and understanding of the relationship between the stress ratio and fatigue crack propagation within the framework of linear elastic fracture mechanics. This indicates a need for further investigation to address this knowledge gap and develop a more comprehensive understanding of how stress ratio influences the behavior of fatigue crack propagation.
2. Numerical Analysis Procedure
Among the prominent software tools available for FCG analysis, ANSYS Workbench has emerged as a versatile and powerful platform. Its capabilities extend beyond traditional finite element analysis, encompassing a wide range of functionalities specifically designed for fatigue analysis. To streamline the analysis process, an unstructured mesh strategy was utilized, reducing preprocessing time and enabling faster meshing. To accommodate crack propagation, the analysis employed Separating Morphing Adaptive and Remeshing Technology (SMART) meshing, utilizing higher-order SOLID187 tetrahedral elements. At each step of the analysis, automatic mesh updates were performed to accurately capture the changes in the crack front. This approach ensured that the mesh effectively adapted to the evolving crack geometry, enabling precise simulations of crack propagation behavior. The SIFs were determined using the interaction integral evaluation technique, which is a well-established and widely accepted approach in fracture mechanics. By utilizing the interaction integral evaluation method, this study ensures precise and robust analysis of the SIFs. In this study, the determination of the FCG angle was based on the widely used maximum tangential stress criterion. According to this theory, when isotropic materials are subjected to mixed-mode loading, the crack tends to propagate along a path perpendicular to the direction of the maximum tangential tensile stress. The tangential stresses in polar coordinates can be mathematically represented by the following expressions [47,48,49,50]:
where and denote the normal stress in the radial direction and tangential direction, respectively, and denotes the shear stress.
By solving for , the result is expressed as follows:
From which the FCG angle in ANSYS is determined using the following formula:
where symbols KI and KII represent the SIFs for the opening mode and in-plane shear mode, respectively.
The SMART crack growth tool in ANSYS incorporates the use of the equivalent SIF range () to predict fatigue life under mixed-mode loading. For correlating FCG with , a power law relationship was proposed by Tanaka [51] in the form of a modified Paris law formula as follows:
where a is the crack length, N represents the number of cycles, and C and m are the Paris constant and Paris exponent, respectively. The equivalent stress intensity formula can be expressed as follows [52,53]:
where
and R is the stress ratio.
3. Numerical Results and Discussions
Modified Compact Tension Specimen (MCTS)
A comprehensive analysis was conducted on a set of five compact tension specimens subjected to constant amplitude fatigue loading. The primary research objective was to investigate the influence of altering the position of the third hole on the crack growth path and the fatigue performance of the specimens. The first specimen was designated as the standard reference, providing a baseline for comparison. Meanwhile, the remaining four specimens were meticulously modified to systematically vary the position of the third hole to simulate mixed-mode FCG, as shown in Figure 1. These modifications were carried out with the aim of elucidating the intricate relationship between hole position and the specimens’ fatigue characteristics. By carefully manipulating the position of the third hole, the researchers sought to uncover any discernible effects on crack initiation, propagation, and ultimately, the overall fatigue life of the specimens. This rigorous examination of hole positioning aimed to provide valuable insights into the structural integrity and durability of compact tension specimens under constant amplitude fatigue loading conditions. A compact tension specimen (CTS) typically exhibits pure mode I fatigue crack growth (FCG) conditions; however, introducing a hole can result in crack deflection and the emergence of mixed-mode conditions. The center coordinates of the third hole in Figure 1 were adjusted, thereby altering the dimensions of this specimen. The adjustment was made based on the vertical distance, denoted as C, and the horizontal distance, denoted as k, as indicated on the right side of Figure 1. The presence of a hole in the specimen can have two different effects on the crack path. It can either attract the crack path, acting as a sink hole, or deflect the crack path, acting as a miss hole. The specific properties of the material can be found in Table 1 for SAE 1020 steel. The specimen was subjected to a maximum load of 10 kN, and a stress ratio (R) of 0.1 was applied individually to each hole.
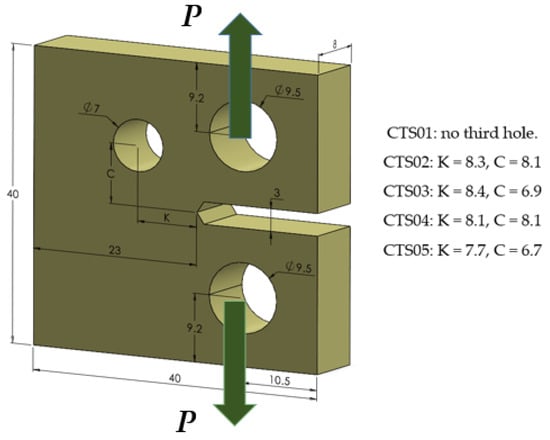
Figure 1.
Geometrical representation of the MCTS.

Table 1.
Mechanical properties of specimens.
The analytical solution for the standard compact tension specimen, as provided by [2,3], allows for the determination of the first mode stress intensity factor (SIF) for this particular geometry. The expression provided in the reference can be used to calculate the first mode of SIF, which can be expressed as follows:
where P is the load, B is the geometric thickness, W denotes the width, and is the normalized stress intensity factor, which is dependent on the ratio of crack length to specimen width (a/W).
It is expressed as follows:
where a represents the crack length.
The mesh generated for CTS01 and CTS02 is depicted in Figure 2, with an element size of 0.5 mm. It is important to mention that the same element size of 0.5 mm was used for the mesh generation of the other three specimens as well. In the case of CTS01, the total number of elements was 189,235, and the total number of nodes was 292,639. As for CTS02–CTS05, the total number of elements increased to 212,514, and the total number of nodes reached 320,154. Before crack growth occurs, the concept of the sphere of influence is often used in ANSYS simulations to determine the region around the crack tip that requires mesh refinement. The sphere of influence represents the zone where the stress field is significantly affected by the presence of the crack. ANSYS Smart Crack Growth further enhances the simulation by automatically adapting the mesh during crack growth. It selectively refines the mesh in critical areas, such as the crack front and vicinity of the crack tip, based on predefined criteria like stress intensity factors. These ANSYS techniques improve the accuracy of stress and displacement calculations, capturing the effects of stress concentration and deformation near the crack.
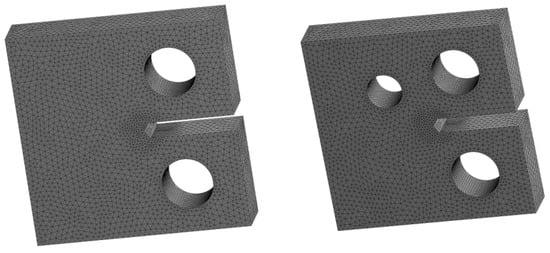
Figure 2.
Finite element generated meshes for CTS01 and CTS02.
Figure 3 shows the trajectory of crack propagation as determined through the numerical analysis conducted with ANSYS. The figure distinctly displays a straight crack trajectory, which is characteristic of pure mode I fracture mode. Moreover, the symmetric distribution of stresses and strains observed in the figure further confirms the consistent behavior of the crack growth in this mode.
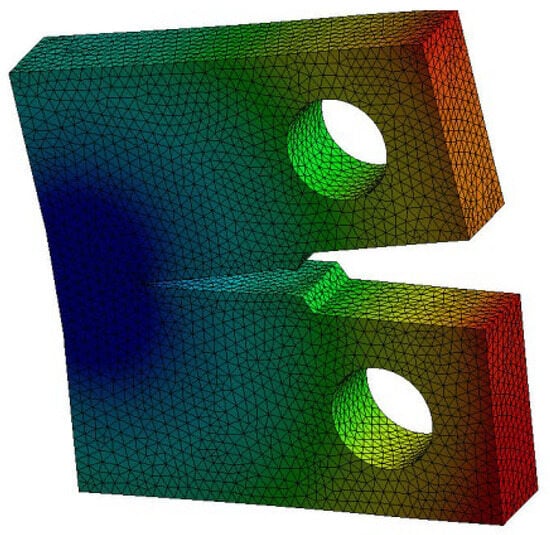
Figure 3.
Crack growth path for the standard CTS, CTS01.
Figure 4 shows a comparison between the computed results of the first mode of SIF and the analytical solution determined using Equation (2). The results demonstrate a substantial agreement between the two, indicating a high level of consistency.
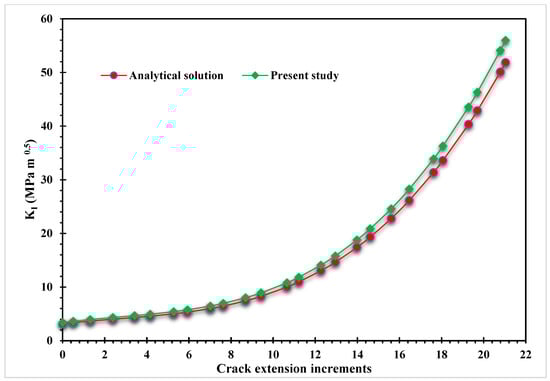
Figure 4.
First mode of SIF for CTS01.
Figure 5, Figure 6, Figure 7 and Figure 8 provide a comparative analysis of the current study’s results with experimental and numerical data obtained by other researchers. The present study results in Figure 5, Figure 7 and Figure 8 were compared to numerical data obtained from [54], numerical crack paths simulated using Dual boundary element software (Quebra2D) by Gomes and Miranda [32], and artificial neural network results obtained by Baptista et al. [31]. These figures illustrate the comparison between the different approaches for CT02, CT04, and CT05 cases; additionally, Figure 6 provides a comparative analysis of the estimated crack growth path in the present study, along with the experimental and numerical results using the extended finite element method by Lu et al. [55], and numerical results along with artificial neural network results obtained by Baptista et al. [31]. The depicted figures demonstrate the effectiveness of the modified CTS holes, which were intentionally designed to influence the direction of crack propagation. The predicted crack growth paths depicted in these figures demonstrate a close alignment with the experimental and numerical predictions. These findings indicate a strong correlation between the predicted crack growth paths and the observed behavior in both experimental and numerical analyses.
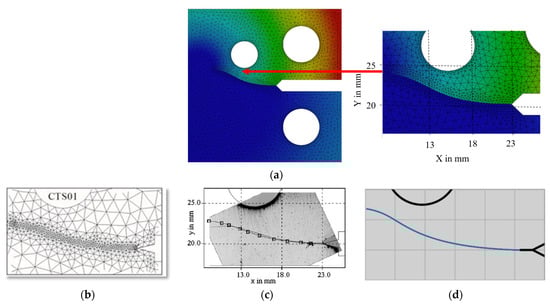
Figure 5.
Crack growth trajectory of CTS02: (a) present study, (b) experimental [54], (c) Quebra2D [32], and (d) artificial neural networks [31].
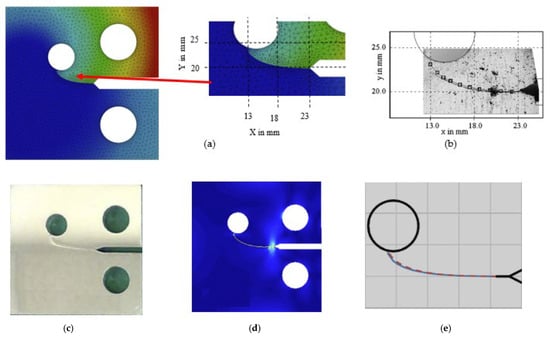
Figure 6.
Crack growth trajectory of CTS03: (a) present study, (b) experimental [54], (c) experimental [55], (d) XFEM [5], and (e) artificial neural networks [31].
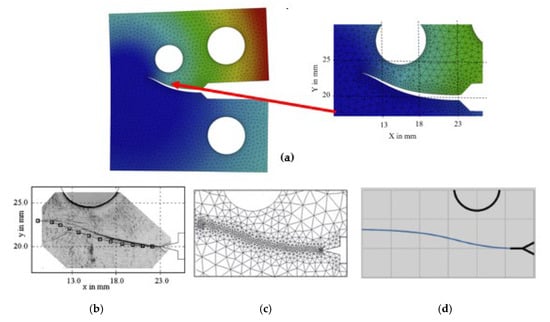
Figure 7.
Crack growth trajectory of CTS04: (a) present study, (b) experimental [54], (c) Quebra2D [32], and (d) artificial neural networks [31].
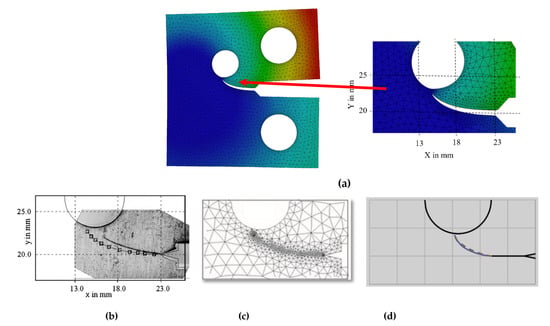
Figure 8.
Crack growth trajectory of CTS05: (a) present study, (b) experimental [54], (c) Quebra2D [32], and (d) artificial neural networks [31].
The results presented in Figure 9 depict the normalized stress intensity factor for specimens CTS02–CTS05. The data reveals that up to a crack length of 5 mm, specimens CTS02 and CTS04 exhibit similar values of the normalized SIF; however, beyond this threshold, CTS02 demonstrates a slightly higher value compared to CTS04. This discrepancy is evident in the observed shift in the crack growth direction behavior for these specific specimens. Furthermore, it is worth noting that the normalized stress intensity factor values for CTS05 are higher than those for CTS03. This disparity can be attributed to the fact that CTS05 is situated in closer proximity to the main hole. As a result, CTS05 experiences more significant stress concentrations, leading to elevated stress intensity factors compared to CTS03.
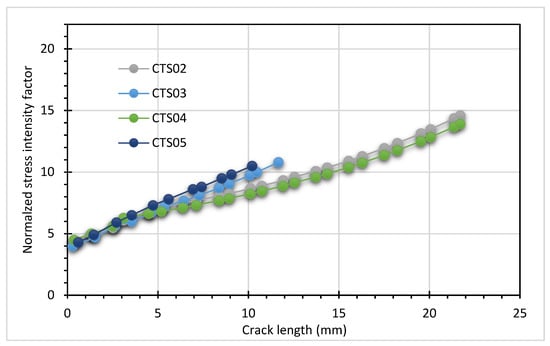
Figure 9.
Results for normalized SIFs for different configurations of the MCTS.
Figure 10 presents a comparison between the simulated fatigue life results obtained in the present study and the experimental results reported by Gomes and Miranda [32] for the four different MCTS geometries, namely CTS02, CTS03, CTS04, and CTS05. It is worth noting that the simulated fatigue crack growth (FCG) life, obtained using ANSYS, demonstrates an impressive level of agreement with the experimental results obtained by Gomes and Miranda in their study. This remarkable agreement can be observed in Figure 10, further validating the accuracy and reliability of the simulated FCG life predictions. The observed trend in the fatigue life cycles, as shown in Figure 10, provides further insights into the effects of hole position and crack growth behavior on the overall fatigue performance of the specimens. CTS05 exhibits the lowest number of cycles, indicating a significantly reduced fatigue life. The crack growth trajectory in CTS05 brings it in closer proximity to the hole, leading to accelerated crack propagation. As a result, the specimen experiences a higher stress concentration and is more prone to crack initiation and subsequent failure. The relatively shorter crack length of CTS05 further contributes to its lower fatigue life cycle, as the crack quickly propagates into the hole zone. With approximately 137,869 cycles, CTS05 demonstrates the most limited resistance to fatigue failure among the tested specimens. On the other hand, CTS04 performs better in terms of fatigue life compared to CTS05. It exhibits a higher number of cycles, approximately 240,000 cycles, before failure. While still influenced by the proximity to the hole, the crack growth trajectory for CTS04 allows for a slightly longer fatigue life. This suggests that the crack growth behavior and proximity to the hole have a less severe impact on fatigue life compared to CTS05. These findings highlight the critical role of hole position and crack growth behavior in determining the fatigue performance of the specimens. The results emphasize the need for careful consideration of geometric factors and crack propagation paths in structural designs to mitigate fatigue-related failures and ensure longer service life. The fatigue life cycle for CTS02 and CTS03 are approximately 342,000 and 345,000 cycles, respectively. This highlights the influence of hole position and crack growth behavior on the fatigue life cycle, with closer proximity to the hole resulting in a more rapid decrease in the number of cycles until failure.
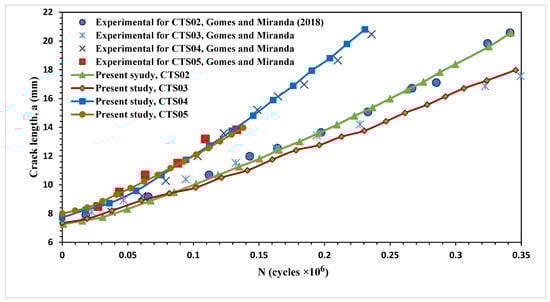
Figure 10.
Fatigue life cycle for different configurations of the MCTS, Experimental for CTS02–CTS05, Gomes and Miranda [32].
Figure 11 and Figure 12 depict the constant amplitude equivalent stress intensity factor ranges obtained numerically using ANSYS for two configurations of the MCTS: CTS02 and CTS05. The stress ratios considered range from 0.1 to 1, with a total of ten simulations conducted. The stress ratios chosen for the present study ranged from 0.1 to 0.9 to intentionally avoid extensive crack closure. By utilizing stress ratios within this range, the study aimed to examine fatigue crack propagation under conditions where crack closure is still possible but expected to be less significant compared to a stress ratio of 1. This approach was adopted to obtain more precise insights into the crack behavior and fatigue life of the materials being studied, free from the predominant influence of crack closure observed at a stress ratio of 1. The data provided in these figures are valuable in understanding the relationship between the stress ratio and the equivalent range of SIFs in FCG. The presented data shows that an increase in the stress ratio leads to a decrease in the equivalent range of SIFs. This observation implies that crack propagation under higher stress ratios requires less energy compared to lower stress ratios to facilitate FCG. A thorough understanding of the relationship between stress ratio and stress intensity factors (SIFs) enables engineers to optimize the design and enhance the durability of structures, leading to improved performance and increased durability.
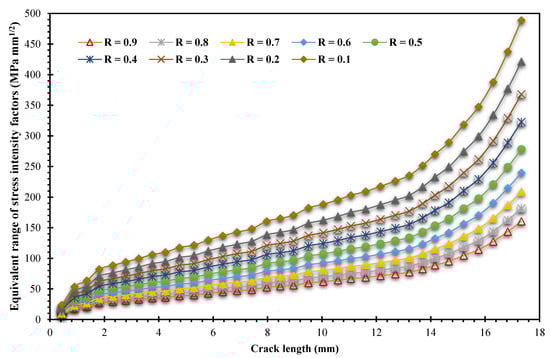
Figure 11.
Equivalent range of stress intensity factors for CTS02.
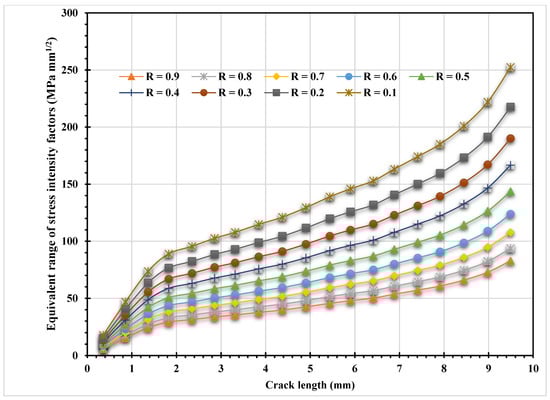
Figure 12.
Equivalent range of stress intensity factors for CTS05.
Fatigue failure poses a significant concern in engineering applications exposed to fatigue loading. A comprehensive understanding of the relationship between stress ratios and fatigue life cycles is crucial when designing reliable and durable components. The stress ratio significantly influences fatigue life cycles. This study focuses on the impact of varying stress ratios, ranging from 0.1 to 0.9 with a step of 0.1, on the fatigue life cycles of materials. By examining the effects of stress ratio variation, engineers can make informed decisions to enhance the reliability and longevity of various structures. By systematically varying the stress ratio from 0.1 to 0.9 with a step of 0.1, valuable insights can be gained into the changes in fatigue life cycles. As shown in Figure 13 and Figure 14 for CTS02 and CTS05, as the stress ratio increases from 0.5 to 0.9, there is a corresponding increase in the fatigue life cycles of the material. This indicates that higher stress ratios, such as R > 0.5, contribute to improved durability and a longer fatigue life under cyclic loading. The underlying mechanism driving this trend lies in the presence of compressive stress cycles. With higher stress ratios, there is a greater proportion of compressive stress cycles, which effectively mitigate the detrimental effects of tensile stress cycles. Compressive stresses retard crack initiation and slow down crack growth, thereby extending the fatigue life of the material. Consequently, increasing the stress ratio within this range enhances the material’s resistance to fatigue failure, necessitating a larger number of stress cycles to induce failure. In contrast, when the stress ratio is relatively low, such as R < 0.5, the minimum cyclic stress is significantly lower than the maximum cyclic stress. This results in tensile stress conditions dominating the load cycle. Under these conditions, crack growth is accelerated, and the fatigue life cycles are typically shorter compared to higher stress ratios. Understanding the relationship between stress ratios and fatigue life cycles holds significant implications for engineering design. Designers can optimize the fatigue performance and durability of structures by considering different stress ratios.
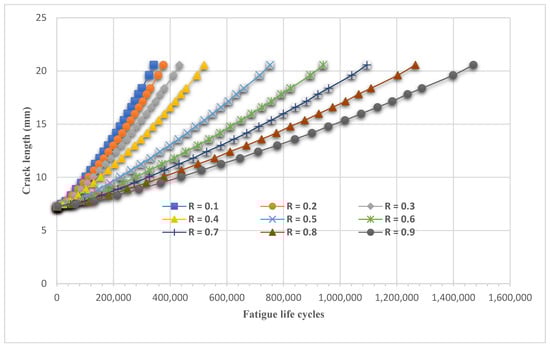
Figure 13.
Fatigue life cycles for CTS02 under different stress ratios.
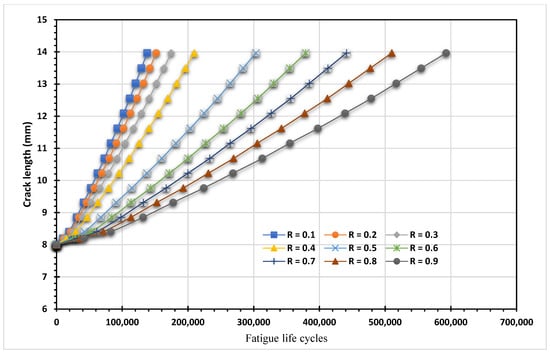
Figure 14.
Fatigue life cycles for CTS05 under different stress ratios.
Figure 15 illustrates the X-directional deformation for CTS02–CTS05. The presence of directional deformation in this axis can significantly affect the behavior of crack growth under cyclic loading. When subjected to alternating stress levels, cracks have the potential to initiate and propagate. Higher levels of deformation in the X-direction intensify stress at crack tips, accelerating the crack growth rate. Factors such as stress concentration, material properties, and the presence of stress corrosion factors in the environment further influence the rate of crack propagation. Therefore, precise control and management of X-directional deformation become imperative to minimize crack growth and extend the fatigue life of components. The number of cycles to failure exhibits an inverse relationship with the level of X-directional deformation. Generally, higher deformation levels tend to reduce the number of cycles required for failure due to fatigue. As deformation increases, damage accumulation and crack growth progress more rapidly, consequently resulting in a shorter fatigue life.
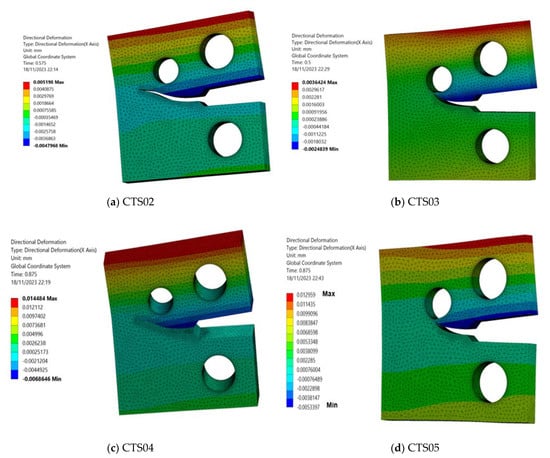
Figure 15.
X-directional deformation for CTS02–CTS05.
On the other hand, lower levels of deformation correspond to a longer number of cycles to failure, indicating improved resistance to fatigue. Based on the X-directional deformation values depicted in Figure 15, it can be observed that CTS03 exhibits the lowest value, followed by CTS02, CTS05, and CTS04, respectively. This ordering of deformation values is inversely proportional to the fatigue life cycles, suggesting that components experiencing lower levels of deformation are likely to have longer fatigue life cycles observed for these specimens. Finally, ANSYS SMART crack growth has certain limitations, such as its ability to simulate fatigue crack growth only for materials that follow linear-elastic fracture mechanics. Additionally, its effective use requires significant expertise and experience, which may limit its accessibility to certain users.
4. Conclusions
Using ANSYS Workbench, this study delved into the influence of both the hole position relative to the crack tip and stress ratios on fatigue crack propagation. The analysis concentrated on evaluating fatigue life cycles and the equivalent range of stress intensity factors in a modified compact tension specimen, considering a range of stress ratios.
The investigation presented in this study led to the following significant conclusions:
- The presence of a hole in the geometry has a direct influence on the crack, causing it to adjust its path in relation to the hole’s location. Consequently, the crack may either change its direction and propagate into the hole, or it might be momentarily diverted by the hole before continuing to grow until it moves away from the hole;
- As the stress ratio increased, there was a corresponding decrease in the equivalent range of stress intensity factors;
- Through varying the stress ratios from 0.1 to 0.9 with a step of 0.1, this study examined the influence of different loading conditions on the fatigue life cycles of materials. It was observed that reducing the stress ratio resulted in a decrease in fatigue life, indicating a shorter lifespan for materials subjected to cyclic loading;
- By carefully incorporating stress ratios into both design and operational practices, it becomes possible to optimize fatigue performance and extend the lifespan of materials. The interplay between stress ratios and fatigue life cycles stands out as a vital consideration in engineering design;
- The number of cycles to failure exhibits an inverse relationship with the level of X-directional deformation. This highlights the importance of managing and minimizing deformations to enhance fatigue resistance and longevity of components and structures.
Funding
The author extends his appreciation to the Deputyship for Research and Innovation, Ministry of Education in Saudi Arabia for funding this research work through the project number ISP-2024.
Institutional Review Board Statement
Not applicable.
Informed Consent Statement
Not applicable.
Data Availability Statement
All relevant data are contained in the present manuscript.
Conflicts of Interest
The author declares no conflict of interest.
References
- Halford, G.R. Fatigue and Durability of Structural Materials; ASM International: New York, NY, USA, 2006. [Google Scholar]
- Anderson, T.L. Fracture Mechanics: Fundamentals and Applications; CRC Press: Boca Raton, FL, USA, 2017. [Google Scholar]
- Schijve, J. Fatigue of Structures and Materials; Springer: Berlin/Heidelberg, Germany, 2009. [Google Scholar]
- Iranpour, M.; Taheri, F. On the effect of stress intensity factor in evaluating the fatigue crack growth rate of aluminum alloy under the influence of compressive stress cycles. Int. J. Fatigue 2012, 43, 1–11. [Google Scholar] [CrossRef]
- Li, H.; Yang, S.; Zhang, P.; Liu, Y.; Wang, B.; Zhang, Z. Material-independent stress ratio effect on the fatigue crack growth behavior. Eng. Fract. Mech. 2022, 259, 108116. [Google Scholar] [CrossRef]
- White, P.; Barter, S.; Medhekar, N. Comparison of fatigue crack growth stress ratio effects under simple variable amplitude loading using fractographic and strain measurements. Int. J. Fatigue 2018, 112, 240–252. [Google Scholar] [CrossRef]
- Sun, C.; Lei, Z.; Hong, Y. Effects of stress ratio on crack growth rate and fatigue strength for high cycle and very-high-cycle fatigue of metallic materials. Mech. Mater. 2014, 69, 227–236. [Google Scholar] [CrossRef]
- Mansor, N.; Abdullah, S.; Ariffin, A. Effect of loading sequences on fatigue crack growth and crack closure in API X65 steel. Mar. Struct. 2019, 65, 181–196. [Google Scholar] [CrossRef]
- Stewart, A.T. The influence of environment and stress ratio on fatigue crack growth at near threshold stress intensities in low-alloy steels. Eng. Fract. Mech. 1980, 13, 463–478. [Google Scholar] [CrossRef]
- Hudson, C.M. Effect of Stress Ratio on Fatigue-Crack Growth in 7075-T6 and 2024-T3 Aluminum-Alloy Specimens; National Aeronautics and Space Administration: Washington, DC, USA, 1969.
- Noroozi, A.; Glinka, G.; Lambert, S. A study of the stress ratio effects on fatigue crack growth using the unified two-parameter fatigue crack growth driving force. Int. J. Fatigue 2007, 29, 1616–1633. [Google Scholar] [CrossRef]
- Sadananda, K.; Vasudevan, A. Fatigue crack growth behavior of titanium alloys. Int. J. Fatigue 2005, 27, 1255–1266. [Google Scholar] [CrossRef]
- Newman, J. Stress-Intensity Factor Equations for Cracks in Three-Dimensional Finite Bodies Subjected to Tension and Bending Loads; Langley Research Center, National Aeronautics and Space Administration: Washington, DC, USA, 1984; Volume 85793.
- Broek, D. Elementary Engineering Fracture Mechanics; Springer: Berlin/Heidelberg, Germany, 2012. [Google Scholar]
- Pook, L.P. Linear Elastic Fracture Mechanics for Engineers: Theory and Applications; WIT Press: Billerica MA, USA, 2000. [Google Scholar]
- Alshoaibi, A.M.; Fageehi, Y.A. A Robust Adaptive Mesh Generation Algorithm: A Solution for Simulating 2D Crack Growth Problems. Materials 2023, 16, 6481. [Google Scholar] [CrossRef]
- Wang, C.; Pereira, K.; Wang, D.; Zinovev, A.; Terentyev, D.; Wahab, M.A. Fretting fatigue crack propagation under out-of-phase loading conditions using extended maximum tangential stress criterion. Tribol. Int. 2023, 187, 108738. [Google Scholar] [CrossRef]
- Wang, C.; Fan, K.; Li, C.; Wahab, M.A. Prediction of the effect of shot peening residual stress on fretting fatigue behaviour. Int. J. Fatigue 2023, 176, 107909. [Google Scholar] [CrossRef]
- Huynh, H.D.; Nguyen, M.N.; Cusatis, G.; Tanaka, S.; Bui, T.Q. A polygonal XFEM with new numerical integration for linear elastic fracture mechanics. Eng. Fract. Mech. 2019, 213, 241–263. [Google Scholar] [CrossRef]
- Surendran, M.; Natarajan, S.; Palani, G.; Bordas, S.P. Linear smoothed extended finite element method for fatigue crack growth simulations. Eng. Fract. Mech. 2019, 206, 551–564. [Google Scholar] [CrossRef]
- Rozumek, D.; Marciniak, Z.; Lesiuk, G.; Correia, J. Mixed mode I/II/III fatigue crack growth in S355 steel. Procedia Struct. Integr. 2017, 5, 896–903. [Google Scholar] [CrossRef]
- Belytschko, T.; Black, T. Elastic crack growth in finite elements with minimal remeshing. Int. J. Numer. Methods Eng. 1999, 45, 601–620. [Google Scholar] [CrossRef]
- Chin, F.Y.; Shaari, M.S.; Takahashi, A.; Akramin, M.R.M.; Urai, S. Fatigue Crack Growth Behavior of AlSi10Mg Material Produced by Direct Metal Laser Sintering Using S-Version Finite Element Method. J. Fail. Anal. Prev. 2023, 23, 601–608. [Google Scholar] [CrossRef]
- Akramin, M.R.M.; Ariffin, A.K.; Alshoaibi, A.; Hadi, M.S.A.; Huzni, S.; Mohamed, N.A.N. Probabilistic Finite Element for Fracture Mechanics. HKIE Trans. 2008, 15, 1–8. [Google Scholar] [CrossRef]
- Alshoaibi, A.M.; Fageehi, Y.A. 2D finite element simulation of mixed mode fatigue crack propagation for CTS specimen. J. Mater. Res. Technol. 2020, 9, 7850–7861. [Google Scholar] [CrossRef]
- Li, X.; Li, H.; Liu, L.; Liu, Y.; Ju, M.; Zhao, J. Investigating the crack initiation and propagation mechanism in brittle rocks using grain-based finite-discrete element method. Int. J. Rock Mech. Min. Sci. 2020, 127, 104219. [Google Scholar] [CrossRef]
- Leclerc, W.; Haddad, H.; Guessasma, M. On the suitability of a Discrete Element Method to simulate cracks initiation and propagation in heterogeneous media. Int. J. Solids Struct. 2017, 108, 98–114. [Google Scholar] [CrossRef]
- Shao, Y.; Duan, Q.; Qiu, S. Adaptive consistent element-free Galerkin method for phase-field model of brittle fracture. Comput. Mech. 2019, 64, 741–767. [Google Scholar] [CrossRef]
- Yuan, H.; Yu, T.; Bui, T.Q. Multi-patch local mesh refinement XIGA based on LR NURBS and Nitsche’s method for crack growth in complex cracked plates. Eng. Fract. Mech. 2021, 250, 107780. [Google Scholar] [CrossRef]
- Nejad, R.M.; Liu, Z. Analysis of fatigue crack growth under mixed-mode loading conditions for a pearlitic Grade 900A steel used in railway applications. Eng. Fract. Mech. 2021, 247, 107672. [Google Scholar] [CrossRef]
- Baptista, R.; Moita, P.; Infante, V. Fatigue crack growth on modified CT specimens using artificial neural networks. Int. J. Fatigue 2023, 167, 107357. [Google Scholar] [CrossRef]
- Gomes, G.; Miranda, A.C. Analysis of crack growth problems using the object-oriented program bemcracker2D. Frat. Ed. Integrità Strutt. 2018, 12, 67–85. [Google Scholar] [CrossRef]
- ANSYS. Academic Research Mechanical, Release 19.2, Help System. In Coupled Field Analysis Guide; ANSYS, Inc.: Canonsburg, PA, USA, 2020. [Google Scholar]
- Lee, H.-H. Finite Element Simulations with ANSYS Workbench 2021: Theory, Applications, Case Studies; SDC Publications: Mission, KS, USA, 2021. [Google Scholar]
- Alshoaibi, A.M. Computational Simulation of 3D Fatigue Crack Growth under Mixed-Mode Loading. Appl. Sci. 2021, 11, 5953. [Google Scholar] [CrossRef]
- Alshoaibi, A.M.; Fageehi, Y.A. 3D modelling of fatigue crack growth and life predictions using ANSYS. Ain Shams Eng. J. 2022, 13, 101636. [Google Scholar] [CrossRef]
- Alshoaibi, A.M. Numerical Modeling of Crack Growth under Mixed-Mode Loading. Appl. Sci. 2021, 11, 2975. [Google Scholar] [CrossRef]
- Fageehi, Y.A.; Alshoaibi, A.M. Numerical Simulation of Mixed-Mode Fatigue Crack Growth for Compact Tension Shear Specimen. Adv. Mater. Sci. Eng. 2020, 2020, 5426831. [Google Scholar] [CrossRef]
- Bashiri, A.H. 2D and 3D numerical simulation of fatigue crack growth path and life predictions of a linear elastic. Mater. Sci. 2021, 39, 285–297. [Google Scholar] [CrossRef]
- Mousa, S.; Mutnbak, M.; Saba, A.-A.M.; Abd-Elhady, A.A.; Sallam, H.E.-D.M. Numerical study and experimental validation of the size effect of smooth and mode I cracked semi-circular bend specimens. Sci. Rep. 2023, 13, 757. [Google Scholar] [CrossRef] [PubMed]
- Mousa, S.; Mutnbak, M.; Abd-Elhady, A.A.; Sallam, H.E.-D.M.; Reda, R.M. The efficiency of advanced polymeric composite sleeves in the rehabilitation of cracked pipelines under combined loadings. J. Mater. Res. Technol. 2023, 25, 6395–6406. [Google Scholar] [CrossRef]
- Carter, B.; Wawrzynek, P.; Ingraffea, A. Automated 3-D crack growth simulation. Int. J. Numer. Methods Eng. 2000, 47, 229–253. [Google Scholar] [CrossRef]
- Hou, J.; Wescott, R.; Attia, M. Prediction of fatigue crack propagation lives of turbine discs with forging-induced initial cracks. Eng. Fract. Mech. 2014, 131, 406–418. [Google Scholar] [CrossRef]
- Jafari, A.; Broumand, P.; Vahab, M.; Khalili, N. An eXtended Finite Element Method implementation in COMSOL Multiphysics: Solid Mechanics. Finite Elements Anal. Des. 2022, 202, 103707. [Google Scholar] [CrossRef]
- Giannella, V.; Sepe, R.; De Michele, G.; Esposito, R. Deterministic fatigue crack-growth simulations for a railway axle by Dual Boundary Element Method. Proc. IOP Conf. Ser. Mater. Sci. Eng. 2021, 1038, 012080. [Google Scholar] [CrossRef]
- Fajdiga, G.; Sraml, M. Fatigue crack initiation and propagation under cyclic contact loading. Eng. Fract. Mech. 2009, 76, 1320–1335. [Google Scholar] [CrossRef]
- Hopper, C.; Miller, K. Fatigue crack propagation in biaxial stress fields. J. Strain Anal. Eng. Des 1977, 12, 23–28. [Google Scholar] [CrossRef]
- Williams, J.G.; Ewing, P.D. Fracture under complex stress? The angled crack problem. Int. J. Fract. 1984, 26, 346–351. [Google Scholar] [CrossRef]
- Qian, J.; Fatemi, A. Mixed mode fatigue crack growth: A literature survey. Eng. Fract. Mech. 1996, 55, 969–990. [Google Scholar] [CrossRef]
- Richard, H.A.; Fulland, M.; Sander, M. Theoretical crack path prediction. Fatigue Fract. Eng. Mater. Struct. 2005, 28, 3–12. [Google Scholar] [CrossRef]
- Tanaka, K. Fatigue crack propagation from a crack inclined to the cyclic tensile axis. Eng. Fract. Mech. 1974, 6, 493–507. [Google Scholar] [CrossRef]
- Xiangqiao, Y.; Shanyi, D.; Zehua, Z. Mixed-mode fatigue crack growth prediction in biaxially stretched sheets. Eng. Fract. Mech. 1992, 43, 471–475. [Google Scholar] [CrossRef]
- Bjørheim, F. Practical Comparison of Crack Meshing in ANSYS Mechanical APDL 19.2; University of Stavanger: Stavanger, Norway, 2019. [Google Scholar]
- Miranda, A.; Meggiolaro, M.; Castro, J.; Martha, L.; Bittencourt, T. Fatigue life and crack path predictions in generic 2D structural components. Eng. Fract. Mech. 2003, 70, 1259–1279. [Google Scholar] [CrossRef]
- Lu, Z.; Xu, J.; Wang, L.; Zhang, J.; Liu, Y. Curvilinear Fatigue Crack Growth Simulation and Validation under Constant Amplitude and Overload Loadings. J. Aerosp. Eng. 2015, 28, 04014054. [Google Scholar] [CrossRef]
Disclaimer/Publisher’s Note: The statements, opinions and data contained in all publications are solely those of the individual author(s) and contributor(s) and not of MDPI and/or the editor(s). MDPI and/or the editor(s) disclaim responsibility for any injury to people or property resulting from any ideas, methods, instructions or products referred to in the content. |
© 2023 by the author. Licensee MDPI, Basel, Switzerland. This article is an open access article distributed under the terms and conditions of the Creative Commons Attribution (CC BY) license (https://creativecommons.org/licenses/by/4.0/).