Abstract
This paper considers a thermal accumulator using phase transition materials as a way to increase the energy efficiency and maneuverability of nuclear power plants. A low-power nuclear power plant is the object of this study. Such nuclear power plants have a great potential for widespread implementation as sources of thermal and electrical energy for facilities of mineral and raw material as well as fuel and energy complexes located in distant regions. The main principles of development of low-power nuclear power plants are revealed. So, in the development of low-power nuclear power plants, experience in the creation and operation of shipboard nuclear power installations is widely used. The problems of NPP operation in daily maneuvering modes within an isolated power system are revealed. A method for improving the energy efficiency and maneuverability of nuclear power plants is proposed, in particular, through the use of thermal accumulators with a phase change material directly in the NPP circuit. A method of assessment of the dimensions of the heat accumulator and the amount of heat accumulating material is presented. A method of assessment of the efficiency of the accumulator application scheme is presented. The thermal scheme of a promising low-power nuclear power plant with an RITM-200 reactor is compiled. A scheme for switching on a heat accumulator with a phase change material to a scheme for regenerative heating of a turbine is proposed. The heat storage material selection is made, the main elements and characteristics of such an accumulator are determined, and the parameters of the heat transfer fluid’s movement through the accumulator are determined. A mathematical model of the heat exchange in an accumulator based on the finite difference method is compiled, and the simulation results are presented. The results of the experimental verification of the model are presented. As a result of the calculation of NPPs’ thermal schemes in the standard version and the version with a heat accumulator, the power increase in the turbine plant due to the application of accumulated heat in the accumulator discharge mode is determined.
1. Introduction
The development of fuel and energy as well as mineral and raw materials complexes facilities in the Arctic zone of the Russian Federation [1,2], eastern Siberia [3,4,5], and the Far East [6,7] has great potential and strategic importance for Russia. In these facilities, a wide variety of mineral, raw materials, and fuel resources are mined, such as hydrocarbons, minerals, precious and rare metals, etc. [8,9,10]. The development of these facilities should be based on the principles of sustainable development [11,12], which should provide indicators of energy supply such as environmental friendliness, reliability, safety, and efficiency [13,14,15].
Energy consumers of such objects, in combination with connected networks and power supply sources, are isolated energy systems [16]. In such energy systems, a very actual problem is the balance of generated and consumed electric power in the conditions of uneven daily schedules of electricity consumption [16,17]. The problem of the balance between generated and consumed power in the power system is the need to maintain equality in generated and consumed power in the power system at every moment (taking into account losses in the networks). Ignoring this creates significant risks for the operation of the power system [18].
There are several ways to solve the problem of power balance in the power system: flexibility of power supply sources, application of network energy storage devices, demand response, and expansion of the power system (inclusion of several time zones and various consumers in the power system) [19,20,21]. Each of these methods is characterized by advantages and disadvantages. There is no one universal solution to the problem of the balance between generated and consumed power in the power system.
Demand response for industrial enterprises has a wide potential [22]. However, today, industrial consumers have little interest in participating in demand response. This is due to the technical risks of disrupting the production process, costs, and low savings from stimulating demand management [19].
The expansion of a distant power system seems to be hardly possible in conditions of geographical distances from other large energy facilities and power systems [20]. At least, if the goal is to manage load schedules in the power system, the investment in such a solution is unreasonably high.
The application of network energy storage devices is a promising, actively developing direction. It has many achievements and implementations. At the same time, the application of network energy storage devices also has several disadvantages and limitations: (1) electro-chemical accumulators: the problem of utilization [23], and cost; (2) pumped storage power plants: problems related to building (flooding of territories, capital investments) [23,24]; (3) low efficiency, limited capabilities, or low availability of technology—hydrogen storage technologies, condenser batteries, mechanical accumulators, compressed air storage, gravity storage, etc., [23,25,26].
The use of maneuverable capabilities of energy sources in power systems is most widespread today [27,28]. So, today in the Russian energy system, traditional fossil fuel power plants fulfill most of the requirements for regulating the frequency of current and power, and most of these power plants operate in semi-peak mode [29]. The obvious advantage of this method is the simplicity of the organization in comparison with other methods (central regulation, in which one or some sources adapt to the needs of the power system due to technical maneuvering capabilities). This method is limited by the technical capabilities of maneuvering the power plant [30]. In addition, the operation of most conventional power plants in maneuverable modes is associated with a decrease in the capacity factor, increased wear, reduced efficiency, and increased risks of premature equipment failure [31]. If renewable energy sources are used as a power supply source, load regulation is not possible in principle due to dependence on weather conditions [32].
One of the most promising and actively developing areas in the energy supply of mineral and raw materials objects as well as fuel and energy complexes in isolated energy systems is stationary low-power nuclear power plants (NPP) [33,34]. This direction of energy supply for remote consumers has several advantages—long fuel overload cycles, a large amount of energy per fuel unit, efficient cogeneration of heat and electricity, and zero CO2 and CO emissions [35,36]. In the future, small-power NPPs may become a serious alternative to diesel piston and gas turbine power plants in isolated power systems [35].
Leading countries of the world are developing low-power reactors: water–water reactors (PWR), fast-neutron reactors, and gas-cooled reactors [33]. Water-to-water reactors are currently the most common and technically mature technology in this industry. In Russia, this direction of nuclear energy development is based on the experience of creating and operating shipboard nuclear power installations, such as RITM–200 and KLT–40 of the PWR type [14,37,38]. The floating NPP on the icebreaker “Akademik Lomonosov” is operated in Russia, in the city of Pevek, with two nuclear reactors (KLT-40S) and an installed capacity of 70 MW [39]. A ground-based low-power nuclear power plant with two RITM-200 reactors is now being studied as part of a rough makeup design [40]. One of the trends in the development of stationary low-power NPPs is an increase in the initial parameters of working fluid [33]. So, a low-power NPP based on the RITM 200 reactor will operate on an overheated steam. Each RITM-200 reactor has a built-in steam generator, which can be thermally connected to one or more turbo-generating units [41]. Slightly superheated steam is supplied to the turbine [41]. The turbine is a single-cylinder assembly with intermediate steam separation and consists of oppositely directed high- and low-pressure parts [37]. The regeneration system of a steam turbine plant has low-pressure heaters, a deaerator, and high-pressure heaters [37]. The planned fresh steam pressure is 3.5 MPa, and the temperature is 295 °C [37]. Thus, conceptually, a stationary low-power NPP is a two-circuit NPP with a water–water reactor on light water, a steam generator, and a steam turbine with a regenerative system. In general, this is very similar to a stationary nuclear power plant of high power (for example, with VVER-1200 reactors). The differences are in scale, another reactor design (ship reactor), the presence of steam overheating (turbines of Russian stationary nuclear power plants operate on wet steam), and reduced fresh steam pressure (3.5 MPa at low-power NPPs vs. 7 MPa at high-power nuclear power plants).
The nuclear power plants used as a source of electricity exacerbate the problem of balancing the generated and consumed power in the energy system. The reason for this is the low maneuverability of nuclear power plants, which is related to the safety issues of nuclear power plant operation due to the principles of operating nuclear reactors and restrictions [34,42,43]. Traditionally, nuclear power plants are not considered as a maneuverable source of energy supply [23,44]. So, a nuclear power plant has several restrictions on the number and power changes in cycle speed. NPP operation in a maneuver mode with fast increases and decreases in power does not provide 100% operational safety [34,44]. The maneuverable modes of operation of NPPs hurt the operation of the equipment in the reactor core [29]; this risks damage to fuel rods, damage to control rods, and uneven fuel burnout. Working in such modes, the effective duration of operation for a nuclear reactor without fuel overload decreases, and the amount of liquid radioactive waste increases [42]. However, higher requirements are imposed on small-power nuclear power plants compared to large nuclear power plants. So, to achieve development in isolated power systems, NPPs of low power should be characterized by the following: the maximum effective duration of operation for the nuclear reactor without fuel overload, increased maneuverability and safety, and the absence or a low amount of radioactive waste [33].
Thus, the low maneuverability of nuclear power plants is an obstacle to the widespread integration of nuclear power plants in isolated power systems. One of the ways to increase the maneuverability and safety of NPPs, and reduce the amount of radioactive waste and the negative impact of maneuvering modes on the core elements, is by using heat accumulators in NPP circuits [21,34,45]. The application of a heat accumulator allows for one to store excess reactor heat and then use this heat to generate electricity during hours of increased demand [36,46,47].
Considering the regions of the Far North, it is impossible not to discuss regional features. So, the extreme conditions of the Arctic do not create direct problems for the operation of the main equipment of the NPP. So, the NPP equipment is reliably protected from environmental influences by the shells of buildings [37]. Therefore, the impact of extreme conditions on the operation of storage equipment is not considered in this article. The main regional feature is the work in an isolated power system.
One of the actively developing and promising areas in the field of heat storage is heat accumulators with phase change material (PCM) [48]. Such accumulators are characterized by a high density of stored energy and a stable temperature operating mode during charge and discharge [48]. The peculiarity of such accumulators is the use of latent melting–solidification heat, which ensures the storage of a large amount of heat without significant volume changes [49]. Such accumulators are applied in solar energy [50], electronics [51], building [52], and heat supply [53].
PCMs are classified into three categories based on their chemical: organic (low temperature), salts (medium temperature), and inorganic (high temperature) [54]. The main factor in choosing a PCM is the temperature regime of the system in which the accumulator is planned to be used. Among those suitable for the melting point of the PCM, the most optimal is chosen based on the following: chemical compatibility of the container materials, stable physical properties, higher density, higher heat of melting, thermal conductivity, and heat capacity. The design of the accumulator is determined by the required heat exchange power and the parameters of the hot and cold heat transfer fluids. In general, there are two types of approaches to improving thermal performance, namely, extending the heating surfaces or modifying phase change materials [55]. Heat accumulators with a PCM are generally divided into two categories: capsule and shell-and-tube [56,57]. At the same time, when it comes to high-power accumulators (industrial applications), shell-and-tube accumulators are more often mentioned [58,59,60]. It is known that several pilot installations use heat accumulators with a PCM for industrial use with a capacity of up to 1.6 MW [61,62,63]. These installations are used for heating heat transfer fluids, including steam generation, and, in general, much is said about the operability of this technology. Thus, this direction of heat storage is actively developing. So, it is fair to reason and evaluate the options for using thermal accumulators with a PCM with a capacity of about several MW in various industries, including nuclear power plants.
In this paper, we exactly consider accumulators with a PCM for application in NPPs.
As for the method of determining the design of t heat accumulator, there is no simple universal technique. Due to the unsteadiness of the heat exchange processes occurring in such accumulators, the variety of designs, sizes and heat storage materials, each application is unique and should be considered separately. Simulation based on the finite difference method has become widespread to simulate the heat exchange process in accumulators with a PCM [64]. It is noted that it is necessary to divide the computational domain—the volume of a PCM into the required number of cells to achieve a numerical solution of the system of differential equations, which does not change with an increase in the number of cells and is confirmed by experimental studies [64]. In addition, it is necessary to make sure that the adopted separation does not have a significant error in terms of the temperature of the heat transfer fluid. So, if the average temperature of the heat transfer fluid along the length of one tube is approximated by the arithmetic mean of the temperatures at the inlet and outlet of the tube, this can lead to significant errors with significant lengths in the heat exchange surface [65]. Due to heat exchange by thermal conductivity and convection, it is necessary to adequately take into account the effect of convection in the area of liquid PCM [50,66].
At the same time, simulation of the finite difference method requires significant computing power; therefore, a sufficiently simple and accurate model is necessary for practical application [50].
Thus, to assess the effectiveness of projects for the application of heat accumulators in NPPs, it is necessary to determine a method for calculating the approximate size of the accumulator, its design, the amount of PCM, and the dynamics of heat exchange power and heat transfer fluid parameters during accumulator operation. The development of this method is the main goal of this work.
2. Materials and Methods
2.1. Development of a Thermal Scheme of a Low-Power Nuclear Power Plant with a Thermal Accumulator
The first stage of this work is the development of a thermal scheme of a low-power NPP and the inclusion of a heat accumulator with a phase transition in it. Subsequently, the thermal calculation of this scheme in the standard version and the version with a heat accumulator is used to determine the amount of electricity that can be generated by accumulated heat.
Since the basis of the low-power NPP’s creation is an experience of creating shipboard nuclear units, such as RITM–200 and KLT–40, it is advisable to use the characteristics of these units as prototypes for drawing up and calculating the thermal scheme of a low-power NPP. Steam turbine units operate in power units with such nuclear units. Turbine unit named “K–35/38–3.4” is applied on the shipboard power plant “Akademik Lo-monosov” in a power unit with a KLT–40S reactor. This turbine unit is applied in high-speed reduction units (HSRU) to dump steam into the condenser, bypassing the turbine. Similar devices are also applied in the schemes of turbines of stationary nuclear power plants [44]. These systems operate during a period of rapidly reduced load in the power system. It is expected that similar devices for dumping excess steam will be applied at low-power nuclear power plants.
The main technical characteristics of the RITM–200 were used to develop a thermal scheme of a low-power NPP in this work. As a prototype of the thermal scheme small power NPP, the scheme of the TK–35/38–3.4 turbine plant was used. It has a deaerator, two low-pressure heaters (LPH), and two high-pressure heaters (HPH). The main nominal technical characteristics of the RITM–200 are presented in Table 1.

Table 1.
Nominal technical characteristics of the RITM-200 [37].
Several works [67,68,69] contain proposals for including heat accumulators in the NPP scheme. As a result of the analysis of these works, it was revealed that the most effective and simple way to apply a heat accumulator is to include the accumulator in the regenerative heating circuit in parallel with HPH1. In this paper, we consider this scheme. The scheme that is described is shown in Figure 1. According to this scheme, the accumulator was applied to heat the feed water (in the process of discharge of the accumulator). To charge the accumulator, one is suggested to apply excess waste steam from high-speed reduction units.
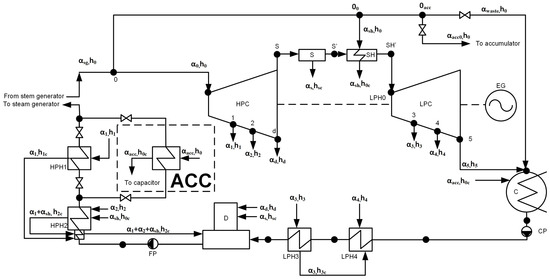
Figure 1.
The thermal scheme of a low-power nuclear power plant with a heat accumulator. HPC—high-pressure cylinder, LPC—low-pressure cylinder, ACC—heat accumulator; D—deaerator, HPH—high-pressure heat-er; LPH—low-pressure heater; S—separator; SH—superheater; C—condenser; FP—feed pump; CP—condensate pump; EG—electric generator; h is the enthalpy; α is the proportion of the flow rate (from the steam flow rate from the steam generator); indices: 0—live steam; sg—steam generator; 1—on HPH 1; 2—on HPH 2; d—to the deaerator; 3—on LPH 3; 4—on LPH 4, 5—to condenser; s—from the separator; sh—to/from superheater; c—condensate; acc—to the heat accumulator, waste—waste steam.
When working according to the presented scheme, the power of the turbine plant might be increased in the process of accumulator discharge without changing the reactor power. If it is necessary to sharply increase the power of the turbine plant (during a period of increased demand for electricity in the power system), the regenerative bleed-off 1 at HPH1 is shut down, and due to this the power generated by the turbine increases. In this process, the heat accumulator temporarily replaces the HPH1 to heat the feed water.
A heat accumulator was selected (designed) in such a way that the accumulator outlet temperature was equal (at least) to the nominal temperature of the feed water at the outlet of HPH1 during the entire shutdown time of the regenerative bleed-off to HPH1.
The calculation of the thermal scheme for calculating the power generated by the turbine plant was carried out according to standard methods for calculating the thermal circuits of TPPs and NPPs.
2.2. PCM Selection
The second stage of this work is PCM selection.
A PCM was selected based on the required thermophysical properties. The main parameter was the melting point of the PCM [70,71]. In this way, the melting temperature of the selected PCM should be in the range between the temperatures of a hot heat transfer fluid and a cold heat transfer fluid. Visually, the temperature regimes of a hot heat transfer fluid, a cold heat transfer fluid, and the PCM in the charge and discharge modes (when superheated steam is used as a hot heat transfer fluid and water as a cold heat transfer fluid) are shown in Figure 2.
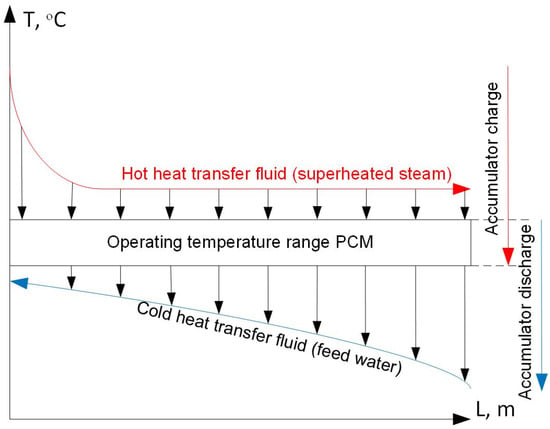
Figure 2.
Temperature regimes of the hot and cold heat transfer fluids; PCM in the modes of charge and discharge of the heat accumulator with a PCM.
In this paper, a PCM was selected based on the following parameters of the hot and cold heat transfer fluid (according to the parameters of the nuclear power plant RITM–200 and the steam turbine unit TK–35/38–3.4):
- The hot heat transfer fluid is superheated steam with a temperature of 295 °C and a pressure of 3.8 MPa;
- The cold heat transfer fluid is feed water with pressure of 3.8 MPa with nominal temperatures at the inlet and outlet of the accumulator: Tinp = 140 °C, Iout = 170 °C (nominal temperatures of feed water at the inlet of HPH1). Consumption of the heated heat transfer fluid: 261 t/h (100% of the steam generator’s capacity in nominal mode). The accumulator time in the discharge mode is assumed to be 1600 s.
Among the PCMs that correspond to the required temperature regime, it is advisable to select a PCM with the following characteristics [71,72]:
- High heat of phase transition;
- High heat capacity;
- High thermal conductivity (in solid and liquid phases);
- High density;
- Stability of thermophysical properties during multiple heating–cooling cycles, melting, and solidification cycles;
- Chemical stability and neutrality with structural materials of container construction;
- Low coefficient of thermal expansion and density change during the phase transition;
- Low cost and availability.
As a heat storage PCM, the following are used depending on the melting temperature:
- Metals (most widely available metals have melting points of 400…1100 °C) [73,74];
- Salts and their eutectic mixtures (melting points 200…1000 °C) [70,75,76];
- Salt hydrates (melting points 5…120 °C) [77,78,79];
- Organic compounds: paraffins, fatty acids, etc. (melting points 5…120 °C [70,75].
Some of the applied heat storage PCMs with thermophysical characteristics are presented in Table 2.

Table 2.
Heat storage PCMs.
In this work, the most attention was paid to salts and their eutectic compounds due to the suitability of their melting points to the present case, as well as their relatively low cost and availability.
The choice of a PCM was made based on the weighted sum method (WSM). We considered PCMs (Table 2) with melting temperatures from 180 to 235 °C. The lower limit of this range was determined by the maximum temperature of the cold heat transfer fluid (feed water temperature at the outlet of the high-pressure heater = 170 °C) + 10 °C. The upper limit of this range was determined by the minimum temperature of the hot heat transfer fluid (condensation temperature of fresh steam = 245 °C) − 10 °C.
Each PCM was evaluated using the following criteria: melting point, melting heat, heat capacity, thermal conductivity, density, and cost. Each criterion was evaluated on a scale from 0 to 5. Each criterion was assigned weighting coefficients, and the sum of the all-weighting factors is 1. The optimal PCM was determined using the integral criterion:
where yi is the weighting coefficient; xi is the value of the criterion.
Melting point was the most significant criterion because it is this value that determines the normal operation of the heat accumulator in charge and discharge modes. The weight coefficient of this criterion was taken to be 0.3. The value of this criterion was determined by its proximity to the ideal value. The optimal value of the PCM melting point was determined based on the charge and discharge time of the accumulator. Thus, the accumulator operating in discharge mode for one cycle charge/discharge is 1600 s. If we assume that the accumulator is used twice a day to work in daily peaks of the load, then the accumulator charge time will be several hours during the minimums of the load. Thus, the heat transfer power in the discharge mode should be several times higher than the power in the charge mode. In turn, the heat exchanger power was determined by the temperature difference between the PCM and heat transfer fluid. Thus, the temperature difference between the hot heat transfer fluid and the PCM should be lower than that between the cold heat transfer fluid and the PCM. The optimal ratio of these values is taken to be 1/3 in this work. Thus, the optimal melting point of the PCM is 221.25 °C. If the PCM melting point = 221.25 °C, then this criterion = 5; alternatively, if the PCM melting point is equal to the boundaries of the considered range (180 and 235 °C), then this criterion = 0.
Melting heat is an important parameter that has the most significant effect on the density of stored energy. The weight coefficient of this criterion is taken to be 0.2. The value of this criterion was determined, represented as:
where Mi is the value of a physical property of the PCM; Mmax is the maximum value of a physical property among PCMs considered as candidates.
The weight coefficient is taken to be 0.1 for the next criteria: «heat capacity», «thermal conductivity», and «density». The value of this criterion is determined by Equation (2).
The weight coefficient is taken to be 0.2 for the criterion «cost». The value of this criterion was determined, represented as:
where Mi is the cost of the PCM; Mmin is the minimum value of cost among the PCM considered as candidates.
2.3. Preliminary Characteristics of the Heat Exchange Elements
The third stage of the work was to determine the preliminary parameters of heat exchange surfaces and their numbers.
A shell and tube heat accumulator with a PCM is a container that is filled with the heat storage PCM [74,75]. Inside the container, there are tubes for the movement of the heat transfer fluids [72,85]. Heat exchange between heat transfer fluids and heat storage material occurs through the metallic walls. In the absence of the need for the simultaneous movement of the hot and cold heat transfer fluids through the accumulator, as well as their compatibility, it is permissible and expedient to apply the same sections (tubes) for the alternate movement of both heat transfer fluids.
The accumulator might consist of one heat exchange element or might be assembled from several parallel heat exchange elements, depending on the required capacity, power, charge/discharge time, and the required parameters of heat transfer fluids. The heat exchange element is a tube made in the form of a tube coil with a certain number of straight sections. A schematic image of one heat exchange element is shown in Figure 3. A schematic image of one straight section of the heat exchange element is shown in Figure 4.
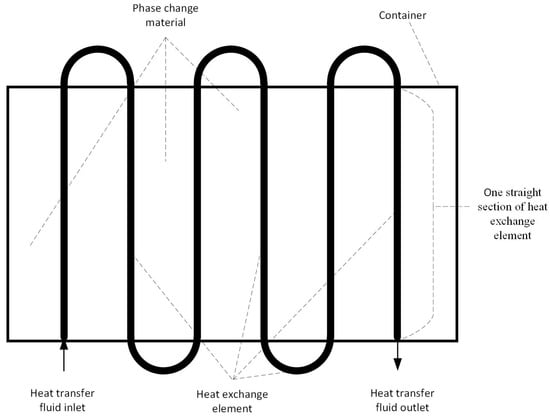
Figure 3.
A schematic image of one heat exchange element.
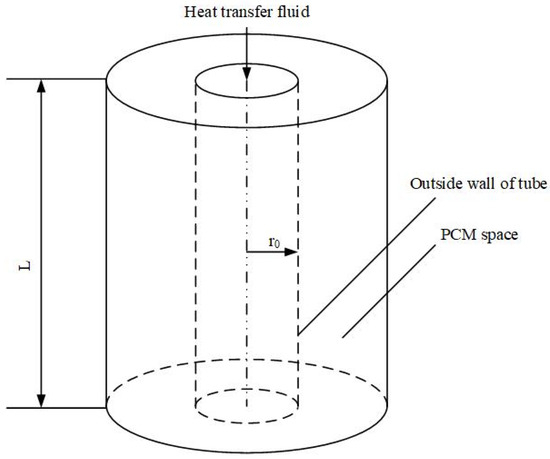
Figure 4.
A schematic image of one straight section of the heat exchange element.
The preliminary diameter and number of tubes for the heat transfer fluids were determined based on the calculated speed of the heat transfer fluids. The movement speed was determined according to the expression:
where Gc is the volumetric flow rate of the heat transfer fluids, m3/s; b is the number of heat exchange elements (tubes) for the heat transfer fluids, and dc is internal diameter of tubes for heat transfer fluid.
The required thermal power of one heat exchange element throughout the estimated time of a discharge:
where and —required heat transfer fluid temperatures at the inlet and outlet of the accumulator, respectively, °C; cv—volumetric heat capacity of the heat transfer fluid in one heat exchange element, kJ/(m3∙°C).
Estimated time of a discharge—the time during which the calculated parameters of the heat transfer fluid at the outlet of the accumulator must be provided.
We propose to determine the preliminary length of the heat exchange surface based on the expression (5) and the heat transfer between the heat transfer fluid and the tube:
where —tube wall temperature = melting point of the PCM; —required heat transfer fluid temperature at the outlet of the accumulator, °C; L—length of the heat exchange surface, m, din is the inner diameter of the tube, m, —the coefficient that takes into account the non-stationarity of heat exchange = 2…5, is the heat transfer coefficient between the tube wall and the water, which is determined according to the expressions (14)–(16).
At the next stage, the heat exchange between the PCM and the heat transfer fluid was simulated during the discharge time. Based on the simulation results, it was determined whether the required power (heating of the heat transfer fluid) was provided during the entire discharge time. If the power was insufficient or excessive, adjustments to the dimensions of the heat exchange surface were made, and repeated simulations were performed.
Thus, the accumulator design was determined by a method of successive approximations based on the simulation results of the accumulator discharge process.
2.4. Mathematical Model of PCM Melting and Solidification Processes
A mathematical model of heat exchange in the accumulator with the PCM was compiled. The mathematical model was used to determine the PCM parameters (temperature and fraction) and outlet temperature of heat transfer fluid at every moment in the processes of charge. The objective functions are the values of T(τ)—PCM and heat transfer fluid temperature, f(τ)—fraction of liquid phase of the PCM. Simulation was performed by the finite difference method. This method is widely used for modeling non-stationary thermal processes. It is the basis of software products for modeling, for example, ANSYS [86]. The objective functions were determined by the linear programming method. Using iterative calculation, adjusted values were determined at each iteration step.
The following assumptions were accepted in the modeling process:
- Heat transfer is carried out only by thermal conductivity (adjusted for convection using the effective thermal conductivity coefficient for the liquid phase);
- The properties of the PCM are isotropic throughout the considered volume;
- The phase transition occurs at a constant temperature (isothermal phase transition);
- The upper, lower, and right boundary of the computational domain—adiabatic walls;
- The density of the PCM remains constant with changes in temperature and during the melt–solidification process.
- The physical features of the melting process of various PCMs are not taken into account.
In the process of simulation, the studied area of space was considered as a grid of elementary cells. Each cell was assigned a coordinate: j—in height and i—in radius. The scheme of partitioning the studied area of space into elementary cells is shown in Figure 5.
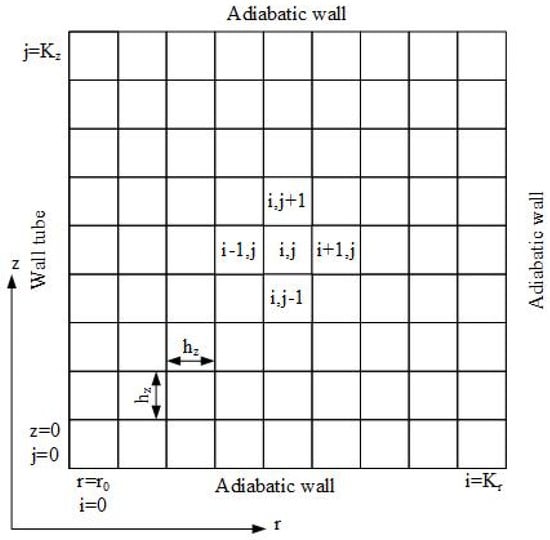
Figure 5.
Grid of the calculation area.
The studied area was the space around one straight section of one heat exchange element.
Because the problem of non-stationary heat exchange was being considered, the values of the objective functions had to be determined at each time step. For each time step k, a finite difference grid was constructed with the values of the objective functions accordingly.
The calculation of heat exchange processes in a heat accumulator with the PCM was based on the solution to a Stefan problem of a phase transition. Therefore, the main equation in the mathematical model was the enthalpy formulation of a Stefan problem in cylindrical coordinates (in partial derivatives):
where —density of a PCM kg/m3, c—mass heat capacity of a PCM, kJ/(kg°C), t—time step, s; h—enthalpy of a PCM, kJ/kg; z—coordinates of the height, m r—coordinate of the radius; λ—thermal conductivity of a PCM, W/(m∙K); T—temperature, °C; f—liquid phase of the PCM, relative units; γ—PCM melting heat, kJ/kg.
Based on Equation (7), the parameters of all cells of the computational domain were calculated at each time step. As a result of approximation by finite differences, Equation (7) was transformed to the form:
where indexes by the j ± 0.5 type denote the average value of the parameter between the cell with coordinates i, j, and the adjacent cell (an example is shown in Figure 5); index k denotes the value calculated at the previous time step; index k + 1 denotes the value at the current time step; hr is the radius step, m; hz is the height step, m; τ is the time step, s.
Equation (8) is restricted by
Boundary conditions:
where Ttube—temperature of the tube wall, °C.
System (10) sets the temperature or conditions at the boundaries of the computational domain: the left boundary is the wall temperature; the right, lower, and upper boundaries are adiabatic walls.
The values of Tij and fij at step k are the initial values for calculating the values of Tij and fij at a step k + 1. Values Tij and fij at step k = 0 are the initial data of the simulation.
Adjustment for heat exchange by convection inside the PCM was made using the coefficient of effective thermal conductivity:
where λl is the thermal conductivity of the PCM in the liquid state, W/(m∙K); c′ = 0.15 and n′ = 0.25 are empirical dimensionless coefficients; Ra is the dimensionless Rayleigh number. This kind of estimation has been used successfully in several works [87,88,89].
In Article [87], to determine the Nusselt number (characterizing the ratio between heat transfer due to convection and thermal conductivity) for a vertical cylinder, the following values were described: c = 0.1 and n = 1/3 for Ra = 109...1013; c = 0.53 and n = 1/4 for Ra = 104...109. Article [88] gives the values c = 0.05; n = 0.25; the range of Rayleigh numbers is not specified. In Article [89], the values for the vertical cylinder are as follows: c = 0.15 and n = 0.34 for Ra = 102...106; c = 0.15 and n = 0.25 for Ra = 102...107; c = 0.28 and n = 0.25 for Ra = 109...1012.
In our case, the Ra is in the range 106...107.
Indicator n should be taken equal to 0.25—this statement can be considered unambiguous for all ranges of Rayleigh numbers because all the authors of the listed works converge in it (the exception is the range of Ra numbers equal to 109...1013 in Article [87]). This situation is ambiguous about the value of indicator c, about which the listed authors offer various options. It was decided to use c = 0.15 for the Ra = 102...106 and 102...107, according to the authors of the paper [89]. This paper most accurately describes a case similar to our study, namely, the natural convection in the PCM around a vertical pipe with a heat transfer fluid.
Heat exchange between the wall and the heat transfer fluid was determined using the heat transfer coefficient from the tube wall to water (expressions (13) and (14))
where Ttube—tube wall temperature, °C; Tw—water temperature, °C; —coefficient of heat transfer from the tube wall to water, W/(m2∙K).
where Nu is the dimensionless Nusselt number; λH20 is the thermal conductivity of water, W/(m∙K); din is the inner diameter of the tube, m.
where c″ = 0.023 and n″ = 0.8 are dimensionless empirical coefficients [90]; Re is the dimensionless Reynolds number.
where ν—kinematic viscosity of water, m2/s; w is water speed in a tube, m/s.
The model was checked for convergence before carrying out the main stages of modeling. Convergence was provided at hz = hr = 1 mm and τ = 1 s.
2.5. Model Optimization
To calculate the heat exchange along the entire length of the heat exchange surface (tube in the form of tube coils), it is necessary to simulate all the straight sections of the heat exchange surface at once. This method is labor-intensive due to the large number of calculations. For this reason, we propose to simplify the modeling methodology. We propose to consider each straight section of the heat exchange surface and the area with the PCM around it separately and without affecting adjacent straight sections. According to this simplified methodology, it was necessary to build a grid of the calculation area for each straight section of the heat exchange element separately. The temperature of the heat transfer fluid at the outlet of the straight section with the number n is the temperature of the heat transfer fluid at the inlet for the straight section with the number n + 1.
To simplify and speed up calculations, it is suggested that the area around each straight section of the heat exchange element can be considered as a one-dimensional area. The scheme of the described method is shown in Figure 6.
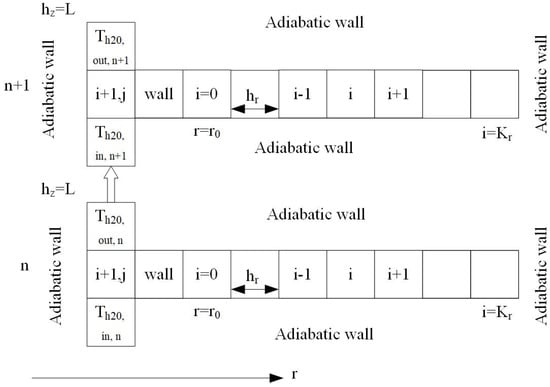
Figure 6.
Schematic of a simplified calculation using a one-dimensional model.
To verify the acceptability of using a one-dimensional model, the data obtained using a one- and two-dimensional model were compared (results in Section 3.3). The simulation of the heat exchange process was carried out under the following conditions:
- The area around the heat exchange tube was filled with the PCM, the outer diameter of the tube was 56 mm, the inner diameter of the tube was 50 mm;
- The heat transfer fluid moved inside the heat exchange tube;
- Physical properties of the PCM were set according to the selected PCM;
- Calculation area with the PCM had the following coordinates: z0 = 0, Kz = 1000; r0 = 28; Kr = 58; hz = hr = 1 mm.
The heat transfer fluid was water with a flow rate of 2.175 m3/h, which provides a speed of 0.3 m/s. The initial water temperature was 140 °C.
2.6. Experimental Verification of a Mathematical Model
The verification of the compiled two-dimensional model (described in Section 2.4) by experiment was carried out (results in Section 3.2). The process of paraffin solidification around a tube with a cold heat transfer fluid was studied. The experiment was recreated using the model presented above. The results of the model and experiment were compared. A comparison was made between the temperatures at individual PCM points measured at the experimental setup and the temperatures at the same points obtained by the simulation. A comparison was made between the outlet water temperature measured at the experimental facility and the outlet water temperature obtained by the simulation.
The scheme of the experimental installation is shown in Figure 7.
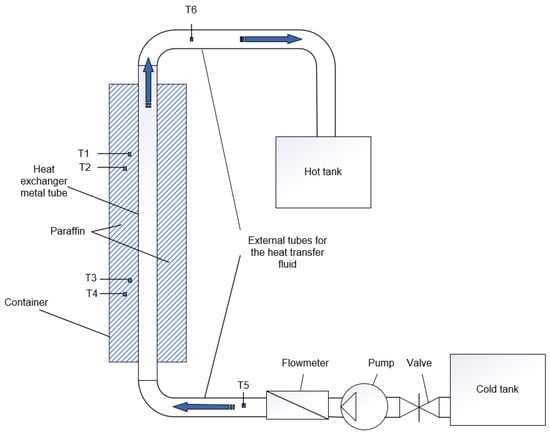
Figure 7.
The scheme of the experimental installation.
The main part of the experimental installation was a container filled with paraffin, height—1000 mm, width and thickness: 150 × 150 mm. A vertical metal tube with a nominal diameter of 50 mm was placed in the container. Four temperature sensors were located inside the container: T1—at a height of 750 mm, at a distance of 5 mm from the tube; T2—at a height of 700 mm, at a distance of 15 mm from the tube; T3—at a height of 350 mm, at a distance of 5 mm from the tube; T4—at a height of 300 mm, at a distance of 15 mm from the tube. Temperature sensors T5 and T6 were located at the inlet and outlet of the heat transfer fluid. The container with paraffin was thermally insulated.
Before the experiment began, the paraffin melted due to the supply of steam through an internal metal tube. Steam was produced by an atmospheric pressure steam generator set. The paraffin in the container was completely melted and had an average temperature of about 80 °C at the start of the experiment. In the experiment, the water from the “cold” tank was pumped by a pump into a metal tube located inside the paraffin tank. In the tube, the water heated up and flowed into a “hot” tank. The water flow rate was determined using a flow meter. The water flow rate was regulated by changing the rotation speed on the pump and partially closing the valve. During the experiment, temperature sensors’ readings and readings on the flow meter were recorded at intervals of 15 s. The water flow rate was 16.4–17.3 L/min, and the temperature of “cold water” at the inlet to the experimental installation was 19.5–20.3 °C (an average value of 20 °C is accepted).
Food paraffin P-2 was used as the PCM in the experimental setup. The physical properties of this paraffin (according to the characteristics of the manufacturer) are presented in Table 3.

Table 3.
Thermophysical properties of paraffin P-2.
3. Results
3.1. Selected PCM
The PCMs considered as candidates and their characteristics are presented in Table 4.

Table 4.
The PCMs considered as candidates and their characteristics.
The PCMs considered as candidates and their criteria, weight coefficients, and integral criteria are presented in Table 5.

Table 5.
The PCMs considered as candidates and their criteria, weight coefficients, and integral criteria.
The eutectic salt mixture KNO3–NaNO3 named «solar salt» has the largest integral coefficient; therefore, this eutectic compound was chosen as the PCM this work. Other PCMs that were also of interest for this work were LiNO3–NaCl and LiOH–NaNO3–NaOH. LiNO3–NaCl is better than solar salt in its physical properties but is significantly worse in cost. LiOH–NaNO3–NaOH has good physical properties and cost, but its relatively high melting point can make the charging process difficult.
The solution strongly depends on the chosen weighting coefficients. In future work, we plan to check the selected coefficients by simulating operation of the thermal accumulator using various PCMs, as well as technical and economic calculations.
The thermophysical properties of Eutectic salt KNO3–NaNO3 are presented in Table 6.

Table 6.
Thermophysical properties of eutectic salt KNO3-NaNO3.
To determine the characteristics of the accumulator and simulate the processes of discharge, the average thermophysical characteristics of solar salt were used, among those presented in the literature (Table 6):
- Melting point: 222 °C;
- Melting heat, 105.3 kJ/kg;
- Heat capacity of the solid phase: 1.01 kJ/(kg·K);
- Heat capacity of the liquid phase: 1.46 kJ/(kg·K);
- Thermal conductivity of the solid phase: 0.73 W/(m·K);
- Thermal conductivity of the liquid phase: 0.53 W/(m·K);
- Density: 1950 kg/ m3.
An important factor when choosing a PCM, which we have not yet considered, is the chemical compatibility of the PCM with the container materials and the heat exchange surface. So, this is maybe a big issue. A study, [94], says that corrosion of high-temperature alloys in solar salt at temperatures of 500 °C and below is low for all the studied alloys investigated. Thus, solar salt is acceptable for operation at the temperatures considered in the current study (up to 250 °C).
3.2. Results of Experimental Verification of a Mathematical Model
The results of the experimental study and the simulation study of the two-dimensional model (Section 2.4) are shown in Figure 8 and Figure 9. Figure 8 shows (1) the dynamics of water temperature at the outlet of a straight section of a vertical tube with a length of 1 m, the area around which is filled with the PCM; (2) temperatures at individual PCM points (PCM temperature designations correspond to the thermometers in Figure 7). The experimental conditions and the temperature measurement points of the PCM are described in detail in Section 2.6. Figure 9 shows the distribution of the temperature of the PCM in the study area in different periods.
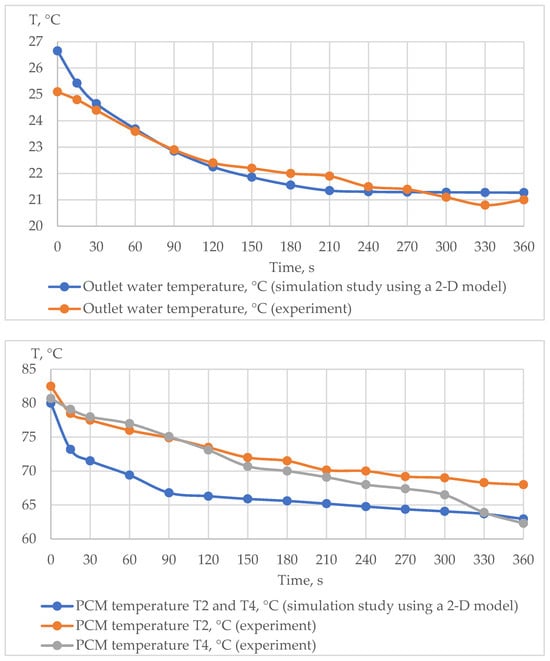
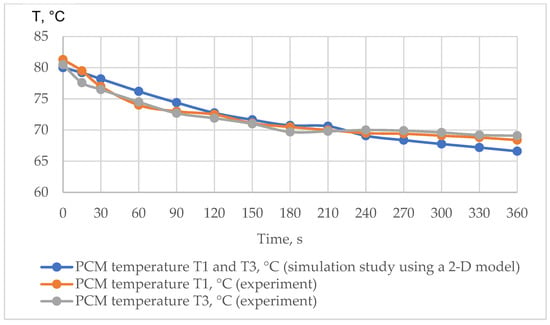
Figure 8.
Results of the experimental and simulation study using a two-dimensional model (PCM temperature designations correspond to the thermometers in Figure 7).
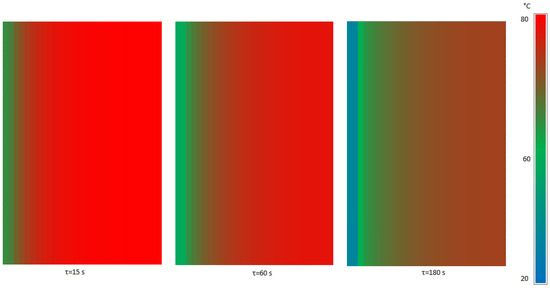
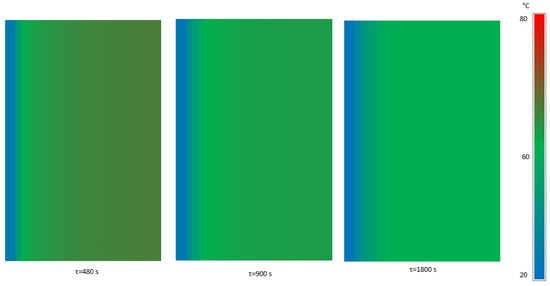
Figure 9.
Results of simulation study of the two-dimensional model. PCM temperature field.
3.3. Results of Simulation Using One- and Two-Dimensional Models
The results of heat exchange simulation (PCM—solar salt) for one straight with a length of 1 m obtained using one- and two-dimensional models were compared (detailed description in Section 2.4 and 2.5). The results are shown in Figure 10 and Figure 11. Figure 10 shows the temperature distribution in the area with the PCM in different periods obtained using one-dimensional and two-dimensional models. Figure 11 shows the dynamics of the water temperature at the outlet.
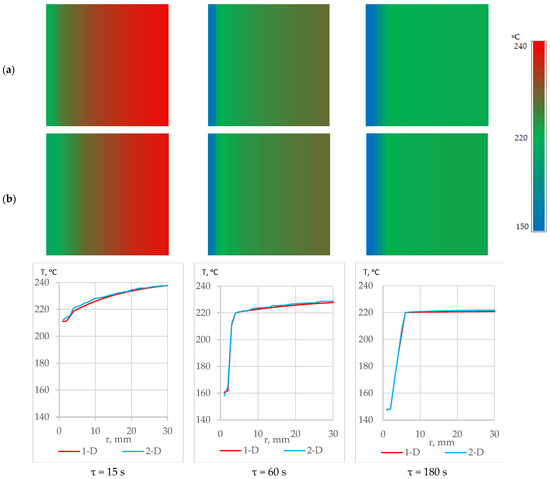
Figure 10.
Results of heat exchange simulation (PCM—solar salt) for one straight section using one- and two-dimensional models. Distribution of temperatures of PCM in different periods: (a)—one-dimensional model, (b)—two-dimensional model.
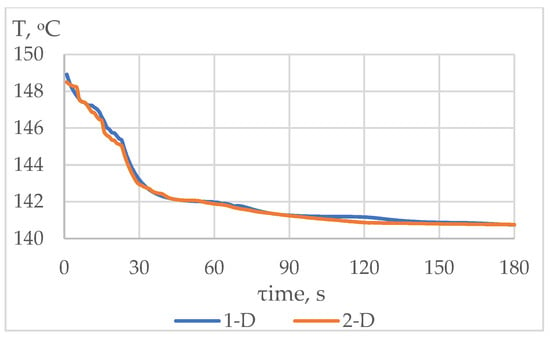
Figure 11.
Results of heat exchange simulation (PCM—solar salt) for one straight section using one- and two-dimensional models. Outlet water temperature.
3.4. Results of Heat Exchange Simulation in Accumulator Using 1—Dimensional Models
As a result of some iterations of the selection, the accumulator design was determined, which provides the required heating of feed water. Namely, this was from 140 to 170 °C with a flow rate of 261 t/h.
The parameters of the heat exchange surface are as follows. The number of parallel heat exchange elements for the movement of the heat transfer fluid (heat exchange tubes, the area around which is filled with the PCM) was 120 units. The inner and outer diameters of the heat exchange tubes were 50 and 56 mm, respectively. The length of each heat exchange element was 120 m, when executed in the form of tube coils, the height of each straight section will be 4 m, and the number of straight sections will be n = 30 units. The dimensions of the accumulator with a staggered arrangement of the heat exchange surfaces were 6.63 × 5.76 × 4 m, excluding the wall of the accumulator container. The volume of the heat accumulator (for the PCM and heat exchange surfaces) was 153.24 m3. The volume of the area with the PCM was 116.7 m3, and the mass of the PCM was 222.6 tons. With the selected values, the speed of the heat transfer fluid (water) is 0.3 m/s at a flow rate of 261 t/h, the estimated discharge time is 1600 s.
A simulation of heat exchange with this design of the heat exchange surface was carried out. The simulation was carried out according to the method described in Section 2.5. The results of heat exchange simulation (PCM—solar salt) along the entire length of the heat exchange element are shown in Figure 12 and Figure 13 below. Figure 12 shows the temperature distributions of the area filled with the PCM in different periods for different straight sections of the heat exchange surface with the following sequence numbers: n = 1 (a), n = 15 (b), n = 30 (c). The sequence numbers of the straight sections were determined by the direction of movement of the heat transfer fluid. Section n = 1 was the first, it received feed water with an initial temperature; section n = 15 was the middle; section n = 30 was the last, from which water with a final temperature comes out. Figure 13 shows the water temperatures at the inlet and outlet in the sections with the following sequence numbers: n = 1, n = 15, n = 30.
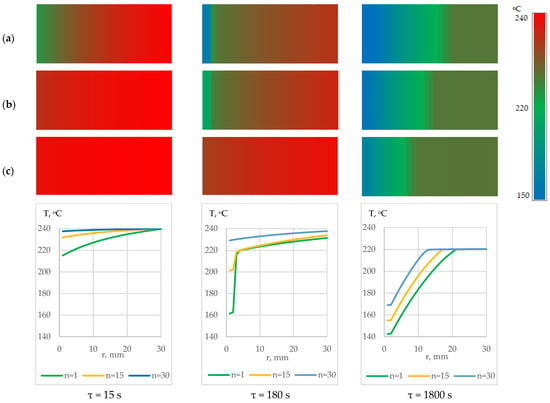
Figure 12.
Results of heat exchange simulation (PCM—solar salt) along the entire length of the heat exchange element 1. Distribution of temperatures of PCM in different periods: (a) n = 1; (b) n = 15; (c) n = 30.
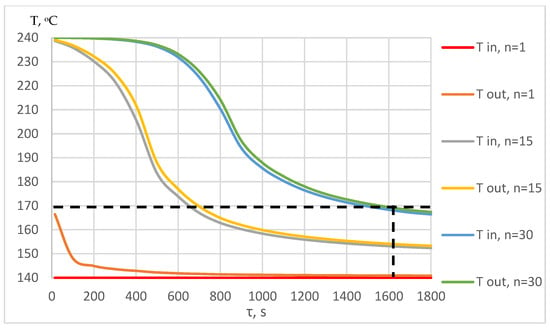
Figure 13.
Results of heat exchange simulation (PCM—solar salt) along the entire length of the heat exchange element. Inlet and outlet water temperatures for different straight sections of the heat exchange surface at different periods. Dotted line: along the vertical axis—the required outlet water temperature, along the horizontal axis—the required working time of accumulator.
3.5. Results of Calculation of NPP Thermal Scheme
The results of the calculation of the thermal scheme of a low-power NPP in a standard version and a version with a heat accumulator in the discharge mode are presented in Table 7.

Table 7.
Results of calculation of the NPP thermal scheme.
By shutting down regenerative bleed-off 1 from the HPC (high-pressure cylinder) to HPH1, the steam flow through the subsequent stages of the HPC and LPC (low-pressure cylinder) increases, thereby increasing the power of the turbine plant. Heating of feed water to the nominal value instead of HPH1 was carried out in a parallel-connected heat accumulator with the PCM. The increase in the power of the turbine plant was 3 MW or 5.8% of the nominal power.
4. Discussion
4.1. Results of the Simulation Using a Two-Dimensional Model and an Experimental Study
The simulation results (Figure 9) reflect a typical solidification process of the substance around the cooling tube. During the accumulator discharge process (for one straight section with a length of 1 m), the heat exchange power decreases and the temperature of the heated water at the outlet decreases. This fact is explained by the decreasing PCM temperature and the increase in the proportion of the solid PCM during the discharge process. At the beginning of the process, heat exchange is characterized for the most part by natural convection inside the PCM. Next, when a solid PCM layer is formed, this layer plays the role of thermal resistance. Heat exchange in this layer is carried out exclusively by thermal conductivity. Thus, in the process of cooling and solidification of the PCM, the intensity of heat exchange decreases.
The results of the two-dimensional simulation and experiment (for one straight section with a length of 1 m) were compared. The distribution of PCM temperatures and the water temperatures at the outlet of the heat exchange tube were compared for different periods of time. The water temperatures at the outlet of the tube reflect the heat exchange power.
The two-dimensional model showed good convergence with the experimental results (Figure 8). Deviations in the temperatures of the liquid phase at a distance of 15 mm from the heat exchange tube in the readings of the model and experiment were observed.
The deviations can be explained by neglecting the change in the PCM density during the temperature change and phase transition, as well as not using the equation of motion in the compiled model. These deviations do not significantly affect the heating power of the heat transfer fluid, which is expressed in the temperature of the water at the outlet of the heat exchange tube.
It is concluded that the presented model is adequate for estimating the power and dynamics of heat exchange for the presented application.
It is worth noting that the change in the PCM temperature in height does not significantly affect the heat exchange power of the heat transfer fluid. For this reason, an assumption is made about the admissibility of using a one-dimensional model.
4.2. Comparison of One and Two-Dimensional Models
A comparison of the temperature distribution of the PCM at different periods and water temperatures at the outlet of the heat exchange tube was carried out (Figure 10 and Figure 11). The results did not reveal significant differences between the one- and two-dimensional models. The discrepancy in water temperature at the outlet was less than 1% between the one- and two-dimensional models during the simulation cycle (Figure 11). The temperature distribution of the PCM in different periods also showed good convergence (Figure 10). This indicates the acceptability of using a one-dimensional model. Thus, the method described in Section 2.5 can be used to calculate the total heat transfer surface in the accumulator.
4.3. The Results of Heat Exchange Simulation along the Entire Length of the Heat Exchange Element
The simulation results (Figure 13) say that the selected design of the heat exchange elements (number, length, diameter) and the volume of space with a PCM allow for the providing of the specified parameters of feed water (heating to 170 °C for 1600 s).
The PCM temperatures at each time step at the ends of the calculated areas for adjacent straight sections differ slightly. A conclusion was made about the non-significant influence of adjacent straight sections on each other (Figure 12).
4.4. Non-Stationarity of Heat Exchange and Requirements for Feed Water Temperature at NPP
The results of heat exchange simulation processes showed a significant non-stationarity (Figure 13), which is a negative factor for the application of such accumulators in industry. At the same time, strict requirements are imposed on the parameters of the nuclear power plant, including temperature, since the feed water temperature affects the temperature of the primary heat transfer fluid, which determines the reactivity of the core.
It is necessary to apply a control system to maintain the temperature of the feed water within the required range. A bypass line with a control valve/pump must be provided in parallel with the accumulator. The degree of valve opening or pump power varies depending on the water temperature at the outlet of the accumulator. With the introduction of a such scheme, part of the heat transfer fluid will bypass the accumulator. It mixes with heated water after the accumulator. Thus, the heat transfer fluid passing through the bypass will cool the heat transfer fluid heated in the accumulator, which will ensure a stable temperature of the feed water. The scheme of the heated water temperature control system is shown in Figure 14.
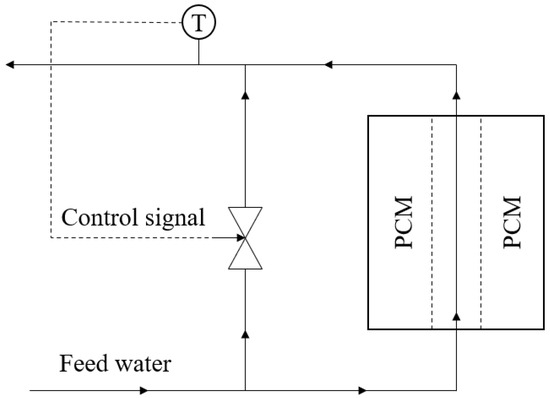
Figure 14.
The scheme of the heated water temperature control system.
It is possible to reduce the uneven intensity of heat exchange over time by increasing the thermal conductivity of the PCM (the use of metal nanoparticles or other additives in the production of a PCM) or through the use of expanded heating surfaces (ribs of various shapes and configurations on the outside of heat exchange tubes) [95]. To reduce the effect of non-stationary in the operation of a heat accumulator with a PCM, a system of several accumulators with different switching schemes and several types of PCMs with different melting temperatures can be used. We plan to study this issue in a future study.
4.5. Efficiency of Accumulator Application
The calculation of a NPP thermal scheme with a heat accumulator indicates the possibility of using the accumulated heat to increase the generation of electricity in an NPP. The calculations indicate an increase in the generated power by 5.8% (3 MW) in the accumulator discharge mode. This effect is observed when the accumulator is turned on in parallel to the high-pressure heater, No. 1, in the regenerative heating circuit of the turbine unit. The increase in power occurs due to the shutdown of regenerative selection at high-pressure heater No. 1. In this case, the accumulator temporarily performs the function of high-pressure heater No. 1 and provides the nominal temperature of the feed water. The turbine power is changed without changing the reactor power. Thus, the proposed solution is a way to reduce the negative impact of maneuverable NPP modes on reactor operation.
5. Conclusions
The application of a heat accumulator in the NPP scheme makes it possible to use the accumulated thermal energy of excess waste steam to increase electricity generation during a sharp increase in demand for electricity in power systems. The increase in power in the case under consideration is provided during the estimated time of operation of the accumulator (1600 s) and can be carried out without involvement in the regulation of the power of the active zone. The increase in power in the accumulator discharge mode for the case under consideration was 3 MW or 5.8% of the nominal power of NPP.
For the considered small nuclear power plant with an electric capacity of 52 MW, the characteristics of the accumulator are presented below. The number of heat exchange elements (heat exchange tubes, the area around which is filled with the PCM) is 120 units. The inner and outer diameters of the heat exchange tubes are 50 and 56 mm, respectively. The length of each heat exchange element is 120 m, when executed in the form of tube coils, the height of each straight section is 4 m, and the number of straight sections is n = 30 units. The dimensions of the accumulator with a staggered arrangement of the heat exchange surfaces are 6.63 × 5.76 × 4.0 m, excluding the wall of the accumulator container. The volume of the heat accumulator (for the PCM and heat exchange surfaces) is 153.24 m3. The volume of the area with the PCM is 116.7 m3, and the mass of the PCM is 222.6 tons. The volume of the PCM is 76 percent of the accumulator. To increase this value, it is advisable to use methods of heat exchange intensification from the PCM side.
This method of application of a heat accumulator considered in this work is a way to reduce the negative impact of maneuvering modes on the equipment of the NPP core. This method of application of the heat accumulator provides an increase in the maneuverability and energy efficiency of the NPP source. This application of a heat accumulator is especially relevant for remote power systems, in which the problem of uneven daily energy consumption is especially acute.
The process of accumulator discharge with a PCM is characterized by non-stationary heat exchange. For this reason, the temperature of the heat transfer fluid at the outlet of the accumulator is not a constant value (it decreases during the discharge of the accumulator). Therefore, the accumulator must be selected (designed) in such a way that initially a power reserve is provided, and at the end of the discharge process, the minimum required power is provided. Changes in power during accumulator discharge must be adjusted by the control system.
This paper presents a method for determining the approximate dimensions of an accumulator with a PCM, the amount of the PCM, and the heat exchange power at each time. An experimental verification of the model was carried out, and a good convergence of the results was obtained. This method is iterative, that is, using the presented model, the method of successive approximations is determined by: (1) the length of the heat exchange elements; (2) the number of heat exchange elements for heating the required heat transfer fluid flow; and (3) the area filled with the PCM around each direct section of the heat exchange surface. This method can be used for economic justification, pre-design decisions on the development of accumulators with a PCM, and evaluation of the effectiveness of the application.
To determine the approximate dimensions of the accumulator with a PCM, the amount of the PCM, and the heat exchange capacity at each moment, according to the proposed method, it is necessary to use a model based on the finite difference method. It is necessary to calculate heat exchange power along the entire length of the heat exchange surface. It is acceptable to use a calculation in which each straight section (or part of each straight section, for example, 1 m) is calculated sequentially one after another. It is acceptable to use a one-dimensional model. In such a model, it is permissible not to take into account the influence of adjacent straight sections on each other.
In future work, we plan to study the following issues: (1) intensification of the heat exchange process in a heat accumulator with a PCM; (2) correctness of weight criteria when choosing a PCM.
Author Contributions
Conceptualization, V.L. and A.D.; methodology, V.L.; software, A.D.; validation, V.L.; formal analysis, V.L.; data curation, A.D.; writing—original draft preparation, A.D.; writing—review and editing, A.D.; visualization, A.D.; supervision, V.L. All authors have read and agreed to the published version of the manuscript.
Funding
This research received no external funding.
Data Availability Statement
Data available in a publicly accessible repository that does not issue DOIs. Publicly available datasets were analyzed in this study. This data can be found here: https://disk.yandex.ru/d/TB3kZgif8sVmrA.
Acknowledgments
The authors want to say thank you to I. Raguzin (post-graduate student of department of Engineering Geodesy, Saint Petersburg Mining University) for his help in creating a simulation program.
Conflicts of Interest
The authors declare no conflict of interest.
References
- Cherepovitsyn, A.; Lebedev, A. Drill Cuttings Disposal Efficiency in Offshore Oil Drilling. J. Mar. Sci. Eng. 2023, 11, 317. [Google Scholar] [CrossRef]
- Khalturin, A.A.; Parfenchik, K.D.; Shpenst, V.A. Features of Oil Spills Monitoring on the Water Surface by the Russian Federation in the Arctic Region. J. Mar. Sci. Eng. 2023, 11, 111. [Google Scholar] [CrossRef]
- Efimov, V.S.; Lapteva, A.V. Siberia and the Russian Far East in the 21st Century: Scenarios of the Future. J. Sib. Fed. Univ. Humanit. Soc. Sci. 2017, 10, 1669–1686. [Google Scholar] [CrossRef][Green Version]
- Dvoynikov, M.V.; Budovskaya, M.E. Development of a hydrocarbon completion system for wells with low bottomhole temperatures for conditions of oil and gas fields in Eastern Siberia. J. Min. Inst. 2022, 253, 12–22. [Google Scholar] [CrossRef]
- Raupov, I.; Rogachev, M.; Sytnik, J. Design of a Polymer Composition for the Conformance Control in Heterogeneous Reservoirs. Energies 2023, 16, 515. [Google Scholar] [CrossRef]
- Cheban, A.Y. Engineering of Complex Structure Apatite Deposits and Excavating Sorting Equipment for Its Implementation. J. Min. Inst. 2019, 238, 399–404. [Google Scholar] [CrossRef]
- Zhdaneev, O.V. Technological sovereignty of the Russian Federation fuel and energy complex. J. Min. Inst. 2022, 258, 1061–1078. [Google Scholar] [CrossRef]
- Ustinov, D.; Nazarychev, A.; Pelenev, D.; Babyr, K.; Pugachev, A. Investigation of the Effect of Current Protections in Conditions of Single-Phase Ground Fault through Transient Resistance in the Electrical Networks of Mining Enterprises. Energies 2023, 16, 3690. [Google Scholar] [CrossRef]
- Kornev, A.V.; Spitsyn, A.A.; Korshunov, G.I.; Bazhenova, V.A. Preventing dust explosions in coal mines: Methods and current trends. MIAB. Min. Inf. Anal. Bull. 2023, 3, 133–149. (In Russian) [Google Scholar] [CrossRef]
- Vinogradova, A.; Gogolinskii, K.; Umanskii, A.; Alekhnovich, V.; Tarasova, A.; Melnikova, A. Method of the Mechanical Properties Evaluation of Polyethylene Gas Pipelines with Portable Hardness Testers. Inventions 2022, 7, 125. [Google Scholar] [CrossRef]
- Cherepovitsyn, A.E.; Tsvetkov, P.S.; Evseeva, O.O. Critical analysis of methodological approaches to assessing sustainability of arctic oil and gas projects. J. Min. Inst. 2021, 249, 463–478. [Google Scholar] [CrossRef]
- Tsiglianu, P.; Romasheva, N.; Nenko, A. Conceptual Management Framework for Oil and Gas Engineering Project Implementation. Resources 2023, 12, 64. [Google Scholar] [CrossRef]
- Bogoviz, A.V.; Lobova, S.V.; Ragulina, Y.V.; Alekseev, A.N. Russia’s energy security doctrine: Addressing emerging challenges and opportunities. Int. J. Energy Econ. Policy 2018, 8, 1. [Google Scholar]
- Shulga, R.N.; Petrov, A.Y.; Putilova, I.V. The Arctic: Ecology and hydrogen energy. Int. J. Hydrogen Energy 2020, 45, 7185–7198. [Google Scholar] [CrossRef]
- Nazarychev, A.N.; Dyachenok, G.V.; Sychev, Y.A. A reliability study of the traction drive system in haul trucks based on failure analysis of their functional parts. J. Min. Inst. 2023, 261, 363–373. [Google Scholar]
- Lavrik, A.; Zhukovskiy, Y.; Tcvetkov, P. Optimizing the size of autonomous hybrid microgrids with regard to load shifting. Energies 2021, 14, 5059. [Google Scholar] [CrossRef]
- Shklyarskiy, Y.E.; Batueva, D.E. Operation mode selection algorithm development of a winddiesel power plant supply complex. J. Min. Inst. 2022, 253, 115–126. [Google Scholar] [CrossRef]
- Li, W.; Xu, P.; Lu, X.; Wang, H.; Pang, Z. Electricity demand response in China: Status, feasible market schemes and pilots. Energy 2016, 114, 981–994. [Google Scholar] [CrossRef]
- Leinauer, C.; Schott, P.; Fridgen, G.; Keller, R.; Ollig, P.; Weibelzahl, M. Obstacles to demand response: Why industrial companies do not adapt their power consumption to volatile power generation. Energy Policy 2022, 165, 112876. [Google Scholar] [CrossRef]
- Kiptoo, M.K.; Lotfy, M.E.; Adewuyi, O.B.; Conteh, A.; Howlader, A.M.; Senjyu, T. Integrated approach for optimal techno-economic planning for high renewable energy-based isolated microgrid considering cost of energy storage and demand response strategies. Energy Convers. Manag. 2020, 215, 112917. [Google Scholar] [CrossRef]
- Kondurov, E.P.; Kruglikov, P.A.; Shvetsov, I.V. Solutions for energy storage and regulation of electrical load schedules. In Proceedings of the AIP Conference Proceedings, IV International Scientific and Practical Conference on Innovations in Engineering and Technology (ISPCIET 2021), Veliky Novgorod, Russia, 28–29 June 2021; AIP Publishing: Melville, NY, USA, 2022; Volume 2486. [Google Scholar] [CrossRef]
- Golmohamadi, H. Demand-side management in industrial sector: A review of heavy industries. Renew. Sustain. Energy Rev. 2022, 156, 111963. [Google Scholar] [CrossRef]
- Sobianowska-Turek, A.; Urbańska, W.; Janicka, A.; Zawiślak, M.; Matla, J. The necessity of recycling of waste li-ion batteries used in electric vehicles as objects posing a threat to human health and the environment. Recycling 2021, 6, 35. [Google Scholar] [CrossRef]
- Ahmadi, S.H.R.; Noorollahi, Y.; Ghanbari, S.; Ebrahimi, M.; Hosseini, H.; Foroozani, A.; Hajinezhad, A. Hybrid fuzzy decision making approach for wind-powered pumped storage power plant site selection: A case study. Sustain. Energy Technol. Assess. 2020, 42, 100838. [Google Scholar] [CrossRef]
- Zakeri, B.; Syri, S. Electrical energy storage systems: A comparative life cycle cost analysis. Renew. Sustain. Energy Rev. 2015, 42, 569–596. [Google Scholar] [CrossRef]
- Kulpa, J.; Kamiński, P.; Stecuła, K.; Prostański, D.; Matusiak, P.; Kowol, D.; Kopacz, M.; Olczak, P. Technical and Economic Aspects of Electric Energy Storage in a Mine Shaft—Budryk Case Study. Energies 2021, 14, 7337. [Google Scholar] [CrossRef]
- Richter, M.; Oeljeklaus, G.; Görner, K. Improving the load flexibility of coal-fired power plants by the integration of a thermal energy storage. Appl. Energy 2019, 236, 607–621. [Google Scholar] [CrossRef]
- Arya, Y. A new optimized fuzzy FOPI-FOPD controller for automatic generation control of electric power systems. J. Frankl. Inst. 2019, 356, 5611–5629. [Google Scholar] [CrossRef]
- Aminov, R.; Egorov, A. Increasing capacity of a nuclear power plant unit using the hydrogen-fueled feedwater heating system. Int. J. Energy Res. 2020, 44, 5609–5620. [Google Scholar] [CrossRef]
- Wei, H.; Lu, Y.; Yang, Y.; Zhang, C.; He, C.; Wu, Y.; Zhao, D. Research on influence of steam extraction parameters and operation load on operational flexibility of coal-fired power plant. Appl. Therm. Eng. 2021, 195, 117226. [Google Scholar] [CrossRef]
- Stevanovic, V.D.; Petrovic, M.M.; Milivojevic, S.; Ilic, M. Upgrade of the thermal power plant flexibility by the steam accumulator. Energy Convers. Manag. 2020, 223, 113271. [Google Scholar] [CrossRef]
- Wang, C.; Qiao, Y.; Liu, M.; Zhao, Y.; Yan, J. Enhancing peak shaving capability by optimizing reheat-steam temperature control of a double-reheat boiler. Appl. Energy 2020, 260, 114341. [Google Scholar] [CrossRef]
- Zhan, L.; Bo, Y.; Lin, T.; Fan, Z. Development and outlook of advanced nuclear energy technology. Energy Strategy Rev. 2021, 34, 100630. [Google Scholar] [CrossRef]
- Kim, J.H.; Alameri, S.A. Harmonizing nuclear and renewable energy: Case studies. Int. J. Energy Res. 2020, 44, 8053–8061. [Google Scholar] [CrossRef]
- Michaelson, D.; Jiang, J. Review of integration of small modular reactors in renewable energy microgrids. Renew. Sustain. Energy Rev. 2021, 152, 111638. [Google Scholar] [CrossRef]
- Ali, M.; Alkaabi, A.K.; Lee, J.I. CFD simulation of an integrated PCM-based thermal energy storage within a nuclear power plant connected to a grid with constant or variable power demand. Nucl. Eng. Des. 2022, 394, 111819. [Google Scholar] [CrossRef]
- Petrunin, V.V.; Fadeev, Y.P.; Pakhomov, A.N.; Veshnyakov, K.B.; Polunichev, V.I.; Shamanin, I.E. Conceptual Design of Small NPP with RITM-200 Reactor. Energy 2019, 125, 365–369. [Google Scholar] [CrossRef]
- Petrunin, V.V. Reactor Units for Small Nuclear Power Plants. Her. Russ. Acad. Sci. 2021, 91, 335–346. [Google Scholar] [CrossRef]
- Rogalev, N.; Rogalev, A.; Kindra, V.; Zlyvko, O.; Osipov, S. An Overview of Small Nuclear Power Plants for Clean Energy Production: Comparative Analysis of Distributed Generation Technologies and Future Perspectives. Energies 2023, 16, 4899. [Google Scholar] [CrossRef]
- Zverev, D.L.; Fadeev, Y.P.; Pakhomov, A.N.; Polunichev, V.I. Nuclear power plants for the icebreaker fleet and power generation in the Arctic region: Development experience and future prospects. At. Energy 2019, 125, 359–364. [Google Scholar] [CrossRef]
- Subki, H. Advances in Small Modular Reactor Technology Developments. IAEA-NPTD Webinar on Advances in Small Modular Reactor (SMR) Design and Technology Developments A Booklet Supplement to the IAEA Advanced Reactors Information System (ARIS); International Atomic Energy Agency (IAEA): Vienna, Austria, 2020. [Google Scholar]
- Yurin, V.E.; Egorov, A.N. Predictive economic efficiency of combining nuclear power plants with autonomous hydrogen power complex. Int. J. Hydrogen Energy 2021, 46, 32350–32357. [Google Scholar] [CrossRef]
- Alameri, S.A.; King, J.C.; Alkaabi, A.K.; Addad, Y. Prismatic-core advanced high temperature reactor and thermal energy storage coupled system–A preliminary design. Nucl. Eng. Technol. 2020, 52, 248–257. [Google Scholar] [CrossRef]
- Peakman, A.; Merk, B.; Hesketh, K. The potential of pressurised water reactors to provide flexible response in future electricity grids. Energies 2020, 13, 941. [Google Scholar] [CrossRef]
- Saeed, R.M.; Frick, K.L.; Shigrekar, A.; Mikkelson, D.; Bragg-Sitton, S. Mapping thermal energy storage technologies with advanced nuclear reactors. Energy Convers. Manag. 2022, 267, 115872. [Google Scholar] [CrossRef]
- Aminov, R.Z.; Yurin, V.E. Multicriteria investigation of the efficiency of combining a NPP power unit with a heat storage system. IOP Conf. Ser. Earth Environ. Sci. IOP Publ. 2022, 1070, 012015. [Google Scholar] [CrossRef]
- Aminov, R.; Yurin, V.; Murtazov, M. Efficiency and economic assessment of combining nuclear power plants with multifunctional heat accumulation systems. Int. J. Energy Res. 2021, 45, 12464–12473. [Google Scholar] [CrossRef]
- Amer, A.E.; Elsakka, M.M.; Lebedev, V.A. Thermal performance of an accumulator unit using phase change material with a fixed volume of fins. Int. J. Energy Res. 2021, 45, 19089–19102. [Google Scholar] [CrossRef]
- Zhang, S.; Feng, D.; Shi, L.; Wang, L.; Jin, Y.; Tian, L.; Li, Z.; Wang, G.; Zhao, L.; Yan, Y. A review of phase change heat transfer in shape-stabilized phase change materials (ss-PCMs) based on porous supports for thermal energy storage. Renew. Sustain. Energy Rev. 2021, 135, 110127. [Google Scholar] [CrossRef]
- Souayfane, F.; Biwole, P.H.; Fardoun, F. Melting of a phase change material in presence of natural convection and radiation: A simplified model. Appl. Therm. Eng. 2018, 130, 660–671. [Google Scholar] [CrossRef]
- Shang, B.; Hu, J.; Hu, R.; Cheng, J.; Luo, X. Modularized thermal storage unit of metal foam/paraffin composite. Int. J. Heat Mass Transf. 2018, 125, 596–603. [Google Scholar] [CrossRef]
- Kuznik, F.; David, D.; Johannes, K.; Roux, J.J. A review on phase change materials integrated in building walls. Renew. Sustain. Energy Rev. 2011, 15, 379–391. [Google Scholar] [CrossRef]
- Sharif, M.A.; Al-Abidi, A.A.; Mat, S.; Sopian, K.; Ruslan, M.H.; Sulaiman, M.Y.; Rosli, M.A.M. Review of the application of phase change material for heating and domestic hot water systems. Renew. Sustain. Energy Rev. 2015, 42, 557–568. [Google Scholar] [CrossRef]
- Hassan, F.; Jamil, F.; Hussain, A.; Ali, H.M.; Janjua, M.M.; Khushnood, S.; Farhan, M.; Altaf, K.; Said, Z.; Li, C. Recent advancements in latent heat phase change materials and their applications for thermal energy storage and buildings: A state of the art review. Sustain. Energy Technol. Assess. 2022, 49, 101646. [Google Scholar] [CrossRef]
- Hu, N.; Li, Z.R.; Xu, Z.W.; Fan, L.W. Rapid charging for latent heat thermal energy storage: A state-of-the-art review of close-contact melting. Renew. Sustain. Energy Rev. 2022, 155, 111918. [Google Scholar] [CrossRef]
- Yazdani, M.R.; Lagerström, A.; Vuorinen, V. Simultaneous effect of biochar-additive and lightweight heat exchanger on phase change material for low-grade thermal energy storage. J. Energy Storage 2022, 55, 105478. [Google Scholar] [CrossRef]
- Wang, C.; Wang, S.; Cheng, X.; Zhang, Y.; Wang, Z. Research progress and performance improvement of phase change heat accumulators. J. Energy Storage 2022, 56, 105884. [Google Scholar] [CrossRef]
- Johnson, M.; Hübner, S.; Braun, M.; Martin, C.; Fiß, M.; Hachmann, B.; Schönberger, M.; Eck, M. Assembly and attachment methods for extended aluminum fins onto steel tubes for high temperature latent heat storage units. Appl. Therm. Eng. 2018, 144, 96–105. [Google Scholar] [CrossRef]
- Turski, M.; Nogaj, K.; Sekret, R. The use of a PCM heat accumulator to improve the efficiency of the district heating substation. Energy 2019, 187, 115885. [Google Scholar] [CrossRef]
- Niknam, P.H.; Sciacovelli, A. Hybrid PCM-steam thermal energy storage for industrial processes–Link between thermal phenomena and techno-economic performance through dynamic modelling. Appl. Energy 2023, 331, 120358. [Google Scholar] [CrossRef]
- Garcia, P.; Largiller, G. Performances and control aspects of steam storage systems with PCM: Key learnings from a pilot-scale prototype. Appl. Energy 2022, 325, 119817. [Google Scholar] [CrossRef]
- Tietze, T.; Szulc, P.; Smykowski, D.; Sitka, A.; Redzicki, R. Application of phase change material and artificial neural networks for smoothing of heat flux fluctuations. Energies 2021, 14, 3531. [Google Scholar] [CrossRef]
- Garcia, P.; Largiller, G.; Matringe, G.; Champelovier, L.; Rougé, S. Experimental results from a pilot scale latent heat thermal energy storage for DSG power plants–Advanced operating strategies. In Proceedings of the AIP Conference Proceedings, SOLARPACES 2020: 26th International Conference on Concentrating Solar Power and Chemical Energy Systems, Freiburg, Germany, 28 September–2 October 2020; AIP Publishing: Melville, NY, USA, 2022; Volume 2445. [Google Scholar] [CrossRef]
- Taler, D.; Taler, J.; Sobota, T.; Tokarczyk, J. Cooling Modelling of an Electrically Heated Ceramic Heat Accumulator. Energies 2022, 15, 6085. [Google Scholar] [CrossRef]
- Taler, D.; Dzierwa, P.; Trojan, M.; Sacharczuk, J.; Kaczmarski, K.; Taler, J. Numerical modeling of transient heat transfer in heat storage unit with channel structure. Appl. Therm. Eng. 2019, 149, 841–853. [Google Scholar] [CrossRef]
- Kamkari, B.; Amlashi, H.J. Numerical simulation and experimental verification of constrained melting of phase change material in inclined rectangular enclosures. Int. Commun. Heat Mass Transf. 2017, 88, 211–219. [Google Scholar] [CrossRef]
- Aminov, R.Z. Application of Multifunctional Systems with Latent Heat Thermal Energy Storages: A Way to Improve NPP Safety and Efficiency. Therm. Eng. 2022, 69, 555–562. [Google Scholar] [CrossRef]
- Yurin, V.E.; Murtazov, M.A. Efficiency investigation of nuclear power plant combination with a system of water and phase-transfer heat accumulators. J. Phys. Conf. Ser. IOP Publ. 2020, 1652, 012043. [Google Scholar] [CrossRef]
- Boldyrev, V.M.; Voronkov, M.E.; Sinev, N.M.; Chakhovskii, V.M. Load-following nuclear power stations with heat accumulators. Sov. At. Energy 1981, 51, 555–559. [Google Scholar] [CrossRef]
- Nazir, H.; Batool, M.; Osorio, F.J.B.; Isaza-Ruiz, M.; Xu, X.; Vignarooban, K.; Phelan, P.; Icamuddin Kannan, A.M. Recent developments in phase change materials for energy storage applications: A review. Int. J. Heat Mass Transf. 2019, 129, 491–523. [Google Scholar] [CrossRef]
- Wei, G.; Wang, G.; Xu, C.; Ju, X.; Xing, L.; Du, X.; Yang, Y. Selection principles and thermophysical properties of high temperature phase change materials for thermal energy storage: A review. Renew. Sustain. Energy Rev. 2018, 81, 1771–1786. [Google Scholar] [CrossRef]
- Clark, R.J.; Mehrabadi, A.; Farid, M. State of the art on salt hydrate thermochemical energy storage systems for use in building applications. J. Energy Storage 2020, 27, 101145. [Google Scholar] [CrossRef]
- Shamberger, P.J.; Bruno, N.M. Review of metallic phase change materials for high heat flux transient thermal management applications. Appl. Energy 2020, 258, 113955. [Google Scholar] [CrossRef]
- Laing, D.; Bauer, T.; Breidenbach, N.; Hachmann, B.; Johnson, M. Development of high temperature phase-change-material storages. Appl. Energy 2013, 109, 497–504. [Google Scholar] [CrossRef]
- Sarbu, I.; Dorca, A. Review on heat transfer analysis in thermal energy storage using latent heat storage systems and phase change materials. Int. J. Energy Res. 2019, 43, 29–64. [Google Scholar] [CrossRef]
- Wong-Pinto, L.S.; Milian, Y.; Ushak, S. Progress on use of nanoparticles in salt hydrates as phase change materials. Renew. Sustain. Energy Rev. 2020, 122, 109727. [Google Scholar] [CrossRef]
- Zhao, B.C.; Wang, R.Z. Perspectives for short-term thermal energy storage using salt hydrates for building heating. Energy 2019, 189, 116139. [Google Scholar] [CrossRef]
- Wang, H.; Chen, Y.; Li, J.; Guo, L.; Fang, M. Review of encapsulated salt hydrate core-shell phase change materials. KONA Powder Part. J. 2020, 37, 85–96. [Google Scholar] [CrossRef]
- Mehrali, M.; Johan, E.; Shahi, M.; Mahmoudi, A. Simultaneous solar-thermal energy harvesting and storage via shape stabilized salt hydrate phase change material. Chem. Eng. J. 2021, 405, 126624. [Google Scholar] [CrossRef]
- Faraj, K.; Khaled, M.; Faraj, J.; Hachem, F.; Castelain, C. systems driven by paraffin storage systems for cooling applications in buildings: A review. Renew. Sustain. Energy Rev. 2020, 119, 109579. [Google Scholar] [CrossRef]
- Gulfam, R.; Zhang, P.; Meng, Z. Advanced thermal systems driven by paraffin-based phase change materials–A review. Appl. Energy 2019, 238, 582–611. [Google Scholar] [CrossRef]
- Rashid, F.L.; Al-Obaidi, M.A. Recent innovations and developments concerning the beeswax as phase change material for thermal energy storage: A review. J. Therm. Anal. Calorim. 2023, 148, 12859–12876. [Google Scholar] [CrossRef]
- Dinker, A.; Agarwal, M.; Agarwal, G.D. Experimental assessment on thermal storage performance of beeswax in a helical tube embedded storage unit. Appl. Therm. Eng. 2017, 111, 358–368. [Google Scholar] [CrossRef]
- Da Cunha, J.P.; Eames, P. Thermal energy storage for low and medium temperature applications using phase change materials–a review. Appl. Energy 2016, 177, 227–238. [Google Scholar] [CrossRef]
- Agyenim, F.; Hewitt, N.; Eames, P.; Smyth, M. A review of materials, heat transfer and phase change problem formulation for latent heat thermal energy storage systems (LHTESS). Renew. Sustain. Energy Rev. 2010, 14, 615–628. [Google Scholar] [CrossRef]
- Palaev, A.G.; Nosov, V.V.; Krasnikov, A.A. Simulating distribution of temperature fields and stresses in welded joint using ANSYS. Sci. Technol. Oil Oil Prod. Pipeline Transp. 2022, 12, 461–469. [Google Scholar] [CrossRef]
- Brucker, K.A.; Majdalani, J. Effective thermal conductivity of common geometric shapes. Int. J. Heat Mass Transf. 2005, 48, 4779–4796. [Google Scholar] [CrossRef]
- Zukowski, M. Mathematical modeling and numerical simulation of a short term thermal energy storage system using phase change material for heating applications. Energy Convers. Manag. 2007, 48, 155–165. [Google Scholar] [CrossRef]
- Tehrani, S.S.M.; Shoraka, Y.; Diarce, G.; Taylor, R.A. An improved, generalized effective thermal conductivity method for rapid design of high temperature shell-and-tube latent heat thermal energy storage systems. Renew. Energy 2019, 132, 694–708. [Google Scholar] [CrossRef]
- Chen, Y.S.; Wang, Y.; Zhang, J.H.; Yuan, X.F.; Tian, J.; Tang, Z.F.; Thu, H.H.; Fu, Y.; Wang, N.X. Convective heat transfer characteristics in the turbulent region of molten salt in concentric tube. Appl. Therm. Eng. 2016, 98, 213–219. [Google Scholar] [CrossRef]
- Dong, X.; Bi, Q.; Cheng, X.; Yao, F. Convective heat transfer performance of solar salt in an inclined circular tube. Appl. Therm. Eng. 2020, 178, 115349. [Google Scholar] [CrossRef]
- Guerraiche, D.; Bougriou, C.; Guerraiche, K.; Valenzuela, L.; Driss, Z. Experimental and numerical study of a solar collector using phase change material as heat storage. J. Energy Storage 2020, 27, 101133. [Google Scholar] [CrossRef]
- Bauer, T.; Pfleger, N.; Breidenbach, N.; Eck, M.; Laing, D.; Kaesche, S. Material aspects of Solar Salt for sensible heat storage. Appl. Energy 2013, 111, 1114–1119. [Google Scholar] [CrossRef]
- Kruizenga, A.M.; Gill, D.D.; LaFord, M.E. Corrosion of High Temperature Alloys in Solar Salt at 400, 500, and 680ÀC (No. SAND2013-8256); Sandia National Lab. (SNL-CA): Livermore, CA, USA, 2013. [Google Scholar]
- Bazri, S.; Badruddin, I.A.; Naghavi, M.S.; Bahiraei, M. A review of numerical studies on solar collectors integrated with latent heat storage systems employing fins or nanoparticles. Renew. Energy 2018, 118, 761–778. [Google Scholar] [CrossRef]
Disclaimer/Publisher’s Note: The statements, opinions and data contained in all publications are solely those of the individual author(s) and contributor(s) and not of MDPI and/or the editor(s). MDPI and/or the editor(s) disclaim responsibility for any injury to people or property resulting from any ideas, methods, instructions or products referred to in the content. |
© 2023 by the authors. Licensee MDPI, Basel, Switzerland. This article is an open access article distributed under the terms and conditions of the Creative Commons Attribution (CC BY) license (https://creativecommons.org/licenses/by/4.0/).