Article

Adaptive Leakage Protection for Low-Voltage Distribution Systems Based on SSA-BP Neural Network

1
Electric Power Research Institute, State Grid Xinjiang Electric Power Co., Ltd., Urumqi 830011, China
2
School of Electrical Engineering, China University of Mining and Technology, Xuzhou 221116, China
*
Author to whom correspondence should be addressed.
Appl. Sci. 2023, 13(16), 9273; https://doi.org/10.3390/app13169273
Submission received: 5 July 2023 / Revised: 13 August 2023 / Accepted: 14 August 2023 / Published: 15 August 2023
(This article belongs to the Special Issue Latest Advances in Modern Energy Systems Planning and Operation)

Abstract

:
The fluctuation of normal leakage current has a great influence on the fixed-threshold leakage protector. To address this issue, this paper proposes an adaptive leakage protection method based on the sparrow search algorithm (SSA)-backpropagation (BP) neural network. Based on the analysis of the normal leakage current generation mechanism, this method uses the SSA optimized BP neural network to construct a prediction model of normal leakage current. By dividing the normal leakage range into several intervals and setting the corresponding action threshold, the action threshold of the interval is automatically selected in advance, based on the predicted value of the model, so as to realize the adaptive protection of the leakage current faults. Experiments have proved that the leakage protector can identify the leakage fault more sensitively and increase the ratio of the protector put into operation by predicting the development of normal leakage current and adjusting the protection action threshold in advance.

1. Introduction

Most of the low-voltage power grids in China are directly grounded at neutral points, and the consequences of leakage accidents are thus very serious [1,2]. Leakage protection is crucial to preventing the leakage fires and personal electric shock casualties in low-voltage distribution networks [3,4,5]. According to IEC 60947-2 (circuit breaker incorporating residual current protection) and IEC 60755 (general requirements for residual current operated protective devices), residual current devices (RCDs) should react to leakage currents from 30 mA to tens of amperes [6,7]. There is a certain amount of normal leakage current (residual current) that exists when the low-voltage distribution line is operating regularly [8]. In order to ensure the leakage protector operates normally, the current action setting of the leakage protector should be selected as low as possible under the premise of avoiding the normal leakage current of the line [9,10]. In practice, the normal leakage currents of low-voltage distribution lines have a large numerical fluctuation affected by the external environment, power grid structure, and load size, and has obvious regional, climatic, and seasonal characteristics. For example, in the southern region of China, there is often a problem that the normal leakage current of the line increases during the rainy season, resulting in the failure of the leakage protection to be put into operation [11,12]. Therefore, ensuring the practical operational proportion of the leakage protector without reducing its sensitivity has become an urgent problem to be solved.
In recent years, in order to improve the reliability of leakage protection, a variety of residual leakage protection technologies have been developed by researchers [13,14,15]. A method in [8] takes the leakage current variation in addition to the instantaneous root-mean-square (rms) value of the leakage current as the indicator of leakage fault. Although it solves the problem of a protection dead zone to a certain extent, the application effect is less than perfect because there are still protection misoperation and rejection phenomena. Ref. [16] proposed a method for detecting and identifying the earth leakage current among a group of electrical appliances using frequency domain analysis. Although it somewhat increases the device’s action reliability, the issue of circuit tripping and power failures still remains unsolved. The enterprise standard of the China Southern Power Grid puts forward the regulations and references for the use of different currents for leakage protection in rainy and non-rainy seasons. The standard considers the influence of humidity on leakage current, but not the temperature, load current, and line aging. In addition, with the development of modern signal processing techniques, some related techniques, such as variable mode decomposition (VMD), big data analysis, neural network algorithms, and machine learning approaches [17,18,19,20,21], have been applied to the detection of residual current. In [17], an adaptive residual current detection method based on VMD and a dynamic fuzzy neural network (DFNN) was proposed. A residual current warning technique based on big data analysis was proposed in [18]. The combination of wavelet transform (WT) and backpropagation neural network (BPNN) was proposed to preprocess the signal with multiscale wavelets, and then to use the processed signal as a sample for detection and analysis by BPNN, in [19]. The WT must predetermine the fundamental wave, decomposition layer, threshold, and threshold function, which reduces the algorithm’s adaptability [20]. In [21], a residual current detection method was proposed, based on machine learning approaches. Although these methods have improved the residual current detection accuracy to a certain extent, they cannot predict normal leakage current and cannot set the protection action threshold in advance, which means some application limits.
To solve those problems, this paper proposes an adaptive leakage protection method that uses the SSA-BP neural network to predict the normal leakage current of the line and adjust the protection action threshold in advance. By setting multi-level action gears, the method selects the action threshold based on the predicted leakage after a specific period of time. The switching of gears effectively solves the problem when the normal leakage current changes greatly, and meets the dynamic demand of leakage protection. This research is not only applied to household leakage protection, but can also be used for microgrid leakage prediction [22,23,24]. The method’s concepts can also be used in short-term prediction fields such as short-term wind power prediction and advance perception of energy storage charge and discharge [25].
The rest of this article is organized as follows. Section 2 analyzes the generation mechanism of normal leakage current. The framework of adaptive leakage protection, construction and training of the prediction model are introduced in Section 3. In Section 4, adaptive leakage protection strategies are introduced in detail. The experimental results and the comparative study are presented in Section 5. This article concludes with a summary in Section 6.

2. Principle of Normal Leakage Current Variation

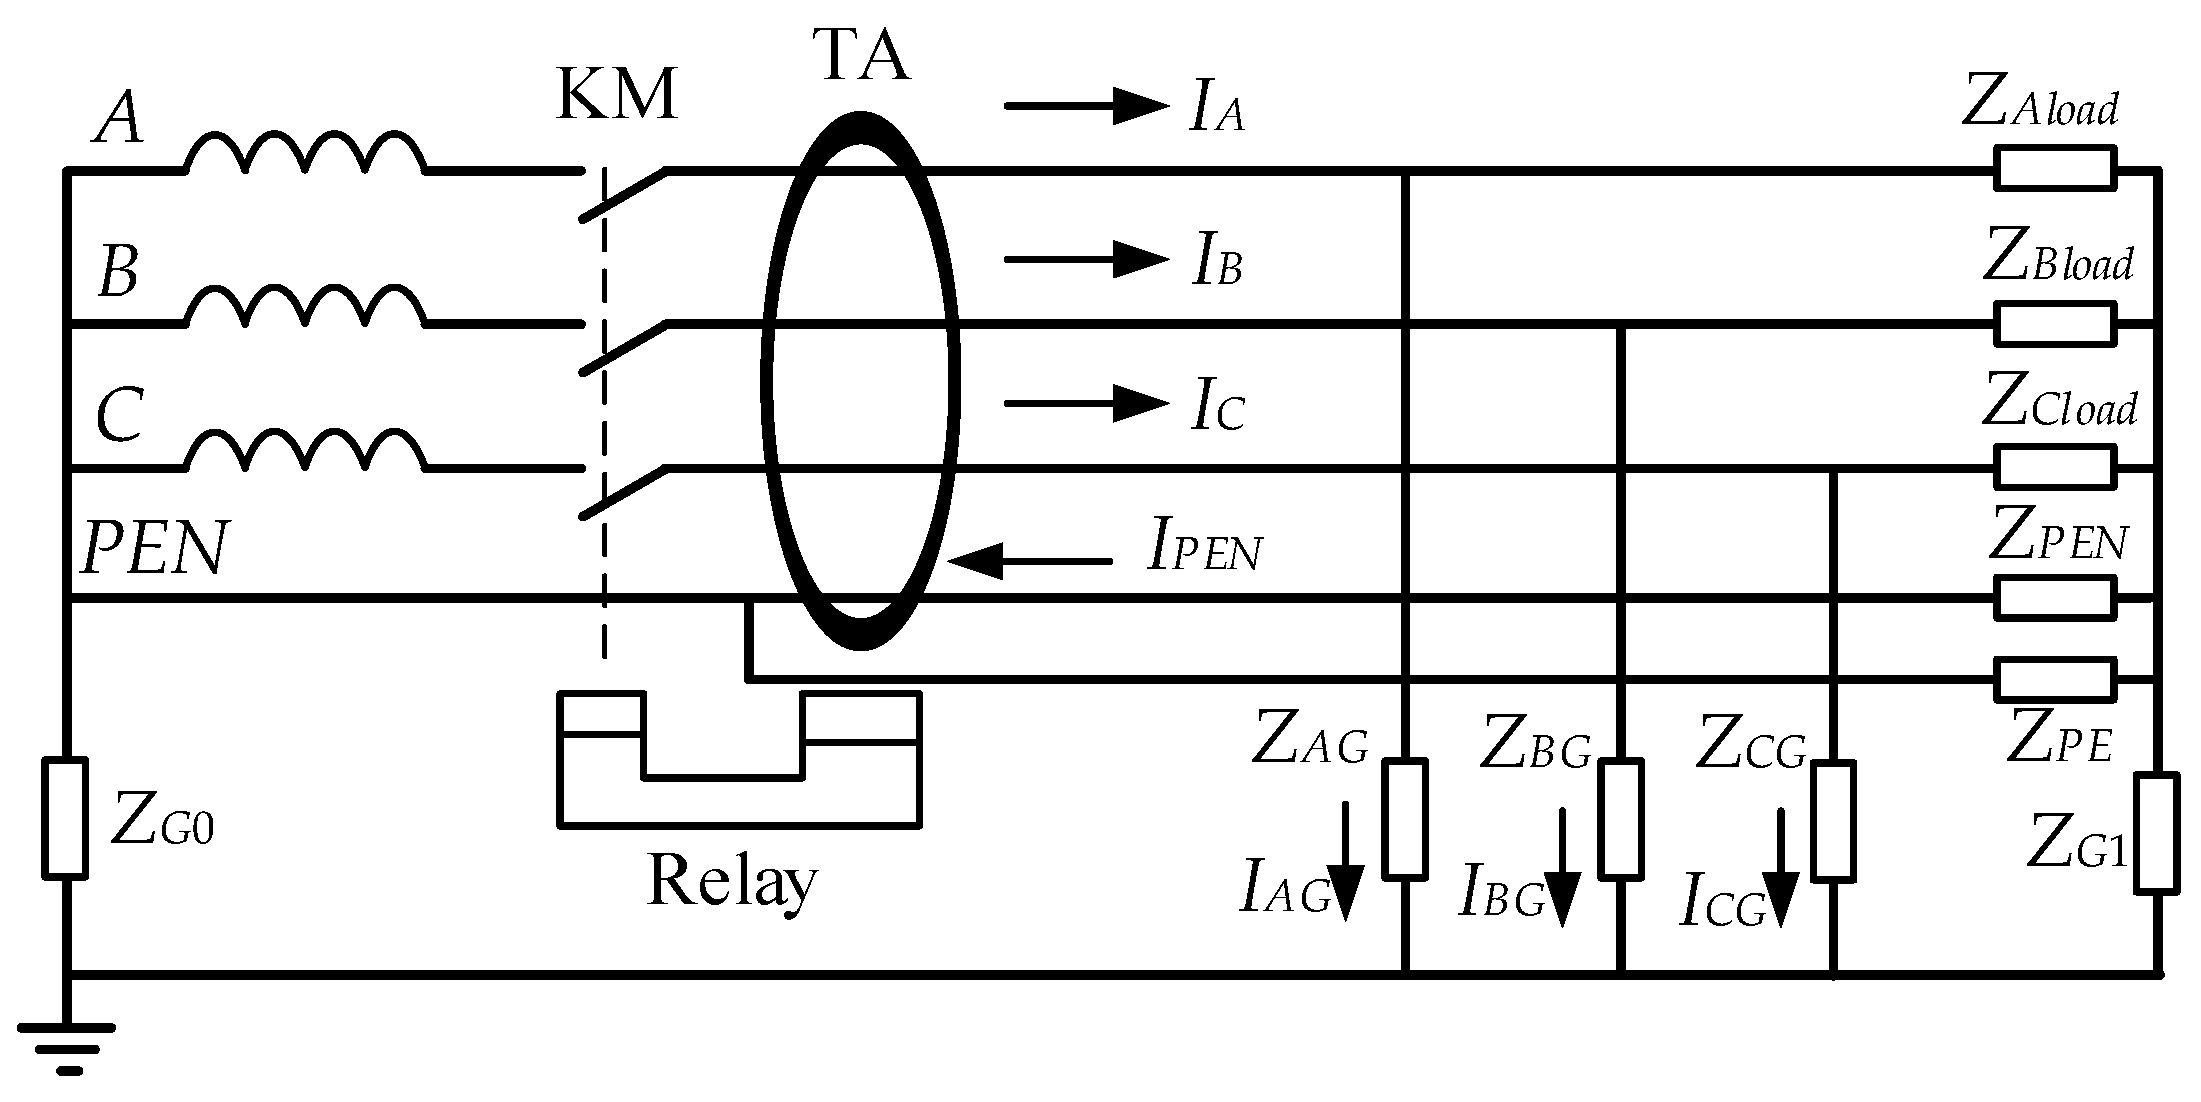
The International Electrotechnical Commission (IEC) classifies low-voltage distribution systems as the TN system, TT system, and IT system, according to whether the neutral point of the system and the load shell are effectively grounded [26]. Since the TN-C-S system is safer and more reliable, it is progressively replacing the TN-C system, and is widely used for low-voltage distribution systems in industrial and urban civil buildings. Therefore, this paper proposes a leakage protection method for the TN-C-S system. In the low-voltage distribution network, due to the distributed capacitance and ground conductance between the line and the ground, a small amount of current flows into the ground during normal operation, namely the normal leakage current. Figure 1 shows the generation of normal leakage current of a three-phase line and the principle of leakage protection. A, B, C, and PEN are the three-phase and PEN lines. I A , I B , I C , and I P E N are the three-phase and PEN line currents. Z A l o a d , Z B l o a d , and Z C l o a d are the three-phase loads. Z P E N and Z P E are the PEN and PE line impedances. Z A G , Z B G , and Z C G are the three-phase ground impedances, Z G 0 and Z G 1 are the impedance of the neutral point and the repeated ground point to ground, respectively. I A G , I B G , and I C G are the three-phase leakage currents. When a single-phase leakage fault occurs, the leakage current of TA (current transformer) is higher than the protection action set threshold, and switch KM is opened.
The leakage current can be divided into capacitive leakage current and conductance leakage current according to the cause, which can be expressed by the following equation (taking the A-phase as an example):
I A G = I C _ A + I G _ A ,  
where I C _ A is the capacitive leakage current of the A-phase, and I G _ A is the conductance leakage current of the A-phase.
Figure 2 shows the highest leakage current recorded by the leakage protector at the main switch of a 200 kVA distribution transformer somewhere at a certain period of time. The normal leakage current has a wide range of fluctuations, which are the result of a combination of factors.
Specifically, the capacitive leakage is generated by the distributed capacitance between the line and the ground. The capacitive leakage current is given by (2).
I C _ A = 2 π f C U A = f ε r S U A 2 k d ,  
where f is the frequency of the system voltage and ε r is the atmospheric dielectric constant, and its value is affected by environmental humidity, temperature, and insulation aging. S is the effective direct area of the line to the ground, which is determined by the outer diameter and length of the line. UA is the A-phase voltage, and its influence is mainly reflected in the line voltage drop caused by the load current. For rural power lines and power lines with long transmission distances and excessive loads, this voltage-drop value should be considered. k is the electrostatic force constant, and d is the height of the line.
In addition to the capacitance to the ground, there is a certain conductance between the line and the ground, and the conductance current generated is:
I G _ A = K S d U A ,  
where I G _ A is the conductance leakage current, and K is the conductivity.
Considering the large changes in atmospheric humidity, temperature, line aging, and line voltage, the normal leakage current may change greatly or even double, so it is necessary to adaptively adjust the protection action threshold, by establishing a prediction model of normal leakage current and training it with the collected data. After the training is completed, the prediction of normal leakage current can be obtained according to the input data and the corresponding protection action threshold can be adjusted.

3. Normal Leakage Current Prediction Model

3.1. Principle of Adaptive Action Threshold Adjustment

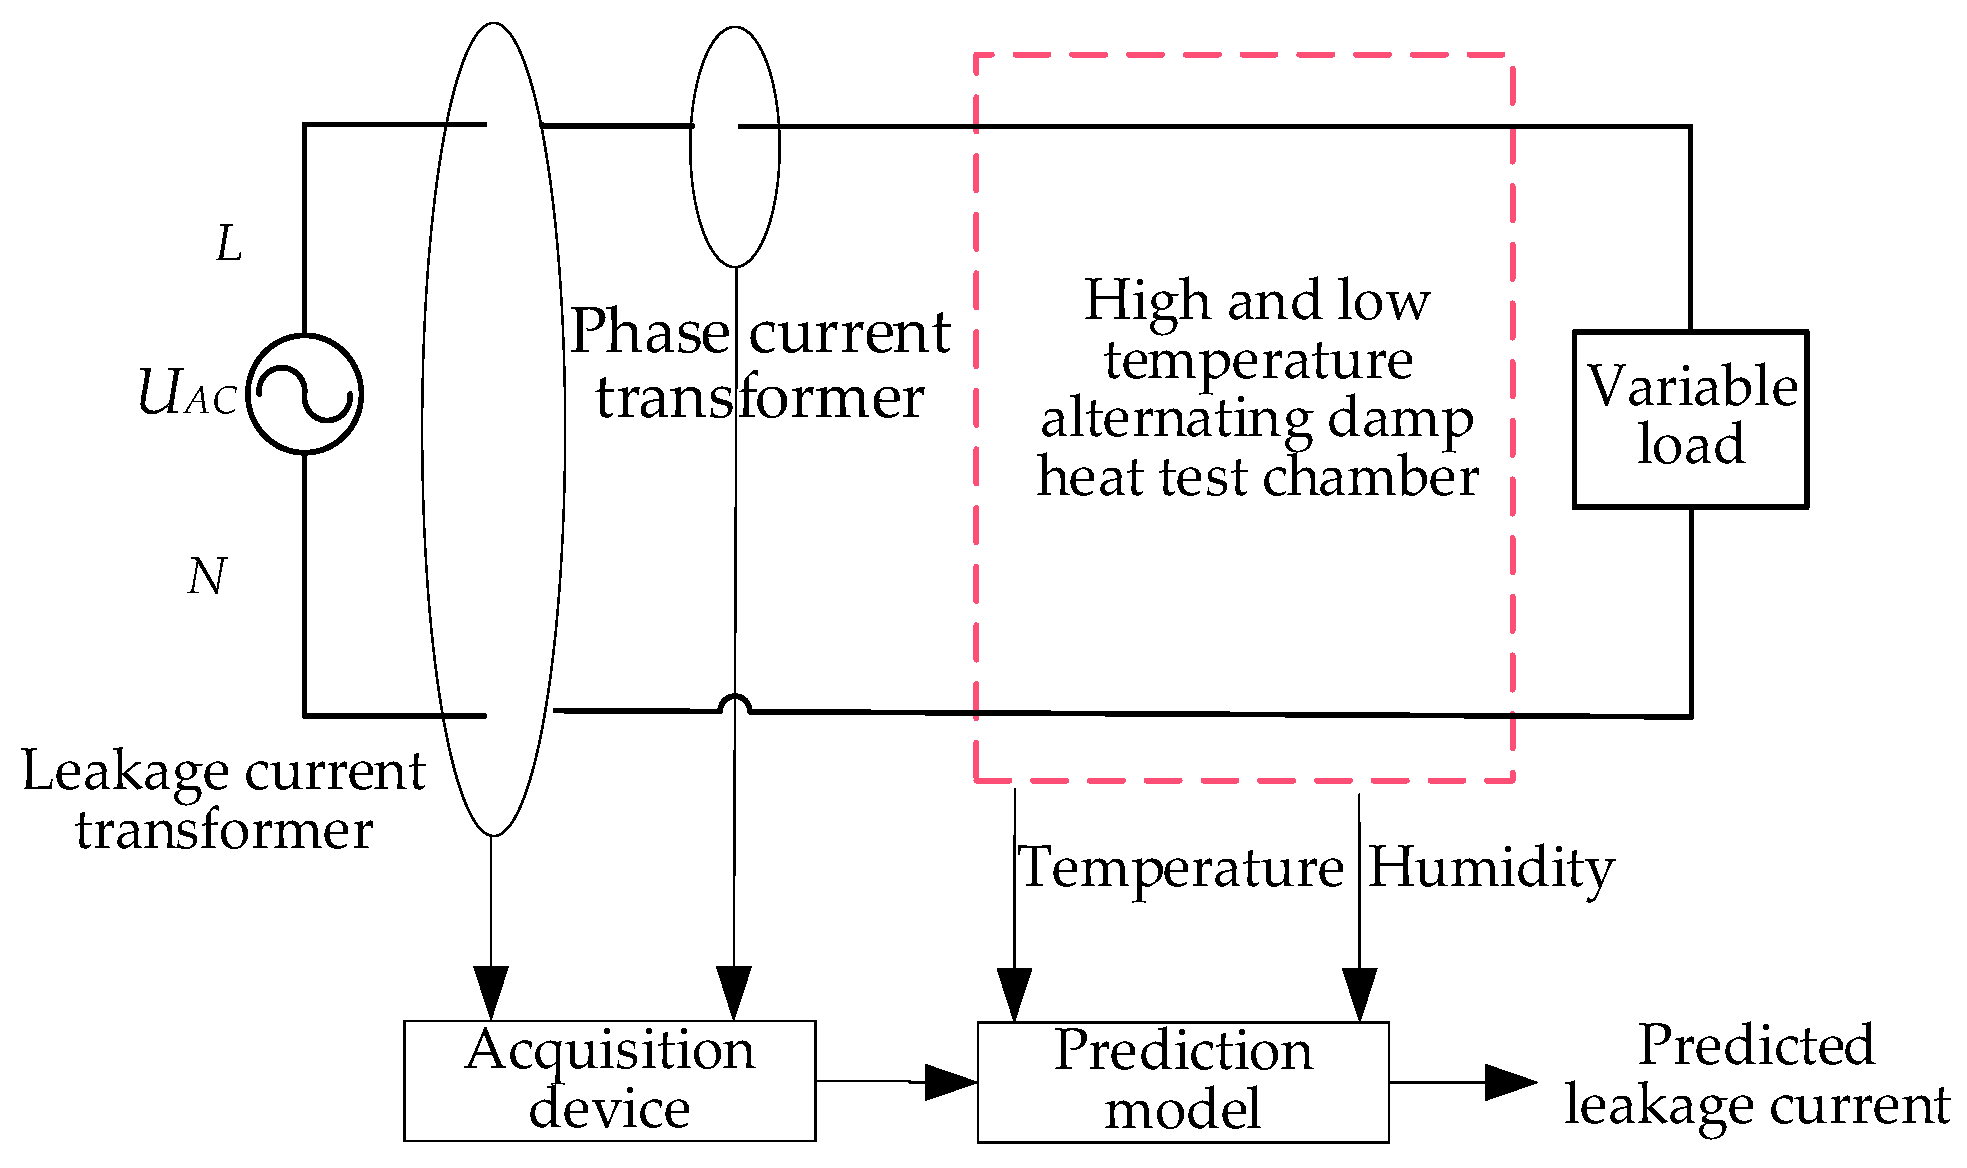
Figure 3 shows the schematic diagram of the leakage current prediction model considering the environmental humidity, temperature, and load current. By adding temperature, humidity, and current sensors to the existing leakage protector, the feature collection of the leakage current influencing factors of the system is realized. The leakage current after time T (predictive time length) is predicted using the actual leakage current of the system and its influencing factors as inputs for the prediction model. In order to rectify and optimize the system coefficient, the actual measured leakage after time T is compared with the predicted leakage. The optimal modeling is achieved after learning and correcting a certain number of samples.
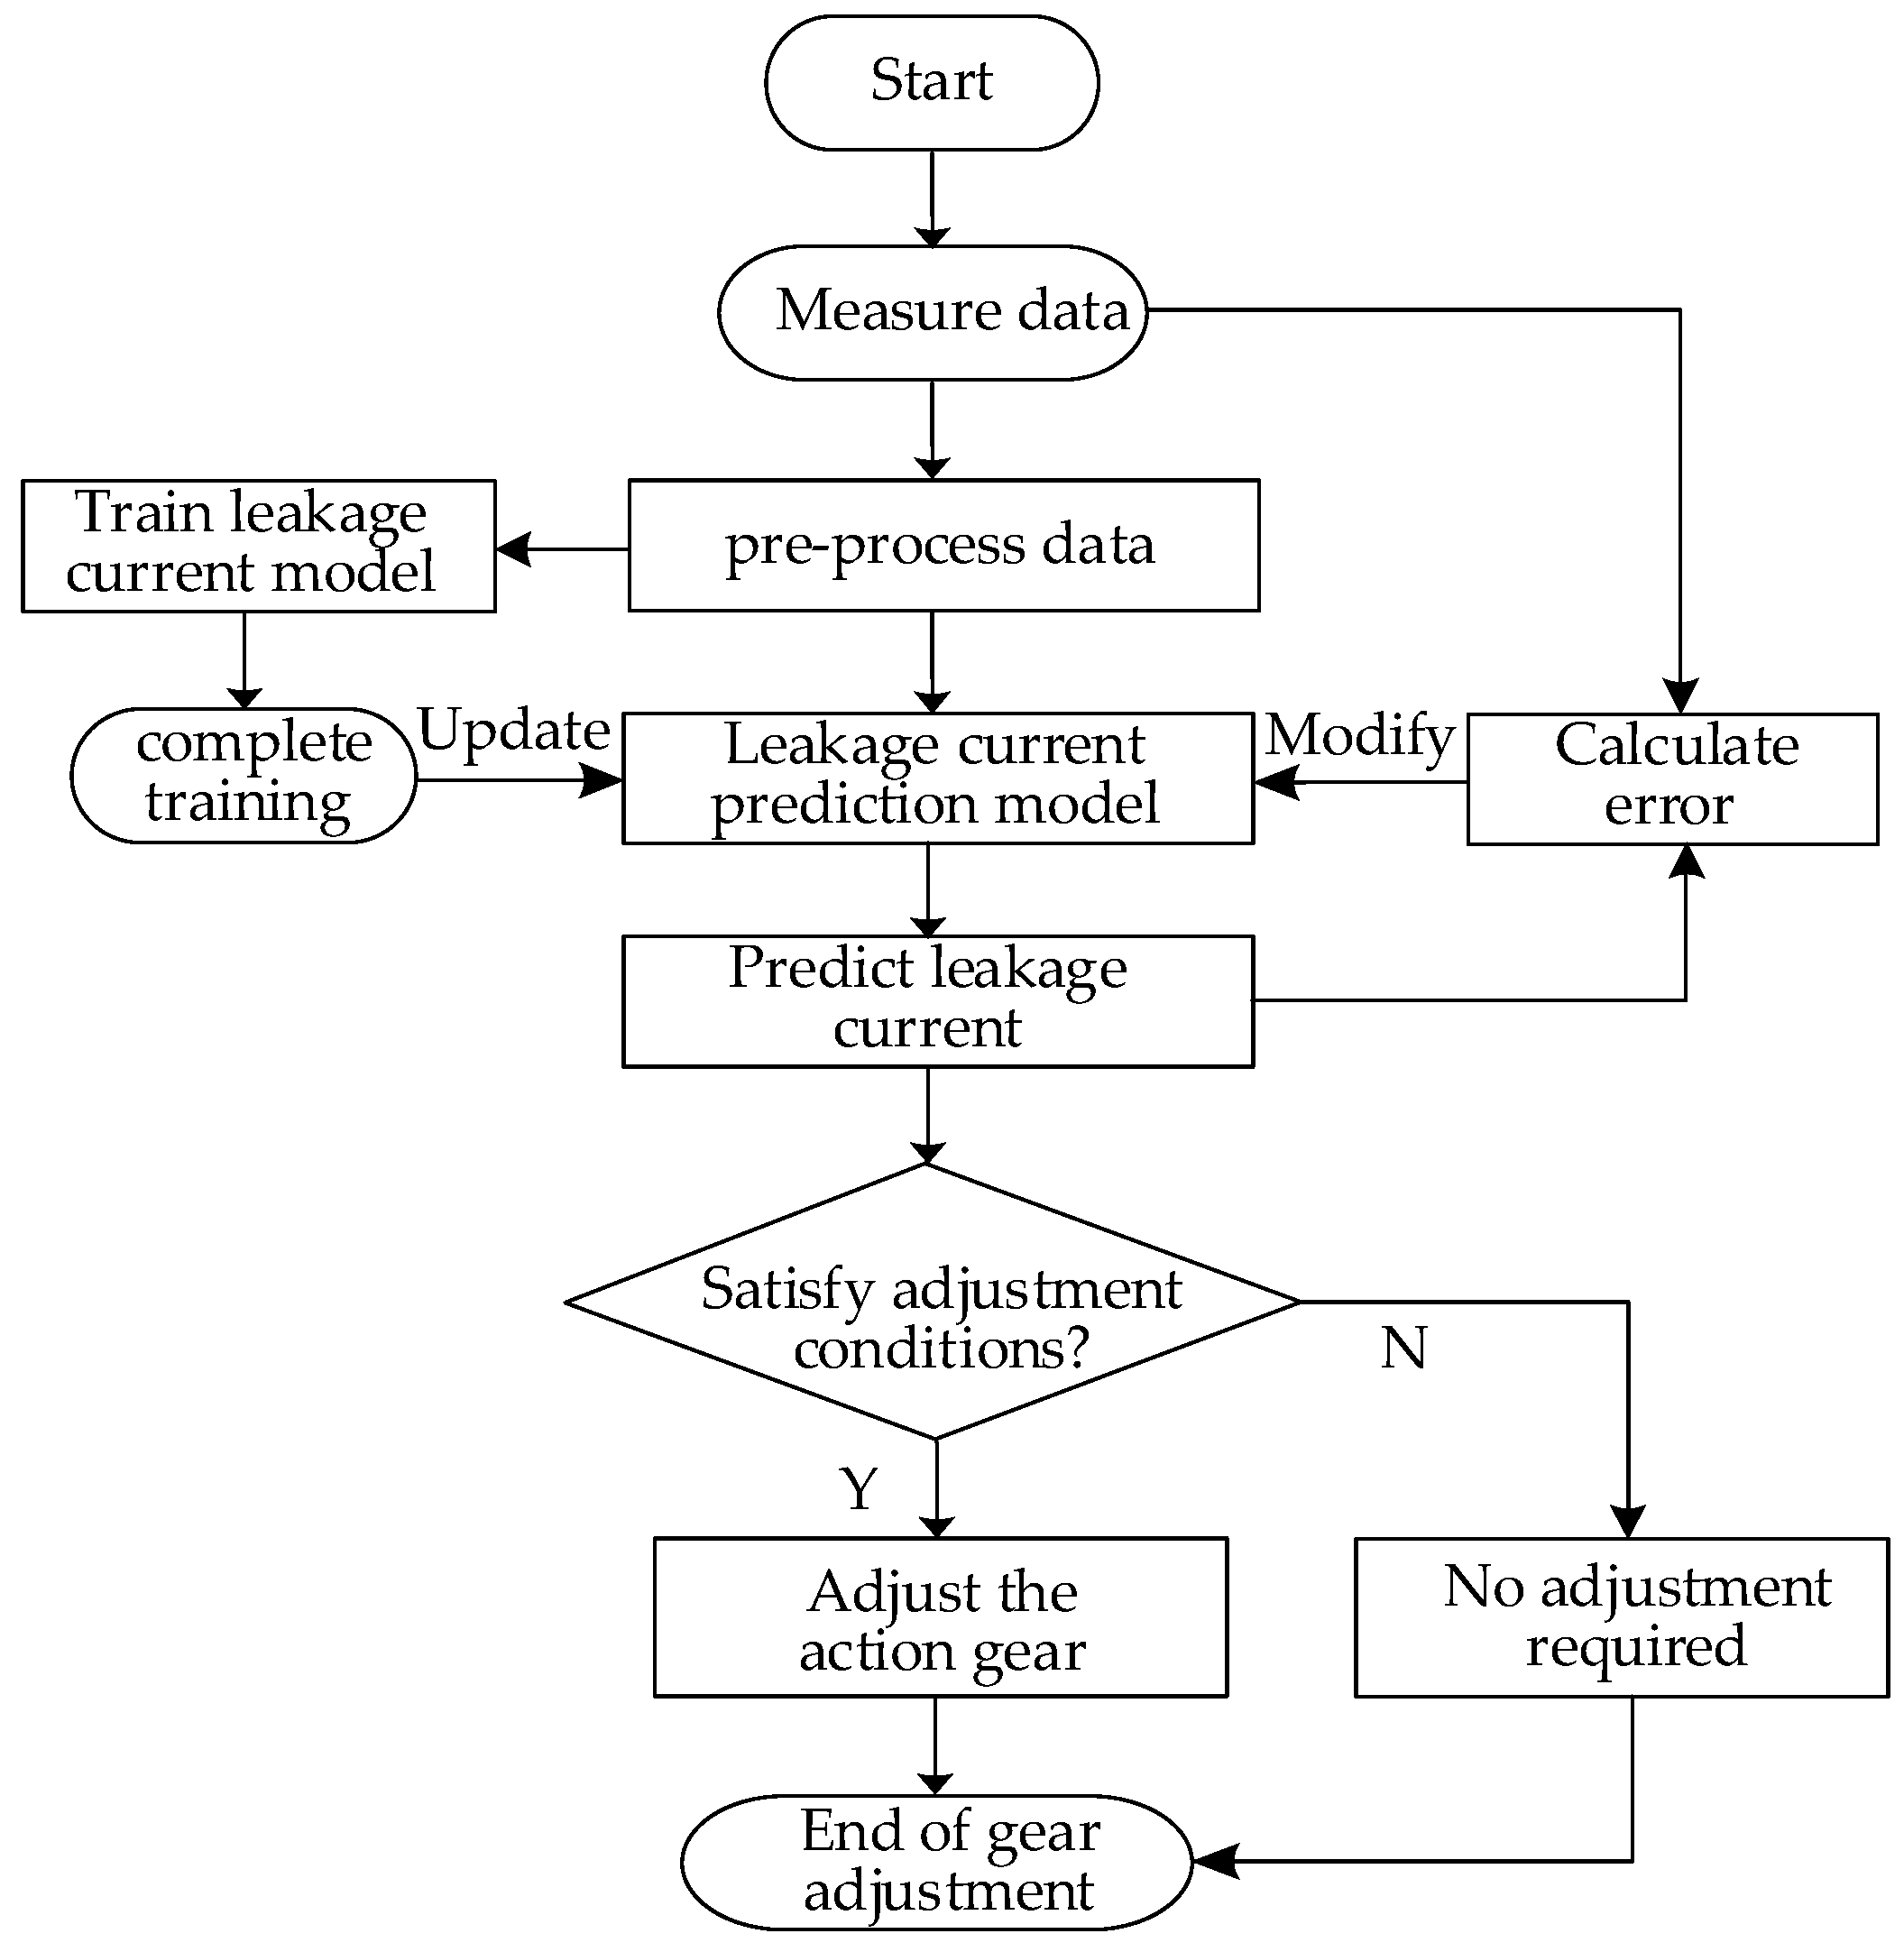
The flow chart of adaptive protection action threshold adjustment based on leakage prediction is shown as Figure 4. After preprocessing the collected characteristic data, they are sent to the leakage prediction model to train the unknown system to obtain the predicted leakage current. The measured leakage current is used as the expected value to correct the system parameters. After a period of multi-sample data learning and training, the model parameters are gradually improved, and the predicted leakage current gradually approaches the real leakage current.

3.2. Sparrow Algorithm Optimizes BP Neural Network Prediction

As the most typical deep learning method, the BP neural network [27,28,29] is widely used by many scholars to predict temperature, current, passenger flow, and so on. Therefore, this paper uses the BP neural network to construct a normal leakage current prediction model, taking the feature vector at the current moment as the input, and the prediction as the output. Figure 5 is a schematic diagram of the structure of the three-layer BP neural network model, where x i n represents the i (i = 1, 2, …, j) input of the n-th group of samples in the input layer, y n represents the predicted value corresponding to the n-th group of samples in the output layer, m n represents the actual measured value, e n is the error between the predicted value and the actual value, w i p is the weight coefficient between the input layer and the hidden layer, and w p is the weight coefficient between the hidden layer and the output layer. The unipolar S function is selected as the activation function of the neural network.
For the prediction model, the characteristic phasors I t , T t , H t , I A t , I B t , I C t are used as input, which represent the measured leakage current, temperature, humidity, and 3-phase load current at time t, respectively. The prediction of leakage current should be accurate and real-time. Thus, this method uses recursive prediction to input the characteristic quantity at time t and output the predicted leakage current at time t + 1, so as to obtain the prediction of leakage current.
The number of nodes in the hidden layer of the neural network will affect the accuracy of the prediction. By comparing different numbers of nodes, it is found that the prediction effect is the best when the number of nodes in the hidden layer is 12. Therefore, the structure of the BP neural network is determined to be 6–12–1, while setting the learning rate to 0.2.
Since the neural network optimizes the weight and threshold according to the negative gradient direction of the error function, convergence is slow, and it is easy to fall into the local optimum, which affects the performance of the BP neural network. In order to improve the prediction accuracy, SSA [30,31] is used to iteratively update the weight and threshold of the BP network. The fitness function of SSA is the minimum error value of the neural network. The optimal weight and threshold are obtained through SSA optimization, and the weight and threshold are assigned to the BP neural network. After several iterations, the nonlinear dynamic mapping ability of the BP network is improved.
The sparrow search algorithm is a bionic intelligent algorithm proposed based on the influence of two different behaviors of sparrows in the process of finding food. It has the characteristics of strong optimization ability, fast convergence, and high stability. Sparrows are separated into two groups when looking for food: the finders and the followers. The finder’s behavioral strategy is to find food for the whole sparrow population by providing the foraging area and direction of the population, and the follower’s behavioral strategy is to obtain food by observing and following the finder. All sparrows in the population can complete the search for food by performing both strategies. Moreover, sparrows in peripheral locations are vulnerable to attack and need to constantly update their locations to obtain optimal locations. In a sparrow population, once a sparrow finds a predator, a warning message is sent, and the group immediately flies away from the danger area.
Supposing there are M sparrows in N-dimensional space; each sparrow’s position is Pi = [pi1, pi2, …, piN] (i = 1, 2, …, M) and the fitness value is F = f [P1, P2, …, PM]. The SSA consists of three core parts, which will be introduced in the following paragraphs.
In the SSA, finders with the best fitness value preferentially access food and provide foraging direction for followers. Therefore, the finders acquired a higher foraging range than the followers. As the individual fitness values change, the sparrow role also changes, and during each such iteration the position of the finder changes, as shown as below:
p i d t + 1 = p i d t × e x p i α × i t e r m a x , R a l a m < R s a f e p i d t + Q × L , R a l a m R s a f e ,  
where p i d t + 1 is the d-th dimension position information of the i-th sparrow individual after the t-th iteration, i t e r m a x is the maximum number of iterations, α is a uniform random number between (0, 1], R a l a m means the alert value between [0, 1], and R s a f e is the safe value between [0.5, 1]. Q is a random number following a normal distribution. When R a l a m < R s a f e , it means that there is no danger nearby at this time, so the sparrows with higher fitness can obtain a supply of more abundant food. In other cases, it indicates that some sparrows sense danger signals and give a warning, while the rest seek food in new locations.
The update of the follower’s position is shown in Equation (5).
p i n t + 1 = Q × e x p p w n t p i n t i 2 , i > M / 2 p b n t + 1 + p i n t p b n t + 1 × A + × L , i M / 2 ,  
where t is the number of iterations, p b n t + 1 is the current best position of the finder, and p w n t is the worst position. A is a 1 × d matrix (element values are random numbers of 1 and −1), and A+ = AT(AAT)−1. When i > M/2, it means that the i-th sparrow did not obtain food, and needed to change strategy and fly to other areas for the food search; in another case, it represents that the i-th sparrow is foraging near the ideal position.
The number of alert sparrows is usually 10% to 20% of the total; the initial position of sparrow individuals is random, and its mathematical expression is as follows:
p i n t + 1 = p b n t + β p i n t p b n t , f i f b e s t p i n t + K d p i n t p w n t f i f b a d + e , f i = f b e s t ,  
where p b n t is the best position for sparrows in the current population. β is a random number obeying normal distribution (the mean value of β is 0, and the variance is 1), and the function of β parameter is to control the step size. Kd is a random number between [−1, 1], indicating the direction of sparrow movement, and also the step size control parameter. fi is the fitness value of the i-th sparrow. fbest and fbad represent the global highest and lowest fitness values of the current sparrow population, respectively. e is a constant to avoid a denominator of 0. When f i f b e s t , the sparrows at the edge of the population are very vulnerable to being hunted by predators. If f i = f b e s t , the sparrows have already sensed that the danger is approaching, and they will reduce the risk of being hunted by approaching other sparrows.

3.3. Data Pre-Processing

The input feature vector includes the environmental temperature, humidity, leakage current, and 3-phase current. In order to ensure the validity and typicality of the sample data, it is necessary to preprocess the input, which specifically includes two aspects:
(1) Make sure that the leakage current measured is normal leakage current rather than fault current. The influence of environmental factors on the normal leakage current of the line is a slow-changing process that takes tens of minutes or even several hours, so the adjacent cycle currents have a high degree of similarity. Unlike the normal leakage current, there is a short transient state when the leakage fault occurs, and its duration ranges from several milliseconds to several cycles. Therefore, the similarity coefficient of two adjacent cycle waveforms can be used to distinguish the two types of leakage current. When the leakage current is identified as the fault leakage current, the subsequent data will no longer be used as training data. In this paper, the Pearson similarity coefficient is used, and the leakage current similarity coefficient of the n-th adjacent cycle is defined as follows:
r k ( n ) = j = 1 M x k j x k ¯ x k n j x k n ¯ j = 1 M x k j x k ¯ 2 k = 1 M x k n j x k n ¯ 2 = x k x k n ¯ x k ¯ × x k n ¯ x k 2 ¯ x k ¯ 2 x k n 2 ¯ x k n ¯ 2 ,  
where xk is the leakage current, M is the number of sampling points in one cycle, and x k ¯ is the average value of xk one cycle.
In practice, since the signal measured by the leakage sensor is an alternating current signal, both x k ¯ and x k n ¯ are 0, and Equation (7) is simplified as:
r k ( n ) = x k x k n ¯ x k 2 ¯ x k n 2 ¯ ,  
(2) Ensure the typicality of the training data. The collected environmental temperature, humidity, and load current are all continuous data. It is not necessary to use all the sampled data when selecting the training samples, and the method of sampling every other time period can be adopted. The method in this paper acquires sampling data every 1 min. In addition, due to the different units of the input parameters and the large difference in range, in order to ensure the convergence speed of the neural network and improve the prediction accuracy, the data needs to be normalized. In order to normalize the input data into [0, 1], the specific Equation is:
x i n = d i n d m i n n d m a x n d m i n n ,  
where x i n is the normalized data, d i n is the measured data, d m a x n and d m i n n are the maximum and minimum values in the n-th input sample data, respectively.

3.4. Prediction Model Training

The sparrow algorithm is used to iteratively update the weight and threshold of the BP neural network, and the minimum error value of the neural network is the fitness function of the sparrow algorithm. The sparrow algorithm obtains the ideal weight and threshold, and it assigns the weight and threshold to the BP neural network. The specific training steps are as follows:
Step 1: Initialize the weights and biases of each layer and set the basic parameters of the BP neural network.
Step 2: Initialize the parameters of the sparrow search algorithm, including the number of sparrow populations, the maximum number of iterations, the upper and lower limit of the independent variable, the dimension, and the sample data.
Step 3: According to the input parameters, calculate the output of node p (p = 1, 2, …, j) in the input layer.
h i d p n = i = 1 j w i p x i n + a p .  
Step 4: Calculate the output of hidden layer node p as
o u t p n = f h i d p = 1 1 + e x p i = 1 j w i p x i n a p .  
Step 5: Similarly, the output of the output layer is
y n = f o u t p n = 1 1 + e x p p = 1 z w p o u t p n b .  
In (11) and (12), a p and b are the thresholds.
Step 6: The error of the predicted value can be expressed by the following Equation:
e n = y n m n .  
Step 7: The error in the training result is taken as the fitness value, and the current position of the sparrow is obtained according to the fitness value.
Step 8: The SSA fitness value is updated according to the better position obtained above. Update the values of w i p and w p using Equations (14) and (15).
w i p = w i p + η x i n o u t p n 1 o u t p n p = 1 z w p e n .  
w p = w p + η o u t p n e n .  
In (14), η is the learning rate.
Step 9: The thresholds of the hidden and the output layers will also be updated as
a p = a p + e n .  
b = b + η o u t p n 1 o u t p n p = 1 z w p e n .  
Step 10: If the newly obtained fitness value is less than the original value, it means the new position is better, and the value is updated; otherwise, the current value is kept unchanged.
Step 11: If the fitness value is less than the set threshold, the termination condition is satisfied. At the same time, the optimal fitness value satisfying the condition is output, as well as the corresponding weight and threshold, in this case. Otherwise, the number of iterations is increased by 1, and the execution jumps to Step 7.
Step 12: According to the optimal weight and threshold, the network model parameters are obtained, and the BP network architecture is determined by using the parameters.
Step 13: The data that needs to be predicted are input to the optimized model for normal leakage current prediction.
Step 14: Output the prediction results in the form of curves.
The overall fitness showed a downward trend, and reached the minimum value of 0.0168 at 18 times after 50 iterations of evolution, which demonstrated that the SSA algorithm can optimize the initial value of the weight and threshold of the BP neural network algorithm with low overhead.
Table 1 shows the minimum relative error value, maximum relative error value, and mean squared error value between the SSA-BP algorithm and the traditional BP neural network algorithm. ‘MIRE’ represents the minimum relative error, ‘MARE’ represents the maximum relative error, ‘MSE’ represents the mean squared error. The MSE of the SSA-BP algorithm is 0.0095, the MIRE is 0.0017, and the MARE is 0.1852. According to the error theory principle of the evaluation algorithm in econometrics, controlling the error within the range of 20% is a better prediction algorithm. Through the comparison, it can be seen that the prediction algorithm in this paper has a better effect.

4. Adaptive Leakage Protection Strategy

Adaptive leakage protection is the process of adjusting the action threshold of protection adaptively, according to the change in normal leakage. For the leakage protectors of the amplitude comparison method and the phase detection method widely used in China at present, under the premise of ensuring the normal operation of the leakage protector, reducing the action setting of the current can improve the protection sensitivity.
The basic principle of realizing adaptive leakage protection is that when the leakage current is higher than the leakage action threshold, the leakage protection is performed; when the leakage current is within the limit range, the leakage action threshold remains unchanged; and when the leakage current exceeds the specified limit range, and the duration is longer than a certain time, the leakage action threshold is adjusted.
The operating range of the leakage protector is divided into n + 1 intervals, and the leakage protection action threshold I Δ d is determined according to the predicted normal leakage current I Δ . The setting is adjusted according to Equation (18).
I Δ d = I Δ d 0 ,       I Δ < I Δ H 0 I Δ d k ,       I Δ I Δ L k , I Δ H k I Δ d n ,       I Δ > I Δ L n ,  
where k = 1, 2, …, n, I Δ d 0 and I Δ d n are the lowest and highest gears, respectively, I Δ H k and I Δ L k are the upper and lower limits of the current in the k-th interval, respectively.
Leakage interval switching rules should meet
I Δ d = I Δ d v 1 ,       I Δ < I Δ L v   a n d   t > Δ t I Δ d v ,                   I Δ L v < I Δ < I Δ H v ,   o r   I Δ < I Δ L v   a n d   t Δ t ,   o r   I Δ d v > I Δ > I Δ H v   a n d   t Δ t I Δ d v + 1 ,       I Δ d v > I Δ > I Δ H v   a n d   t > Δ t ,  
where v = 0, 1, …, n, t is the duration, when I Δ I Δ d v , the leakage protector triggered.
When the leakage action threshold is in the maximum or minimum value range, the action threshold can only be adjusted to one side or remain unchanged; that is, when the leakage action threshold is I Δ d 0 , the action threshold can only be increased or remain unchanged, and when the action threshold is I Δ d n , the action threshold can only decrease or remain unchanged. When the action threshold is in the non-maximum or non-minimum interval, the action threshold has three possibilities: increasing, decreasing, or remaining unchanged. In order to avoid frequent switching of leakage current action intervals caused by the leakage current floating near the critical point of the interval, a partial overlapping area between adjacent intervals is set. The duration of the transient process of leakage faults is short, and they will reach a steady state within a few milliseconds. However, considering that the duration of very few faults is relatively long, without loss of generality, Δ t is more appropriate to take 1 min as the duration.

5. Experimental Verification

5.1. Leakage Current Prediction Experiment

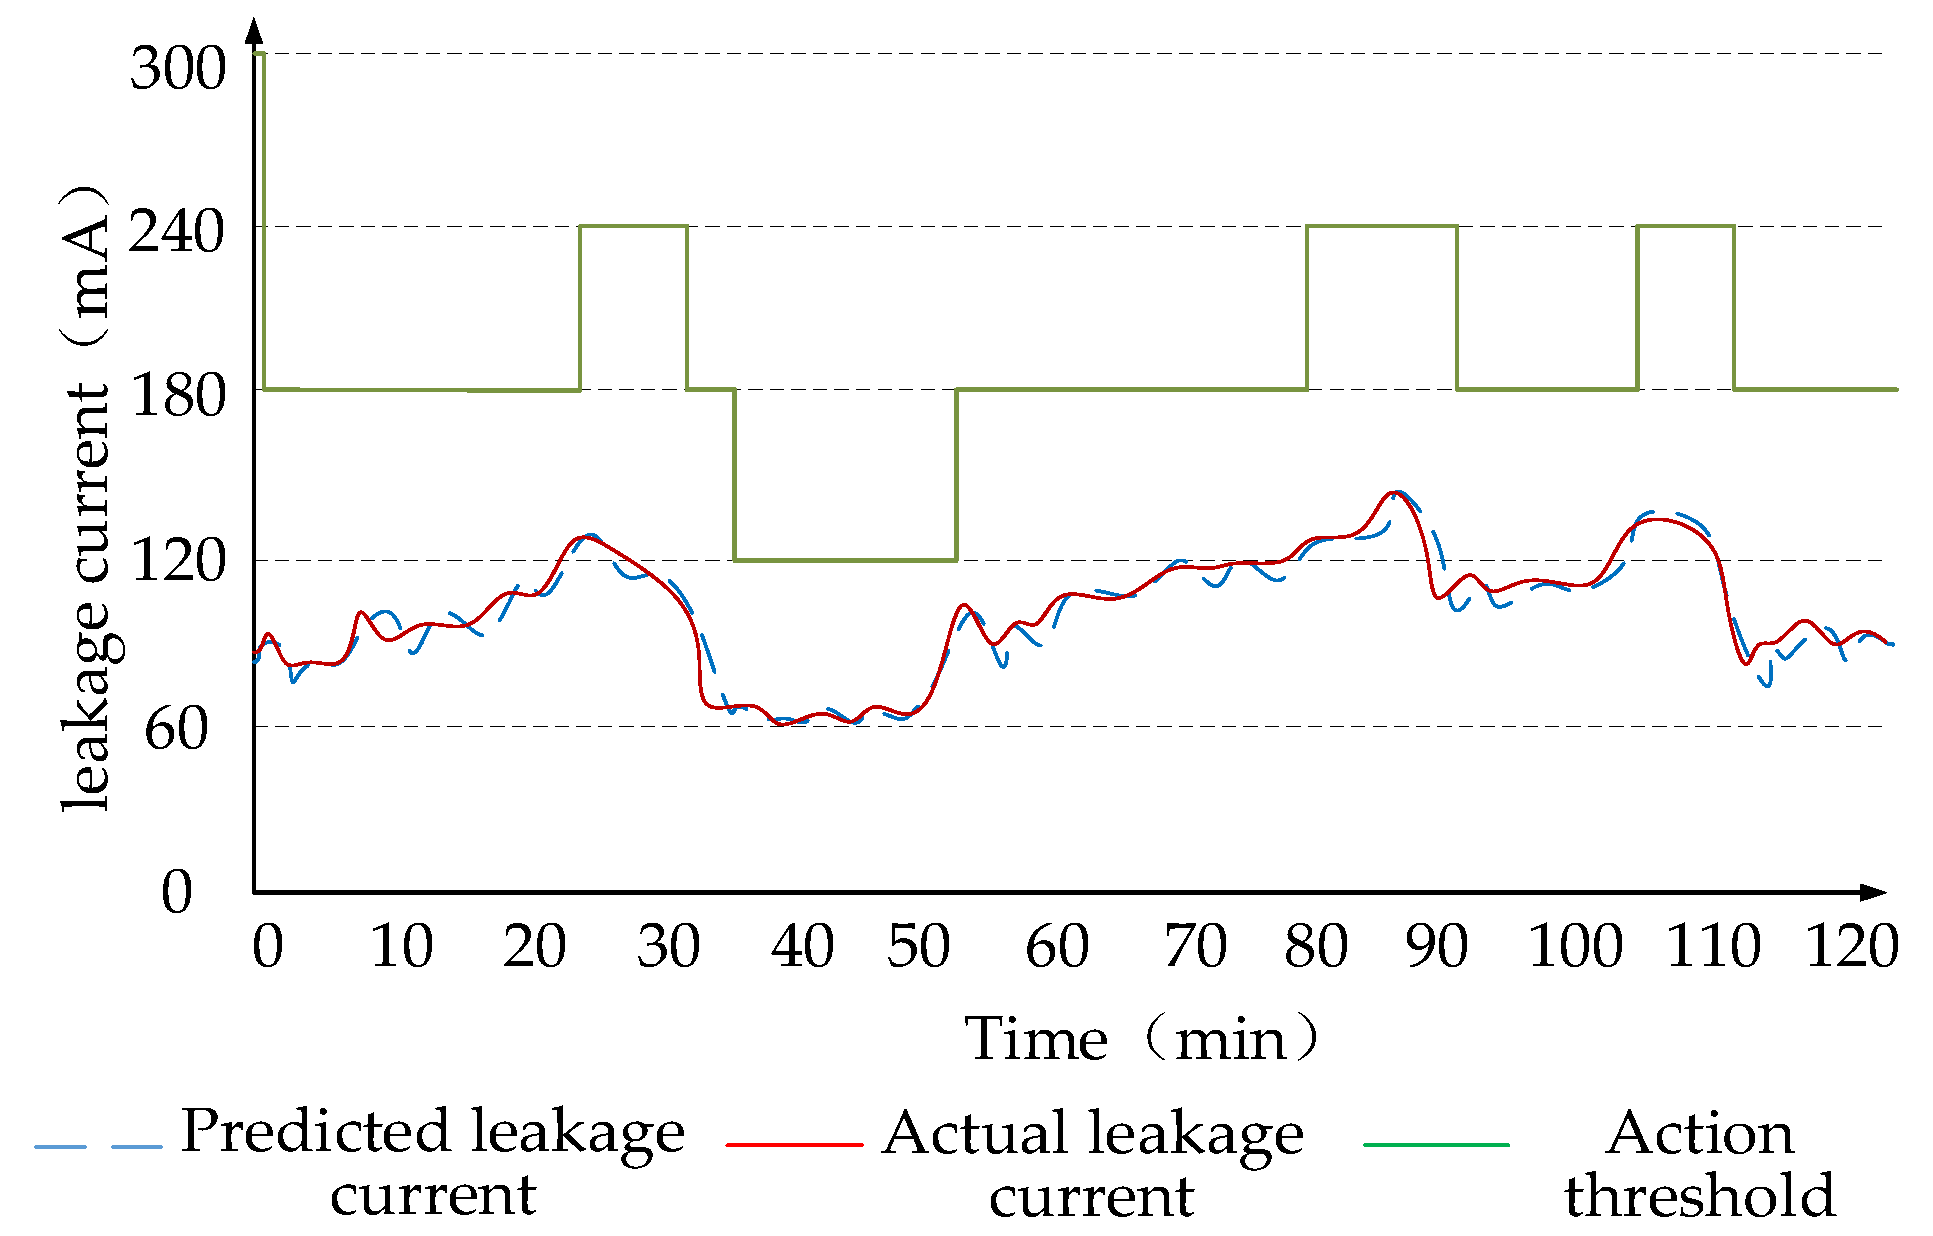
To verify the feasibility of the method, the closed experimental system depicted in Figure 6 was constructed. The experiment selects 100 m of polyvinyl chloride insulated line with an inner diameter of 1.5 mm2, using 1000 nF capacitance and 100 kΩ resistor-equivalent line-to-ground capacitance and resistance, and using a high- and low-temperature-alternating humidity and heat test chamber to change the environmental temperature and humidity. A combination of 100~2000 W incandescent lamps is used as a load to generate different load currents. The test chamber is controlled to generate a temperature of −40~40 °C and a humidity environment of 20~100%. The load is changed so that the line carries a load current of 0.5~10 A, and the current of the transformer, and the current of the current transformer, the temperature, and humidity of the test chamber are recorded. The data sampling interval time was 1 min and the comparison of the predicted leakage with the actual leakage is shown in Figure 7. Figure 7 demonstrates that the trajectory of the prediction is in good agreement with the normal leakage current, which can accurately show the trend of the normal leakage. The prediction error is less than 5%, which satisfies the accuracy requirements of adaptive adjustment of the action threshold.

5.2. Adaptive Protection Test

If the fluctuation range of the normal leakage current is large and the interval is small, the gears will be switched frequently; if the fluctuation range of the normal leakage current is small and the interval is large, the effect of adaptive adjustment will not be obvious. Therefore, the normal leakage current division interval should comprehensively consider the fluctuation range of the normal leakage current and the complexity of gear adjustment. Taking the maximum normal leakage current range of 200 mA as an example, it is appropriate to divide it into five intervals: [0, 40], [30, 80], [70, 120], [110, 160], and [150, 200]. The action thresholds of the corresponding leakage intervals are set to 60 mA, 120 mA, 180 mA, 240 mA, and 300 mA, respectively. Figure 7 depicts the adjustment curve of the protection action threshold. The brown, purple, orange, and green dashed lines represent 1, 2, 3, and 4 intervals of gear adjustment, respectively.
In general, the normal leakage current changes relatively slowly. Although the integration of the SSA-BP neural network has a higher computational complexity than that of a single BP neural network, the efficiency of this model will not be affected, due to the lower real-time requirement of leakage current prediction. In most cases, the method of gear adjustment is to switch between two adjacent gears. If the leakage current changes greatly, it can also be switched across intervals. Figure 8 shows the comparison between the predicted leakage current and the actual leakage current in a certain period of time, and the gear switching process. The specific process of gear switching will be described below, in conjunction with Figure 7.
(1)
The leakage action threshold automatically selects the highest level at the beginning of the algorithm running, that is, the 300 mA gear. However, the leakage current at this time is 83 mA, which is less than the lower limit of the highest gear (150 mA), and there is no situation exceeding [70, 120] within the next 1 min, so the leakage action threshold is lowered to the 180 mA gear after 1 min.
(2)
During the period of 1~23 min, the predicted leakage current does not exceed the leakage interval of [70, 120], and the protection action threshold remains unchanged.
(3)
At 23 min, the leakage current was 121 mA, which was greater than the upper limit of the original leakage interval (120 mA), and did not return to the original interval within 1 min. In this case, the gear upward adjustment condition is met, and the action gear is adjusted to the fourth gear, which corresponds to a change in the action threshold to 240 mA.
(4)
In the period of 24~32 min, the predicted leakage current does not exceed the interval of [110, 160], and the protection action threshold remains unchanged.
(5)
At 32 min, the leakage current value was 109 mA, which was less than the lower limit of the original interval of 110 mA, and did not return to the original interval within 1 min. In this instance, the action gear was adjusted to the third gear. That is, the action threshold is 180 mA. Afterwards, gear shifting continues to be performed according to the rules of Equation (19).
A variety of leakage current changes were simulated in the test, and the floating of the leakage action threshold was consistent with the design. Effective leakage protection can be performed no matter which gear the normal leakage current is in. The operation availability and accuracy of the leakage protector with an adaptive action threshold have been enhanced in comparison to the leakage protector with a fixed action threshold. The ratio of protector activation and leakage fault identification accuracy of the leakage protection device has been increased from less than 50% to over 90%. In addition, because the action threshold of adaptive leakage protection is always set at the lowest level to ensure the normal operation of the leakage protector, it is more sensitive to identifying low fault currents generated by high-resistance ground faults (more than 5 kΩ). It will effectively reduce the occurrence of personal electric shock accidents and generate great value for the low-voltage leakage protection industry. The leakage prediction accuracy and protection reliability with the access of distributed generations need further research [32,33].

5.3. Compared with Other Methods

A comparison between the method proposed in this paper and the traditional leakage protection methods is shown in Table 2. The adaptive leakage current detection method based on VMD-DFNN can cope with the change in normal leakage current and realize the full adjustment of the protection action threshold. The adaptive leakage protection based on fuzzy logic can realize the adjustment of normal leakage value in the range of −30% to 20%. These two methods have neither an action-threshold grading setting and nor do they involve the threshold adjustment in advance. In contrast, the method in this paper acts according to the normal leakage current, and there is no action dead zone. Therefore, the proposed method has higher reliability and protection effects.

6. Conclusions

(1)
In this paper, the influencing factors of normal leakage current change are analyzed, and it is found that the normal leakage current of the line is affected by the environmental temperature, humidity, aging, and line voltage drop, and that the normal leakage current may change greatly or even double under multi-factor extreme conditions.
(2)
The SSA-BP neural network is used to build a prediction model of normal leakage current, and the model is trained based on the current and historical data collected. In the leakage protection experiment, the prediction accuracy is more than 95%, and the operation rate and action accuracy of the leakage protection device are more than 90%. It is verified that the predicted results can be used as a reference for the development trend of a normal leakage current.
(3)
The predicted leakage current is used to adjust the protection action threshold in advance, which improves the action accuracy of the leakage protector. It not only ensures the operation availability of the leakage protector, but also makes the leakage protector more sensitive in identifying the high-resistance ground leakage fault. In future work, we will explore the impact of input data quality on prediction accuracy and how to improve the accuracy of leakage prediction by improving data quality.

Author Contributions

Conceptualization, Z.L. and W.J.; methodology, H.Y.; experiment, Z.L., H.Y. and W.J.; formal analysis, Z.L.; investigation, W.J.; resources, Z.L.; data curation, H.Y.; writing—original draft preparation, Z.L.; writing—review and editing, Z.L. and H.Y.; visualization, H.Y.; supervision, W.J.; project administration, W.J. All authors have read and agreed to the published version of the manuscript.

Funding

This research received no external funding.

Institutional Review Board Statement

Not applicable.

Informed Consent Statement

Not applicable.

Data Availability Statement

Not applicable.

Conflicts of Interest

The authors declare no conflict of interest.

References

  1. Wang, Z.; Zeng, X.; Yu, K.; Li, Z.; Zhao, Z.; Zhuo, C.; Li, L. A leakage protection method for low-voltage power supply systems based on flexible regulation of the neutral point voltage. Int. J. Electr. Power Energy Syst. 2023, 151, 109157. [Google Scholar] [CrossRef]
  2. Liang, Y. New Idea of the Multilevel Leakage Protection in Underground LV Distribution Networks. Adv. Mater. Res. 2011, 383–390, 1481–1487. [Google Scholar] [CrossRef]
  3. Zhang, X.; Han, X. Study on a New Low-Voltage Residual Current Protective System. Adv. Mater. Res. 2013, 694–697, 822–825. [Google Scholar] [CrossRef]
  4. Cheng, D.; Zhang, B.; Xiong, S.; Xie, Z.; Xue, Z. Residual Current Detection Prototype and Simulation Method in Low Voltage DC System. IEEE Access 2022, 10, 51100–51109. [Google Scholar] [CrossRef]
  5. Fabio, F. High-Frequency Behavior of Residual Current Devices. IEEE Trans. Power Deliv. 2012, 27, 1629–1635. [Google Scholar]
  6. IEC Standard 60947-2; Effects of Current on Human Beings and Livestock—Part 2: Circuit Breaker Incorporating Residual Current Protection. IEC: Geneva, Switzerland, 2009.
  7. IEC Standard 60755; General Requirements for Residual Current Operated Protective Devices. IEC: Geneva, Switzerland, 2008.
  8. Li, K.; Lin, J.; Niu, F.; Wang, Y.; Li, Q.; Guo, Z.; Wu, Y. A Novel Fault Leakage Current Detection Method with Protection Deadzone Elimination. IEEE Trans. Instrum. Meas. 2021, 70, 3505009. [Google Scholar] [CrossRef]
  9. Sutaria, J.; Espin-Delgado, A.; Ronnberg, S. Measurements and modeling of the frequency behavior of residual current devices- from 4 Hz to 40 kHz. Electr. Power Syst. Res. 2022, 209, 108052. [Google Scholar] [CrossRef]
  10. Möller, F.; Blanco, A.M.; Meyer, J. Characteristic leakage current of household devices and their impact on the tripping behaviour of residual current devices. Electr. Power Syst. Res. 2023, 214, 108832. [Google Scholar] [CrossRef]
  11. Liyana, I.; Bin Hanaffi, F.; Bin Hairi, M.H. A Study on Residual Current Device Nuisance Tripping Due to Grounding Resistance Value. In Proceedings of the 2019 5th International Conference on Electrical, Control and Computer Engineering (ICECCE), Kuantan, Pahang, Malaysia, 29 July 2019; Volume 632, pp. 717–723. [Google Scholar]
  12. Czapp, S. Testing Sensitivity of A-Type Residual Current Devices to Earth Fault Currents with Harmonics. Sensors 2020, 20, 2044. [Google Scholar] [CrossRef] [Green Version]
  13. Czapp, S.; Tariq, H. Behavior of residual current devices at frequencies up to 50 kHz. Energies 2021, 14, 1785. [Google Scholar] [CrossRef]
  14. Han, X.; Sheng, W.; Du, S.; Su, J.; Liu, G. Novel protection scheme for residual current device-based electric fault time detection and touch current identification. IET Gener. Transmiss. Distrib. 2017, 11, 2478–2488. [Google Scholar] [CrossRef]
  15. Han, X.; Du, S.; Li, Z.; Sun, L. Diagnosis of electric shock fault based on time-frequency singular value spectrum of leakage current and fuzzy clustering. Nongye Gongcheng Xuebao/Trans. Chin. Soc. Agric. Eng. 2018, 34, 217–222. [Google Scholar]
  16. Jedsada, S.; Nattapan, T. Earth leakage current detection and identification scheme for a single-phase low-voltage electrical appliance system using frequency domain analysis. In Proceedings of the 2016 13th International Conference on Electrical Engineering/Electronics, Computer, Telecommunications and Information Technology (ECTICON), Chiang Mai, Thailand, 28 June–1 July 2016; Volume 1, pp. 1–4. [Google Scholar]
  17. Zhang, X.; Liu, Z.; Wang, Y.; Dou, Z.; Zhai, G.; Wei, Q. Residual Current Detection Method Based on Variational Modal Decomposition and Dynamic Fuzzy Neural Network. IEEE Access 2021, 9, 142925–142937. [Google Scholar] [CrossRef]
  18. Li, Y.; Xia, C.; Zhuang, Y.; Huang, S. Research on Residual Current Warning Technology Based on Big Data Analysis. In Proceedings of the 2021 International Conference on Power Electronics and Power Transmission (ICPEPT 2021), Xi’an, China, 15–17 October 2021; Volume 1, pp. 1–6. [Google Scholar]
  19. Li, C.; Su, J.; Du, H.; Xia, Y.; Zhang, J.; Zhang, L. Detecting model of electric shock signal based on wavelet analysis and BP neural network. Trans. CSAE 2010, 26 (Suppl. S2), 130–134. [Google Scholar]
  20. Bento, P.M.R.; Pombo, J.A.N.; Calado, M.R.A.; Mariano, S.J.P.S. A bat optimized neural network and wavelet transform approach for shortterm price forecasting. Appl. Energy 2018, 210, 88–97. [Google Scholar] [CrossRef]
  21. Behrends, H.; Millinger, D.; Weihs-Sedivy, W.; Javornik, A.; Roolfs, G.; Geißendörfer, S. Analysis of Residual Current Flows in Inverter Based Energy Systems Using Machine Learning Approaches. Energies 2022, 15, 582. [Google Scholar] [CrossRef]
  22. Huang, B.; Liu, L.; Zhang, H.; Li, Y.; Sun, Q. Distributed Optimal Economic Dispatch for Microgrids Considering Communication Delays. IEEE Trans. Syst. Man Cybern. Syst. 2019, 49, 1634–1642. [Google Scholar] [CrossRef]
  23. Dorahaki, S.; Dashti, R.; Shaker, H.R. Optimal Outage Management Model Considering Emergency Demand Response Programs for a Smart Distribution System. Appl. Sci. 2020, 10, 7406. [Google Scholar] [CrossRef]
  24. Dorahaki, S.; Rashidinejad, M.; Fatemi Ardestani, S.F.; Abdollahi, A.; Salehizadeh, M.R. An Integrated Model for Citizen Energy Communities and Renewable Energy Communities Based on Clean Energy Package: A Two-Stage Risk-Based Approach. Energy 2023, 277, 127727. [Google Scholar] [CrossRef]
  25. Huang, B.; Zheng, S.; Wang, R.; Wang, H.; Xiao, J.; Wang, P. Distributed Optimal Control of DC Microgrid Considering Balance of Charge State. IEEE Trans. Energy Convers. 2022, 37, 2162–2174. [Google Scholar] [CrossRef]
  26. Bhatia, K.; Darji, P.B.; Jariwala, H.R. Safety Analysis of TN-S and TN-C-S Earthing System. In Proceedings of the 2018 IEEE International Conference on Environment and Electrical Engineering and 2018 IEEE Industrial and Commercial Power Systems Europe (EEEIC/I&CPS Europe), Palermo, Italy, 12–15 June 2018; Volume 1, pp. 1–6. [Google Scholar]
  27. Bai, Y.; Luo, M.; Pang, F. An Algorithm for Solving Robot Inverse Kinematics Based on FOA Optimized BP Neural Network. Appl. Sci. 2021, 11, 7129. [Google Scholar] [CrossRef]
  28. Gong, M.; Liu, J.; Qin, A.; Zhao, K.; Tan, K. Evolving Deep Neural Networks via Cooperative Coevolution with Backpropagation. IEEE Trans. Neural Netw. Learn. Syst. 2021, 32, 420–434. [Google Scholar] [CrossRef] [PubMed]
  29. Tang, X.; Xu, B.; Xu, Z. Reactor Temperature Prediction Method Based on CPSO-RBF-BP Neural Network. Appl. Sci. 2023, 13, 3230. [Google Scholar] [CrossRef]
  30. Yan, P.; Shang, S.; Zhang, C. Research on the Processing of Coal Mine Water Source Data by Optimizing BP Neural Network Algorithm with Sparrow Search Algorithm. IEEE Access 2021, 9, 108718–108730. [Google Scholar] [CrossRef]
  31. Wang, Z.; Qin, J.; Hu, Z.; He, J.; Tang, D. Multi-Objective Antenna Design Based on BP Neural Network Surrogate Model Optimized by Improved Sparrow Search Algorithm. Appl. Sci. 2022, 12, 12543. [Google Scholar] [CrossRef]
  32. Huang, B.; Wang, Y.; Yang, C.; Li, Y.; Sun, Q. A Neurodynamic-Based Distributed Energy Management Approach for Integrated Local Energy Systems. Int. J. Electr. Power Energy Syst. 2021, 128, 106737. [Google Scholar] [CrossRef]
  33. Liu, Z.; Huang, B.; Hu, X.; Du, P.; Sun, Q. Blockchain-Based Renewable Energy Trading Using Information Entropy Theory. IEEE Trans. Netw. Sci. Eng. 2023. [Google Scholar] [CrossRef]
  34. Ualikhan, I.; Josif, B. Development of Control Algorithm for Adaptive Leakage Current Protection Devices’ Using Fuzzy Logic. Procedia Eng. 2015, 100, 666–671. [Google Scholar] [CrossRef] [Green Version]
Figure 1. Normal leakage current generation mechanism.
Applsci 13 09273 g001
Figure 2. Highest normal leakage current change curve in a year.
Applsci 13 09273 g002
Figure 3. Principle of leakage current prediction model.
Applsci 13 09273 g003
Figure 4. Flow chart of adaptive action threshold adjustment.
Applsci 13 09273 g004
Figure 5. Structure of BP neural network model.
Applsci 13 09273 g005
Figure 6. Schematic diagram of leakage prediction experiment.
Applsci 13 09273 g006
Figure 7. Predicted and actual normal leakage curve and gear adjustment.
Applsci 13 09273 g007
Figure 8. Leakage protection action threshold adjustment curve.
Applsci 13 09273 g008
Table 1. Results of the error assessment for the different prediction models.
AlgorithmMIREMAREMSE
BP0.00861.00530.0411
SSA-BP0.00170.18520.0095
Table 2. Comparison results of several methods.
MethodsAlgorithmsAdjustment RangeAdjust in AdvanceProtective
Effectiveness
[17]VMD-DFNNFull RangeNoMedium
[34]Fuzzy Logic[−30%, 20%]NoLow
Proposed MethodSSA-BPFull RangeYesHigh
Disclaimer/Publisher’s Note: The statements, opinions and data contained in all publications are solely those of the individual author(s) and contributor(s) and not of MDPI and/or the editor(s). MDPI and/or the editor(s) disclaim responsibility for any injury to people or property resulting from any ideas, methods, instructions or products referred to in the content.