Abstract
In recent years, there has been significant progress in object detection within the domain of natural images. However, the field of satellite remote sensing images has consistently presented challenges due to its significant scale variations and complex background interference. Achieving satisfactory results by directly applying conventional image object detection models has proven to be difficult. To address these challenges, this paper introduces BA-YOLO, an improved version of the YOLOv8 object detection model. It incorporates several notable enhancements. Firstly, to fuse an increased number of features more effectively, we introduce the design concept of a higher-performing Bi-directional Feature Pyramid Network (BiFPN). Secondly, to retain sufficient global contextual information, we integrated a module in BA-YOLO that combines multi-head self-attention and convolutional networks. Finally, we employed various data augmentation techniques such as Mixup, Cutout, Mosaic, and multi-scale training to enhance the model’s accuracy and robustness. Experimental results demonstrate that BA-YOLO outperforms state-of-the-art detectors and has been evaluated on the DOTA dataset. BA-YOLO achieves a mean average precision (mAP) of 0.722 on the DOTA dataset.
1. Introduction
Remote sensing object detection is a critical task in the field of remote sensing, and its detection performance directly affects the performance of downstream tasks. This task finds significant applications in various civilian and military domains, including search and rescue operations [1,2], military reconnaissance, and intelligence gathering [3,4,5,6,7,8,9]. Unlike typical object detection tasks, remote sensing object detection faces a unique set of challenges, including variations in scale, differences in viewpoint, changing lighting conditions, background interference, noise interference, low imaging resolution, and significant variations in the morphology and distribution of targets [10,11]. In addressing these challenges, remote sensing object detection requires the development of algorithms that are robust and adaptive, enabling the effective identification and localization of targets of various scales and types. This may involve the use of multi-scale detection strategies, consideration of variations in target appearance under different viewpoints and lighting conditions, mitigation of the impact of background and noise on detection results, and handling targets in low-resolution images. In summary, remote sensing object detection is a challenging yet highly promising field that demands ongoing research and innovation to address the complexities of various environments and scenarios effectively.
Recently, the development of deep learning technologies has continuously broken through the bottlenecks in the field of image processing, achieving groundbreaking progress in areas such as object detection and tracking, image segmentation, image recognition, and retrieval. Natural image datasets like ImageNet [12] and MS COCO [13] have propelled advancements in object detection. However, remote sensing images have unique characteristics where objects often exhibit arbitrary orientations, dense arrangements, and complex background information that introduces interference. Therefore, directly applying object detection models designed for relatively simple background images to remote sensing object detection often falls short of practical requirements. All these factors make object detection in remote sensing images, which have complex backgrounds, more challenging. Remote sensing object detection necessitates specially designed algorithms and models to cope with the diversity, density, and complex environmental backgrounds of targets, ensuring efficient and accurate target identification. Research in this field is continuously advancing to meet the practical needs of remote sensing applications.
In this research, we focused on enhancing existing natural image object detection frameworks to achieve better performance in satellite remote sensing image object detection tasks. YOLOv8 [14] is the latest object detection framework in the YOLO family, and compared to YOLOv5 [15], it demonstrates the best performance in object detection tasks on natural image datasets such as COCO. However, achieving satisfactory results in satellite image object detection tasks directly with YOLOv8 proves challenging.
We updated YOLOv8 primarily in two aspects. Firstly, the neck part of YOLOv8 utilizes the PANet [16] structure. To achieve more effective feature fusion at different scales, this study adopts the BiFPN structure to design a new neck structure for feature fusion. Compared to PANet, BiFPN introduces residual connections to enhance feature representation, removes nodes with a single input edge to reduce computational complexity, and introduces weight fusion. Weight fusion involves adding weights to various scale features being fused, thereby adjusting the contributions of different scales to improve the speed of object detection. Secondly, YOLOv8 uses a Convolutional Neural Network (CNN) to construct its backbone network. CNNs excel at capturing local information, while transformers can enhance the model’s global modeling capabilities. ACmix combines the advantages of CNNs and transformers, allowing it to simultaneously capture local and global semantic information. Convolutional layers can capture local features, while self-attention can capture global dependencies. ACmix can handle both local and global semantic information, so we replaced the C2f module in the YOLOv8 backbone network with C2fAC, thereby improving the performance of remote sensing image object detection tasks. The modified YOLOv8 is named BA-YOLO. Experimental results demonstrate that BA-YOLO, proposed by us, surpasses the performance of standard YOLOv8 in detecting targets in the DOTA dataset.
Contributions:
- Designed a new feature fusion layer that combines the advantages of BiFPN.
- Added the C2fAC module to enhance the model’s feature extraction capability.
- Implemented effective training strategies, including multi-scale training and testing, and data augmentation.
- Achieved a mean average precision (mAP) of 0.722 on the DOTA dataset.
2. Related Work
2.1. Object Detection
The field of object detection has undergone over two decades of development, with its task being to identify objects of interest in images or videos and accurately determine their positions and sizes [17]. Unlike image classification tasks, object detection not only involves object classification but also requires precise localization of objects within images. The development of object detection can be divided into two main periods: the era of traditional object detection algorithms (1998–2014) and the era of deep learning-based object detection algorithms (2014–present). During the era of traditional object detection algorithms, object detection heavily relied on traditional computer vision and image processing methods. Some classic algorithms included methods based on feature engineering, such as Haar feature cascades [9] and Histogram of Oriented Gradient (HOG) features [18], among others. While these methods performed well in some scenarios, they had limitations when dealing with challenges like multi-scale objects, complex backgrounds, and occlusions. In the era of deep learning-based object detection algorithms (2014–present) [19,20,21,22,23], with the rise of deep learning technology, significant breakthroughs were achieved in object detection. Deep learning demonstrated clear advantages in feature learning and representation, enabling more effective handling of complex object detection tasks. Traditional object detection algorithms gradually gave way to deep learning-based methods. Within deep learning-based object detection, two main technical approaches emerged: anchor-based methods (one-stage, two-stage) and anchor-free methods. In summary, the field of object detection has made remarkable progress, and the application of deep learning technology has provided new opportunities and methods for addressing various complex object detection tasks. This field continues to evolve to meet the demands of different application domains.
In anchor-based object detection, common two-stage algorithms like Faster R-CNN [24] and Cascade R-CNN [25] are utilized. These algorithms are typically divided into the following two stages: generating region proposals and object detection. In stage 1, the algorithm initially generates a set of candidate regions or bounding boxes from the input image. These regions may potentially contain objects of interest. This step is often accomplished through a Region Proposal Network (RPN), which effectively extracts regions from the image that might contain objects of interest and provides them for further processing in the next stage. In stage 2, using the candidate regions generated in stage 1, the algorithm performs actual object detection. This involves classifying each candidate region to determine whether it contains an object, as well as regressing the position and boundaries of the object if present. Typically, this stage involves convolutional neural networks (CNNs) along with classification and regression heads to perform these tasks.
One-stage object detection methods differ from traditional two-stage approaches in that they eliminate the need for the region proposal stage. Instead, they directly generate the object’s class probabilities and positional coordinates. Through a single stage of processing, these algorithms can swiftly obtain the final detection results, resulting in faster detection speeds. Some well-known one-stage object detection algorithms include Yolov1–5 and RetinaNet [26]. The development of these algorithms represents the continuous progress of the object detection field towards greater efficiency and practicality.
The anchor-free object detection algorithms discard the excessive use of anchors found in traditional anchor-based detection methods, thus reducing computational complexity and the number of hyper-parameters in the models. This contributes to improving model performance. In recent years, anchor-free techniques have adopted a different approach, no longer relying on anchors, but instead, identifying key points to accomplish object detection. This method aims to reduce computational burden and simplify model design. Some notable anchor-free object detection algorithms include Cornernet [27], centerNet [28], and FSAF [29]. YOLOv8 is the latest single-stage anchor-free model in the YOLO series. YOLOv8 achieves a score of 53.9 on the COCO dataset for mAP50–95, surpassing YOLOv5 with a score of 50.7. The outstanding performance of YOLOv8 in natural dataset object detection tasks proves that it serves as a foundational framework for object detection in remote sensing images.
2.2. Feature Fusion and Applications
In many deep learning tasks, such as object detection and image segmentation, integrating features from different scales is a crucial technique for improving performance. Low-level features have higher resolution and contain more positional and fine-grained information, but they have lower semantic meaning and may include more noise. High-level features, on the other hand, carry stronger semantic information but have lower resolution and may lack the ability to perceive fine details. Efficiently fusing these two types of features while leveraging their respective strengths and mitigating their weaknesses is the key to enhancing object detection models.
To address this challenge, the authors of FPN [30] and other researchers proposed that by fusing low-level features with high-level features, it is possible to construct a detection system that can accurately recognize and precisely locate objects. Unlike previous feature fusion methods, predictions in FPN are performed separately on each fused feature layer. Subsequent experiments have shown that this approach can achieve excellent prediction results. Following this, some researchers developed new algorithms based on FPN, such as NAS-FPN [31] and AUTO-FPN [32], among others. In contrast, PANet was the first to introduce a two-stage fusion approach, incorporating both bottom-up and top-down fusion pathways on top of the FPN architecture. BiFPN is a more efficient feature pyramid network compared to PANet. The introduction of bidirectional flow and skip connections in BiFPN enhances the passage of features and information flow. It is precisely because BiFPN is better at handling multiscale features that we incorporated BiFPN into the baseline model to achieve better object detection performance.
2.3. Multi-Head Self-Attention
Currently, transformer models, as discussed in reference [33], dominate the fields of natural language processing and target recognition and detection. This is because they excel at learning complex dependencies between input sequences through self-attention mechanisms. When dealing with large-scale and intricate scene images, such as those captured by drones or satellite remote sensing, it is crucial to enhance semantic distinctiveness and reduce category confusion. Gathering and associating scene information from extensive neighborhoods contribute significantly to understanding relationships between objects. Traditional target detection models based on CNNs are constrained by the locality of convolution operations, limiting their ability to capture global contextual information. In contrast, transformers, with their multi-head self-attention mechanisms, are more proficient at preserving spatial information, allowing them to globally attend to the dependencies between image feature blocks. This, in turn, enhances the performance of target detection models.
Additionally, the Swin transformer [34] introduces a novel attention mechanism known as Shifted Window (Swin) Attention, which enables the model to effectively process large-scale images and capture information at various scales. This attention mechanism achieves this by dividing the image into different blocks, with overlapping regions between each block to ensure the consistency of global information. The integration of Shifted Window Attention equips the model to handle large images better, making it suitable for computer vision tasks involving high-resolution images. Compared to traditional CNNs, visual transformers exhibit greater robustness when dealing with severe occlusion, disturbances, and domain shifts. Therefore, an intuitive approach to enhancing detection performance is to embed transformer layers into a pure convolutional backbone, providing more contextual information and learning more discriminative feature representations without significantly increasing the parameter count. To better integrate the advantages of multi-head attention and convolutional networks, the ACmix model was proposed by Pan et al. [35]. The ACmix model integrates self-attention and convolution modules by sharing the same computationally intensive operations, thereby improving detection accuracy while maintaining efficiency. Therefore, to more effectively capture features, we added ACmix to the baseline model.
2.4. Data Augmentation
Data augmentation plays a crucial role in the processing of remote sensing image data. Remote sensing images typically contain rich information but can be affected by factors such as noise, varying lighting conditions, different seasons, and viewing angles. Therefore, data augmentation is essential for enhancing the performance and generalization capabilities of deep learning models when dealing with these images. Common traditional data augmentation methods include random rotations, flips, scaling, cropping, adjustments to brightness and contrast, and color space transformations. In addition to these techniques, more recent approaches such as Mixup [36], Cutout [37], and Mosaic [38] have been introduced. Mixup involves blending two or more images in specific proportions to create new images. Cutout randomly erases a portion of an image and fills it with a fixed color to introduce randomness. Mosaic combines multiple images by randomly assembling them into a single larger image, thereby increasing data diversity. Furthermore, empirical evidence has shown that stopping the use of Mosaic during the later stages of training can lead to improved performance in object detection models. This highlights the significance of adapting data augmentation strategies throughout the training process. Multi-scale training [39] is also a commonly used technique in deep learning and object detection. It typically involves using data at different scales (or resolutions) to train a model, enabling the model to better adapt to various input scenarios, with the aim of improving the model’s performance and robustness. Therefore, in this paper, the baseline network integrates these data augmentation strategies.
3. Materials and Methods
3.1. Overview of YOLOv8
YOLOv8 is a state-of-the-art (SOTA) model that builds upon the success of previous YOLO versions while introducing new features and improvements to further enhance performance and flexibility. Specific changes include YOLOv8 introducing a new backbone network. The most significant change is in the head section, which replaces the coupled head of YOLOv5 with a decoupled head and transitions from YOLOv5’s anchor-based approach to anchor-free. YOLOv8 utilizes a new loss function, where loss incorporates the Task-Aligned Assigner positive sample allocation strategy and introduces Distribution Focal Loss. The YOLOv8 model is capable of running on various hardware platforms, ranging from CPUs to GPUs. Furthermore, in the backbone network and neck section, YOLOv8 replaces YOLOv5’s C3 structure with a C2f structure that offers a richer gradient flow. Different channel numbers are adjusted for models of various scales, and this change significantly improves model performance. When the YOLOv8 model was tested on the COCO dataset, YOLOv8 showed a significant improvement in mAP, parameter count, and FLOPs results compared to YOLOv5 and YOLOv7 [40] in terms of object detection accuracy. In order to make YOLOv8 more suitable for object detection tasks in remote sensing images, we made some modifications to YOLOv8.
3.2. BA-YOLO
The architecture of our proposed BA-YOLO for remote sensing image object detection is depicted in Figure 1.
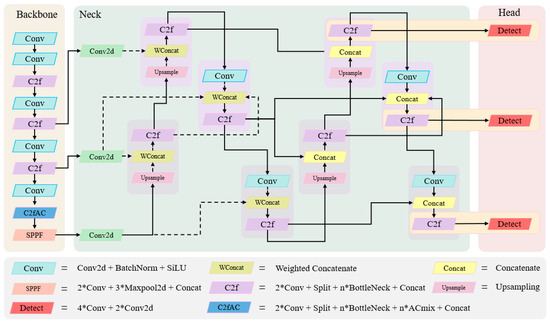
Figure 1.
The architecture of the BA-YOLO. The dashed lines in the figure represent weighted feature fusion. The architecture of the BA-YOLO. The dashed lines in the figure represent weighted feature fusion. The details of each module in the BA-YOLO are shown in the lower part of Figure 1.
3.2.1. C2fAC
Recently, with the emergence of vision transformers, modules based on self-attention have shown comparable or even better performance in many visual tasks compared to CNN counterparts. In the Hybrid Attention Mechanism ACmix proposed by Pan et al. [35], the input features are first mapped using convolution to obtain a rich set of intermediate features. Then, these intermediate features are reused and aggregated according to different patterns (using self-attention and convolution methods), fully leveraging the inherent relationships between convolution and self-attention. The ACmix structure is depicted in Figure 2. First, input feature mapping is performed using three 1 × 1 convolutions. Next, the use of intermediate features follows two paradigms. Features from both paths are added together and serve as the final output. In this paper, by incorporating ACmix into the C2f module, it can capture more features, resulting in C2fAC. Unlike SPH-yolov5 and TPH-yolov5, where transformers and Swin transformers are respectively fused into the C3 module and placed in the model’s neck as detection heads, in this paper, we place the self-attention modules in the backbone section, using transformer layers early to enforce boundary regression. When the network is relatively shallow and the feature maps are relatively large, the model may lose some meaningful contextual information.
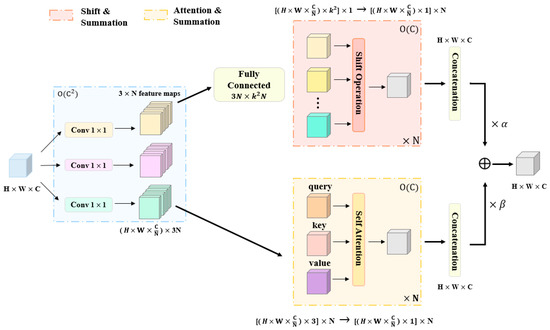
Figure 2.
The overview of ACmix.
3.2.2. BIFPN
In remote sensing image object detection, there can be significant variations in the sizes of target objects, such as small vehicles and football fields. By propagating high-level features down to complement the semantics of lower-level features, it is possible to obtain high-resolution and semantically rich features, which are advantageous for the detection of small objects.
PANet further explores cross-scale connections, as illustrated in Figure 3a. In this work, as depicted in Figure 3b, a simple yet efficient Weighted Bi-Directional Feature Pyramid Network (BiFPN) was introduced to optimize cross-scale connections. The introduction of BiFPN significantly improved the performance of EfficientDet [41]. It enabled the model to better handle objects of different scales and improved detection performance. BiFPN achieves effective integration of multi-scale features through the introduction of bidirectional cross-scale connections and fast normalization fusion with learnable weights.
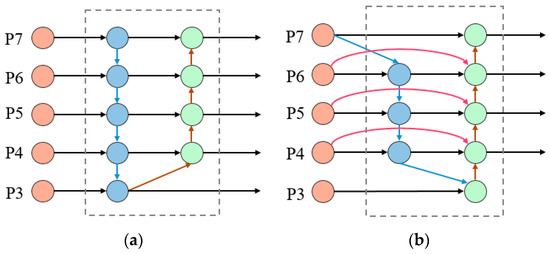
Figure 3.
Feature network design (a) PANet adds an additional bottom-up pathway on top of FPN. (b) BiFPN implements two optimizations for cross-scale connections.
Firstly, we eliminated nodes with only one input edge. Furthermore, if the initial input node aligns with the output node at the same network level, we introduce an additional connection from the original input node to the output node.
Secondly, BiFPN introduces learnable weights when merging low-level and high-level features to learn the importance of different input features, rather than simply summing or connecting them. Formally, given a list of multi-scale features , where presents the feature at level . The list of intermediate features on the pathway is represented as . Our goal is to find a method that effectively aggregates different features and produces a set of new features as output. Figure 3a illustrates the conventional top-down and bottom-up PANet. It takes level 3–7 input features, , where represents a feature level with a resolution of . The traditional PANet aggregates multi-scale features in a simple summation manner, for example, at layer 4:
whereas Resize is usually an upsampling or downsampling operation performed to match the resolution, Conv is typically a convolution operation used for feature processing. BiFPN integrates bidirectional cross-scale connections along with fast normalization fusion with learnable weights. As a specific example, here, we describe the fusion of two features at level 4 in BiFPN, as shown in Figure 3b.
In the above formulas, represents the intermediate feature at level 6 on the top-down pathway, and represents the output feature at level 4 on the bottom-up pathway. All other features are constructed in a similar manner. The key difference from the original BiFPN proposed in EfficientDet is that, in this paper, the neck section chooses to take three outputs from the backbone as inputs instead of five. The three outputs from BiFPN are fed into the final fully connected layer. The purpose of doing this is to improve the detection of objects at various scales.
Directly connecting the outputs of BiFPN to the classification layer would result in a huge number of parameters. While BiFPN is effective in achieving efficient bidirectional cross-scale connections and weighted feature fusion, resizing operations through convolutional networks are required to ensure that all scales have the same dimensions during feature weighting. This also leads to the large dimensions of the output at each layer of the final BiFPN network. In this paper, to enable efficient feature fusion while minimizing the increase in parameters, we have made modifications to the BiFPN structure by introducing an additional set of unweighted feature fusion networks, as illustrated in Figure 4.
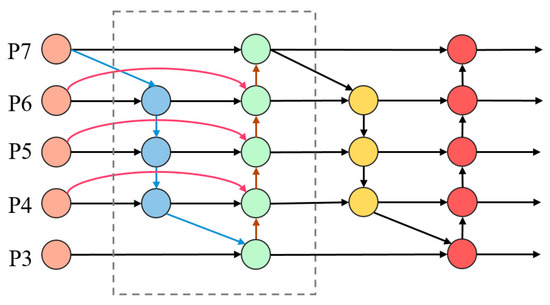
Figure 4.
Modified BiFPN structure. Weighted processing is being applied to feature fusion within the dashed box.
4. Experiments
4.1. Datasets and Evaluation Metrics
The DOTA dataset comprises 400,000 annotated object instances from 16 different categories. The images in this dataset are primarily sourced from the China Center for Resources Satellite Data and Application (CRESDA), Google Earth, JL-1 satellite, and GF-2 satellite. It includes 2806 aerial images captured by various sensors and platforms, with each image having a size of up to 4000 × 4000 pixels. The dataset encompasses a wide range of object categories, including the following: plane, ship, storage tank, baseball diamond, tennis court, basketball court, ground track field, harbor, bridge, large vehicle, small vehicle, helicopter, roundabout, soccer ball field, swimming pool, and container crane. These diverse categories make the DOTA dataset valuable for object detection and related computer vision tasks. As shown in Table 1, objects between 10 and 50 pixels in size are referred to as small objects, while objects larger than 300 pixels are categorized as large objects. Objects with sizes between 50 and 300 pixels are considered medium-sized objects. Therefore, we cropped the DOTA dataset into 40,000 images with a size of 1024 × 1024 pixels. We chose precision (P), recall (R), and mean average precision (mAP) as evaluation metrics.

Table 1.
The distributions of the instance size for the DOTA datasets.
The definitions of P and R involve the true positive (TP), false positive (FP), true negative (TN), and false negative (FN). Precision is the proportion of true positive samples in the positive classification prediction results.
Recall is the proportion of successfully captured true positives among all actual positive instances by the model.
Mean average precision (mAP) is the average of precision values (APs) calculated for each class.
In the given formula, denotes the total number of classes. represents the average precision for class , which is numerically equal to the area covered by the precision–recall function curve along with the coordinate axes. AP can be calculated using the area under the P–R curve.
4.2. Implementation Details
In this paper, BA-YOLO is implemented in the PyTorch framework and is currently being trained and tested on an NVIDIA Tesla A100 GPU with 40GB of memory. The YOLOv8 model is initially trained on the COCO dataset. To save training time, we employed a transfer learning strategy by directly using a pre-trained YOLOv8 model. During the training phase, we utilized the pre-trained YOLOv8 backbone network model from the COCO dataset for transfer learning. We employed the SGD optimizer with an initial learning rate of 0.01. The number of training epochs was set to 150, and the first 3 epochs used a learning rate warm-up strategy, which is a common technique for optimizing learning rates. The learning rate gradually decreased from 0.1 to 0.01 during these initial 3 epochs. Learning rate warm-up helps stabilize the training of deeper models. The batch size was set to 8, the probability for Mosaic data augmentation was set to 1.0, and the probability for Mixup data augmentation was set to 0.7. Additionally, during the final few epochs of training, we disabled Mosaic data augmentation, which contributed to improving the model’s performance. Other detection models, such as Faster R-CNN, RetinaNet, SSD, YOLOv3, YOLOv5, and others, were validated using the default settings provided in their respective literature.
4.3. Experimental Results
We tested BA-YOLO on the DOTA dataset and compared it with other representative models, as shown in Table 2. On the DOTA dataset, our method achieves an mAP of 0.722, which is 0.036 higher than that of YOLOv8. This result demonstrates the effectiveness of BA-YOLO in satellite image object detection.
Table 2.
Test results on the DOTA test dataset for different detection models.
In order to better assess the model’s performance, we plotted P–R curves for each category as shown in Figure 5, and calculated the area under the curve, known as AP (average precision). A higher AP value indicates better detection performance. Additionally, two crucial parameters for evaluating deep learning models are the Intersection-over-Union (IoU) threshold and the confidence threshold. Next, in Figure 6, we separately computed the confusion matrix for BA-YOLO on the DOTA test dataset using an IoU threshold of 0.5 and a confidence threshold of 0.25. The confusion matrix is a tool for summarizing and visualizing the predictions of a classification problem. It counts the number of correct and incorrect predictions, categorizes them by each class, and illustrates the model’s performance on different classes, including potential sources of confusion. As shown in Figure 6. The confusion matrix visually presents the classification results for each category. Each row represents the predicted categories by the model, each column represents the actual categories, and the data on the diagonal line represent the proportion of correctly classified categories. The confusion matrix helps us understand how the model performs on different classes, including which classes are prone to confusion or misclassification, thus aiding in further analysis and model performance improvement.
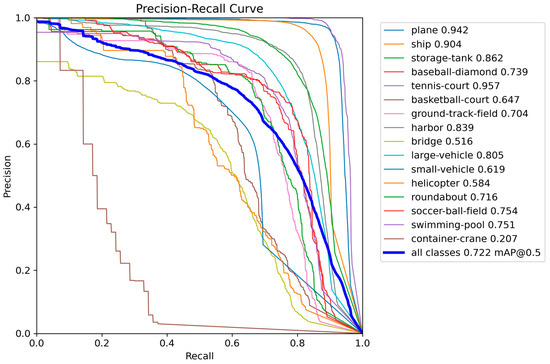
Figure 5.
The P–R curve from the BA-YOLO results on the DOTA test set.
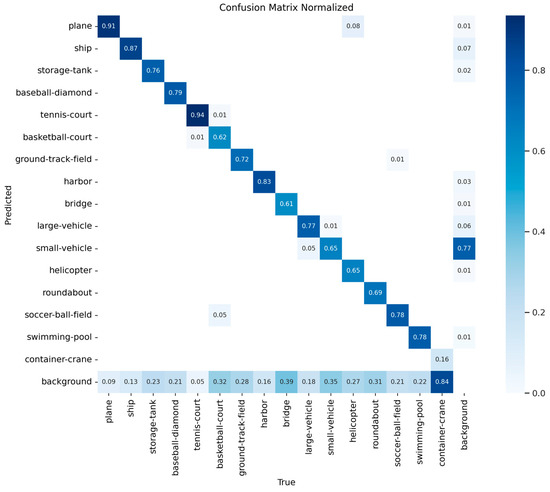
Figure 6.
The confusion matrix from the BA-YOLO results on the DOTA test set, with the IoU threshold of 0.5 and the confidence threshold of 0.25, respectively.
The high false negatives (FNs) for the container crane category in the DOTA dataset can be attributed to the significantly lower number of training samples available for this category compared to other classes. The lack of training samples leads to limited feature extraction, resulting in a high FN rate. The high FN rate for the container crane category implies that a majority of objects belonging to this category are being missed by the model, and, consequently, the corresponding average precision (AP) for this category is much lower compared to others. On the other hand, it is evident that the category of small vehicles is prone to being missed. This is because, although there are sufficient training samples for small vehicles in the dataset, they are considered tiny objects with significant variations in scale, size, and orientation. Additionally, small vehicles in the images may be situated in dark shadows, obscured by buildings, or densely parked in parking lots, making their detection challenging in such environments.
Figure 7 showcases some visual results from our BA-YOLO on the DOTA dataset. The detected bounding boxes are color-coded according to different categories. Figure 8 showcases some visual results from the YOLOv8 detection model on the DOTA dataset. The confidence number calculation method in Figure 7 and Figure 8 is as follows:
The term represents the probability of each detected category, indicates whether the center of the object falls within the grid cell, and is the Intersection-over-Union value between the predicted box and the ground truth.
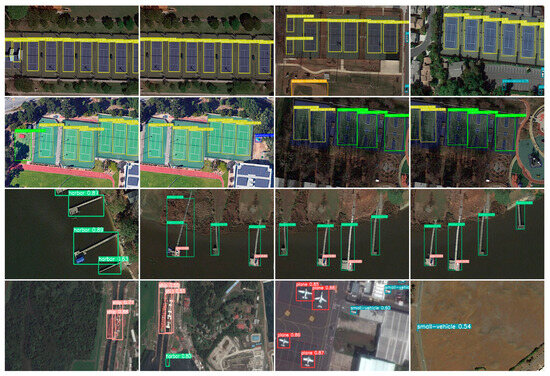
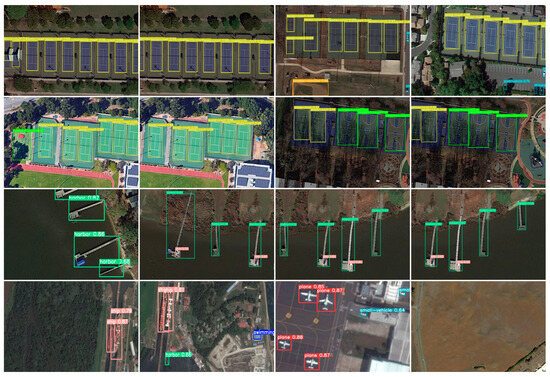
Figure 7.
Some visualization results from our BA-YOLO on the DOTA dataset. The detection boxes of different colors in the image display distinct colors based on categories, with the category and confidence being shown above the bounding boxes.
Figure 8.
Some visualization results from our YOLOv8 on the DOTA dataset. The detection boxes of different colors in the image display distinct colors based on categories, with the category and confidence being shown above the bounding boxes.
We tested the inference speed of several algorithms in the same environment, as shown in Table 3. Our proposed model, BA-YOLO, is more complex than other models, but it still has a speed advantage compared to TPH-YOLOv5 and SPH-YOLOv5. However, it is somewhat slower compared to YOLOv5 and baseline model YOLOv8. In the future, we will explore ways to simplify the model and improve inference speed while maintaining accuracy.
Table 3.
Inference time on the DOTA test dataset for different detection models.
4.4. Ablation Experiments
In this section, we will conduct a comprehensive ablation study on the DOTA test subset to analyze our algorithm, as shown in Table 4. Based on the baseline model YOLOv8-L, we introduced a simple yet effective weighted path aggregation method to replace PANet. We also embedded the C2fAC with ACmix module into the original YOLOv8 model. The multi-scale technique also contributes to improving the detection performance of BA-YOLO. Table 4 presents the comparison of results among the four models.
Table 4.
The effects of the YOLOv8 combining different modules on the DOTA dataset.
5. Conclusions
Satellite images possess several prominent characteristics, including significant scale variations, complex backgrounds filled with distractions, and diverse perspectives, which pose tremendous challenges for general object detectors based on common convolutional networks. In this study, we upgraded the latest natural image detection technology YOLOv8 model to the BA-YOLO model, tailored for satellite images. We improved the YOLOv8 network structure according to the characteristics of remote sensing images. In BA-YOLO, we introduced the BiFPN structure as a feature fusion network and employed learnable weights for fast normalization fusion, effectively reducing the loss of target feature information and enhancing detection performance in satellite images. Additionally, we introduced the C2fAC module, which combines the advantages of multi-head attention and convolutional networks, enhancing the model’s detection accuracy. The BA-YOLO model was tested on the widely used DOTA dataset, achieving an mAP of 0.722, surpassing other models. This fully demonstrates the effectiveness of BA-YOLO for satellite image object detection. In the future, we will strive to improve object detection speed while maximizing the model’s detection accuracy to the greatest extent possible. Despite BA-YOLO achieving satisfactory object detection accuracy in satellite images, its performance in detecting small targets is not particularly ideal. In future work, we plan to incorporate image super-resolution techniques to enhance the research on target detection in satellite images.
Author Contributions
Conceptualization, Z.L. and K.W.; formal analysis, K.W.; investigation, K.W.; software, K.W.; writing—original draft, K.W.; writing—review and editing, Z.L. All authors have read and agreed to the published version of the manuscript.
Funding
This research received no external funding.
Institutional Review Board Statement
Not applicable.
Informed Consent Statement
Not applicable.
Data Availability Statement
The data presented in this study are available on request from the corresponding author. The data are not publicly available due to privacy.
Acknowledgments
We are very grateful for the support and help from Ming Zhu of the University of Chinese Academy of Sciences.
Conflicts of Interest
The authors declare no conflict of interest.
References
- Han, W.; Chen, J.; Wang, L.; Feng, R.; Li, F.; Wu, L.; Tian, T.; Yan, J. Methods for small, weak object detection in optical high-resolution remote sensing images: A survey of advances and challenges. IEEE Geosci. Remote Sens. Mag. 2021, 9, 8–34. [Google Scholar] [CrossRef]
- Liu, T.; Wang, L.; Zuo, S.; Yang, C. Remote Sensing Dynamic Monitoring System for Agricultural Disaster in Henan Province Based on Multi-source Satellite Data. Agric. Sci. Technol. 2013, 14, 155–161. [Google Scholar]
- Zhao, H.; Zhang, H.; Zhao, Y. Yolov7-sea: Object detection of maritime uav images based on improved yolov7. In Proceedings of the IEEE/CVF Winter Conference on Applications of Computer Vision, Waikoloa, HI, USA, 3–7 January 2023; pp. 233–238. [Google Scholar]
- Zhu, C.; Zhou, H.; Wang, R.; Guo, J. A Novel Hierarchical Method of Ship Detection from Spaceborne Optical Image Based on Shape and Texture Features. IEEE Trans. Geosci. Remote Sens. 2010, 48, 3446–3456. [Google Scholar] [CrossRef]
- Proia, N.; Page, V. Characterization of a Bayesian Ship Detection Method in Optical Satellite Images. IEEE Geosci. Remote Sens. Lett. 2010, 7, 226–230. [Google Scholar] [CrossRef]
- Xu, J.; Sun, X.; Zhang, D.; Fu, K. Automatic Detection of Inshore Ships in High Resolution Remote Sensing Images Using Robust Invariant Generalized Hough Transform. IEEE Geosci. Remote Sens. Lett. 2014, 11, 2070–2074. [Google Scholar]
- Feng, Y.; Xu, Q.; Feng, G.; Hu, L. Ship detection from optical satellite images based on visual search mechanism. In Proceedings of the 2015 IEEE International Geoscience and Remote Sensing Symposium (IGARSS), Milan, Italy, 26–31 July 2015. [Google Scholar]
- Yuan, Y.; Jiang, Z.; Zhang, H.; Wang, M.; Meng, G. Ship detection in panchromatic images: A new method and its DSP implementation. In Proceedings of the ISPRS International Conference on Computer Vision in Remote Sensing, Xiamen, China, 28–30 April 2015; International Society for Optics and Photonics: Bellingham, WA, USA, 2016. [Google Scholar]
- Lienhart, R.; Maydt, J. An extended set of Haar-like features for rapid object detection. In Proceedings of the International Conference on Image Processing, Rochester, NY, USA, 22–25 September 2002. [Google Scholar]
- Gorelick, N.; Hancher, M.; Dixon, M.; Ilyushchenko, S.; Thau, D.; Moore, R. Google Earth Engine: Planetary-scale geospatial analysis for everyone. Remote Sens. Environ. 2017, 202, 18–27. [Google Scholar] [CrossRef]
- Li, D.; Ke, Y.; Gong, H.; Li, X. Object-based urban tree species classification using bi-temporal WorldView-2 and WorldView-3 images. Remote Sens. 2015, 7, 16917–16937. [Google Scholar] [CrossRef]
- Deng, J.; Dong, W.; Socher, R.; Li, L.J.; Li, K.; Fei-Fei, L. Imagenet: A large-scale hierarchical image database. In Proceedings of the IEEE Conference on Computer Vision and Pattern Recognition (CVPR), Miami, FL, USA, 20–25 June 2009; pp. 248–255. [Google Scholar]
- Lin, T.Y.; Maire, M.; Belongie, S.; Hays, J.; Perona, P.; Ramanan, D.; Dollár, P.; Zitnick, C.L. Microsoft coco: Common objects in context. In Computer Vision—ECCV 2014: 13th European Conference, Zurich, Switzerland, September 6–12, 2014, Proceedings, Part V 13; Springer: Berlin/Heidelberg, Germany, 2014; Volume 8693, pp. 740–755. [Google Scholar]
- Terven, J.; Cordova-Esparza, D. A comprehensive review of YOLO: From YOLOv1 to YOLOv8 and beyond. arXiv 2023, arXiv:2304.00501. [Google Scholar]
- Jocher, G.; Stoken, A.; Borovec, J.; Changyu, L.; Hogan, A.; Diaconu, L.; Poznanski, J.; Yu, L.; Rai, P.; Ferriday, R.; et al. ultralytics/yolov5: v3.0; Zenodo: Geneva, Switzerland, 2020. [Google Scholar]
- Wang, K.; Liew, J.H.; Zou, Y.; Zhou, D.; Feng, J. Panet: Few-shot image semantic segmentation with prototype alignment. In Proceedings of the IEEE/CVF International Conference on Computer Vision, Seoul, Republic of Korea, 27–28 October 2019; pp. 9197–9206. [Google Scholar]
- Leninisha, S.; Vani, K. Water flow based geometric active deformable model for road network. ISPRS J. Photogramm. Remote Sens. 2015, 102, 140–147. [Google Scholar] [CrossRef]
- Dalal, N.; Triggs, B. Histograms of oriented gradients for human detection. In Proceedings of the 2005 IEEE Computer Society Conference on Computer Vision and Pattern Recognition (CVPR’05), San Diego, CA, USA, 20–25 June 2005; Volume 1, pp. 886–893. [Google Scholar]
- McKeown, D.M., Jr.; Denlinger, J.L. Cooperative methods for road tracking in aerial imagery. In Proceedings of the 1988 DARPA IUS Workshop, Cambridge, MA, USA, 6–8 April 1988; pp. 662–672. [Google Scholar]
- Rosenfeld, A. The max Roberts operator is a Hueckel-type edge detector. IEEE Trans. Pattern Anal. Mach. Intell. 1981, 1, 101–103. [Google Scholar] [CrossRef] [PubMed]
- Zhang, Y.; Han, X.; Zhang, H.; Zhao, L. Edge Detection Algorithm of Image Fusion Based on Improved Sobel Operator. In Proceedings of the 2017 IEEE 3rd Information Technology and Mechatronics Engineering Conference (ITOEC), Chongqing, China, 3–5 October 2017. [Google Scholar]
- Ulupinar, F.; Medioni, G. Refining edges detected by a LoG operator. Comput. Vis. Graph. Image Process. 1990, 51, 275–298. [Google Scholar] [CrossRef]
- Harris, C.G.; Stephens, M. A combined corner and edge detector. In Proceedings of the AVC, Manchester, UK, 31 August–2 September 1988; pp. 10–5244. [Google Scholar]
- Girshick, R. Fast r-cnn. In Proceedings of the IEEE International Conference on Computer Vision, Santiago, Chile, 7–13 December 2015; pp. 1440–1448. [Google Scholar]
- Cai, Z.; Vasconcelos, N. Cascade r-cnn: Delving into high quality object detection. In Proceedings of the IEEE Conference on Computer Vision and Pattern Recognition, Salt Lake City, UT, USA, 18–22 June 2018; pp. 6154–6162. [Google Scholar]
- Lin, T.Y.; Goyal, P.; Girshick, R.; He, K.; Dollár, P. Focal loss for dense object detection. In Proceedings of the IEEE International Conference on Computer Vision, Venice, Italy, 22–29 October 2017; pp. 2980–2988. [Google Scholar]
- Law, H.; Deng, J. Cornernet: Detecting objects as paired keypoints. In Proceedings of the European Conference on Computer Vision (ECCV), Munich, Germany, 8–14 September 2018; pp. 734–750. [Google Scholar]
- Duan, K.; Bai, S.; Xie, L.; Qi, H.; Huang, Q.; Tian, Q. Centernet: Keypoint triplets for object detection. In Proceedings of the IEEE/CVF International Conference on Computer Vision, Seoul, Republic of Korea, 27–28 October 2019; pp. 6569–6578. [Google Scholar]
- Zhu, C.; He, Y.; Savvides, M. Feature selective anchor-free module for single-shot object detection. In Proceedings of the IEEE/CVF Conference on Computer Vision and Pattern Recognition, Long Beach, CA, USA, 15–20 June 2019; pp. 840–849. [Google Scholar]
- Lin, T.Y.; Dollár, P.; Girshick, R.; He, K.; Hariharan, B.; Belongie, S. Feature pyramid networks for object detection. In Proceedings of the IEEE Conference on Computer Vision and Pattern Recognition, Honolulu, HI, USA, 21–26 July 2017; pp. 2117–2125. [Google Scholar]
- Ghiasi, G.; Lin, T.Y.; Le, Q.V. NAS-FPN: Learning scalable feature pyramid architecture for object detection. In Proceedings of the IEEE Conference on Computer Vision and Pattern Recognition, Long Beach, CA, USA, 15–20 June 2019; pp. 7036–7045. [Google Scholar]
- Xu, H.; Yao, L.; Zhang, W.; Liang, X.; Li, Z. Auto-FPN: Automatic network architecture adaptation for object detection beyond classification. In Proceedings of the IEEE International Conference on Computer Vision, Seoul, Republic of Korea, 27 October–2 November 2019; pp. 6649–6658. [Google Scholar]
- Vaswani, A.; Shazeer, N.; Parmar, N.; Uszkoreit, J.; Jones, L.; Gomez, A.N.; Kaiser, Ł.; Polosukhin, I. Attention is all you need. Adv. Neural Inf. Process. Syst. 2017, 30. [Google Scholar] [CrossRef]
- Liu, Z.; Lin, Y.; Cao, Y.; Hu, H.; Wei, Y.; Zhang, Z.; Lin, S.; Guo, B. Swin transformer: Hierarchical vision transformer using shifted windows. In Proceedings of the IEEE/CVF International Conference on Computer Vision, Montreal, BC, Canada, 11–17 October 2021; pp. 10012–10022. [Google Scholar]
- Pan, X.; Ge, C.; Lu, R.; Song, S.; Chen, G.; Huang, Z.; Huang, G. On the integration of self-attention and convolution. In Proceedings of the IEEE/CVF Conference on Computer Vision and Pattern Recognition, New Orleans, LA, USA, 18–24 June 2022; pp. 815–825. [Google Scholar]
- Zhang, H.; Cisse, M.; Dauphin, Y.N.; Lopez-Paz, D. mixup: Beyond empirical risk minimization. arXiv 2017, arXiv:1710.09412. [Google Scholar]
- Yun, S.; Han, D.; Oh, S.J.; Chun, S.; Choe, J.; Yoo, Y. Cutmix: Regularization strategy to train strong classifiers with localizable features. In Proceedings of the IEEE/CVF International Conference on Computer Vision, Seoul, Republic of Korea, 27–28 October 2019; pp. 6023–6032. [Google Scholar]
- Su, M.S.; Hwang, W.L.; Cheng, K.Y. Analysis on multiresolution mosaic images. IEEE Trans. Image Process. 2004, 13, 952–959. [Google Scholar] [CrossRef] [PubMed]
- Romeny, B.M.H. Front-End Vision and Multi-Scale Image Analysis: Multi-Scale Computer Vision Theory and Applications; Written in Mathematica; Springer Science & Business Media: Berlin/Heidelberg, Germany, 2008. [Google Scholar]
- Wang, C.Y.; Bochkovskiy, A.; Liao, H.Y.M. YOLOv7: Trainable bag-of-freebies sets new state-of-the-art for real-time object detectors. In Proceedings of the IEEE/CVF Conference on Computer Vision and Pattern Recognition, Vancouver, BC, Canada, 18–22 June 2023; pp. 7464–7475. [Google Scholar]
- Tan, M.; Pang, R.; Le, Q.V. Efficientdet: Scalable and efficient object detection. In Proceedings of the IEEE/CVF Conference on Computer Vision and Pattern Recognition, Seattle, WA, USA, 13–19 June 2020; pp. 10781–10790. [Google Scholar]
Disclaimer/Publisher’s Note: The statements, opinions and data contained in all publications are solely those of the individual author(s) and contributor(s) and not of MDPI and/or the editor(s). MDPI and/or the editor(s) disclaim responsibility for any injury to people or property resulting from any ideas, methods, instructions or products referred to in the content. |
© 2023 by the authors. Licensee MDPI, Basel, Switzerland. This article is an open access article distributed under the terms and conditions of the Creative Commons Attribution (CC BY) license (https://creativecommons.org/licenses/by/4.0/).