1. Introduction
Two of the most crucial organs in the human body, the lungs, have a direct impact on both the respiratory and circulatory systems. Injury to the human lungs has a significant impact on the continuity of all bodily functions. Several lung diseases, such as COVID-19, pneumonia, and other diseases, result in a great number of fatalities. The majority of diseases that affect the lungs are brought on by bacteria, viruses, fungi, chemical exposure, lung injury, or even the indirect effects of other diseases. Streptococcus bacteria, Mycoplasma bacteria, adenovirus, rhinovirus, influenza virus, respiratory syncytial virus (RSV), and parainfluenza virus are the pathogens that cause pneumonia [
1]. The World Health Organization (WHO) describes pneumonia as a lung-specific acute respiratory disease. Pneumonia is a contagious disease that can affect both children and adults. The most common cause of infection-related death in children worldwide is pneumonia. A total of 4,685,164 individuals under the age of 15 and 9,564,023 individuals over the age of 15 died from pneumonia in 2019. By 2030, there will be about 11 million child deaths worldwide due to pneumonia, according to a study by Johns Hopkins University and Save the Children. The COVID-2019 disease is a respiratory infection brought on by the SARS-CoV-2 virus [
2]. The virus spreads through the air from an infected person’s lips or nose when they cough, sneeze, sing, talk, or breathe. Globally, COVID-19 is spreading. Overall, 6,456,988 people died as a result of COVID-19 in December 2019. Lung opacities are an indication of abnormalities in a person’s lungs other than cancer [
3]. This might be an instance of lung bleeding, infection, or experience of other unidentified issues. Numerous factors with varying degrees of significance can contribute to lung opacities. Viral infections and other lung clouding diseases frequently have short-term effects with little long-term harm. Other conditions, like lung cancer and alveolar hemorrhage, call for more serious treatment.
There are several lung diseases that share the same symptoms but require different treatments, such as COVID-19 and pneumonia [
4]. Determining the presence of infection in the early stages of the disease is one of the most challenging aspects of COVID-19 [
5]. It is difficult to find similarities between people who have lung-related diseases in terms of their initial personality traits. A crucial first step is the accurate diagnosis of the disease. With the rapid development of technology, several fields, including the medical field, began to use Artificial Intelligence (AI) to support ongoing work processes. Medical imaging is one element that is frequently used in the application of technology in the medical field. Medical images are used to diagnose or detect disease based on image or video data [
6]. Image data can be obtained using a variety of techniques, such as magnetic resonance imaging (MRI), X-rays, ultrasonography (USG), endoscopy, computerized tomography (CT) scans, and nuclear medicine [
7]. CT scan data are usually used to segment various diseases, such as lung disease. However, segmenting lung nodules on CT images still needs the expertise and experience of a medical professional, specifically a radiologist, and is performed manually by depicting the nodule one slice at a time. This procedure must be repeated several times and is subject to subjectivity, which can lead to misdiagnosis. As a result, accurate automatic lung nodule segmentation has always been at the forefront of computer-assisted diagnosis research [
8]. As a result, many studies are competing to achieve good evaluation values for this case, so that the specificity and sensitivity for CT scans are 94% and 37%, respectively. X-ray radiography is frequently the preferred option in clinical settings due to its benefits, including its lower cost and availability in many hospitals, even though CT scans offer higher sensitivity for detection. One of the methods most frequently used to assess a patient’s physical condition is an X-ray. A chest X-ray (CXR) examination is performed to diagnose lung disease, the results of which show the condition of the chest cavity, respiratory tract, heart, and lungs.
The presence of unusual findings, or what are typically referred to as abnormal situations, in a radiological examination of a person’s lungs performed by a radiologist defines the examination on their condition as being conducted. CXRs are employed to find anomalies in the cavity. Ground-glass opacity (GGO) is one of the anomalous phenomena that is identified [
9]. Normal lungs have black CXR findings, but if the CXR findings show a gray area or an area covered with a membrane, the condition is ground-glass opacity. Most people with moderate to severe respiratory conditions show ground-glass opacity, which suggests an infection or inflammation brought on by viruses, fungi, bacteria, or parasites like pneumonia and COVID-19 [
10]. Chest X-ray diagnosis and classification of lung diseases is a challenging and intricate task. In order to obtain accurate identification results, extra precision is required. To assist radiology specialists and accelerate the pace of implementation, it is necessary to collaborate with increasingly sophisticated technological advances, such as deep learning models. A convolutional neural network is a deep learning algorithm that uses mathematical operations in network learning, specifically convolution. This is a neural network algorithm that is commonly used for image data.
The Residual Neural Network, also known as ResNet, is a popular CNN architecture. He et al. [
11] first proposed this architecture to ease the training of networks that are much deeper than those previously employed, as training becomes more difficult with deeper neural networks. The layers were reformulated as residual learning functions, also referred to as residual blocks. These building blocks, which are present in every layer of the ResNet CNN architecture, form its framework. Utilizing these residual blocks makes network optimization simpler and allows for significantly better accuracy as depth increases. Furthermore, residual blocks can be used to solve the vanishing gradient problem [
12], which occurs when the gradient information that the model is supposed to learn is unable to reach the first layer due to repeated multiplications. As a result, the first layer receives no gradient, rendering the CNN model unable to learn from the calculated errors.
In CNN, various architectures, such as the ResNet architecture, have different variations despite originating from the same source. The only difference between these architectures is the number of layers and parameters, which are all the same. ResNet architectures have layers that correspond to their names; for example, ResNet-50 has 50 layers, ResNet-101 has 101 layers, and ResNet-152 has 152 layers. These layers perform various functions that help the machine learn the data and extract important information for the classification phase. The more layers used in an architecture, the deeper the learning process, and thus the better the performance. However, deeper architectures result in longer training times due to the increased number of parameters. As a result, the purpose of this study is to compare the ResNet-50, ResNet-101, and ResNet-152 architectures using CXR image data to classify pneumonia and COVID-19 diseases.
The contributions of this research are as follows:
Our study is useful for conducting a comparative analysis of the three ResNet architectures used, namely ResNet-50, ResNet-101, and ResNet-152, to identify diseases that affect the lungs using X-ray images. By obtaining the highest evaluation score and the lowest error rate for each architecture, it is possible to determine which ResNet architecture has the most optimal modeling, allowing accurate lung disease detection.
Our research has the potential to contribute to the academic literature by demonstrating how increasing the number of layers and parameters can improve model accuracy. This study also proves that the models with more layers and parameters resulting in better evaluations and faster performance speeds than previous model architectures.
The study conducted can benefit various stakeholders, particularly radiologists. The use of deep learning technology can help increase the efficiency of the work performed; additionally, the quality of the resulting diagnosis can be improved based on the assessment scores. The government’s use of technology can help diagnose disease sooner, allowing carrying out of preventive measures and treatment more quickly, reducing costs, time, and energy required.
The rest of this paper is organized as follows:
Section 2 contains several research papers on the classification of pneumonia and COVID-19 using the ResNet architecture.
Section 3 describes the dataset, data preprocessing, network architecture, and metric evaluation used in this study.
Section 4 explains and discusses the outcome of each proposed architecture. Finally,
Section 5 brings the paper to a close.
2. Related Works
This section contains research-related material, such as general work on the classification of lung disease data using the ResNet-50, ResNet-101, and ResNet-152 algorithms. These studies form the foundation for our investigation of efficient and effective methods for analyzing lung disorders using classification techniques. Various researchers have contributed to the identification of lung disease using artificial intelligence and X-ray imaging of the lungs as a result of rapid technological advancements.
Medical imaging has become an essential diagnostic tool for a wide range of diseases since the discovery of X-ray imaging in 1895. Ilhem Conrad Rontgen was the first to discover X-rays in 1895 [
13]. X-rays are a technique for diagnosing health problems and monitoring a person’s health. A two-dimensional image of the inside of the human body is obtained by using long-wave electromagnetic radiation that can penetrate body tissue. Many imaging techniques have been developed since then, including computed tomography, magnetic resonance imaging, ultrasound, and positron emission tomography. The use of medical images for treatment dates back to the discovery of X-rays, and automatic analysis of medical images first appeared in 1960 [
14]. Some research is conducted using computers as a tool, but due to limited access, this work is severely limited. Several researchers from the University of Chicago’s Kurt Rossmann Laboratory began developing machine learning systems and medical image analysis techniques in the 1980s [
15]. Some disease cases are extremely complex because they necessitate large amounts of data from various image types, such as 2D, which necessitates hundreds of images, and 3D, which necessitates thousands of images. As a result, as the amount of data analyzed grows, so does the workload of radiologists and physicians. Deep learning methods have become an important solution in medical imaging in recent years.
CXR images are an example of medical data in the form of complex pattern images. As a result, a deep learning model is used in this study, with the goal of enabling computers to learn features automatically from data and perform complex tasks without being explicitly programmed. Several studies have shown that network depth is critical because it provides better accuracy results than shallower networks [
16,
17]. Deeper networks can also introduce new issues like disappearing or exploding gradients, both of which have an adverse effect on the model, making the model more complex and challenging to drill [
18]. He et al. [
11] proposed a deep residual learning framework to address this issue. ResNet is a network that has deeper layers than the VGG network.
The ResNet architecture introduces skip connections, also known as residual connections, which allow the flow of the gradients directly through alternative bypass paths [
19]. This addresses the issue of vanishing gradients in deep neural networks, where gradients shrink to zero and impede learning. By using residual blocks, we can train an effective deep neural network. Through residual connections between layers, input can spread more quickly. As a result, we can expand our network, and ResNet offers researchers flexibility in determining the number of layers to use because it has several versions with different number of layers, such as ResNet-18 with 18 layers, ResNet-34 with 34 layers, ResNet-50 with 50 layers, and several other types of ResNet. However, it should be kept in mind that as the number of layers increases, so does the number of networks and parameters used.
An experiment was first built in a study conducted by He et al. [
11] comparing plain networks with 18 and 34 layers. According to the results of these experiments, 34-layer plain nets have a higher error rate than 18-layer plain nets. However, when residual blocks and skip connections were added to the 34-layer plain net and the 18-layer plain net to create ResNet-18 and ResNet-34, the results changed, indicating that networks with more layers have higher error rates. Then, in the following experiment, the authors changed the ResNet-34 layers by replacing every two-layer block with three-layer bottleneck blocks, yielding ResNet-50. ResNet-101 and ResNet-152 were created as a result of changes to more than three-layer blocks. Despite the fact that the addition reduced the number of FLOPs, ResNet-152 (11.3 billion FLOPs) had a lower complexity than VGG-16 and VGG-19 (15.3 and 19.6 billion FLOPs, respectively). Yessi Jusman’s 2023 research comparing ResNet-101 and VGG-19 to identify the severity of prostate cancer [
20] found that the ResNet-101 architecture had an average accuracy value of 97.70%, while the VGG-19 architecture had an accuracy value of 96.49%. ResNet-101 outperformed VGG-19 in this case; additionally, ResNet-101 required 34 min and 38 s to train the model, whereas VGG required 56 min and 38 s. ResNet’s advantage, with its large number of layers, is the reason why it is widely used in a variety of studies, including medical image data research. For example, Chhabra and Kumar [
21] developed a model to detect pneumonia in patients, allowing a more quick and accurate run of the detection process. The ResNet-50 architecture was used in conjunction with transfer learning to obtain images from two distinct classes, normal and pneumonia. The model was then evaluated using the confusion matrix, and the result was that it had a high accuracy value of 94%. ResNet-50 was used by Al-Haija and Adebanjo [
22] to accurately diagnose breast cancer in histopathological images, demonstrating its potential for improving medical image interpretation. Similarly, Reddy and Juliet [
23] used ResNet-50 and transfer learning to achieve proficient malaria cell image classification, demonstrating its utility in disease detection. Furthermore, Shadab et al. [
24] addressed cancer detection using ML and the ResNet-50 architecture, extending the model’s potential in the field of histopathology with promising results.
The ResNet-101 architecture was also used to classify medical image data on brain tumor datasets [
25]. The study included three types of tumors: meningiomas, gliomas, and pituitary tumors. The preprocessing process includes zero-centering and intensity normalization; additionally, the evaluation results are compared using augmentation in the preprocessing process. The accuracy value produced without augmentation was found to be 89.93%, but when additional augmentation was added to the data, the accuracy rate increased to 93.83%. The use of augmentation during the preprocessing stage was shown to improve model accuracy in Ahuja et al. [
26] studies. The use of the ResNet-101 architecture also demonstrated remarkable significance in a variety of domains of medical image analysis, as evidenced by the following studies. Xue et al. [
27] took on the difficult task of dealing with noisy labeled medical images, a common issue in real-world datasets, by using ResNet-101 for robust skin lesion classification. Their research demonstrated the architecture’s ability to improve classification accuracy, particularly in scenarios with label noise. Abirami et al. [
28] investigated COVID-19 classification in the context of the ongoing global health crisis using an innovative application of medical image synthesis using generative adversarial networks (GANs). Their research used ResNet-101 as a key component in generating and classifying synthetic medical images, contributing to the fight against the pandemic and demonstrating the adaptability of the ResNet-101 architecture.
The ResNet-50 and ResNet-101 architectures proved to be versatile and effective tools for medical image analysis, as evidenced by the studies listed below. Athisayamani et al. [
29] used ResNet-152, a ResNet variant, to extract features for MRI brain tumor classification. Their work demonstrated the architecture’s ability to extract meaningful features from medical images, which were then optimized for dimension reduction to improve brain tumor classification accuracy. In a related field, Roy et al. [
30] investigated the use of ResNet-152 for Alzheimer’s disease diagnosis. There was research conducted to classify binary classes and multi-classes. It was divided into two classes: Alzheimer’s Disease and Cognitive Normal in binary classification, and Alzheimer’s Disease, Cognitive Normal, Early Mild Cognitive Impairment, and Late Mild Cognitive Impairment in multiclass classification. ResNet-152 was tested with a variety of medical image datasets and was found to be 99.30% accurate for binary classification and 98.79% accurate for multiclass classification. Data processing was performed with great care, and it played an important role in improving accuracy. The authors contributed to the advancement of medical image-based diagnostic approaches for Alzheimer’s disease by leveraging the power of ResNet-152.
Previous research has shown that ResNet-50, -101, and -152 have advantages for accurate medical image analysis. When compared to the previously produced ResNet-34, the resulting ResNet-50, -101, and -152 have a higher level of accuracy [
31]. This is supported by experimental results for error rates of various methods, which show that ResNet-50, -101, and -152 have lower error rate values than other methods such as VGG, GoogleLeNet, VGG (v5), PreLU-net, BN-inception, ResNet-34 B, and ResNet-34 C. ResNet-50 has a 5.25% top five error rate, ResNet-101 has a 4.60% top five error rate, and ResNet-152 has a 4.49% top five validation error. This single model outperforms all previous ensemble results. Experiments on the ImageNet dataset were also conducted, and it was discovered that ResNet-152 had a top five error of 3.57% in the test set, earning it first place at ILSVRC 2015.
Abubakar et al. [
32] attempted to compare these ResNet-50, -101, and -152 architectures to classify data on human skin burns, which are divided into two categories: burnt skin and injured skin (bruises and pressure sores). Before beginning the classification stage, data were preprocessed by rotating and flipping. Two experiments were carried out during the feature extraction stage, namely by performing additional linear SVM to classify features that did not require additions. Based on these experiments, it was discovered that the ResNet-152 model, whether SVM was added or not, had the highest level of accuracy, namely 99.52% without SVM additions and 99.96% with SVM additions. After ReNet-152, ResNet-101 had the second highest level of accuracy, with 98.81% for those without additions and 99.87% for those with SVM additions. ResNet-50 had the lowest level of accuracy in this study when compared to the other two ResNets, with 98.33% for the model that was not added and 99.87% for the model that was added. This paper also discussed the discovery that increasing the number of layers in ResNet improves its accuracy. Setiawan [
33] investigated the impact of varying image dimensions and exposure fusion framework enhancements on the performance of pneumonia detection using different ResNet architectures, including ResNet-50, ResNet-101, and ResNet-152, in contrast to Abubakar et al. This study discovered that ResNet-50 outperforms the other version of ResNet by systematically analyzing the influence of image dimension and exposure fusion techniques.
Three ResNet architectures, ResNet-50, -101, and -152, are compared in this study. This ResNet series was chosen based on the research summary, which stated that ResNet-50, -101, and -152 are effective for medical image analysis. This study aims to prove that increasing the layer on the ResNet has an effect on the resulting level of accuracy and investigates which of the three architectures is best used in classifying lung disease from CXR.
3. Materials and Methods
In this section, there is an explanation of the analysis process based on the data utilized. The data preparation stage, the research steps according to the technique to be selected, as well as the evaluation of the selected model are performed.
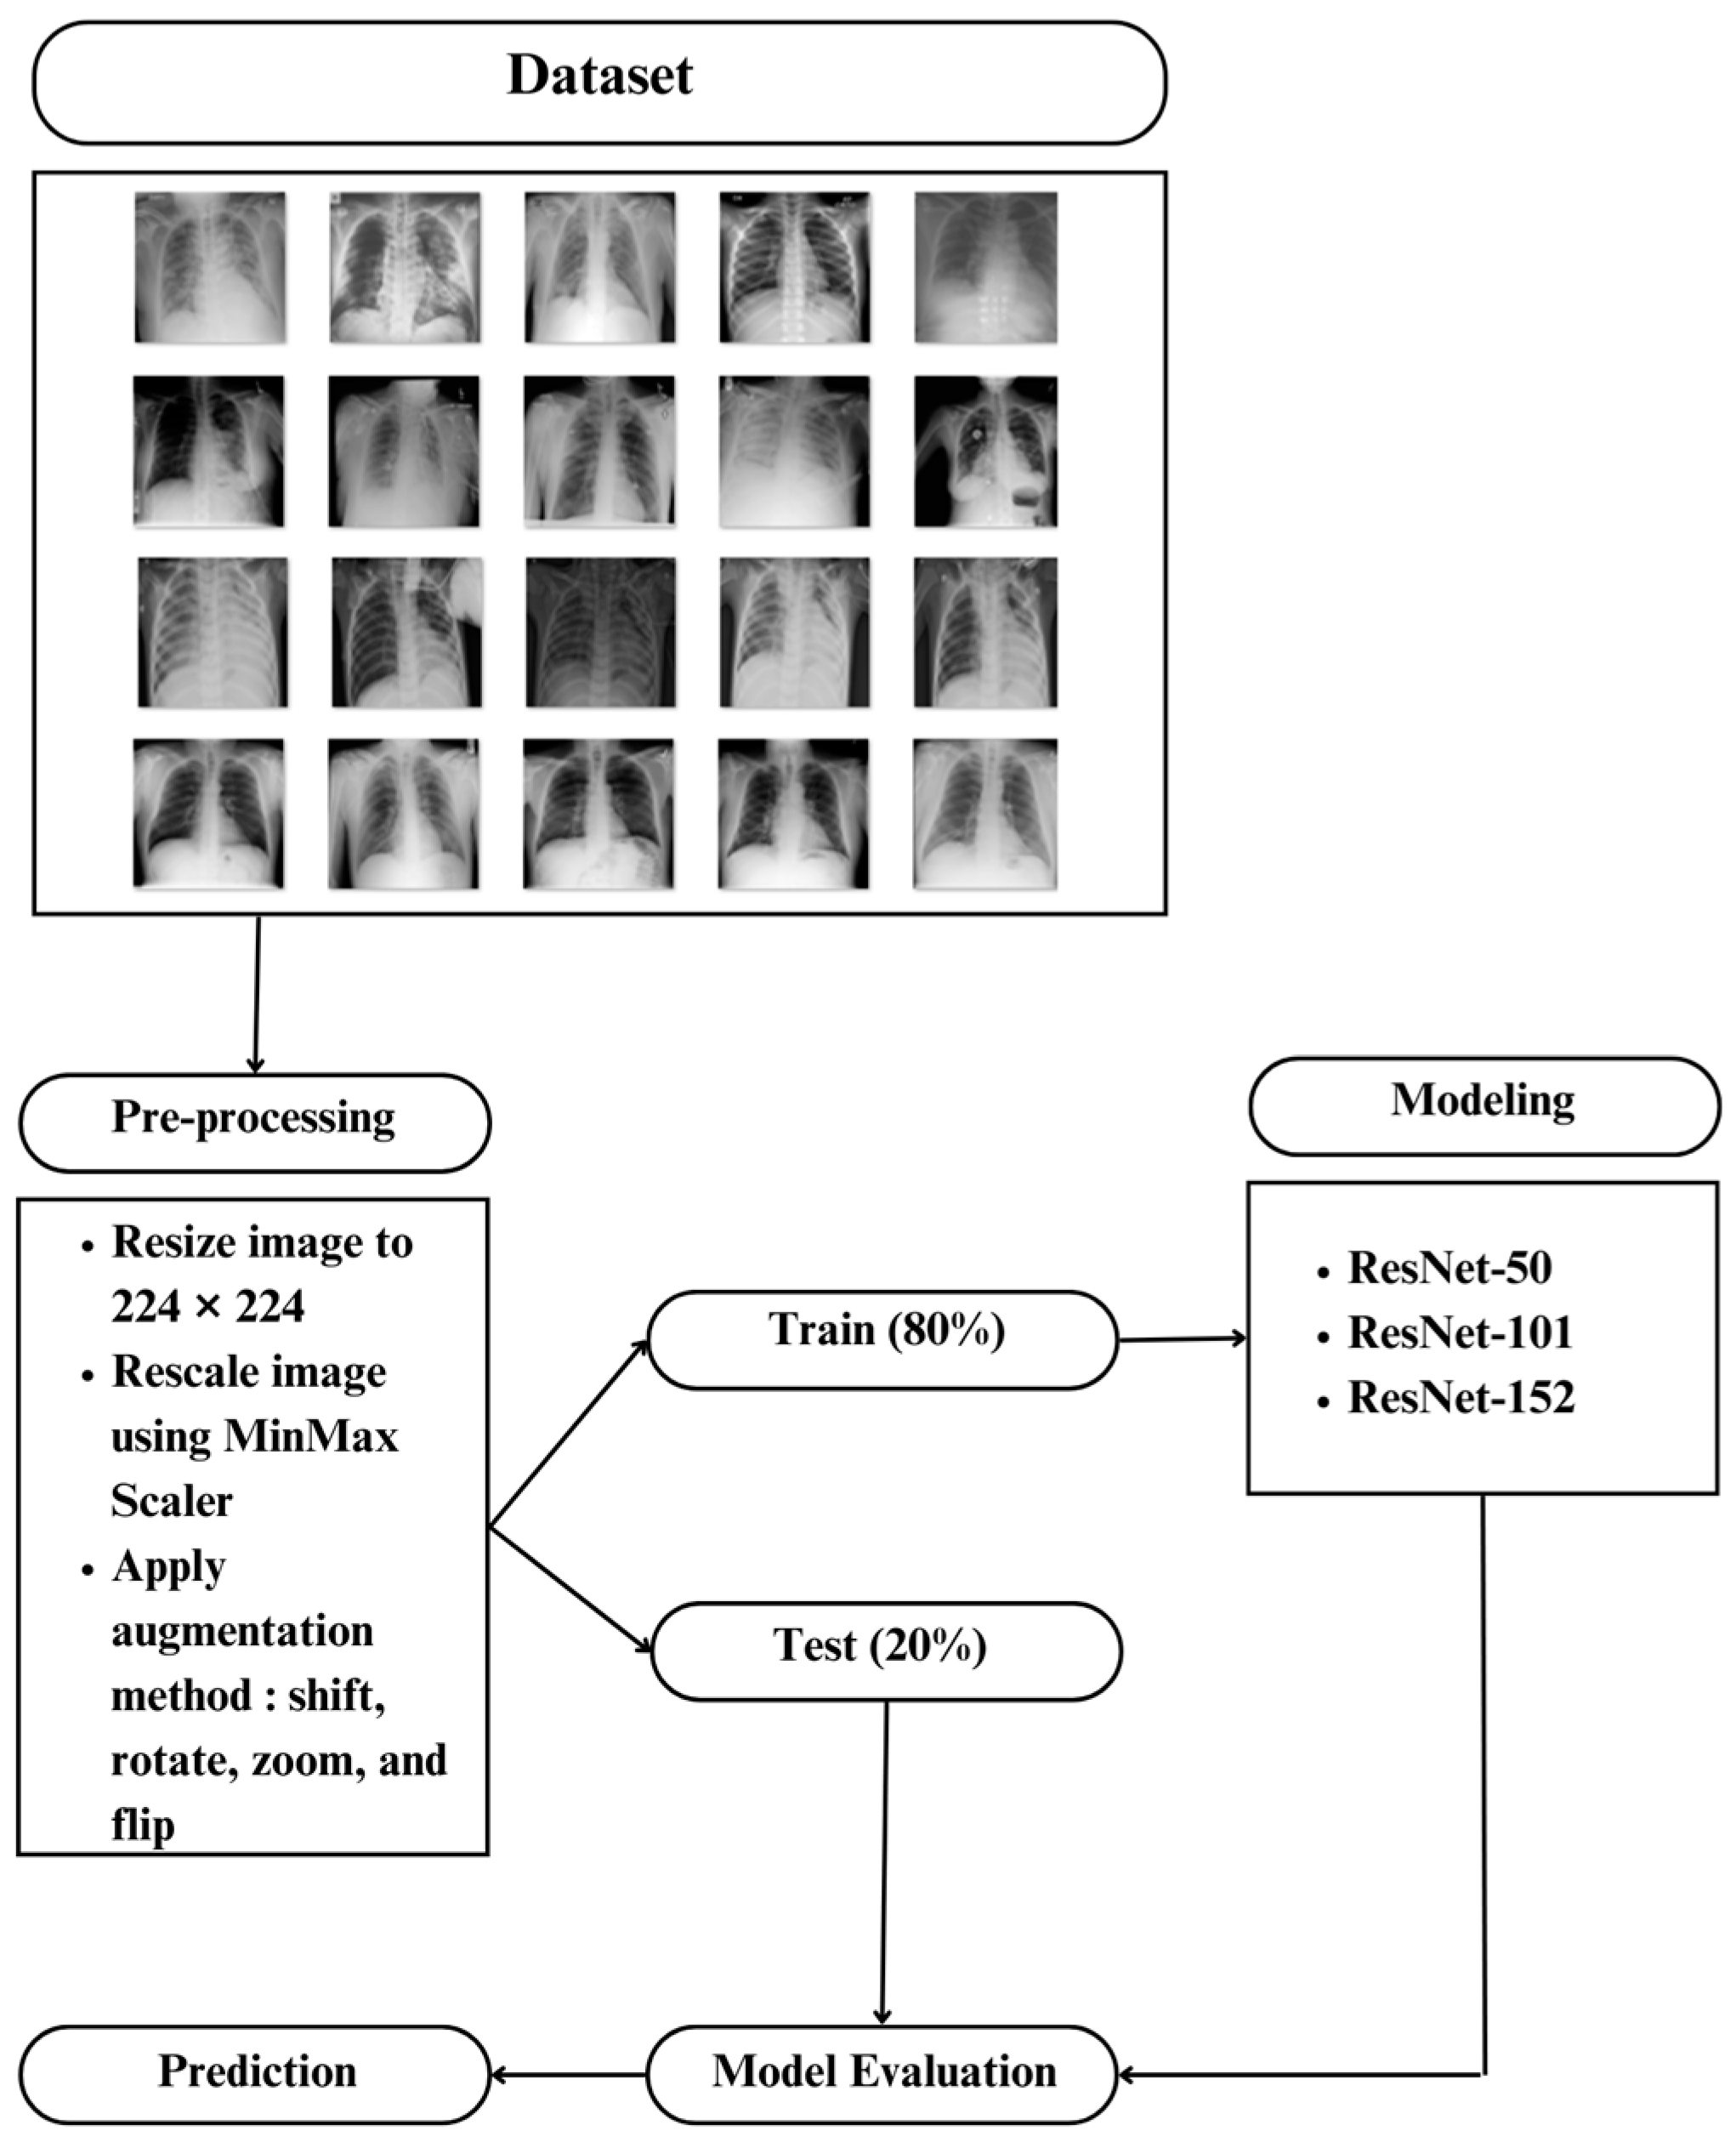
3.1. Dataset
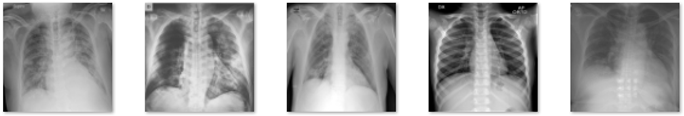
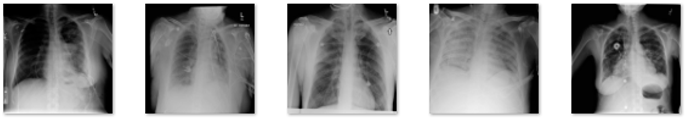
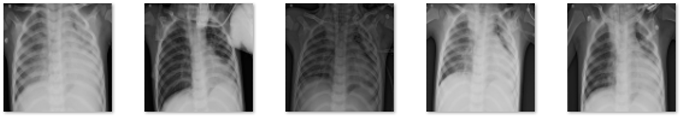
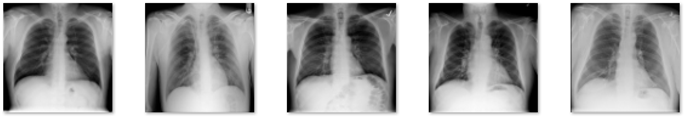
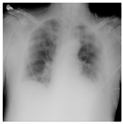
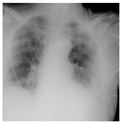
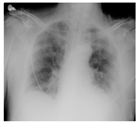
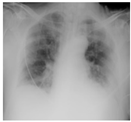
In this study, data in the form of a collection of medical images were used as the input, and lung X-rays, also known as CXR, are commonly used to identify or detect disorders found in the lungs, such as lung disease, pneumonia, lung cancer, and even COVID-19. This study’s dataset is renewable and was obtained from M.E.H. Chowdhury et al. [
34] and Rahman, T. et al. [
35]. These data were obtained from the COVID-19 DATABASE of the Italian Society of Medical and Interventional Radiology (SIRM), the Novel Corona Virus 2019 Dataset developed by Joseph Paul Cohen, Paul Morrison, and Lan Dao on GitHub, and images extracted from 43 different publications. This study’s data were obtained from patients, whether they had the disease or not, and included 3616 images of patients infected with COVID-19, 1345 images of pneumonia, 6012 images of lung opacity, and 10,912 images of normal lungs. In
Table 1, five samples for each class are presented.
3.2. Data Preprocessing
This study’s research steps began with preparing the data used, separating the data into training and test data, followed by the data preparation stage, also known as data pre-processing, modeling using the ResNet-50, ResNet-101, and ResNet-152 architectures, and evaluating the selected model. Some preparation was required before the data entered the modeling process so that the existing data could construct an accurate model and the model could deliver good results. As a result, some transformations or adjustments to the pixel data were required, both to adapt to the model’s architecture and to improve the model’s accuracy.
Since the data received had varying pixel sizes, all data sizes were converted to 224 × 224 for equalizing the size before being named according to the class or folder that was formed. To speed up model training and uniform values in the data, 0–255-pixel values in the data were normalized by conversion to a scale of 0–1. After normalizing the data, we used data augmentation to diversify the available data, allowing the model the study of additional data throughout the training process, resulting in better training on the targeted characteristics [
2].
The enhancement strengthened the final model’s resistance to various types of noise [
36]. Shifting, picture reversal, rotation, and image amplification are common augmentation techniques [
37]. We changed the image or vertically and horizontally shifted it. Additional versions of the model were formed by adjusting the position of objects in the image, making the model more general. Datasets that were enhanced with an image shift of 10% produced better assessment results than datasets that were not enhanced [
38]. As a result, a 10% image shift is used in this investigation.
Flipping is a technique in image augmentation that involves flipping an image along one of its axes, typically a horizontal or vertical axis, to increase the amount of training data and improve a model’s performance in pattern recognition or other image processing tasks. Modifications like these can make the trained model more robust and capable of recognizing objects in different orientations. Datasets with horizontally flipped photos can significantly improve dataset diversity, allowing the training of model with more images from the same dataset and achievement of an evaluation score of more than 90% [
39]. As a result, horizontal image inversion is used in this investigation. Meanwhile, rotation in image augmentation is the technique of rotating an image at a specific angle around its center point. The goal is to generate variations in perspective from the same image so that models trained with augmented data become more resistant to changes in the orientation of the same object in the image. Using rotated images in the −30° to +30° range [
40] results in a higher level of accuracy. As a result, an image rotation of 30° is used in this investigation. Zooming or magnification of an image is also added by zooming in by 20% to improve the model’s assessment value [
41]. In
Table 2, visualization example of image augmentation are shown.
3.3. Network Architecture
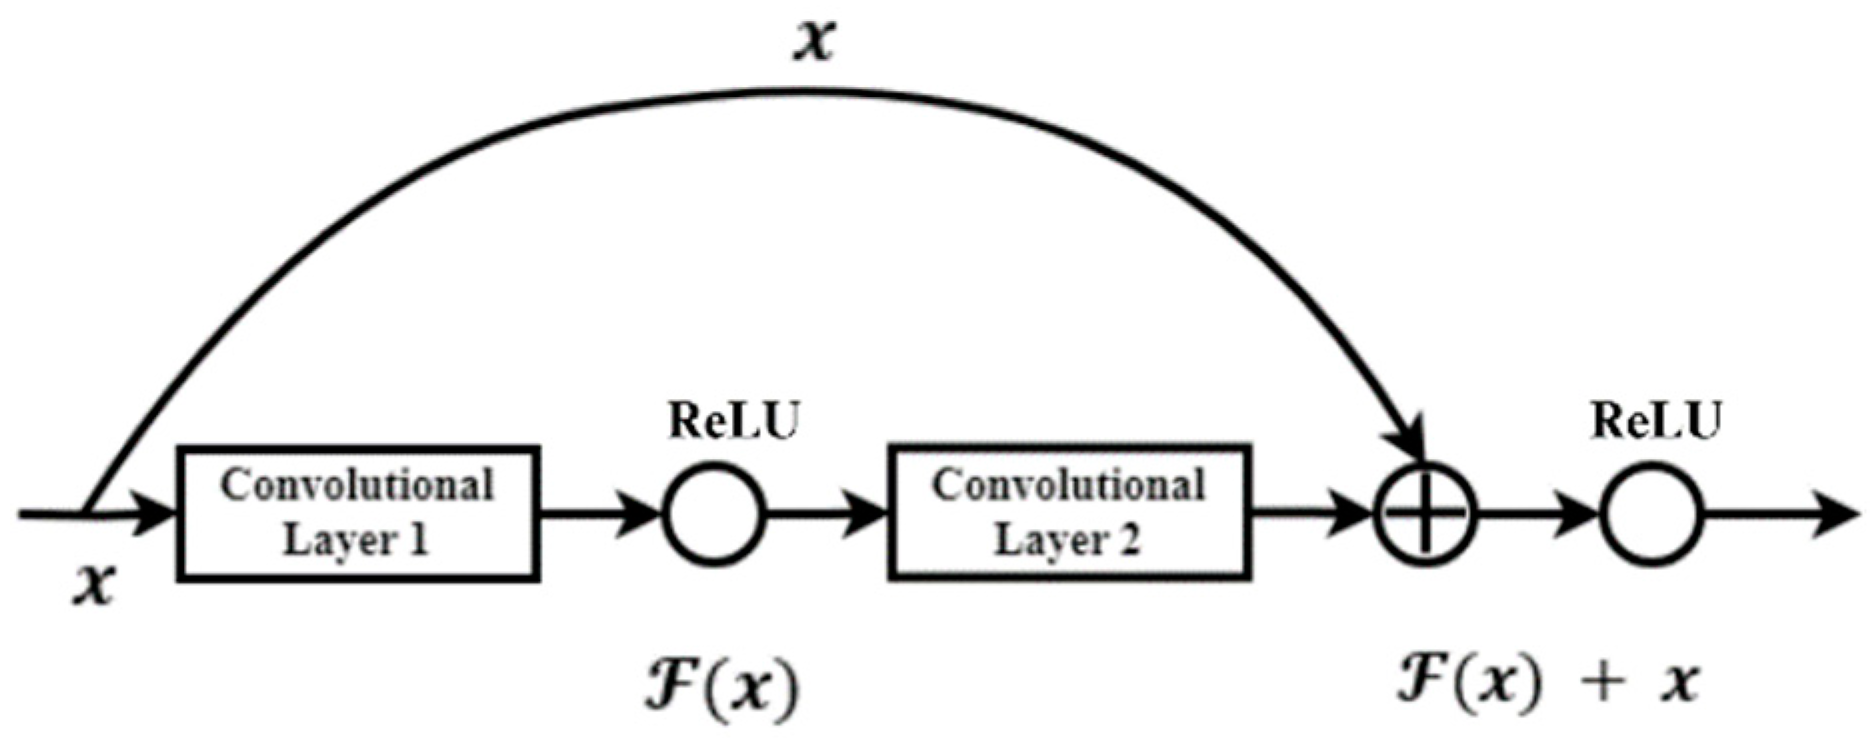
The modeling process begins after the data is pre-processed. The modeling in this work is performed using the ResNet-50, -101, and -152 architectures. He et al. [
11] pioneered this architecture to enable much deeper network training than was previously possible. The greater the depth of the neural network, the more difficult it is to train. As a result, He et al. reformulated the remaining learning function layer, also known as the residual block. This block is present in each layer of the CNN ResNet architecture and serves as the design’s foundation. The representation of the residual block can be found in
Figure 1. The network is easy to optimize and can gain greater accuracy from that depth by using this residual block [
42].
ResNet, or “residual network”, is one of the Convolutional Neural Network (CNN) topologies. CNN has three basic layers: convolutional layers, pooling layers, and fully connected layers. Furthermore, there are several other procedures that work to improve the accuracy of the CNN algorithm’s classification, such as zero padding, ReLU activation, and batch normalization. ResNet is made up of several layers, including the convolution layer, the pooling layer, the dropout layer, and the fully connected layer.
One advantage of using a residual network is that it can solve the vanishing gradient problem. The presence of residual blocks addresses this issue, as gradients can reach the first layer without undergoing the same number of multiplications as in architectures without residual blocks. These blocks add a shortcut path that acts as an identity function, bypassing the training process for one or more layers indirectly. ResNet has several architectures, and the ResNet 50, 101, and 152-layer architectures are used in this study. Each architecture is depicted in the diagrams below.
When compared to the VGG architecture, the ResNet can create deeper layers while remaining less complex. On the ImageNet test set, Ensemble had an error rate of 3.57% [
16]. Convolutional neural networks with the ResNet architecture are a suitable method for effectively classifying CXR images of COVID-19 patients’ lungs due to the advantages of the ResNet architecture, such as maintaining performance even with deeper architectures, lighter computational calculations, and better network training capabilities.
The number of layers is what fundamentally distinguishes ResNet-50, ResNet-101, and ResNet-152. The three networks are named after the number of layers they have. ResNet-50, for example, has 50 layers, ResNet-101 has 101 levels, and ResNet-152 has 152 layers that the data pass through during the modeling process.
Table 3 describes the explanation for each model. The initial convolutional layer with kernel sizes of 77% and 33% is applied to each input image. The ResNet architecture is divided into four stages. The network starts with three residual blocks, each with three layers, in the first stage. The kernel sizes used for convolutional operations in the first-stage blocks’ three layers are 64, 64, and 128, respectively.
According to
Table 3, every input that enters the ResNet architecture first proceeds through a convolutional layer. Convolution is a mathematical term for repeatedly applying one function to the output of another function. Convolution uses the output function as a feature map of the input image. This process entails taking a small-number matrix, known as a filter, and applying it to the input image based on the value of the filter. The convolution operation can be calculated using the formula in Equation (1), where
represents the input image and
represents the kernel used. The
and
represent the row and column indexes, respectively.
A ReLU activation function is used in several convolution layers to make learning in the model using training data faster and more effective by keeping positive values and mapping values to zero values. The ReLU activation function’s equation is as follows:
The pooling layer is the layer that follows the convolution layer and the ReLU activation function. This layer is made up of a filter with a fixed stride size that moves across the feature map area. To improve computing speed, the pooling layer reduces the number of parameters and spatial size of an image. At each filter change, Max Pooling selects the maximum value in the area to be chosen.
In the subsequent stages, there are differences in the number of layers for each architecture. In the second stage, ResNet-50 and ResNet-101 have four layers, while ResNet-152 has eight layers, with respective kernel sizes of 128, 128, and 512.
ResNet-50 has six layers in the third stage, ResNet-101 has 23 layers, and ResNet-152 has 36 layers, with kernel sizes of 256, 256, and 1024. Each architecture has three layers in the final stage, with kernel sizes of 512, 512, and 2048, respectively. Finally, the network includes an average pooling layer followed by a fully connected layer with 1000 neurons (ImageNet output classes). Average pooling reduces the image by taking the average value of the specified area at each filter change, as the name implies. The fully connected layer connects all activation nerves from the previous layer to the next. The feature map obtained from the convolution and pooling layers is fed into the full connection layer. The equation is output at the full connection layer.
A bottleneck design is used for deeper networks such as ResNet-50, ResNet-101, and ResNet-152. Three layers are stacked together for each residual function. These layers are made up of 11, 33, and 11 convolutions. The 11 convolutional layer is in charge of shrinking and then restoring the dimensions. With smaller input and output dimensions, the 33 layers act as a bottleneck. Skip connections are performed every three layers in the ResNet architecture. Convolutional operations in the residual blocks are performed with a stride size of 2 when transitioning from one stage to the next. As a result, the input size in terms of height and width is cut in half.
3.4. Metric Evaluation
In quantifying the performance of the classification model, and to determine the most suitable technique, the confusion matrix is employed. The confusion table can display and compare the value to the model’s expected value. The precision, recall, and F1-score are typical evaluation matrices used in this study.
Precision is a metric that represents the probability that the data are truly positive, given that they have been classified as positive. Precision is the difference between a correctly predicted positive outcome and an overall positive prediction. Precision can be expressed mathematically as follows:
Recall, also referred to as sensitivity, is a measure used to assess the ability of a test to identify true positives. It is calculated by comparing the number of true positive predictions to the total number of actual positive instances. The F1-score is calculated by summarizing accuracy and sensitivity/recall through the computation of their averages. The formula for recall and F1-score are in Equations (5) and (6), respectively.
In this context, TP (True Positive) and TN (True Negative) represent the sum of data instances whose actual class matches the predicted class. On the other hand, FP (False Positive) and FN (False Negative) denote the sum of data instances whose actual class does not align with the predicted class.
3.5. Experimental Setting
The modeling procedure is carried out at this point in order to obtain weights that can be used to properly categorize CXR. Several hyperparameters, including the learning rate and optimizer used, are chosen for model training in this training. The batch size is 32 and the number of epochs used is 50. The optimizer used in this study is Adam, since it produces good results quickly [
43]. The initial learning rate is 1 × 10
−6; however, Adam calculates the learning rate using an adaptive approach based on various parameters. Adam can be used as an optimization technique as a substitute for the classical stochastic gradient descent procedure to update the weights iteratively based on training data.
A loss function plays a crucial role in assessing the performance of an algorithm in modeling data. It quantifies the disparity between the algorithm’s current output and the desired or expected output. Focal loss is a specific type of loss function utilized in multi-class classification tasks, particularly when dealing with imbalanced data. This function is designed to focus on examples that challenge the model’s accuracy, preventing it from making unreliable predictions. Consequently, focal loss helps the model improve its performance on challenging examples, making it effective in overcoming these obstacles [
44].
Existing data are divided into training data and test data, with a comparison ratio of 80% (16,933 images) for training data, which include 2893 COVID-19 images, 1076 pneumonia images, 4810 lungs opacity images, and 8730 normal lung images. The remining 20% (4232 images) are for test data, which include 723 COVID-19 images, 269 pneumonia images, 1202 lungs opacity images, and 2183 normal lung images. Additionally, images in the preprocessing stage are classified using the ResNet-50, ResNet-101, and ResNet-152 architectures. The general classification process is depicted in
Figure 2 using the ResNet-50, ResNet-101, and ResNet-152 architectures.
4. Results
The preceding section outlines the data analysis procedure, including the stages of data preparation, research steps aligned with the selected approach, and model evaluation. In this chapter, we offer a comprehensive insight into the process and outcomes of classifying chest X-rays (CXR) using a Convolutional Neural Network (CNN) with the ResNet-50, ResNet-101, and ResNet-152 architectures.
In this section, we delve into the training process of the three ResNet architectures, aiming to achieve precise classification of CXR images. Each incoming image serves as input and undergoes an initial convolutional layer with kernel sizes of 77% and 33%. The ResNet architecture is partitioned into four stages, commencing with the first stage, which comprises three residual blocks, each consisting of three layers. The convolutional operations within the layers of the first-stage blocks employ kernel sizes of 64, 64, and 128, respectively.
The number of layers for each architecture differs in the subsequent stages. In the second stage, Res-Net-50 and ResNet-101 have four layers, whereas Res-Net-152 boasts eight. In terms of kernel sizes, the second stage employs sizes of 128, 128, and 512 for each architecture, respectively. Moving to the third stage, ResNet-50 employs six layers, ResNet-101 incorporates 23 layers, and ResNet-152 features an impressive 36 layers. Here, the kernel sizes are 256, 256, and 1024 for the respective architectures. In the fourth stage, all three architectures share the same number of layers. The kernel sizes applied in each architecture for this stage are 512, 512, and 2048, respectively. Furthermore, the network incorporates an average pooling layer, followed by a fully connected layer consisting of 1000 neurons that represent the ImageNet classes.
A bottleneck design is used for deeper networks such as ResNet-50, ResNet-101, and ResNet-152. Three layers are stacked together for each residual function. These layers are made up of 11, 33, and 11 convolutions. The dimensions are reduced and then restored by the 1-1 convolution layer. With smaller input and output dimensions, the three-layer system acts as a bottleneck. Skip connections are performed for three layers in the ResNet architecture. The convolution operation in the residual block is performed with a stride size of two, reducing the input size to half of its height and width when transitioning from one stage to the next.
Following the training process, the model is evaluated to determine its performance. The model’s performance is determined by making predictions on the test data and comparing the results to the true labels. The resulting confusion matrix is shown below.
According to
Table 4, the research findings do not indicate the occurrence of overfitting. The small difference in accuracy values between the training and testing processes demonstrates this. Similarly, there are no significant differences between the training and testing loss values.
Table 5 compares the classification performance of the three ResNet architecture models on CXR images. To evaluate the performance of each model, we examine the values of each metric used, namely recall, precision, and F1-score. The ResNet-152 architecture achieves the highest performance in each metric by using a learning rate of 10-6. The ResNet-50 architecture, on the other hand, yields the model with the lowest performance in each metric.
Table 6 provides a visual representation of the identification outcomes based on the different ResNet architectures utilized in this study. From the information presented, it is evident that the three ResNet architectures performed reasonably well in recognizing various lung diseases among patients. However, it is important to note that these models are not without their limitations. One notable challenge is distinguishing between the lung opacity and normal classes, as they share similar characteristics, making accurate recognition and classification a challenging task. This highlights the fact that despite significant technological advancements, there is still room for improvement, especially in enhancing model accuracy in scenarios where visual characteristics overlap or are similar.
5. Discussion
In this study, three different ResNet architectures were employed for the classification of four distinct class categories: COVID-19, pneumonia, lung opacity, and normal. The CXR data used in this research were sourced from Chowdhry et al. [
34] and Rahman, T. et al. [
35] updates. Specifically, the study focused solely on images of normal lungs, pneumonia, lung opacities, and COVID-19 patient lungs, omitting consideration of other lung-related conditions such as fractures, pneumothorax, or heart failure.
The third model was trained using a dataset comprising 16,933 images, which included 2893 COVID-19 images, 1076 pneumonia images, 4810 lung opacification images, and 8730 normal lung images. To ensure model performance and prevent overfitting, model testing was carried out using a test dataset. It is worth noting that this dataset only included four class classifications, but there is hope that additional class categories will be introduced in the future. This expansion would enable the model to identify a wider range of lung diseases comprehensively, thereby enhancing its utility for medical professionals in diagnosing various lung conditions with greater specificity.
In this research, we used three ResNet architectures with different levels of depth. These architectures were ResNet-50, ResNet-101, and ResNet-152. The depth of each architecture corresponded to its respective name. ResNet-50 consisted of one convolution layer , followed by maxpooling , then entered the residual block section with skip connections, each consisting of three convolution layers of size and , three for the first part, four for the second part, six for the third part, and three for the fourth part. Therefore, the total layers used in this architecture were 50 layers and produced an f-1 score of 90.75. The second architecture, namely ResNet-101, had the addition of a convolution layer from the ResNet-50 architecture, namely in the third part, the residual block and skip connection, so that three convolution layers measuring and became 23 pairs. This had an impact on the resulting F1-score value of 93.25. Likewise, for the third architecture, namely ResNet-152, which was a development of the previous ResNet architecture because it increased the number of convolution layers in the second and third residual blocks and skip connections to 8 pairs and 36 pairs, respectively. As with ResNet-101, which experienced an increase in the resulting F1-score value, ResNet-152 produced the highest F1-score value among the other ResNet architectures used, namely 94.50. This experiment illustrates that adding the number of layers from ResNet-50 to ResNet-101 can yield an improvement in model performance of up to 2.5%. A similar result was achieved when extending ResNet-101 by adding layers to ResNet-152, which had an increasing performance of 1.5%.
The three architectures were used to create an X-ray image classification model with high evaluation values. The primary goal of CNN modeling is to achieve maximum accuracy with the least amount of loss. The assessment matrix found that each model had limitations in identifying lung opacity and normal classes due to a very large error value. According to the Centers for Disease Control and Prevention (CDC) [
45], this challenge can arise due to the presence of two distinct types of lung opacity: small opacity and large opacity. Small opacity refers to opacities with dimensions less than 10 mm, while large opacity refers to opacities with dimensions greater than 10 mm. This distinction between the two types of opacities introduces complexity in classification, contributing to the observed difficulties in accurate identification. As a result, the models run the risk of misclassifying lung opacity and normal as having small opacity.
The ResNet-152 architecture demonstrated powerful performance compared to the other architectures across various metrics, including recall, precision, and F1 score, as indicated by the results of the confusion matrix evaluation. This aligns with previous research findings that suggest higher accuracy can be achieved with deeper architectures [
32]. The ResNet-152 model’s significantly greater number of layers compared to other ResNet architectures allowed it the learning of more complex patterns and consequently achievement of improved performance. According to the analysis results, the time required for one epoch of training was 461 s for ResNet-152, 311 s for ResNet-50, and 549 s for ResNet-101. This discrepancy in training times is attributed to the fact that as the number of layers in an architecture increases, so does the number of parameters used. ResNet-152 boasted 58 million parameters, while ResNet-50 had 23 million, and ResNet-101 had 42 million. Consequently, training times were extended. Therefore, the choice of architecture should be aligned with the specific requirements of the research or use case. While ResNet-152 offered superior performance, it came at the cost of increased computational demands, so researchers should consider their computational resources and objectives when selecting the most appropriate architecture.
Deployment, as a crucial step in facilitating the diagnosis of lung problems in patients by medical personnel, involves the creation of an application-based model for enhanced usability. This process entails the necessity of retraining the model to prevent any potential decline in performance, which could have critical consequences. Moreover, ongoing validation and supervision by radiologists ensures that the model maintains its accuracy over time. However, when considering the broader application of the model to generalize for all lung disease patients across diverse demographics, geographic locations, and healthcare service standards, it is evident that the current dataset remains limited and constrained. Consequently, there is a clear need for the acquisition of additional datasets. These new datasets are essential to train the model effectively, allowing it distinguishing between various types of data variance and ensuring its robust performance in diverse real-world scenarios. Expanding the dataset to encompass a wider range of cases and demographics enhances the model’s ability to provide accurate diagnoses and predictions for a more diverse patient population.
6. Conclusions
The models were trained on a dataset consisting of four classes: pneumonia, COVID-19, lung opacity, and normal in a study on the classification of CXR images for pneumonia and COVID-19 using convolutional neural networks with three different architectures, namely ResNet-50, ResNet-101, and ResNet-152. The performance of each architecture was measured by recall, precision, and F1-scores. ResNet-50 achieved the best precision with a value of 92% in the normal and lung opacity classes, the highest recall value of 96% in the pneumonia class, and the F1-score value of 91%. The ResNet-101 architecture produced the highest precision value in the COVID-19 class of 95%, the highest recall value in the pneumonia class of 96%, and a f1-score of 93%. The ResNet-152 architecture produced the highest precision value in the COVID-19 class of 97%, the highest recall value in the pneumonia class of 97%, and a F1-score of 94%. Because ResNet-152 outperformed all other ResNet models in classifying CXR images in pneumonia and the COVID-19 disease, the ResNet-152 is the best model for classifying CXR images in pneumonia and the COVID-19 disease.
To avoid data imbalance, the research data for each class should be improved in the future, particularly for classes with fewer data points than other classes. A larger dataset is expected to be used in future research to identify other lung diseases in a more specific manner.
Future research should result in a more adaptive model that can continuously update during the training process by incorporating new data. Other methods can be combined with the ResNet architecture to produce improved methods and architectures in the future. The study’s findings, which are currently in the form of a model, are suggested to be used in an application to help medical professionals effectively diagnose lung diseases under the supervision of radiology experts.

 ,
, 
