
Digitalization of Management Processes in Small and Medium-Sized Enterprises—An Overview of Low-Code and No-Code Platforms


Abstract
:1. Introduction
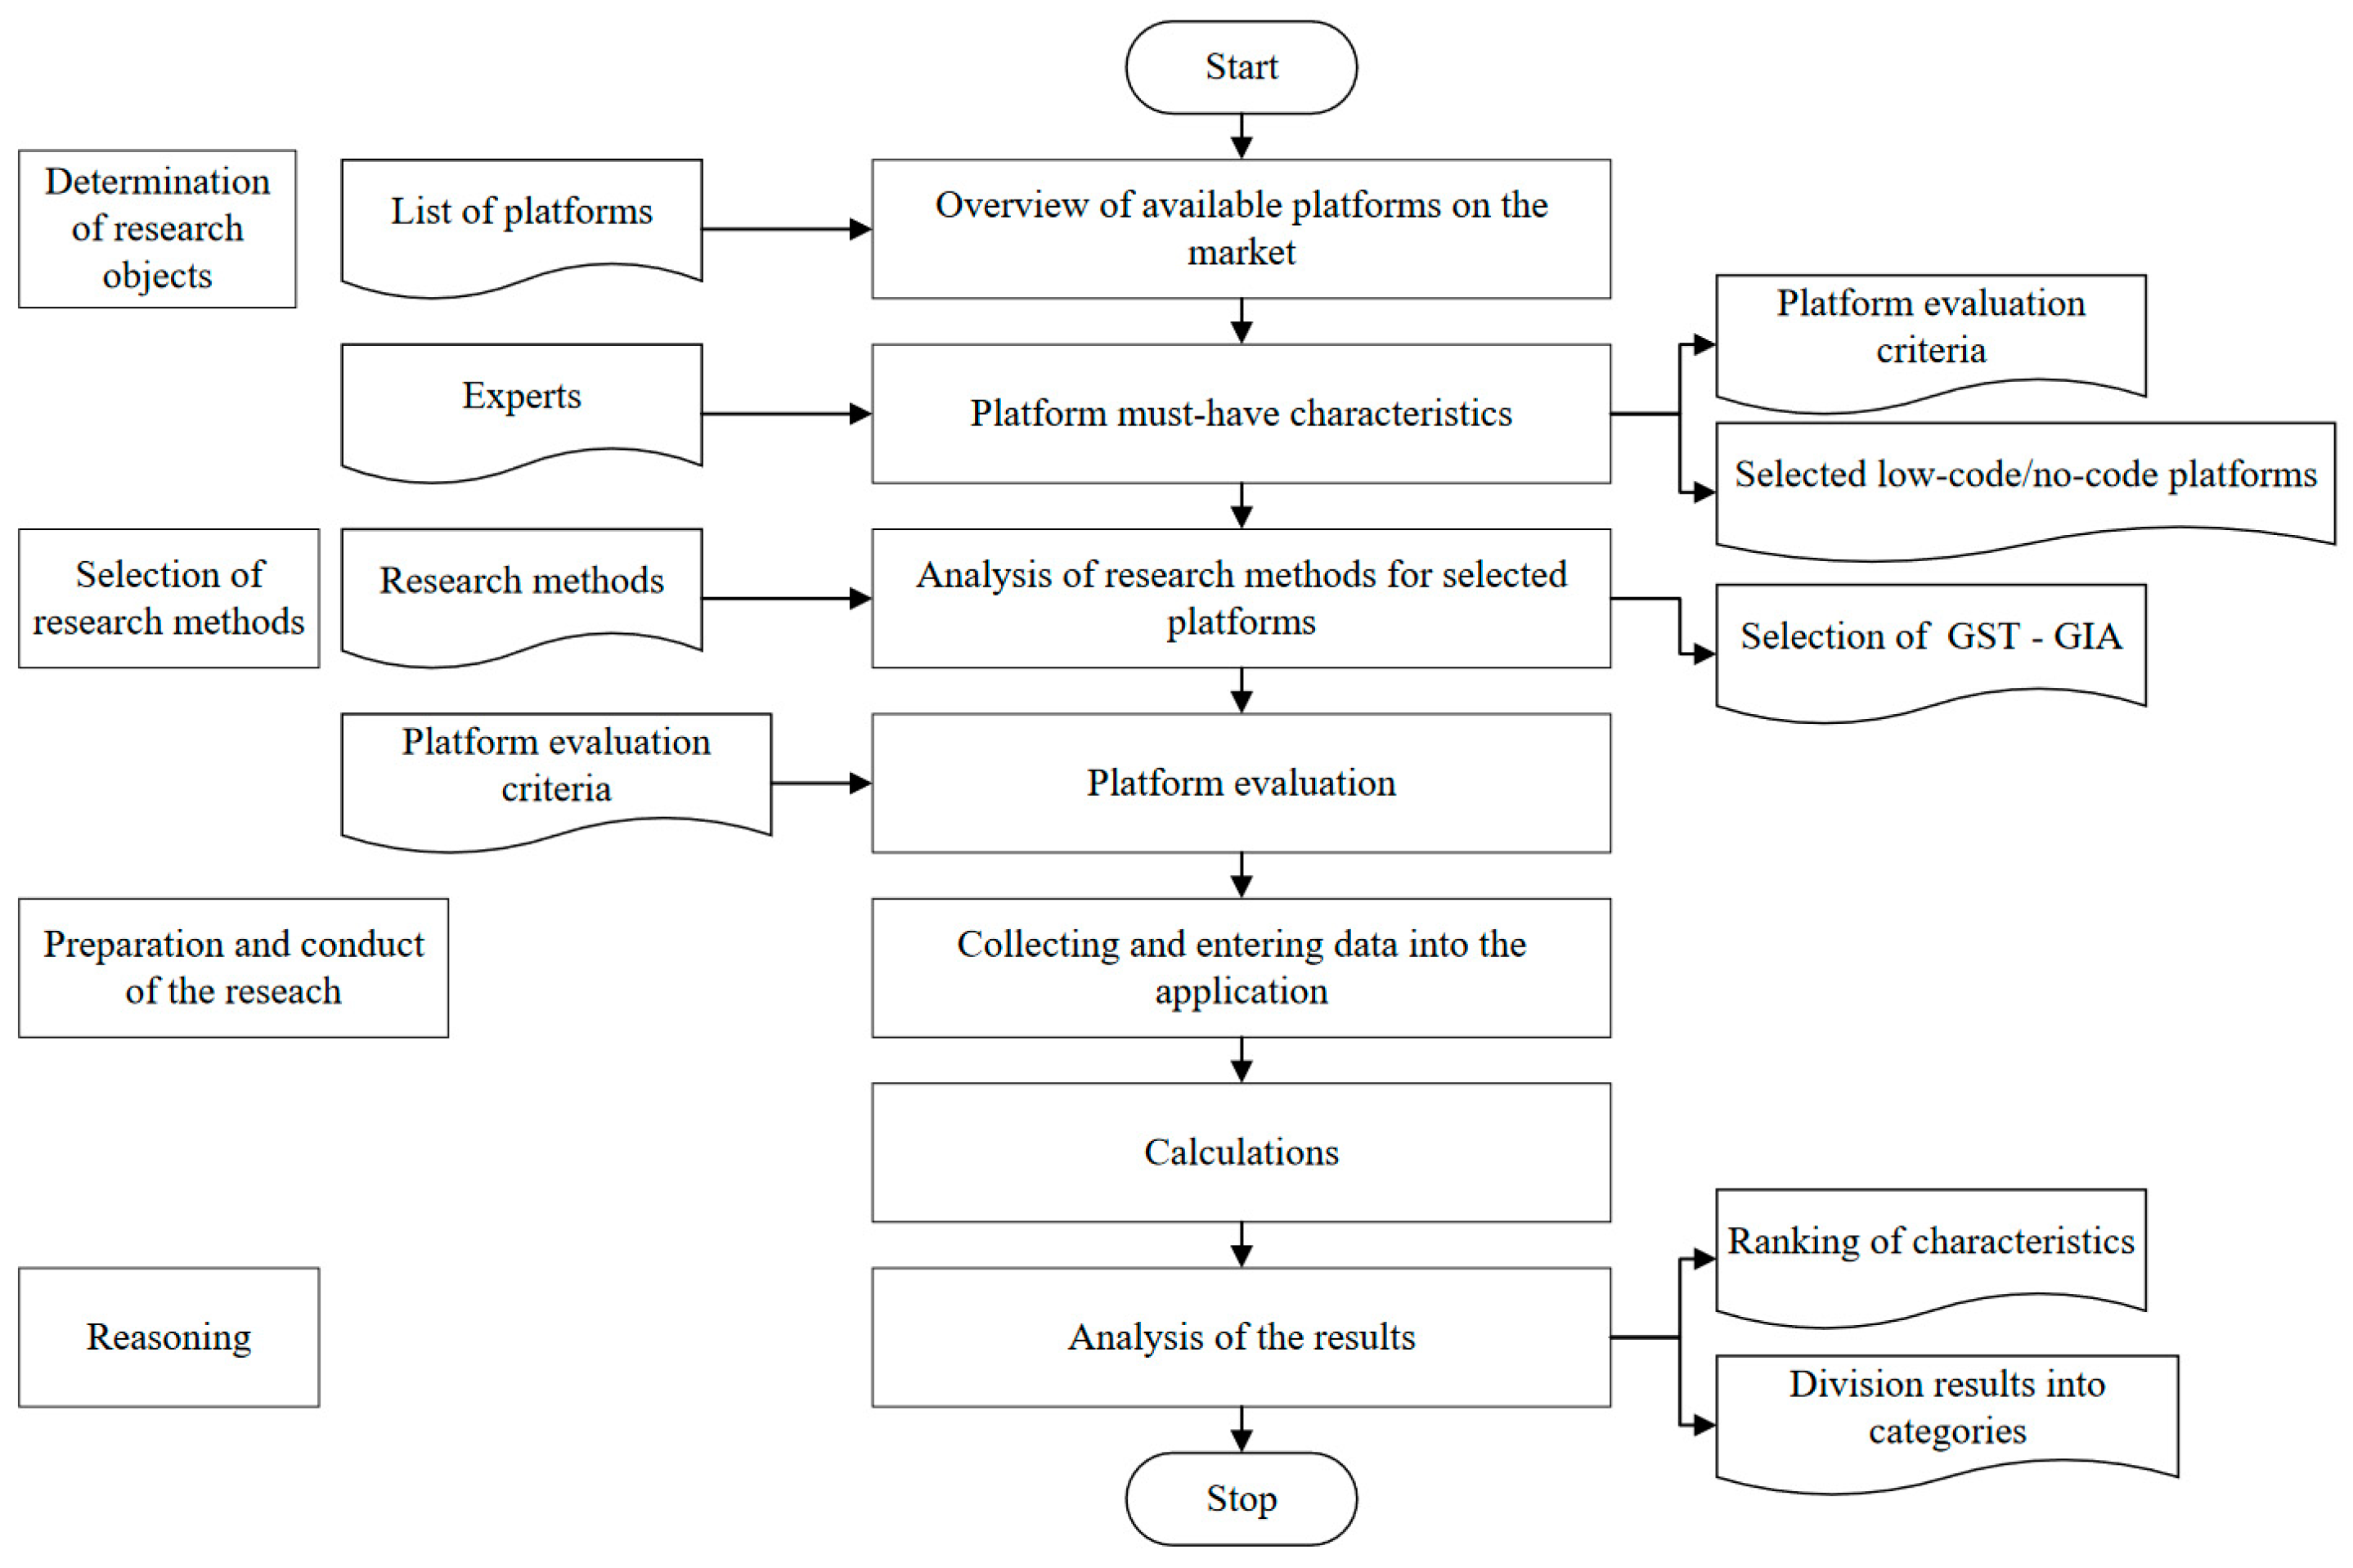
2. Materials and Methods
- Determination of research objects:
- 2.
- Selection of research methods:
- 3.
- Preparation for and performance of the research:
- 4.
- Reasoning:
- Data Sensitivity and Reliability: GIA heavily relies on the quality of the input data. In the context of digital platforms, the data can be vast, varied, and sometimes inconsistent. Any inaccuracies or incompleteness of the data can significantly skew the results, leading to unreliable conclusions.
- Subjectivity in Factor Selection: The choice of factors (variables) that are analyzed in GIA is subjective. In evaluating digital platforms, the omission of relevant factors or the inclusion of less significant ones can bias the outcome. The method does not inherently account for the relevance or weight of different factors, which can be crucial in complex digital environments.
- Linear Assumptions in a Non-Linear Context: GIA often assumes a linear relationship between variables. However, digital platforms often operate in a highly dynamic and non-linear environment, where interactions between variables are complex and not easily quantifiable through linear methods.
- Oversimplification of Complex Relationships: GIA simplifies the relationships between variables to a single degree of incidence. This simplification can be a significant limitation in digital platforms, where the relationships between variables are multi-faceted and influenced by a myriad of external and internal factors.
- Lack of Contextual Analysis: GIA primarily focuses on a numerical relationship between variables, often overlooking the qualitative aspects. In digital platforms, contextual factors like user behavior, market trends, and technological advancements play a crucial role in the determination of the platform’s success or failure.
- Inadequate for Predictive Analysis: While GIA can provide insights based on existing data, it is not inherently predictive. In the rapidly evolving digital landscape, the ability to forecast future trends and the adaptability of platforms is crucial, which GIA might not adequately address.
- Difficulty in Handling Big Data: Digital platforms often generate vast amounts of data. GIA, traditionally, may not be well suited to handling such big data efficiently, potentially leading to oversights or errors in analysis.
- Cultural and Contextual Biases: When evaluating global digital platforms, GIA might not fully account for the cultural and regional differences that can significantly influence user interaction and platform effectiveness.
- Change Over Time: Digital platforms are subject to continuous evolution. The static nature of GIA might not capture the dynamic changes over time effectively, leading to outdated or irrelevant findings.
- Interdependence of Factors: In digital platforms, factors are often interdependent. GIA’s typical approach of analyzing the factors in isolation may not capture these interdependencies accurately, leading to a distorted understanding of the platform’s functionality and user experience.
3. Results and Discussion
- Too high complexity: if a platform is too complex to learn and use among non-programmers, it may not fulfill its basic task as a low-code/no-code tool.
- Lack of scalability: small and medium-sized enterprises often expect rapid growth—if a platform is unable to be scaled with a business, it may be the wrong choice.
- Insufficient integration possibilities: many companies use different systems and tools—if a low-code/no-code platform does not allow easy integration with the existing technological ecosystem, this may be a reason for rejection.
- Lack of flexibility: sometimes, low-code/no-code platforms can be too limited, making it impossible to adapt the application to the specific needs of a company.
- Safety and compliance: if a platform does not meet safety standards or regulatory requirements, this can be a serious problem.
- Costs: the cost of a platform may be too high, especially if additional costs such as training, maintenance, extension, etc., are taken into account.
- Technical support and community: the lack of solid technical support or an active community of users can make a platform less attractive.
3.1. Ease of Use: Essential for User Engagement and Efficiency
- Intuitive User Interfaces: The interface should be straightforward, minimizing the learning curve for new users. This includes clear labels, logical navigation, and the consistent design of elements to make the platform approachable and easy to understand.
- Drag-and-Drop Functionality: This feature allows users to interact with the platform in a more tactile and visual manner, simplifying complex processes. It is especially beneficial in tasks like organizing data, customizing layouts, and managing content, making the platform more accessible to non-technical users.
- Customizable Templates and Modules: Templates provide a starting point for various tasks, saving time and effort. Modules, or pre-built components, can be assembled in different combinations, offering flexibility while maintaining ease of use. These features cater to a diverse needs and skill levels, enabling users to create or modify content without starting from scratch.
3.2. Evaluating Ease of Use
- User Experience Tests: These involve the observation of users as they interact with the platform, identifying any hurdles or points of confusion. This hands-on approach provides direct insights into the user journey, highlighting the areas for improvement.
- Surveys and Feedback: Soliciting feedback through surveys or questionnaires gives users a voice, offering valuable perspectives on their experience. Questions can be tailored to gauge users’ satisfaction with the interface, the understandability of features, and the overall efficiency of the platform.
3.3. Focus of the Study
- User Interface Intuitiveness: How instinctive is the navigation? Are the features and tools easily discoverable?
- Speed and Performance: Does the platform perform tasks quickly and efficiently? Are there any lags or loading issues that hinder the user experience?
- User Satisfaction: How do users feel about their interactions with the platform? Is it meeting their expectations, in terms of simplicity and functionality?
3.4. Flexibility: Customization and Adaptability for Diverse Business Needs
- Broad Range of Functionality: These platforms provide a wide array of features and tools, catering to a spectrum of business operations. This includes diverse data management options, communication tools, analytical capabilities, and more, allowing businesses to select and use the functionalities most relevant to them.
- Customization Options: The ability to tailor applications to specific business requirements is a key aspect of flexibility. This might involve modifying workflows, creating custom reports, or adjusting user interfaces to better suit the specific processes and preferences of a business.
- Modular Design: Offering modular components that can be added, removed, or modified enables businesses to build a platform that grows and changes with their needs. This approach allows for incremental changes without overhauling the entire system.
3.5. Assessing Flexibility
- Adaptation to Business Needs: Assesses how the platform can be adjusted to fit unique business processes. This involves looking at how workflows can be customized, whether the platform can handle varying data types and volumes, and whether it can be integrated with existing business tools.
- User-Centric Customization: Determines the ease with which users can modify the platform. Considers whether users can easily change settings, customize dashboards, and create user-defined fields without extensive technical knowledge.
- Scalability: Considers how well the platform can scale as the business grows. Does it support an increasing number of users, more complex workflows, or larger data sets without a decline in performance?
3.6. Conducting a Study
- Availability and Diversity of Features: Examination of the range of features offered by the platform and how these can cater to different business operations.
- Template and Module Availability: Evaluation of the variety and usability of templates and modules that can be employed to customize the platform.
- Integration Capabilities: Assesses how well the platform integrates with other systems and tools, an important factor in maintaining seamless operations across different business applications.
3.7. Potential: Fostering Growth and Evolution in Business Applications
- Scalability of Applications: These platforms are designed to grow alongside the business. This means that they can handle increased user numbers, larger data volumes, and more complex processes without a decline in performance.
- Continuous Development Capabilities: Tools with high potential are not static; they are constantly evolving, with developers actively working on new features and improvements. This ensures that the tool remains relevant and effective in the face of a changing business landscape and technological advancements.
- Adaptability to Changing Needs: As businesses evolve, their requirements can change. Platforms with high potential can adapt to these changing needs, whether this means integrating a new technology, accommodating a new business model, or expanding to new markets.
3.8. Evaluating Potential
- Ease of Development and Expansion: Examine how easily a new functionalities can be added to the platform. This includes looking at the platform’s architecture to see if it supports plug-ins or add-ons, and whether it has a robust API for integration.
- Update Frequency and Quality: Regular updates are a sign of a platform’s commitment to growth. Assess the frequency and impact of updates and upgrades—do they add significant value, and are they responsive to user feedback and market trends?
- Long-Term Viability: Consider the platform’s track record and future roadmap. Does it have a history of consistent improvement? Is there a clear plan for future development?
3.9. Conducting a Study
- Scalability: How does the platform handle increased operational demands? Insights into its performance under varying levels of stress and its ability to maintain efficiency and reliability as it scales.
- Availability of New Features and Updates: Investigation of the history and a forecast of new functionalities to be added. This includes the frequency of updates and the nature of the features added—are they keeping pace with technological advancements?
- Adaptability to Changing Business Needs: Assess how the platform has adapted over time to new business trends and user requirements. This can be gauged by looking at case studies or user testimonials to understand how the platform has supported businesses in their growth and adaptation to market changes.
3.10. Service and Support: Ensuring Reliability and User Confidence
- Responsive Technical Support: These platforms provide timely and effective solutions to technical issues. This involves not only addressing problems quickly but also ensuring that the solutions are effective and prevent future occurrences.
- Comprehensive Service Offerings: Beyond troubleshooting, exemplary service includes a range of support options like onboarding assistance, regular check-ins, and proactive maintenance. This comprehensive approach helps users to maximize the tool’s potential.
- User-Centric Assistance: Support services should be tailored to the varying skill levels and needs of the users. This might include the offering of different tiers of support or providing specialized assistance for different aspects of the platform.
3.11. Evaluating Service and Support
- Responsiveness and Effectiveness: Evaluate how quickly the support team responds to inquiries and how effectively they resolve issues. This can be measured through response time metrics and user satisfaction ratings following support interactions.
- Range of Support Channels: Consider the diversity of support channels available, such as email, phone, live chat, and community forums. A variety of channels ensures that users can seek help in the way that suits them best.
- Quality of Interaction: Assess the expertise and professionalism of the support team. Are they knowledgeable about the platform? Do they communicate clearly and empathetically?
3.12. Conducting a Study
- Speed and Effectiveness of Technical Support: Measure of how quickly the support requests are addressed and resolved. This can involve tracking the average response time and resolution time, as well as analyzing case studies of complex support scenarios.
- Availability of Training and Support Materials: Examine the range and quality of training resources and supporting documentation. This includes user guides, FAQs, video tutorials, and webinars. Assess how helpful these materials are in assisting users to understand and use the platform effectively.
- Quality of Documentation: Review the comprehensiveness and clarity of the documentation provided. Well-structured, easy-to-understand, and regularly updated documentation is essential for user self-service and problem resolution.
3.13. Costs: Balancing Affordability and Value in Business Tools
- Reasonable Pricing: These platforms offer their services at prices that are justifiable, based on the features and benefits provided. They strike a balance between cost and quality, ensuring that users receive good value for their investment.
- Flexible Pricing Options: Flexibility in pricing caters to a wider range of businesses, from startups to large corporations. This may include tiered pricing models, pay-as-you-go options, or customized pricing plans based on specific user needs.
- Transparency in Costs: It is important that platforms clearly outline all associated costs, including any potential fees for additional services or functionalities. This transparency helps users to make informed decisions and plan budgets effectively.
3.14. Evaluating Costs
- Variety of Pricing Options: Investigate the range of pricing plans available. Are there any options suitable for different sizes and types of businesses? Do the plans offer flexibility to scale up or down based on changing needs?
- Associated Costs: Look beyond the base price to understand the full cost of using the platform. This includes additional charges for extra features, support services, integration with other tools, and any maintenance fees.
- Value for Money: Evaluate whether the costs align with the value provided. Does the platform offer features and benefits that justify its price? Are there any cost-saving benefits in the long run due to increased efficiency or other advantages?
3.15. Conducting a Study
- Availability of Pricing Options: Analyze the different pricing plans offered and their suitability for various business needs. This includes an examination of the features included in each plan and any restrictions or limitations.
- Total Cost of Ownership: Assess the overall cost of using the platform over a significant period, including subscription fees, additional feature costs, and any other recurring expenses.
- Comparison with Competitors: Compare the platform’s pricing with similar tools on the market. This helps in understanding how the tool’s pricing stands in terms of market standards and whether it offers a competitive advantage.
- Relevance to a Broad Audience: By selecting platforms that are popular and widely recognized, our research remains relevant to a larger segment of the business community, including SMEs. These platforms, due to their widespread adoption, provide a more comprehensive understanding of the general landscape.
- Data Availability and Reliability: Popular platforms often have more readily available data, user reviews, and comprehensive documentation. This abundance of information allows for a thorough and reliable analysis.
- Benchmarking Purposes: Well-known platforms serve as effective benchmarks in the industry. Their features, performance, and market reception set standards against which other platforms can be compared, offering valuable insights into what constitutes success in the market.
- Feasibility and Scope Management: Considering every available platform is impractical due to resource constraints. Focusing on the most popular ones helps in managing the scope of the research, ensuring that it is comprehensive, yet feasible.
- Reflecting Market Trends: Popular platforms are often indicative of current market trends and user preferences. Analyzing these platforms provides an insight into what businesses are currently valuing and the directions in which market trends are heading.
- 1.00–0.85—model platforms. They have a comprehensive infrastructure for the fast and easy creation, testing, and implementation of applications. Often available in both cloud and classic versions, they offer the easy creation of forms and reports, and integration with various data sources; they also have various types of authorization and authentication and modules for the easy management of user rights. These platforms offer ready-made components for use in the designed processes, documentation is available, and support for the user is provided in various channels.
- 0.84–0.80—very good platforms. They offer a fairly comprehensive infrastructure, but they may have some limitations in some areas; they may have fewer modules for the management of user rights and authorization, and their documentation and support for users may be less extensive or available only in selected channels. They may also offer fewer ready-made components that can be used in application design; however, they still provide the easy creation of forms and reports, and integration with various data sources. They may be available in both cloud and classic versions, but their cloud functionality may be slightly more limited. These platforms offer robust tools for application development, but they may require more work and skill from the user for the best results.
- 0.80–0.70—good platforms. They include basic application development tools such as form editors, report creators, and simple tools for data integration. They are usually available in cloud or local versions, but do not offer as many ready-made modules and components as the best platforms in the ranking. They often lack advanced user rights management tools. The documentation and user support are not always as developed as in the case of highly rated platforms, yet they are still good tools, especially for small businesses or individual developers who need a quick and easy way to create an application without having to write code from scratch.
4. Conclusions
Author Contributions
Funding
Informed Consent Statement
Data Availability Statement
Conflicts of Interest
References
- SAP Insights. Czym Jest Transformacja Cyfrowa? 2023. Available online: https://www.sap.com/poland/insights/what-is-digital-transformation.html (accessed on 1 March 2023).
- Bhattacharyya, S.S.; Kumar, S. Study of deployment of “low code no code” applications toward improving digitization of supply chain management. J. Sci. Technol. Policy Manag. 2023, 14, 271–287. [Google Scholar] [CrossRef]
- Pinho, D.; Aguiar, A.; Amaral, V. What about the usability in low-code platforms? A systematic literature review. J. Comput. Lang. 2023, 74, 101185. [Google Scholar] [CrossRef]
- Di Ruscio, D.; Kolovos, D.; de Lara, J.; Pierantonio, A.; Tisi, M.; Wimmer, M. Low-code development and model-driven engineering: Two sides of the same coin? Softw. Syst. Model. 2022, 21, 437–446. [Google Scholar] [CrossRef]
- Lin, Y.B.; Luo, H.; Liao, C.C. CATtalk: An IoT-Based Interactive Art Development Platform. IEEE Access 2022, 10, 127754–127769. [Google Scholar] [CrossRef]
- Noel, R.; Panach, J.I.; Pastor, O. Challenges for Model-Driven Development of Strategically Aligned Information Systems. IEEE Access 2022, 10, 38237–38253. [Google Scholar] [CrossRef]
- da Cruz, M.A.A.; de Paula, H.T.L.; Caputo, B.P.G.; Mafra, S.B.; Lorenz, P.; Rodrigues, J.J.P.C. Olp—A restful open low-code platform. Futur. Internet 2021, 13, 249. [Google Scholar] [CrossRef]
- Agarwal, V.; Mathiyazhagan, K.; Malhotra, S.; Pimpunchat, B. Building resilience for sustainability of MSMEs post COVID-19 outbreak: An Indian handicraft industry outlook. Socioecon. Plann. Sci. 2023, 85, 101443. [Google Scholar] [CrossRef] [PubMed]
- Piao, G.; Xiao, B. Analyzing the Effectiveness of Finance in Supply Chain in Solving the Financing Difficulties of SMEs Based on Grey Theory Model. Comput. Intell. Neurosci. 2022, 2022, 7608937. [Google Scholar] [CrossRef]
- Cheng, Y.; Wang, K. Decomposition of fuzzy exponential mathematical quantitative process in industrial manufacturing design. J. Intell. Fuzzy Syst. 2021, 40, 6059–6068. [Google Scholar] [CrossRef]
- Zeng, Y.R.; Wang, L.; Xu, X.H. An integrated model to select an ERP system for Chinese small- and medium-sized enterprise under uncertainty. Technol. Econ. Dev. Econ. 2017, 23, 38–58. [Google Scholar] [CrossRef]
- Khan, H.; Faisal, M.N. A Grey-based approach for ERP vendor selection in small and medium enterprises in Qatar. Int. J. Bus. Inf. Syst. 2015, 19, 465. [Google Scholar] [CrossRef]
- Zhang, Q.; Chen, R. Application of metabolic GM(1,1) model in financial repression approach to the financing difficulty of the small and medium-sized enterprises. Grey Syst. 2014, 4, 311–320. [Google Scholar] [CrossRef]
- Tang, X.; Wang, C. GEM listed companies’ internal control effectiveness based on grey incidence analysis. J. Grey Syst. 2014, 26, 38. [Google Scholar]
- Zhang, Q. The effects of financial deepening on income inequality based on grey incidence analysis: Empirical evidence from China. Grey Syst. 2014, 4, 495–504. [Google Scholar] [CrossRef]
- Domański, R.; Wojciechowski, H. Comparison of CRM Systems Dedicated to SMEs in Terms of the Omnichannel Concept. In Smart and Sustainable Supply Chain and Logistics—Trends, Challenges, Methods and Best Practices; Springer: Cham, Switzerland, 2020. [Google Scholar]
- Available online: https://www.peerspot.com/categories/business-process-management-bpm (accessed on 13 March 2023).
- Available online: https://www.gartner.com/reviews/market/business-process-automation-tools (accessed on 13 March 2023).
- Available online: https://www.g2.com/categories/low-code-development-platforms (accessed on 13 March 2023).
- Available online: https://www.pcmag.com/picks/the-best-low-code-development-platforms (accessed on 13 March 2023).
- Liu, S.; Yang, Y.; Forrest, J. Grey Data Analysis; Springer: Berlin/Heidelberg, Germany, 2017. [Google Scholar]

| LNC | LNCP | SME | GST | GIA | |
| LNC | 26 (10) | 1 (1) | 0 (0) | 0 (0) | |
| LNCP | 1 (0) | 0 (0) | 0 (0) | ||
| SME | 23 (8) | 5 (2) | |||
| GST | 322 (155) | ||||
| GIA |
| Source | Year | Scope of Interest |
|---|---|---|
| [2] | 2023 | The article assesses the understanding of the LNC applications and their scope of use for web design, rapid application development, and supply chain digitization; economical and easy to maintain LNC application development can help SMEs to compete with large organizations. |
| [3] | 2023 | The article analyzes the current literature on LNC platforms, with an overview of the platforms and their usability in particular, which factors are the most relevant and how users perceive these tools. |
| [4] | 2022 | An expert article comparing low-code approaches (programming platforms), identifying their differences and similarities and analyzing their strengths and weaknesses. |
| [5] | 2022 | The article presents CATtalk a platform focused on creating and maintaining interactive works of art; thanks to mechanisms with LNC, artists can manipulate CATtalk with little or no programming effort. |
| [6] | 2022 | The article presents project challenges for the integration of business strategy information into a programming method based on Model-Driven Development (MDD) and LNC platforms. |
| [7] | 2021 | The article presents the Open Low-Code Platform (OLP) a low-code solution for the creation of applications by inexperienced users. |
| Source | Year | Scope of Interest |
|---|---|---|
| [8] | 2023 | The article presents an analysis of the key challenges connected with building resilience in craft SMEs using the Grey Decision-Making Trial and Evaluation Laboratory. |
| [9] | 2022 | The article presents the use of grey system models to solve the problems of financing SMEs in the supply chain. |
| [10] | 2021 | In the article, the method of fuzzy exponential correlation of greyness is used to assess the quantitative process of industrial production design in the context of SMEs, among others. |
| [11] | 2017 | The article presents the use of grey logic to select ERP systems appropriate to the specificity of SMEs. |
| [12] | 2015 | The article presents a multi-criteria decision-making model for the selection of an ERP provider for SMEs, based on the effective use of the concept of grey numbers. |
| [13] | 2014 | The article focuses on the course of financial repression and its impact on financing (SMEs) based on the classic GM model. |
| [14] | 2014 | In the article, based on GST, using the method of grey relational analysis, the effectiveness of the internal control of quoted companies in the context of financing SMEs is examined. |
| Pattern | Platform No. | |||||||||
|---|---|---|---|---|---|---|---|---|---|---|
| 1 | 2 | 3 | 4 | 5 | 6 | 7 | 8 | |||
| Average user evaluation | y1 | 5 | 4.1 | 4.6 | 4.3 | 4.5 | 4.0 | 4.7 | 4.4 | 4.5 |
| Easy to use | x1 | 5 | 4.2 | 4.6 | 4.5 | 4.2 | 4.1 | 4.5 | 4.4 | 4.7 |
| Flexibility | x2 | 5 | 4.5 | 4.8 | 4.6 | 4.5 | 4.2 | 4.5 | 4.7 | 4.8 |
| Potential | x3 | 5 | 4.3 | 4.4 | 4.6 | 4.7 | 3.8 | 4.7 | 4.6 | 4.6 |
| Service and support | x4 | 5 | 4.6 | 4.8 | 4.8 | 5.0 | 4.1 | 4.3 | 4.6 | 4.7 |
| Costs | x5 | 5 | 4.5 | 4.6 | 4.7 | 4.7 | 2.5 | 3.2 | 4.8 | 4.7 |
| ID | Sum x/y: | Last x/y | Si | 1 | 1 | 2 | 3 | 4 | 5 | 6 | 7 | 8 | 9 | ||
|---|---|---|---|---|---|---|---|---|---|---|---|---|---|---|---|
| y1 | −5.8 | −0.5 | s1 | 5.55 | 5 | y1 | 0 | −0.9 | −0.4 | −0.7 | −1 | −0.9 | −0.3 | −0.6 | −0.5 |
| x1 | −6.0 | −0.3 | s2 | 5.85 | 5 | x1 | 0 | −0.8 | −0.4 | −0.5 | −0.9 | −1.3 | −0.4 | −0.6 | −0.3 |
| x2 | −4.8 | −0.2 | s3 | 4.70 | 5 | x2 | 0 | −0.5 | −0.2 | −0.4 | −0.8 | −1.4 | −0.5 | −0.3 | −0.2 |
| x3 | −5.8 | −0.4 | s4 | 5.60 | 5 | x3 | 0 | −0.7 | −0.6 | −0.4 | −1.2 | −1.5 | −0.3 | −0.4 | −0.4 |
| x4 | −4.3 | −0.3 | s5 | 4.15 | 5 | x4 | 0 | −0.4 | −0.2 | −0.2 | −0.9 | −1.2 | −0.7 | −0.4 | −0.3 |
| x5 | −7.0 | −0.3 | s6 | 6.85 | 5 | x5 | 0 | −0.5 | −0.4 | −0.3 | −2.5 | −0.7 | −1.8 | −0.2 | −0.3 |
| Sj, Si | y1 |
|---|---|
| x1 | 0.30 |
| x2 | 0.85 |
| x3 | 0.05 |
| x4 | 1.40 |
| x5 | 1.30 |
| 0.995902 | x3 |
| 0.976378 | x1 |
| 0.929752 | x2 |
| 0.911565 | x5 |
| 0.884298 | x4 |
| Rank | Platform No. | |
|---|---|---|
| 1 | 0.882939437 | 8 |
| 2 | 0.871227587 | 3 |
| 3 | 0.870957644 | 2 |
| 4 | 0.867612962 | 7 |
| 5 | 0.86685003 | 4 |
| 6 | 0.829474326 | 1 |
| 7 | 0.803017869 | 6 |
| 8 | 0.703882637 | 5 |
Disclaimer/Publisher’s Note: The statements, opinions and data contained in all publications are solely those of the individual author(s) and contributor(s) and not of MDPI and/or the editor(s). MDPI and/or the editor(s) disclaim responsibility for any injury to people or property resulting from any ideas, methods, instructions or products referred to in the content. |
© 2023 by the authors. Licensee MDPI, Basel, Switzerland. This article is an open access article distributed under the terms and conditions of the Creative Commons Attribution (CC BY) license (https://creativecommons.org/licenses/by/4.0/).
Share and Cite
Domański, R.; Wojciechowski, H.; Lewandowicz, J.; Hadaś, Ł. Digitalization of Management Processes in Small and Medium-Sized Enterprises—An Overview of Low-Code and No-Code Platforms. Appl. Sci. 2023, 13, 13078. https://doi.org/10.3390/app132413078
Domański R, Wojciechowski H, Lewandowicz J, Hadaś Ł. Digitalization of Management Processes in Small and Medium-Sized Enterprises—An Overview of Low-Code and No-Code Platforms. Applied Sciences. 2023; 13(24):13078. https://doi.org/10.3390/app132413078
Chicago/Turabian StyleDomański, Roman, Hubert Wojciechowski, Jacek Lewandowicz, and Łukasz Hadaś. 2023. "Digitalization of Management Processes in Small and Medium-Sized Enterprises—An Overview of Low-Code and No-Code Platforms" Applied Sciences 13, no. 24: 13078. https://doi.org/10.3390/app132413078
APA StyleDomański, R., Wojciechowski, H., Lewandowicz, J., & Hadaś, Ł. (2023). Digitalization of Management Processes in Small and Medium-Sized Enterprises—An Overview of Low-Code and No-Code Platforms. Applied Sciences, 13(24), 13078. https://doi.org/10.3390/app132413078