Article

Weed Detection Method Based on Lightweight and Contextual Information Fusion

School of Mechanical Engineering and Automation, Wuhan Textile University, Wuhan 430200, China
*
Author to whom correspondence should be addressed.
Appl. Sci. 2023, 13(24), 13074; https://doi.org/10.3390/app132413074
Submission received: 3 October 2023 / Revised: 25 November 2023 / Accepted: 4 December 2023 / Published: 7 December 2023
(This article belongs to the Topic Applied Computing and Machine Intelligence (ACMI))

Abstract

:
Weed detection technology is of paramount significance in achieving automation and intelligence in weed control. Nevertheless, it grapples with several formidable challenges, including imprecise small target detection, high computational demands, inadequate real-time performance, and susceptibility to environmental background interference. In response to these practical issues, we introduce CCCS-YOLO, a lightweight weed detection algorithm, built upon enhancements to the Yolov5s framework. In this study, the Faster_Block is integrated into the C3 module of the YOLOv5s neck network, creating the C3_Faster module. This modification not only streamlines the network but also significantly amplifies its detection capabilities. Subsequently, the context aggregation module is enhanced in the head by improving the convolution blocks, strengthening the network’s ability to distinguish between background and targets. Furthermore, the lightweight Content-Aware ReAssembly of Feature (CARAFE) module is employed to replace the upsampling module in the neck network, enhancing the performance of small target detection and promoting the fusion of contextual information. Finally, Soft-NMS-EIoU is utilized to replace the NMS and CIoU modules in YOLOv5s, enhancing the accuracy of target detection under dense conditions. Through detection on a publicly available sugar beet weed dataset and sesame weed datasets, the improved algorithm exhibits significant improvement in detection performance compared to YOLOv5s and demonstrates certain advancements over classical networks such as YOLOv7 and YOLOv8.

1. Introduction

Sugar beet, as a crop, plays a crucial role in global food and economic systems. However, during the growth of sugar beet, various types of weeds in the field compete for water, nutrients, and sunlight, significantly impacting crop yield and quality [1]. Research indicates that weed growth can lead to crop yield losses of up to 34% [2]. Weed removal and control have thus become integral components of modern agricultural production.
Existing weed control methods primarily include mechanical weeding, traditional pesticide application, and robotic weeding, among others. Mechanical weeding, though effective, comes with substantial labor costs and the potential for crop damage [3]. Over-reliance on pesticides for weed control can result in environmental pollution and pesticide residues [4]. With the proliferation of artificial intelligence technologies, modernized weed control methods such as laser weeding robots and pesticide spraying robots have emerged. These robots are capable of precise identification and localization of crops and weeds during their operations [5,6]. However, achieving real-time detection and recognition of crops and weeds remains a critical challenge.
Currently, optical technologies encompass optical detection techniques, digital image processing, curvelet transform detection, and computer vision detection techniques, such as hyperspectral imaging technology and terahertz spectroscopy imaging, which have found widespread applications and development in object detection [7,8,9,10]. Optical technologies have been employed extensively, including the use of digital image processing for fruit grading and sorting [11], and curvelet transform detection for identifying plants infected with diseases [12]. However, these methods are associated with high detection costs or limited applicability. Consequently, computer vision technology is primarily considered. Table 1 outlines the advantages and disadvantages of these current detection methods.
In recent years, with the advancement and application of computer vision, agriculture has experienced significant progress in terms of intelligence [13,14,15]. Deep learning, as a subset of computer vision, is known for its ability to rapidly detect, locate, and recognize targets. Consequently, deep learning is now widely applied in agricultural weed control [16].
In the field of target recognition, algorithms are broadly categorized into one-stage and two-stage methods [17]. Faster R-CNN [18], a representative two-stage algorithm, has gained widespread adoption. Mu et al. [19] successfully detected weeds in complex field backgrounds by integrating the ResNeXt network with the FPN for feature extraction. However, Faster R-CNN, being a two-stage algorithm, has the drawback of relatively slow inference speed. Two-stage algorithms require the initial filtering of candidate boxes, followed by determining whether the candidate boxes enclose the target for detection. Subsequently, adjustments to the position of the target are made, leading to a slower process. On the other hand, one-stage algorithms do not involve the candidate box filtering step. Instead, they directly regress the position coordinates of the target box and the classification probability of the target, resulting in a faster operation.
On the other hand, one-stage algorithms, which perform object classification and localization in a single step, are exemplified by YOLO (You Only Look Once). YOLO is known for its high-speed detection and accuracy [20]. Ying et al. [21] proposed YOLOv4-weeds, an improved algorithm based on YOLOv4 [22]. YOLOv4-weeds replaced YOLOv4’s backbone network with MobileNetV3-Small and introduced depthwise separable convolutions and attention mechanisms, making the detection model more efficient. Wang et al. [23] presented YOLO-CBAM, a convolutional neural network model that combines YOLOv5 and attention mechanisms for weed detection. It achieved an average precision improvement of 2.49% and real-time detection on Jetson AGX Xavier. Chen et al. [24] introduced the YOLO-sesame model, which outperformed mainstream models like Fast R-CNN, SSD, and YOLOv4, achieving a final mAP of 96.16% and a frame rate of 36.8%, effectively meeting the requirements of sesame weed detection. Hong et al. [25] incorporated the Channel Attention (CA) mechanism into the backbone feature extraction network and replaced the Path Aggregation Network (PANet) with a Bi-directional Feature Pyramid Network (BiFPN) in the neck network. The enhanced YOLOv5 network demonstrates effective asparagus detection in various weather conditions. Liu et al. [26], through improvements in the backbone network, attention mechanism, and loss functions, significantly reduced the parameter count and enhanced detection accuracy.
To address the aforementioned challenges and develop a method that balances detection accuracy and speed for weed detection in sugar beet fields, we propose CCCS-YOLO, a lightweight weed detection method based on YOLOv5s. The primary contributions of this study are as follows:
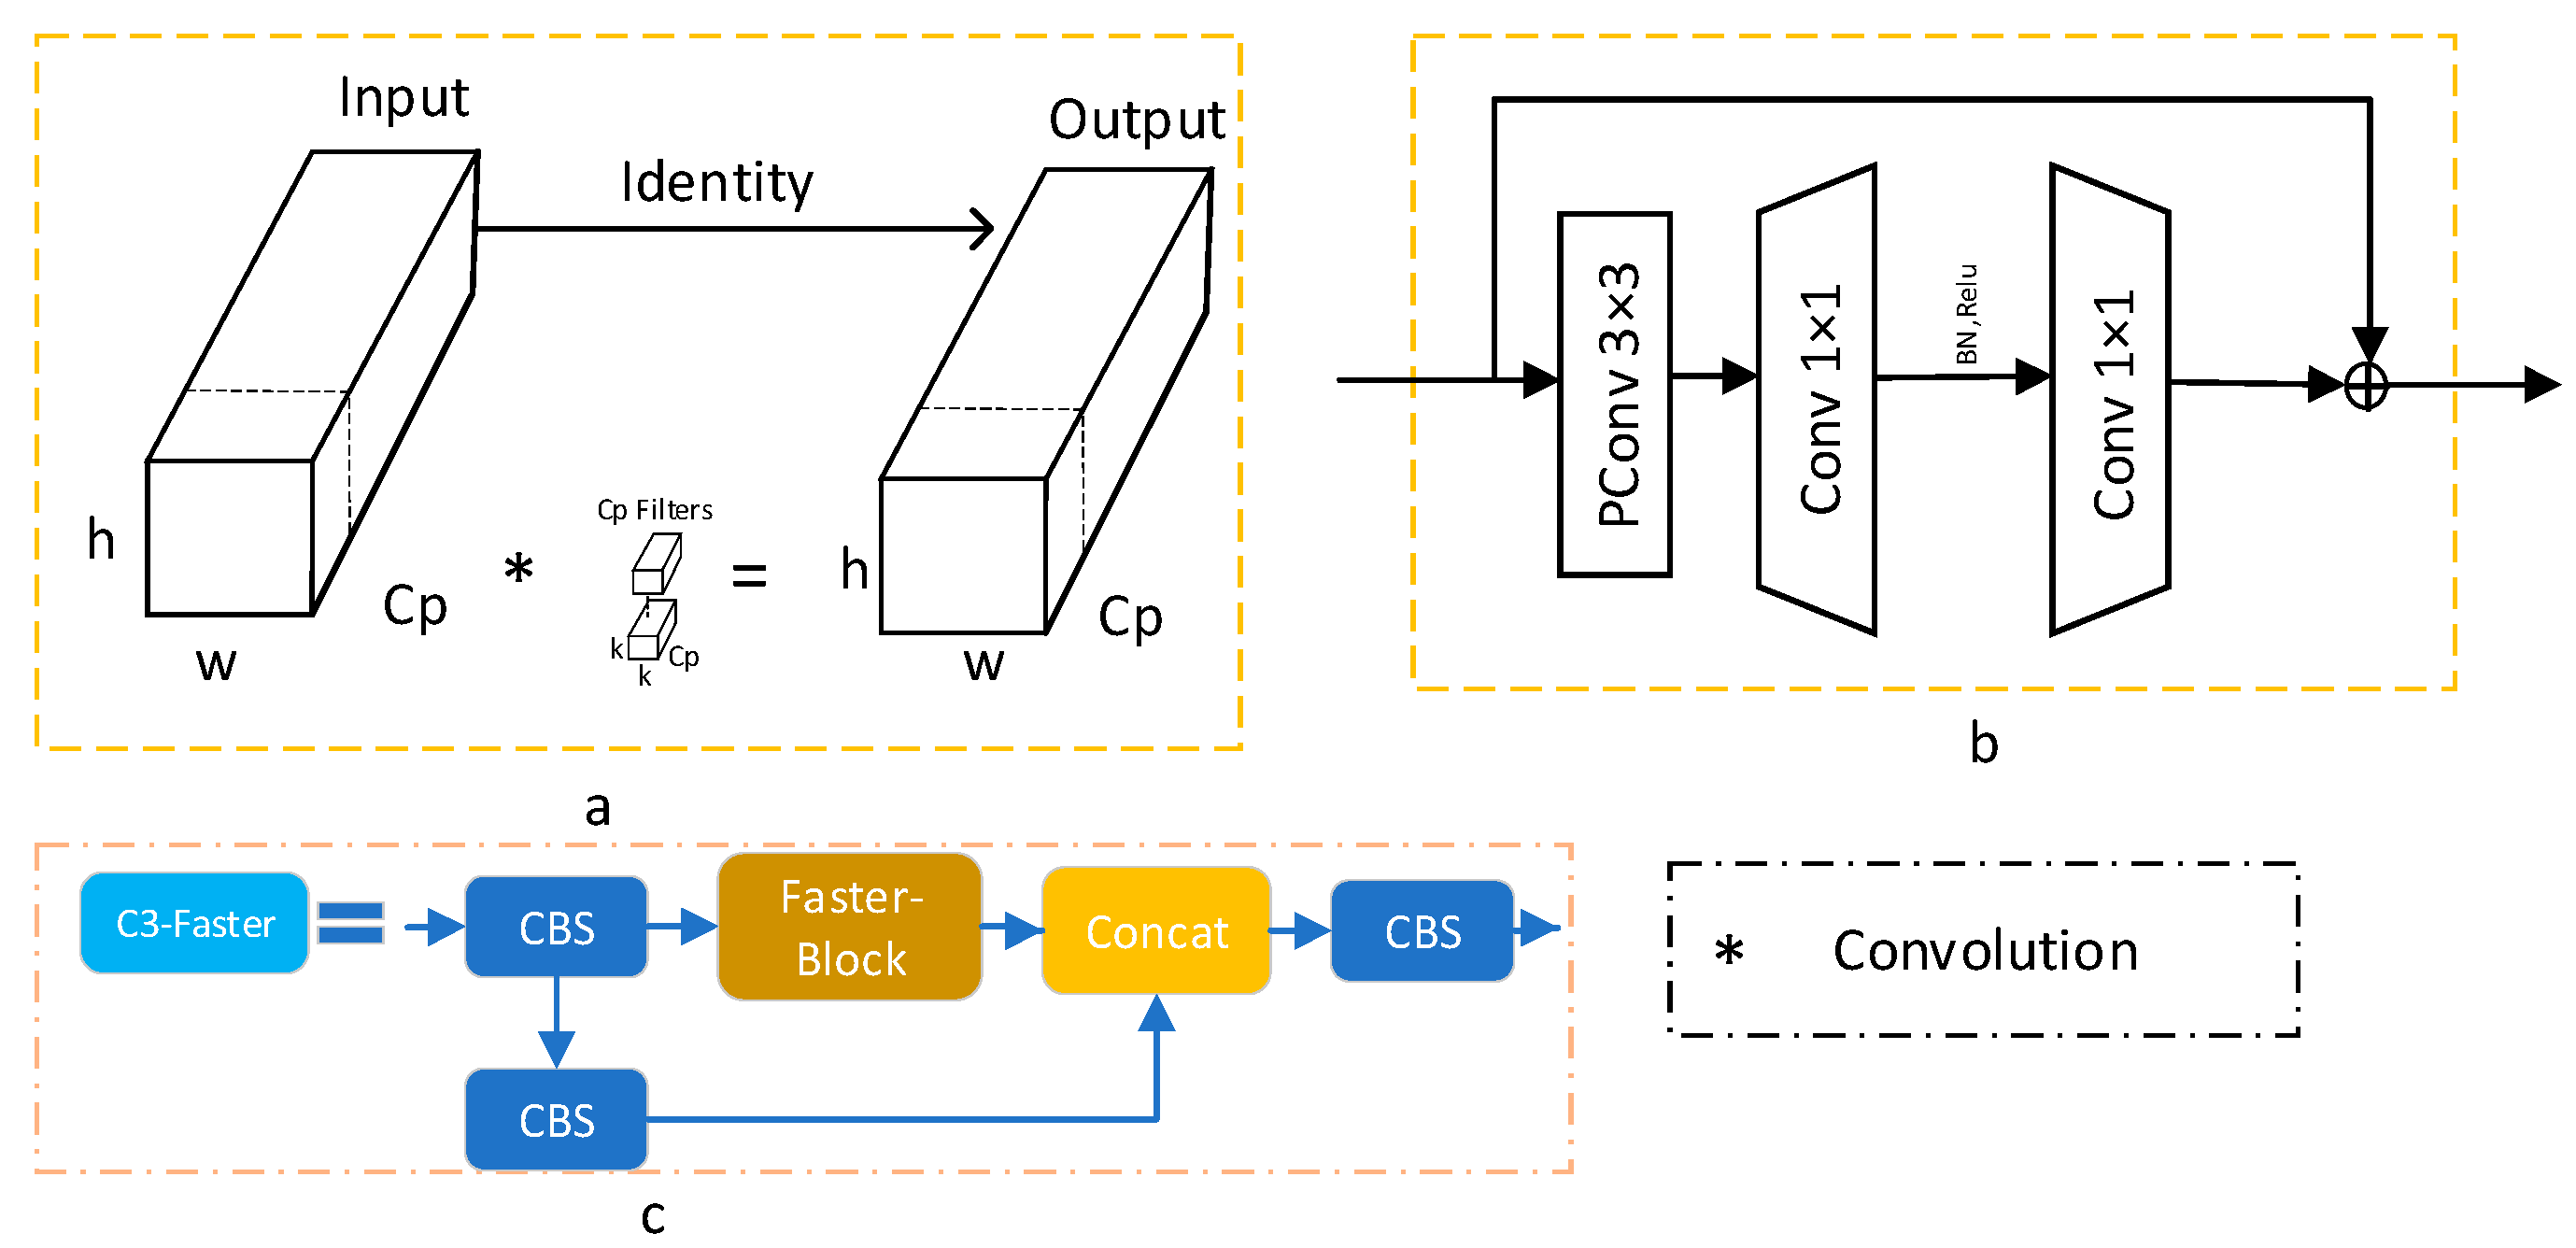
  • Improved the neck network by utilizing the lightweight FasterNet [27] architecture to create the new C3_faster module, which replaced the first three C3 modules in the neck. The objective was to reduce the model’s parameter count, making it more lightweight.
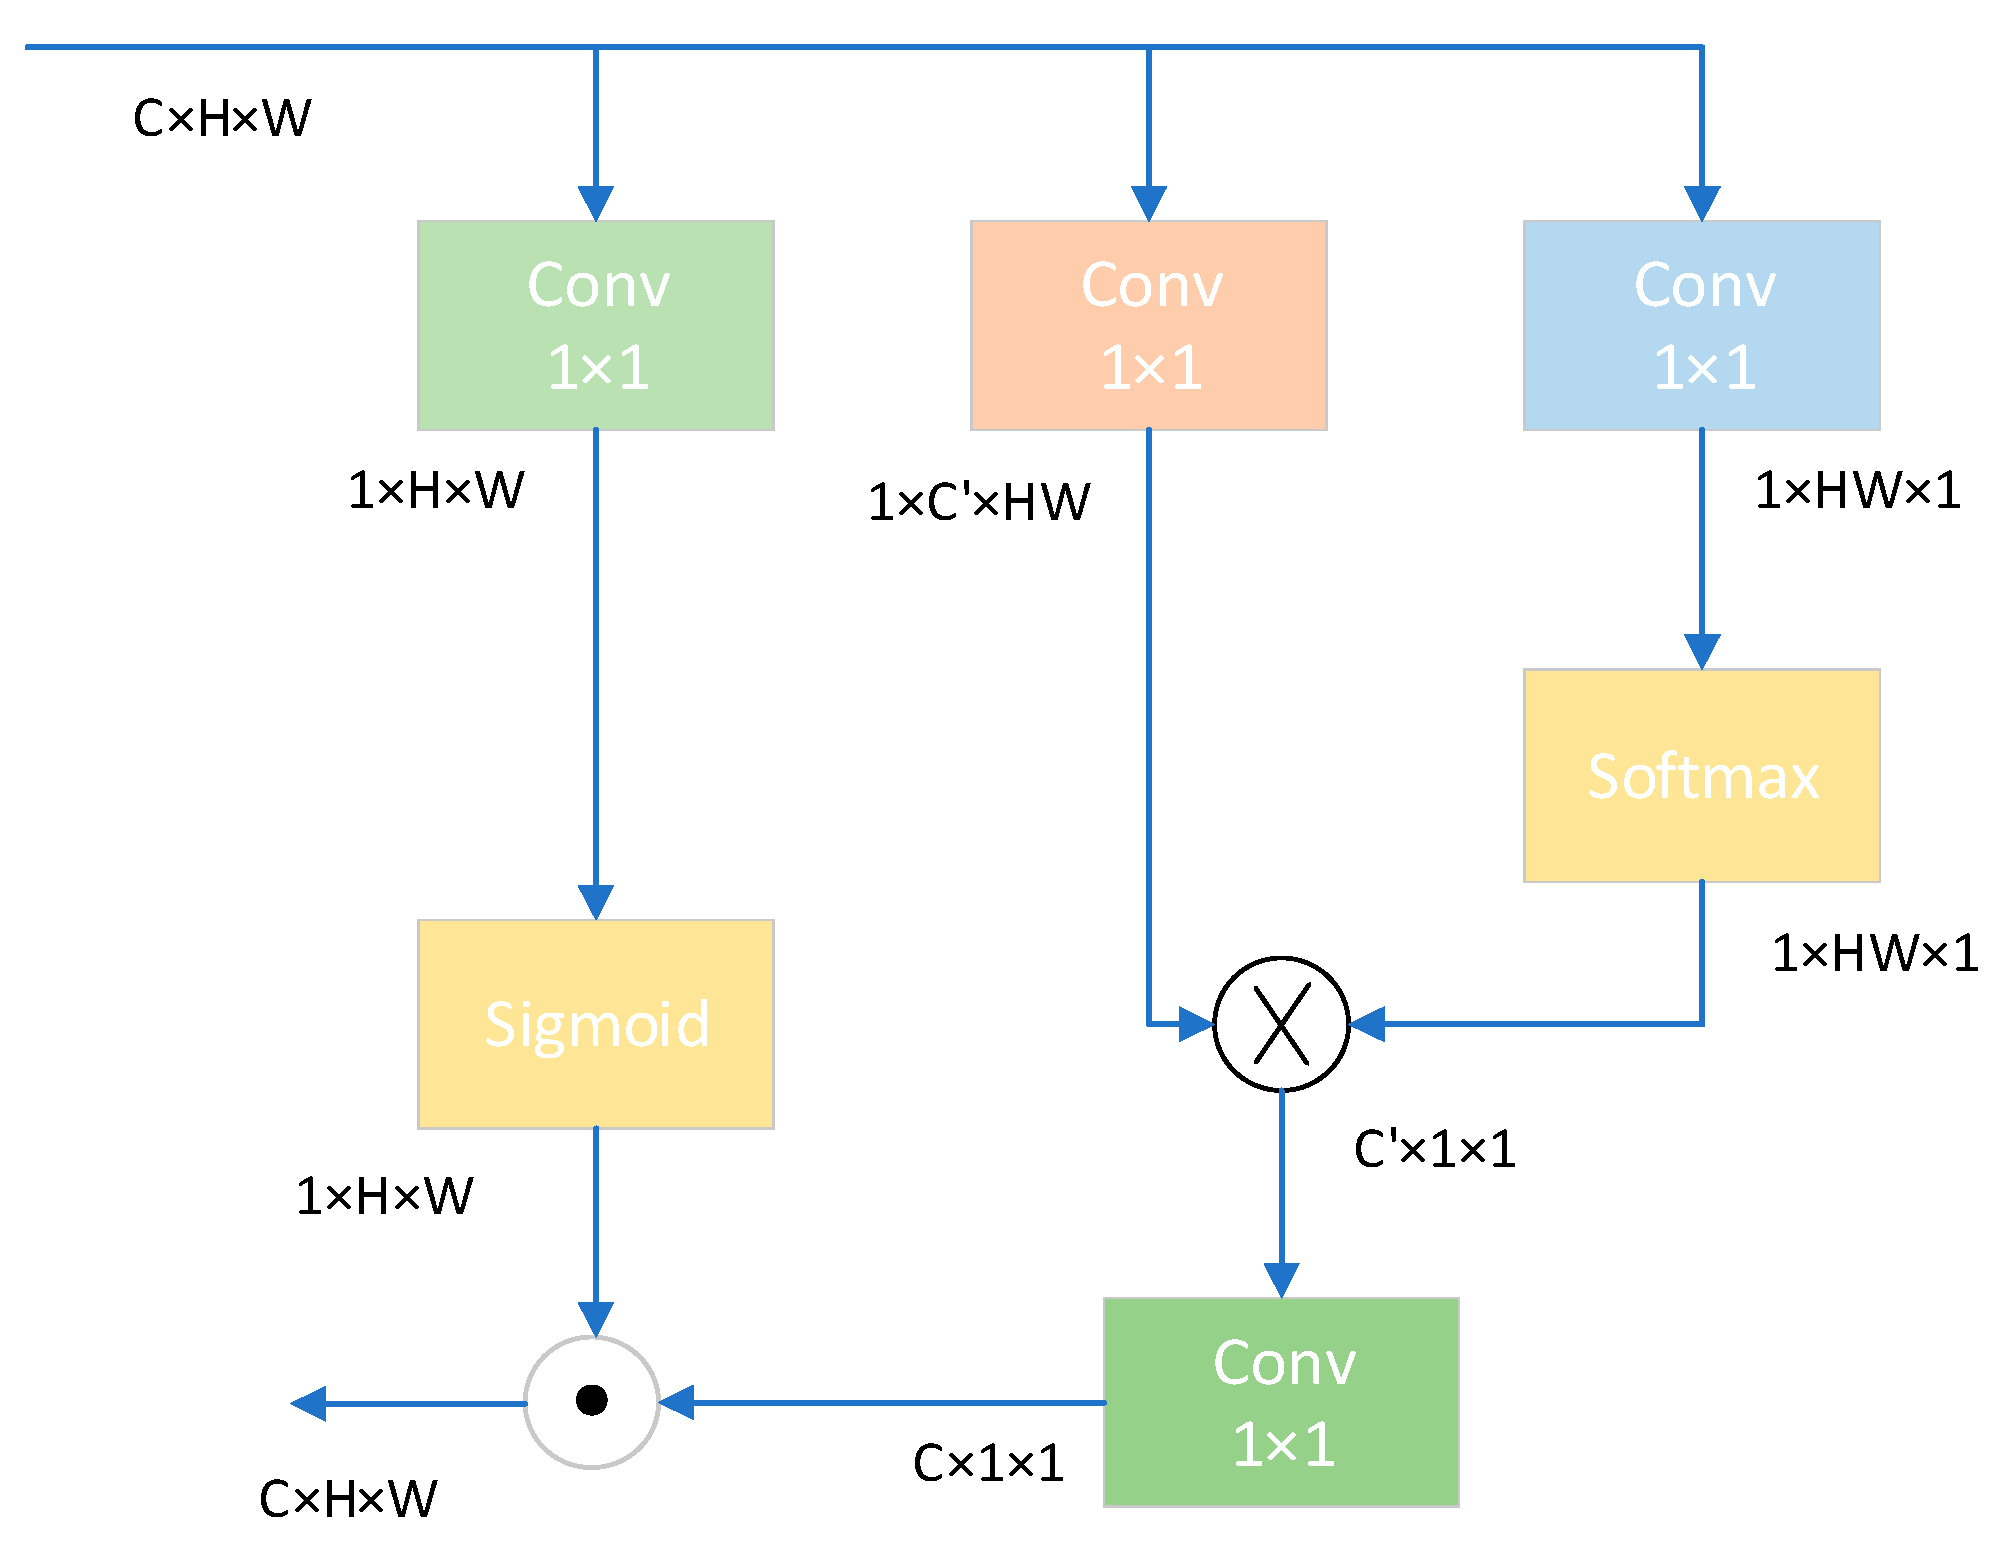
  • Replaced the 1 × 1 convolution in the head with Contest Aggregation [28], adaptively fusing context information of different scales, improving the model’s performance in detecting weeds in complex backgrounds.
  • Replaced the conventional upsampling modules in the neck network with the CARAFE [29] module, enhancing the fusion of contextual information and improving the model’s performance in detecting small targets.
  • Proposed using EIoU [30] to replace the original CIoU in YOLOv5, enhancing regression accuracy. Additionally, we introduce Soft-NMS [31] to optimize overlapping bounding boxes in the regression task, reducing redundant boxes, and retaining potential target boxes, thus enhancing the model’s robustness.
  • Conducted tests to evaluate performance under different IoU thresholds and using combinations of IoU and Soft-NMS. We also perform ablation experiments on different optimization modules. Lastly, we compare our model with classical object detection networks to validate its effectiveness.
  • To validate the robustness of the model, the performance of YOLOv5 was compared with the improved algorithm on the sesame weed dataset.
These efforts aim to address the challenges posed by variations in the size, shape, weed diversity, night-time conditions, and different growth stages of weeds in practical detection tasks related to crops and weeds.
The remaining sections of this paper are organized as follows: Section 2 introduces the innovations of this study, providing a detailed overview of the algorithmic structure of CCCS-YOLO. Section 3 outlines the experimental setup and parameters, followed by an analysis and comparison of the experimental results. Finally, Section 4 presents the conclusions of this paper and outlines avenues for future work.

2. Materials and Methods
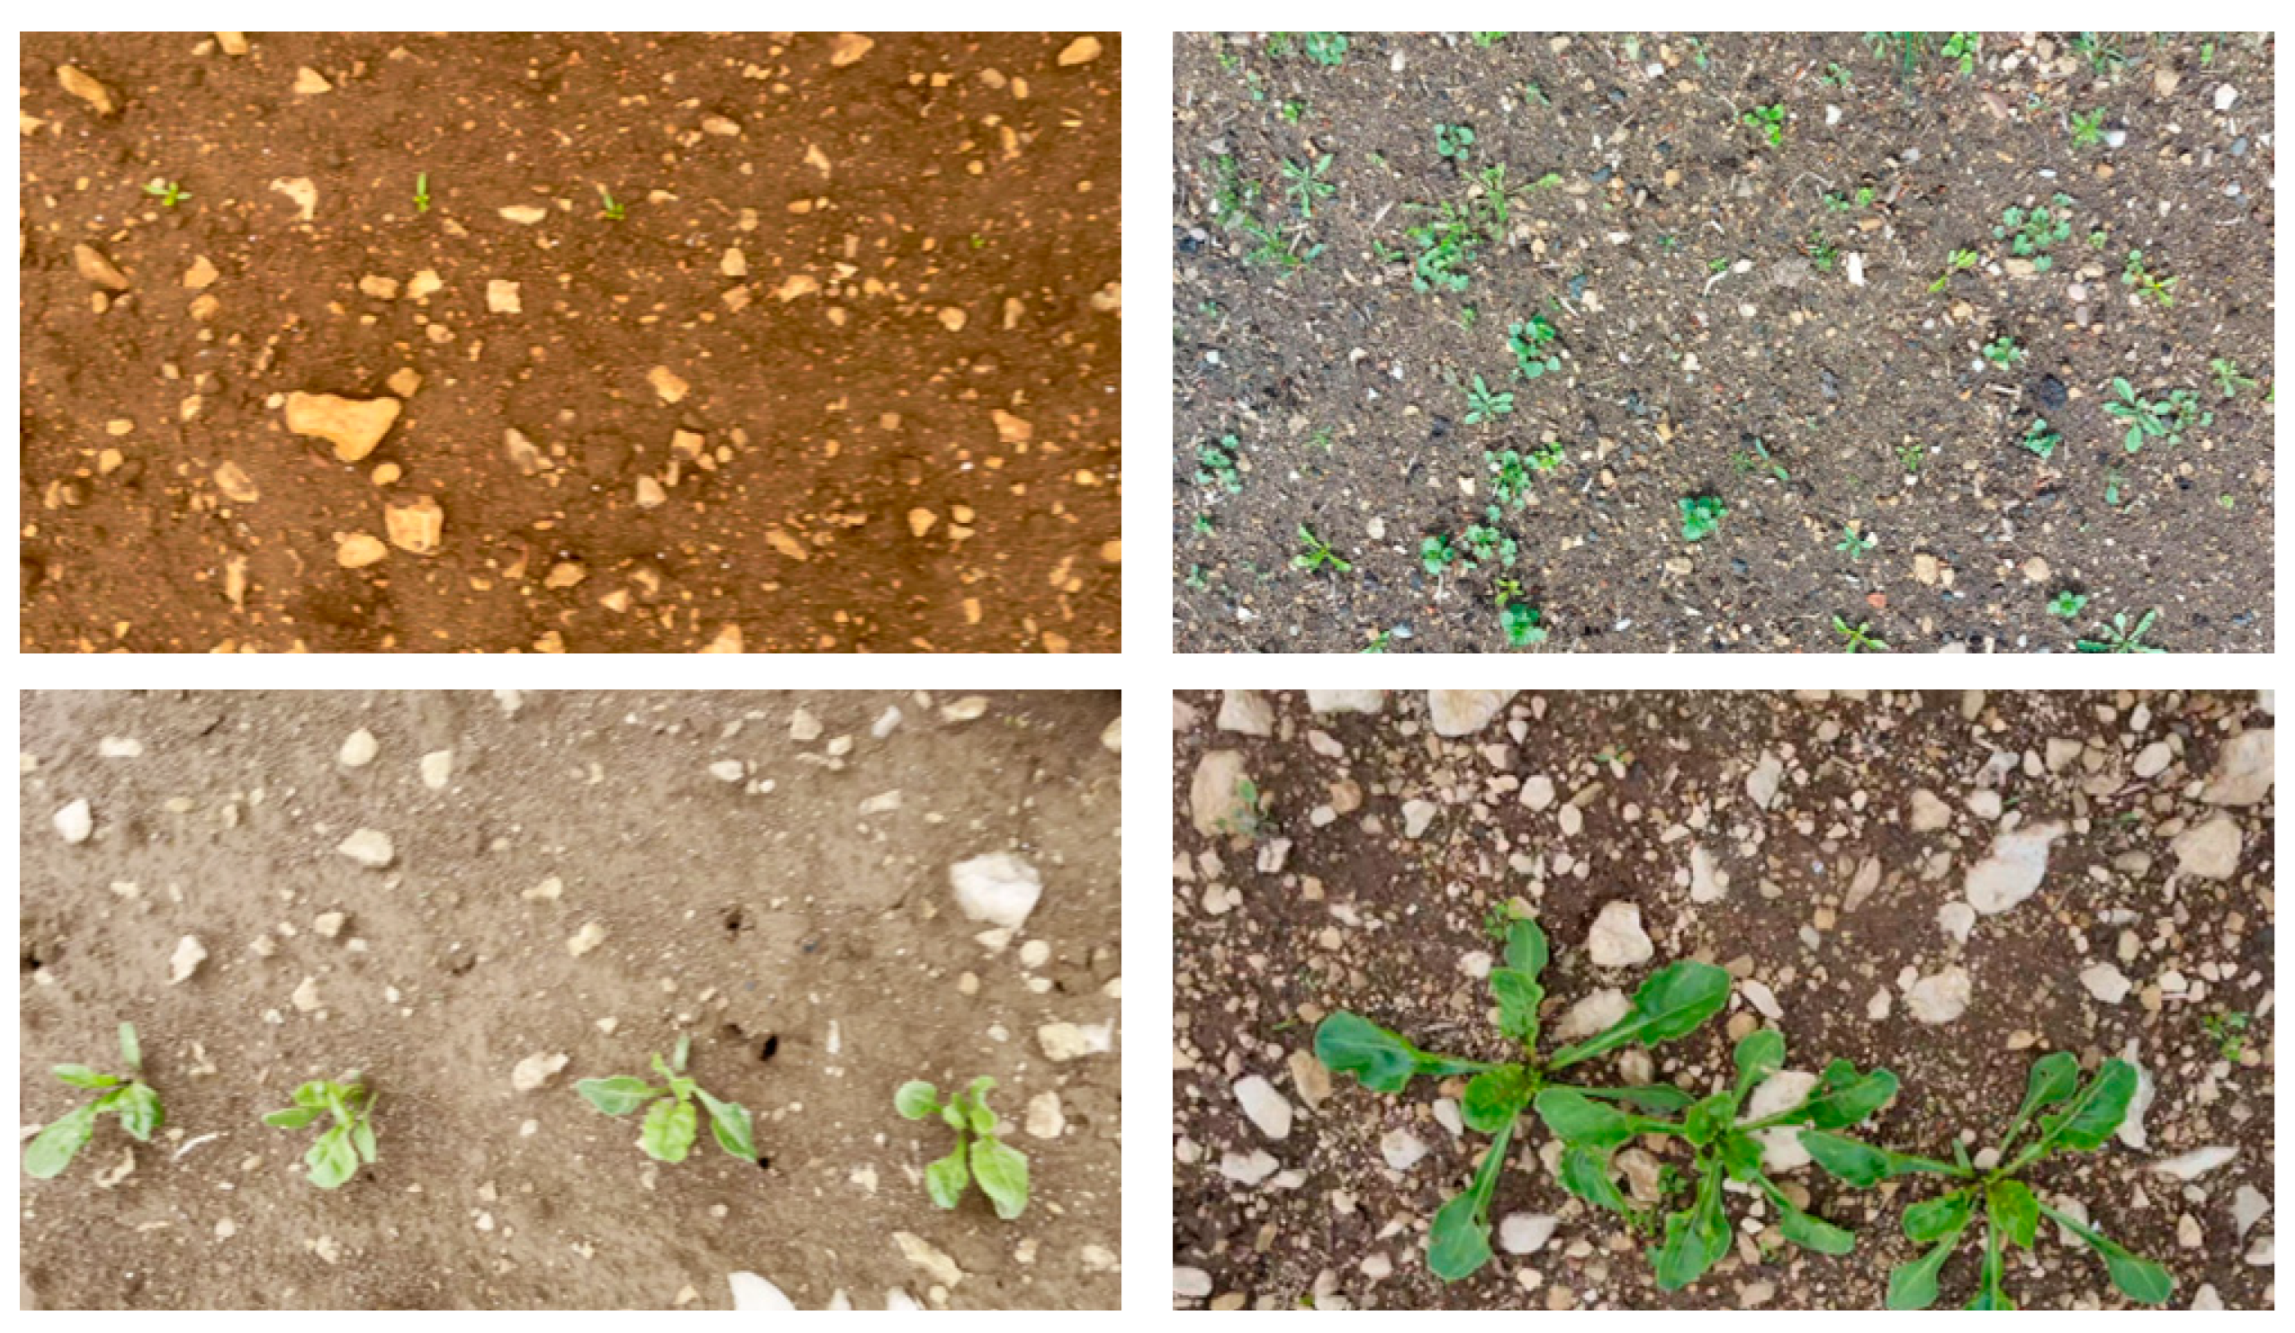
2.1. Dataset

This study utilized the publicly available dataset known as the “lincolnbeet_dataset” [32]. The primary purpose of this dataset is to facilitate research in target recognition under high occlusion environments. The dataset comprises a total of 4402 images, each featuring objects of interest, namely weeds and sugar beets, with image dimensions of 1920 × 1080 pixels. The dataset is alocated into training, validation, and test sets in a ratio of 7:2:1. In total, the dataset contains 39,246 annotated bounding boxes, consisting of 16,399 for sugar beets and 22,847 for weeds. Figure 1 displays a selection of images from the dataset.

2.2. Enhanced YOLOv5 Model

2.2.1. YOLOV5

The YOLO series of algorithms have seen extensive application in target detection tasks within the field of agricultural production. Currently, the most widely used YOLO variant is the YOLOv5 series, known for its fast detection speed and high recognition accuracy. The YOLOv5 series is divided into YOLOv5n, YOLOv5s, YOLOv5m, YOLOv5l, and YOLOv5x. This paper focuses on improvements made to YOLOv5s.
As illustrated in Figure 2, YOLOv5s-7.0 is divided into four main components: Input, Backbone, Neck, and Head. After the dataset is fed into the network, preprocessing steps are applied to the input data, including adaptive image scaling, Mosaic data augmentation, and adaptive anchor boxes. The Backbone is responsible for feature extraction from the images and consists of CBS (Convolutional, Batch Normalization, and Activation) layers, CSP1_X, and SPPF. CBS layers perform feature extraction and information propagation, CSP1_X modules enhance feature extraction, improving the model’s receptive field, and the SPPF module utilizes pooling at different scales to enhance the transmission of contextual information.
The Neck section primarily focuses on feature fusion within the main network. It is composed of the Feature Pyramid Network (PFN) and the Path Aggregation Network (PAN). PAN constructs a pyramid of feature maps at different levels within the main network, enabling the capture of rich feature information at various scales for improved detection of both small and large targets. PAN introduces a top-down path within the network, facilitating effective information transfer and feature fusion.
Finally, the Head section is responsible for object localization and classification in the detection process.

2.2.2. C3-Faster

In the pursuit of designing faster neural networks, much of the current research is centered around reducing the number of floating-point operations (FLOPs). Models such as MobileNets [33], ShuffleNets [34], and GhostNet [35] optimize the FLOPs of the model through structures like Depthwise Convolution and Group Convolution. However, this often leads to increased memory access, resulting in a decrease in computational efficiency. Addressing the issues of redundant computations and memory access, Chen et al. [27] proposed a novel architecture known as Partial Convolution, backed by multiple experiments that demonstrate the efficiency of the PConv convolution module, showcasing its superiority over other convolution modules.
The Faster-Block module incorporates the PConv module, creating a larger convolution module that exhibits high efficiency and lightweight characteristics. Consequently, integrating the Faster-Block module into the C3 module, thereby making the network more lightweight to meet the demands of rapid target recognition. Figure 3a–c represent the structural diagrams of PConv, Faster-Block, and C3-Faster, respectively.

2.2.3. Context Aggregation

In the task of weed detection, to enhance the detection performance of deep object detection models in complex backgrounds, the Context Aggregation module was introduced into the YOLOv5 network structure. Its core idea lies in the adaptive fusion of context information at different scales using a contextual aggregation approach, aiming to improve the model’s robustness and accuracy. The composition of this module is depicted in Figure 4. The broadcast Hadamard product is a type of matrix operation, defined as C i , j = A i , j B i j   , denoted as A B .
In this paper, we utilize the context aggregation module to replace the 1 × 1 convolution in the head of the neural network. This module operates through three key steps:
Attention Weight Calculation: The initial step involves computing attention weights. This is achieved by applying a 1 × 1 convolution layer followed by a sigmoid activation function. This ensures that the attention weights fall within the range of 0 to 1. The objective here is to automatically adjust the weights based on the importance of input features, facilitating effective feature fusion.
Context Information Fusion: After obtaining attention weights and feature values, a matrix multiplication operation is performed between the feature values and attention weights. This operation leads to an adaptive weighted fusion of context information. This approach enables the model to better perceive the relationship between objects and backgrounds based on the importance of features in different regions. Notably, this fusion method excels in feature fusion across different scales, contributing to enhanced object detection performance.
Feature Transformation and Output: The weighted features are subsequently subjected to a 1 × 1 convolution layer to enhance their representational capacity. These features, which have undergone context information fusion, constitute the final output features. Importantly, these features possess improved discrimination capabilities between targets and backgrounds in the weed detection task.
By integrating the context aggregation module into YOLOv5, an adaptive fusion of context information across different scales has been achieved. This enhancement significantly boosts the model’s performance. The introduction of an adaptive context information fusion method equips the model to better handle complex backgrounds and variations in target sizes encountered in weed detection tasks.

2.2.4. Lightweight CARAFE Upsampling Operator

To further enhance the recognition capabilities for small weed targets, CARAFE is employed as a replacement for the nearest-neighbor interpolation upsampling used in the original YOLOv5. The nearest-neighbor interpolation upsampling relies solely on pixel spatial positions to determine the upsampling kernel, without effectively leveraging semantic information within the feature map. This limitation results in a small perceptual field. In contrast, CARAFE excels in aggregating contextual information from the image, thereby increasing the receptive field size. CARAFE dynamically generates adaptive kernels for the feature map and then employs them for feature reassembly, facilitating seamless feature map integration and preserving feature map integrity.
CARAFE comprises two primary modules: the upsampling kernel prediction module and the feature reassembly module. The upsampling kernel prediction module analyzes the input feature map to predict the sizes of corresponding upsampling kernels at different positions. The feature reassembly module utilizes the upsampling kernels obtained from the prediction module to perform the upsampling operation. The module structure of CARAFE is illustrated in Figure 5.
In the upsampling kernel prediction module, to reduce computational complexity, an initial 1 × 1 convolutional layer is applied to compress the input feature map of shape H × W × C into a compact form with dimensions H × W × C m . Subsequently, an inner encoding sub-module employs convolutional layers with kernel sizes of   k e n c o d e r × k e n c o d e r to perform the prediction task, yielding upsampling kernels of size σ H × σ W × k u p 2 . Here, σ represents the upsampling factor, and k u p 2 denotes the size of an individual upsampling kernel for a single feature point. The upsampling kernels are then subject to softmax normalization to ensure that the sum of kernel weights equals 1. This process adaptively generates corresponding upsampling kernels for each distinct feature point.
In the feature reassembly module, each feature point in the output feature map is mapped to the input feature map, considering a region of size k u p × k u p centered on that feature point. The dot product between this region and the associated upsampling kernel results in an output feature map of dimensions σ H × σ W × C . Thus, compared to the original nearest-neighbor interpolation upsampling, CARAFE upsampling preserves the integrity of image features, enlarges the feature’s receptive field, and enhances the feature pyramid’s feature extraction and fusion capabilities.

2.2.5. Soft-NMS-EIoU

Traditional Non-Maximum Suppression (NMS) [36] is an algorithm used to obtain local maxima and suppress non-maximum values. It begins by sorting all candidate bounding boxes based on their category scores and selects the one with the highest score. It then iterates through the remaining candidate boxes. When the Intersection over Union (IoU) value between the remaining candidate box and the one with the highest score exceeds the predetermined IoU threshold, the remaining box is removed. This process is repeated until all boxes have been processed, resulting in the retained candidate boxes as the final detection results. However, when there are numerous densely packed objects in an image, NMS can lead to overlapping between the preselected boxes, resulting in the direct discard of many boxes and a decrease in detection accuracy. Since our dataset contains many densely packed weed targets, this algorithm is not suitable.
To address this issue, the NMS algorithm is replaced with the Soft-NMS algorithm. In Soft-NMS, when the IoU between a detection box and the highest-scoring detection box exceeds the set threshold, it does not immediately set the score of the detection box to zero. Instead, it replaces the original score with a slightly lower score. The following are the processing steps for NMS and Soft-NMS: (1) represents NMS and (2) represents Soft-NMS. Here, s i denotes the current score of the detection box being processed, N t is the set IoU threshold, and M is the highest-scoring detection box.
s i s i ,   I o U M , b i < N t   0 ,     I o U M , b i N t  
s i s i ,     I o U M , b i < N t   s i 1 I o U M , b i ,     I o U M , b i N t  
Soft-NMS involves further calculations related to IoU, and the choice of IoU directly affects the suppressive effect of Soft-NMS. The original Soft-NMS used IoU for non-maximum suppression. However, IoU has a limitation: when two detection boxes do not overlap, the IoU value is 0, indicating no re flection of the distance between the two objects. In such cases, the gradient is 0, making further optimization and training impossible.
CIoU is a loss function used in YOLOv5, which takes into account the overlap area of bounding box regression, center point distance, and aspect ratio. The penalty term for CIoU is defined as follows:
R C I o U = ρ 2 ( b , b g t ) c 2 + α v
Here, α is a weight function, and v is used to measure the similarity of aspect ratios, defined as follows:
v = 4 π 2 ( a r c t a n w g t h g t a r c t a n w h ) 2
The CIoU loss is defined as follows:
L C I O U = 1 I O U + ρ 2 b , b g t c 2 + α v
In the above equations, C w , C h , ρ represent the width and height of the minimum enclosing box covering both boxes, and the Euclidean distance between b and b g t , w , h , w g t , h g t are the width and height of the predicted and ground truth boxes. DIoU and CIoU overcome the issue of calculating loss when prediction and ground truth boxes do not intersect or contain each other. They accelerate convergence by computing the center point distance. The α v factor in the CIoU calculation incorporates aspect ratio considerations, improving regression accuracy.
However, CIoU has some limitations. It has ambiguity regarding aspect ratios and cannot reflect the differences in width and height confidence effectively, which can hinder effective similarity optimization. To address these shortcomings, this paper proposes a method called Soft-NMS-EIoU, which combines EIoU with Soft-NMS to achieve faster and better convergence and improve training accuracy.
The EIoU loss calculation is shown in Equation (6):
L E I o U = L I O U + L d i s + L a s p = 1 I O U + ρ 2 b , b g t c 2 + ρ 2 w , w g t c w 2 + ρ 2 h , h g t c h 2
EIoU loss consists of three components: overlap loss, center distance loss, and width–height loss. In the above equation, L I O U represents the overlap loss between predicted and ground truth boxes, L d i s is the center distance loss, and L a s p represents the width and height loss. The first two parts continue the calculation method from CIoU, but EIoU introduces the width–height loss to address the problem of simultaneous width and height adjustment. This improvement enhances the precision, stability, and convergence speed of object detection models.

2.2.6. The Structure of CCCS-YOLO

The paper introduces an improved algorithm called CCCS-YOLO, based on YOLOv5, which enhances the detection of sugar beets and weeds in sugar beet fields. The improvements are made in several aspects, including the C3 module in the neck, the upsampling module, the 1 × 1 convolution and IoU in the head, and NMS. These improvements lead to more precise detection. The schematic diagram of the improved CCCS-YOLO is illustrated in Figure 6.
First, in the neck network’s C3 module, the Faster-Block module is added. This module utilizes depthwise separable convolution to make the entire network more lightweight. It reduces the parameter count and computational complexity while facilitating feature fusion in the backbone network. Additionally, the CARAFE operator is introduced in the neck to replace the original nearest-neighbor interpolation for upsampling. This enhances the network’s receptive field and feature fusion capabilities while achieving a more lightweight design compared to standard upsampling.
Second, in the head section, the Context Aggregation module is used to replace the ordinary 1 × 1 convolution block. This module employs context information fusion for multiscale feature fusion. It allows the network to acquire more useful and efficient features, better differentiate between backgrounds and targets, and strengthen the detection performance.
Lastly, in the improved CCCS-YOLO, the original YOLOv5’s IoU and NMS are replaced with more efficient and accurate EIoU and Soft-NMS. This combination, known as Soft-NMS-EIoU, enhances the loss function between predicted boxes and target boxes and the non-maximum suppression calculation, resulting in further improvements in detection performance.
Below is a diagram illustrating the structure of the improved CCCS-YOLO:
Figure 6. CCCS-YOLO Structure Diagram.
Applsci 13 13074 g006

3. Experimental Validation and Results Analysis

This experiment was performed on the basis of Python 3.7.3 and CUDA 11.0 environments. During the experiment, the parameters of the hardware devices were Inter Core i7-11700 and NVidia GeForce RTX 3060 12 G. The algorithm parameter settings are as follows: the learning rate is 0.02; the momentum parameter in the gradient descent with momentum is 0.937. The input image size was set to 1920 × 1080. A total of 100 epochs and a batch size of 16 were used during training.

3.1. Model Evaluation Metrics

To better assess the model’s performance, evaluation metrics such as accuracy (P), recall (R), F1 score, and mean average precision ([email protected] and [email protected]:0.95) were used. Below is the calculation formula for IoU:
I o U = A B A B
Here, A represents the predicted bounding box, and B represents the ground truth bounding box. P represents the proportion of correctly identified defects among all defects predicted by the model. R represents the proportion of correctly identified defects among all true labeled defects. F1, on the other hand, combines the precision and recall metrics to comprehensively evaluate the model’s performance. X T P denotes the number of correctly recognized targets by the algorithm, while X F P represents the number of instances where the algorithm predicted a positive sample, but it was actually a negative sample. The calculation formula is as follows:
P = X T P X T P + X F P × 100 %  
R = X T P X T P + X F N × 100 %  
F 1 = 2 × P × R P + R × 100 %  

3.2. Comparative Experiments with Different IoU and Soft-NMS-X

To evaluate the impact of different loss functions on the model’s detection performance, experiments comparing classic loss functions were conducted. Furthermore, to assess the effectiveness of combining Soft-IoU with traditional loss functions, experiments with various combinations were performed. The experimental results are shown in the following figure. In Table 2, the following abbreviations are used: G, D, E, S, W, M represent GIoU [37], DIoU [38], EIoU, SIoU [39], WIoU [40], and MPDIoU [41] loss functions, respectively. The YOLOv5 model with the introduced Soft-NMS structure is denoted as YOLOv5-SN.
From Table 2, it is evident that the inclusion of different loss functions in YOLOv5 has a notable impact on the network’s detection results. Compared to YOLOv5s, the addition of EIoU results in a 1.6% improvement in [email protected], a 0.7% improvement in [email protected]:0.95, and a 1.5% increase in recall. Among various IoUs, the incorporation of EIoU yields the most significant improvements.
When Soft-NMS-EIoU is introduced into the YOLOv5s network and compared with other combinations of IoUs and Soft-NMS, it achieves the best results in [email protected]:0.95 and recall performance metrics while maintaining similar performance in other metrics. Compared to the original YOLOv5s network, with the same parameters and computational load, it enhances [email protected] by 1.3%, [email protected]:0.95 by 4.4%, and recall by 1.5%, with only a minor sacrifice of 0.1% in precision. Compared to EIoU, Soft-NMS-EIoU added to YOLOv5 shows a 3.5% improvement in [email protected]:0.95, with similar performance in other metrics.
Overall, the addition of Soft-NMS-EIoU to YOLOv5s significantly enhances the network’s detection performance.

3.3. Comparative Experiments

To demonstrate the accuracy of the improved model, comparative experiments were conducted using the same dataset, under identical conditions, and on the same device. In this experiment, metrics such as Precision (P), Recall (R), F1 score, [email protected], [email protected]:0.95, GFLOPs, and others were utilized to evaluate the model’s performance. Additionally, to validate the performance improvement of the modified model, comparative experiments were conducted with classic object detection networks such as YOLOv4-tiny, YOLOv7-tiny [42], YOLOv8s, YOLOx [43], TIA-YOLO [44], SSD [45], and Faster-RCNN, all within the same environment. The results of these experiments serve as indicators of the effectiveness of the CCCS-YOLO algorithm proposed in this paper. Table 3 presents the comparative experiments between CCCS-YOLO and other object detection algorithms.
From Figure 7, the changes in the PR curve for YOLOv5 can be observed before and after improvement. In Figure 8, the training results indicate that the loss function did not consistently decrease to a point of minimal change during training. This suggests that the network did not experience overfitting. Additionally, the use of early stopping before training can prevent overfitting, ensuring the effectiveness of the training process.
The comparative experiments across various algorithms in the table above reveal that CCCS-YOLO achieves the highest [email protected], [email protected]:0.95, and F1 scores when compared to other mainstream algorithms. In the comparison using the [email protected]:0.95 parameter, our algorithm outperforms YOLOv4-tiny by 27.91%, Faster-RCNN by 22.5%, SSD by 27.4%, YOLOx by 4.9%, YOLOv5s by 5.1%, YOLOv7-tiny by 7.3%, and YOLOv8s by 4.6%. It attains a higher level of detection accuracy compared to other models.
While CCCS-YOLO has slightly higher parameters and GFLOPs compared to YOLOv5s, it consistently outperforms the YOLOv5s model in various performance metrics. In conclusion, CCCS-YOLO, proposed in this paper, demonstrates superior detection performance while maintaining a relatively low parameter count and computational load, substantiating the excellence of our algorithm.

3.4. Ablation Experiments

To validate the effectiveness of the four different improvement methods on model detection performance, experiments were conducted by individually adding C3-Faster, context aggregation, CARAFE, and Soft-NMS-EIoU to YOLOv5s. For clarity, in this paper, the use of the abbreviations, C3F, CA, CAR, and SNE, represent C3-Faster, context aggregation, CARAFE, and Soft-NMS-EIoU, respectively. The experimental results are presented in Table 4.
As indicated by Table 4, it is evident that when the C3F module in the neck network was solely improved, the network’s parameters and computational load decreased correspondingly, achieving a lightweight design. Furthermore, [email protected] increased by 1.4%, accuracy improved by 1%, and recall increased by 1.3%. When the 1 × 1 convolution was replaced with context aggregation only in the head, enabling multiscale contextual information fusion, [email protected] improved from 76.3% to 77.9%, showing a 1.6% increase. Accuracy increased from 76.9% to 77.8%, a gain of 0.9%.
Using CARAFE to replace the original upsampling in YOLOv5s significantly enhanced the performance of detecting small targets like weeds and sugar beets, increasing the network’s receptive field. [email protected] improved to 77.5%, a gain of 1.2%, and recall increased to 72.7%, a 1.2% improvement.
When only Soft-NMS-EIoU was improved, [email protected] increased by 1.3%, [email protected]:0.95 improved by 4.4%, effectively enhancing small target detection performance, and recall increased by 1.5%.
Upon integrating all four improvement modules into YOLOv5s, with minimal changes in parameters and GFLOPs, [email protected] increased by 3.2%, [email protected]:0.95 increased by 5.1%, accuracy improved by 4.4%, and recall increased by 3.3%. The test results demonstrate that the performance of the improved model has been effectively enhanced in all aspects.

3.5. Results Visualization

To validate the effectiveness of the CCCS-YOLO model in detecting sugar beets and weeds in sugar beet fields, this paper conducted performance tests in five different backgrounds, labeled as a, b, c, d, and e.
In a soil environment, YOLOv5s exhibited cases of false positives, but our algorithm accurately identified them. In backgrounds b, c, d, and e, the original YOLOv5s models all had instances of missed detections, whereas our model successfully detected them, demonstrating a significant improvement over the original YOLOv5s. The test results are shown in Figure 9.

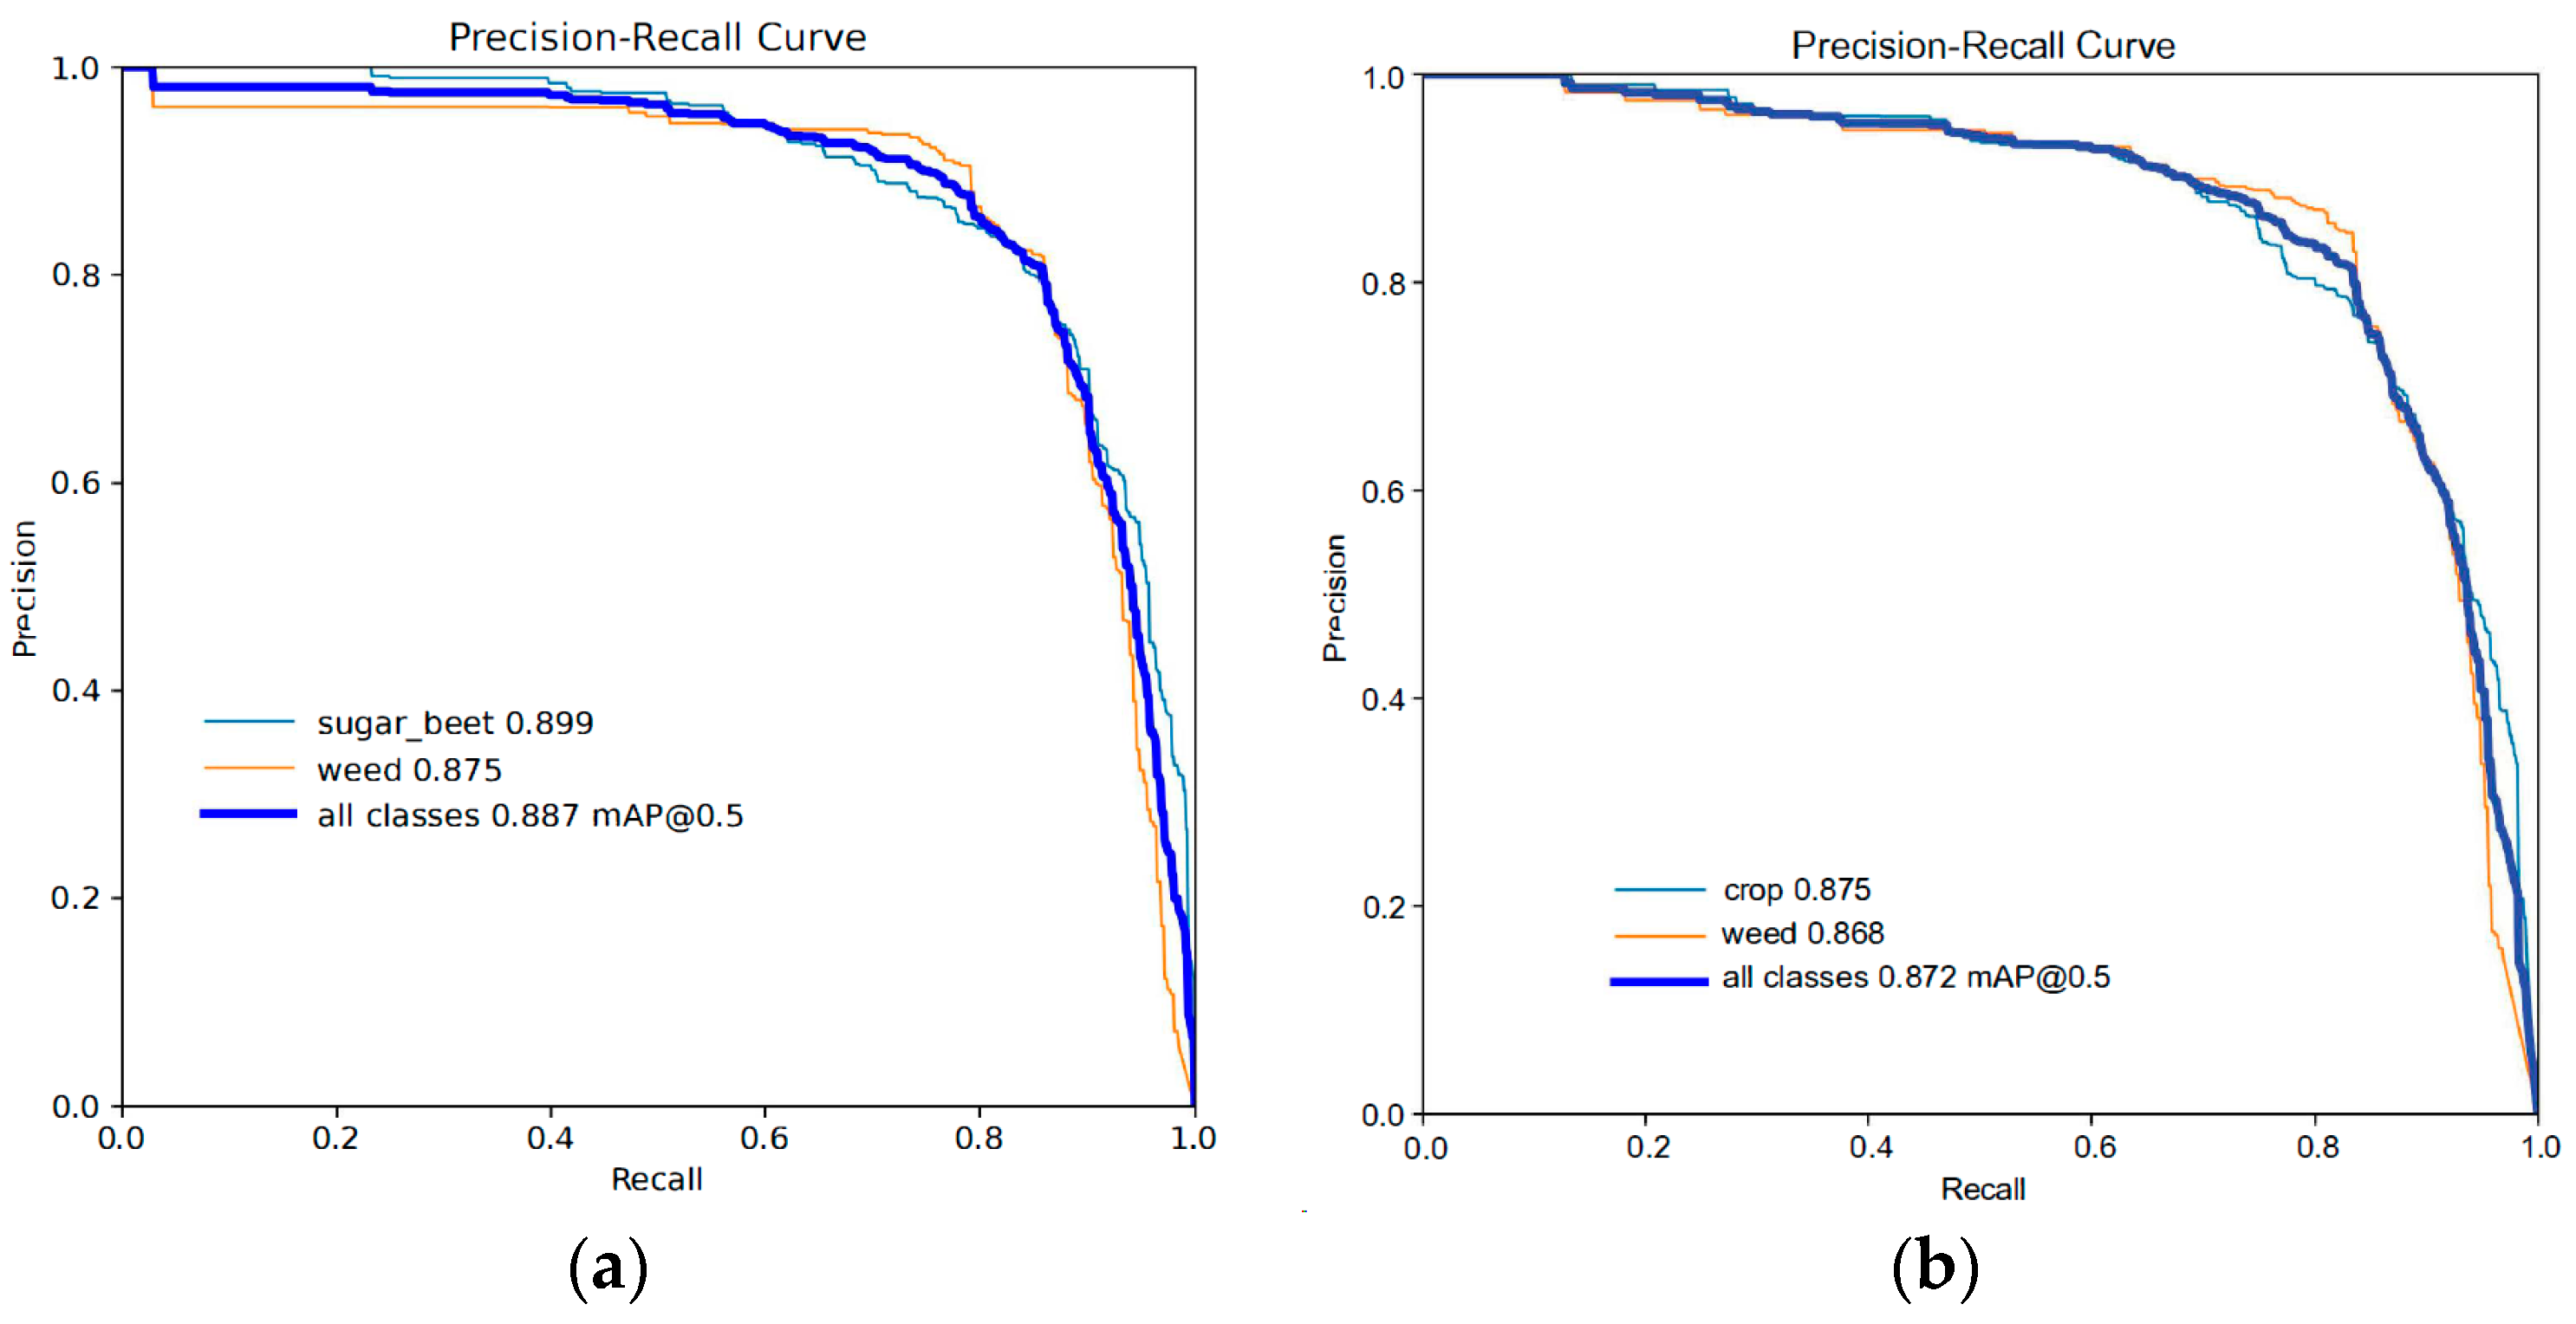
3.6. Robustness Evaluation of the Improved Algorithm

To validate the detection performance of our proposed method on another weed dataset, this paper selected an additional dataset to assess the robustness of the approach.

3.6.1. Sesame Weed Dataset

This paper utilized a dataset uploaded to Kaggle (https://www.kaggle.com/ravirajsinh45/crop-and-weed-detection-data-with-bounding-boxes (accessed on 20 June 2023)) for sesame weed detection. This dataset comprises 1300 images featuring sesame crops and various types of weeds, each labeled with bounding box annotations. The images have a size of 512 × 512 pixels, and the image labels follow the YOLO format.
Given the relatively limited number of images, various data augmentation techniques, such as rotation, translation, brightness variations, etc., were employed. After augmentation, the total dataset consists of 2546 images, with 1872 images for training, 468 for validation, and 206 for testing.

3.6.2. Comparative Analysis before and after Improvement

To verify the robustness of our algorithm, comparative experiments were conducted between YOLOv5s and CCCS-YOLO on different weed datasets, using the same equipment and environment with identical parameter settings. Comparative results are presented in Table 5, while Figure 10 illustrates the Precision-Recall (PR) curve for the experimental process.
In Table 5 and Figure 10, it is evident that on the sesame weed dataset, our improved algorithm exhibits significant improvement compared to YOLOv5s. There is a notable increase of 1.5% in [email protected] and a 2.5% enhancement in accuracy. This demonstrates that our algorithm performs well on other weed datasets, confirming the robustness of the improved algorithm.

4. Conclusions

In response to the challenges of sugar beet and weed detection in complex backgrounds, this study proposes an enhanced algorithm, CCCS-YOLO, based on YOLOv5. Firstly, the algorithm introduces the C3-Faster structure to achieve a lightweight network with higher accuracy. Secondly, contest aggregation and CARAFE modules are incorporated to enhance the fusion capability of contextual information in feature maps, thereby improving the algorithm’s performance in small target detection. Finally, the addition of the Soft-NMS-EIoU structure enhances detection accuracy. To demonstrate the performance of our model, tests were conducted on two datasets, both yielding favorable results.
On the sugar beet and weed dataset, CCCS-YOLO outperforms YOLOv5s, showing a 5.1% increase in [email protected]:0.95, a 3.8% increase in F1 score, and a 4.4% improvement in accuracy. The improved algorithm also surpasses other networks such as Faster-RCNN, YOLOv7, and YOLOv8. Tests on the sesame weed dataset confirm the robust performance of the improved algorithm, exhibiting improvements across various metrics compared to YOLOv5.
The proposed algorithm is part of an application for laser weeding on wheeled vehicles, playing a crucial role in identifying and locating weeds. This contribution facilitates the advancement of intelligent and mechanized weed control. In future research, exploring lightweight network architectures will continue to further enhance algorithm performance, making it more suitable for deployment on edge devices.

Author Contributions

Methodology, H.L.; algorithm, C.Z., J.L. and H.C.; software, C.Z. and H.C.; validation, Z.X. and Z.O.; writing—original draft preparation, C.Z. and J.L.; writing—review and editing, C.Z. and H.C. All authors have read and agreed to the published version of the manuscript.

Funding

This work was supported by the National Natural Science Foundation of China (51875414) and the 2020 Wuhan City Science and Technology Program Project (2020010601012292).

Institutional Review Board Statement

Not applicable.

Informed Consent Statement

Not applicable.

Data Availability Statement

The data presented in this study are openly available in [lincolnbeet_dataset], reference number [32].

Conflicts of Interest

The authors declare no conflict of interest.

References

  1. Llewellyn, R.; Ronning, D.; Clarke, M.; Mayfield, A.; Walker, S.; Ouzman, J. Impact of Weeds in Australian Grain Production; Grains Research and Development Corporation: Canberra, ACT, Australia, 2016. [Google Scholar]
  2. Gao, J.; Liao, W.; Nuyttens, D.; Lootens, P.; Vangeyte, J.; Pižurica, A.; He, Y.; Pieters, J.G. Fusion of pixel and object-based features for weed mapping using unmanned aerial vehicle imagery. Int. J. Appl. Earth Obs. Geoinf. 2018, 67, 43–53. [Google Scholar] [CrossRef]
  3. Utstumo, T.; Urdal, F.; Brevik, A.; Dørum, J.; Netland, J.; Overskeid, Ø.; Berge, T.W.; Gravdahl, J.T. Robotic in-row weed control in vegetables. Comput. Electron. Agric. 2018, 154, 36–45. [Google Scholar] [CrossRef]
  4. Søgaard, H.T.; Lund, I. Application accuracy of a machine vision-controlled robotic micro-dosing system. Biosyst. Eng. 2007, 96, 315–322. [Google Scholar] [CrossRef]
  5. Zhu, H.; Zhang, Y.; Mu, D.; Bai, L.; Zhuang, H.; Li, H. YOLOX-based blue laser weeding robot in corn field. Front. Plant Sci. 2022, 13, 1017803. [Google Scholar] [CrossRef] [PubMed]
  6. Gu, B.; Liu, Q.; Tian, G.; Wang, H.; Li, H.; Xie, S. Recognizing and locating the trunk of a fruit tree using improved YOLOv3. Trans. Chin. Soc. Agric. Eng. 2022, 38, 122–129. [Google Scholar]
  7. González-Cabrera, M.; Wieland, K.; Eitenberger, E.; Bleier, A.; Brunnbauer, L.; Limbeck, A.; Hutter, H.; Haisch, C.; Lendl, B.; Domínguez-Vidal, A.; et al. Multisensor hyperspectral imaging approach for the microchemical analysis of ultramarine blue pigments. Sci. Rep. 2022, 12, 707. [Google Scholar] [CrossRef] [PubMed]
  8. Ge, H.; Lv, M.; Lu, X.; Jiang, Y.; Wu, G.; Li, G.; Li, L.; Li, Z.; Zhang, Y. Applications of THz Spectral Imaging in the Detection of Agricultural Products. Photonics 2021, 8, 518. [Google Scholar] [CrossRef]
  9. Cecconi, V.; Kumar, V.; Pasquazi, A.; Gongora, J.S.T.; Peccianti, M. Nonlinear field-control of terahertz waves in random media for spatiotemporal focusing [version 3; peer review: 2 approved]. Open Res. Europe 2023, 2, 32. [Google Scholar] [CrossRef]
  10. Luana, O.; Peters, L.; Cecconi, V.; Cutrona, A.; Rowley, M.; Totero Gongora, J.S.; Alessia Pasquazi, A.; Peccianti, M. Terahertz Nonlinear Ghost Imaging via Plane Decomposition: Toward Near-Field Micro-Volumetry. ACS Photonics 2023, 10, 1726–1734. [Google Scholar] [CrossRef]
  11. Abro, G.M.; Kundan, K. Implementation of fruit grading & sorting station using digital image processing techniques. Sir Syed Univ. Res. J. Eng. Technol. 2017, 7, 6. [Google Scholar]
  12. Tunio, N.; Abdul, L.M.; Faheem, Y.K.; Ghulam, M.A. Detection of infected leaves and botanical diseases using curvelet transform. Int. J. Adv. Comput. Sci. Appl. 2019, 10, 1. [Google Scholar] [CrossRef]
  13. Mahmudul Hasan, A.S.M.; Sohel, F.; Diepeveen, D.; Laga, H.; Jones, M.G. A survey of deep learning techniques for weed detection from images. Comput. Electron. Agric. 2021, 184, 106067. [Google Scholar] [CrossRef]
  14. Wu, Z.; Chen, Y.; Zhao, B.; Kang, X.; Ding, Y. Review of Weed Detection Methods Based on Computer Vision. Sensors 2021, 21, 3647. [Google Scholar] [CrossRef] [PubMed]
  15. Wang, A.; Zhang, W.; Wei, X. A review on weed detection using ground-based machine vision and image processing techniques. Comput. Electron. Agric. 2019, 158, 226–240. [Google Scholar] [CrossRef]
  16. Longzhe, Q.; Wei, J.; Li, J.; Li, H.; Wang, Q.; Chen, L. Intelligent intra-row robotic weeding system combining deep learning technology with a targeted weeding mode. Biosyst. Eng. 2022, 216, 13–31. [Google Scholar]
  17. Jiao, L.; Zhang, F.; Liu, F.; Yang, S.; Li, L.; Feng, Z.; Qu, R. A survey of deep learning-based object detection. IEEE Access 2019, 7, 128837–128868. [Google Scholar] [CrossRef]
  18. Ren, S.; He, K.; Girshick, R.; Sun, J. Faster r-cnn: Towards real-time object detection with region proposal networks. Adv. Neural Inf. Process. Syst. 2015, 28, 91–99. [Google Scholar] [CrossRef]
  19. Mu, Y.; Feng, R.; Ni, R.; Li, J.; Luo, T.; Liu, T.; Li, X.; Gong, h.; Guo, Y.; Sun, Y.; et al. A Faster R-CNN-Based Model for the Identification of Weed Seedling. Agronomy 2022, 12, 2867. [Google Scholar] [CrossRef]
  20. Redmon, J.; Divvala, S.; Girshick, R.; Farhadi, A. You only look once: Unified, real-time object detection. In Proceedings of the IEEE Conference on Computer Vision and Pattern Recognition, Las Vegas, NV, USA, 27–30 June 2016; pp. 779–788. [Google Scholar]
  21. Ying, B.; Xu, Y.; Zhang, S.; Shi, Y.; Liu, L. Weed Detection in Images of Carrot Fields Based on Improved YOLO v4. Trait. Signal 2021, 38, 341–348. [Google Scholar] [CrossRef]
  22. Bochkovskiy, A.; Wang, C.Y.; Liao, H.Y.M. Yolov4: Optimal speed and accuracy of object detection. arXiv 2020, arXiv:2004.10934. [Google Scholar]
  23. Wang, Q.; Cheng, M.; Huang, S.; Cai, Z.; Zhang, J.; Yuan, H. A deep learning approach incorporating YOLO v5 and attention mechanisms for field real-time detection of the invasive weed Solanum rostratum Dunal seedlings. Comput. Electron. Agric. 2022, 199, 107194. [Google Scholar] [CrossRef]
  24. Chen, J.; Wang, H.; Zhang, H.; Luo, T.; Wei, D.; Long, T.; Wang, Z. Weed detection in sesame fields using a YOLO model with an enhanced attention mechanism and feature fusion. Comput. Electron. Agric. 2022, 202, 107412. [Google Scholar] [CrossRef]
  25. Hong, W.; Ma, W.; Ye, B.; Yu, G.; Tang, T.; Zheng, M. Detection of Green Asparagus in Complex Environments Based on the Improved YOLOv5 Algorithm. Sensors 2023, 23, 1562. [Google Scholar] [CrossRef] [PubMed]
  26. Liu, L.; Liang, J.; Wang, J.; Hu, P.; Wan, L.; Zheng, Q. An improved YOLOv5-based approach to soybean phenotype information perception. Comput. Electr. Eng. 2023, 106, 108582. [Google Scholar] [CrossRef]
  27. Chen, J.; Kao, S.; He, H.; Zhuo, W.; Wen, S.; Lee, C.H.; Chan, S.H.G. Run, Don’t Walk: Chasing Higher FLOPS for Faster Neural Networks. arXiv 2023, arXiv:2303.03667. [Google Scholar]
  28. Liu, Y.; Li, H.; Hu, C.; Luo, S.; Luo, Y.; Chen, C.W. Learning to Aggregate Multi-Scale Context for Instance Segmentation in Remote Sensing Images. arXiv 2021, arXiv:2111.11057. [Google Scholar]
  29. Wang, J.; Chen, K.; Xu, R.; Liu, Z.; Loy, C.C.; Lin, D. Carafe: Content-aware reassembly of features. In Proceedings of the IEEE/CVF International Conference on Computer Vision, Seoul, Republic of Korea, 27 October–2 November 2009; pp. 3007–3016. [Google Scholar]
  30. Zhang, Y.F.; Ren, W.; Zhang, Z.; Jia, Z.; Wang, L.; Tan, T. Focal and efficient IOU loss for accurate bounding box regression. Neurocomputing 2022, 506, 146–157. [Google Scholar] [CrossRef]
  31. Bodla, N.; Singh, B.; Chellappa, R.; Davis, L.S. Soft-NMS—Improving object detection with one line of code. arXiv 2017, arXiv:1704.04503. [Google Scholar]
  32. Salazar-Gomez, A.; Darbyshire, M.; Gao, J.; Sklar, E.I.; Parsons, S. Towards practical object detection for weed spraying in precision agriculture. arXiv 2021, arXiv:2109.11048. [Google Scholar]
  33. Howard, A.G.; Zhu, M.; Chen, B.; Kalenichenko, D.; Wang, W.; Weyand, T.; Andreetto, M.; Adam, H. Mobilenets: Efficient convolutional neural networks for mobile vision applications. arXiv 2017, arXiv:1704.04861. [Google Scholar]
  34. Zhang, X.; Zhou, X.; Lin, M.; Sun, J. Shufflenet: An extremely efficient convolutional neural network for mobile devices. arXiv 2018, arXiv:1707.01083. [Google Scholar]
  35. Han, K.; Wang, Y.; Tian, Q.; Guo, J.; Xu, C.; Xu, C. Ghostnet: More features from cheap operations. arXiv 2020, arXiv:1911.11907. [Google Scholar]
  36. Neubeck, A.; Gool, L.J.V. Efficient Non-Maximum Suppression. In Proceedings of the International Conference on Pattern Recognition, Hong Kong, China, 20–24 August 2006; IEEE Computer Society: Hong Kong, China, 2006. [Google Scholar] [CrossRef]
  37. Rezatofighi, H.; Tsoi, N.; Gwak, J.Y.; Sadeghian, A.; Reid, I.; Savarese, S. Generalized intersection over union: A metric and a loss for bounding box regression. In Proceedings of the IEEE/CVF Conference on Computer Vision and Pattern Recognition, Long Beach, CA, USA, 15–20 June 2019; pp. 658–666. [Google Scholar]
  38. Zheng, Z.; Wang, P.; Liu, W.; Li, J.; Ye, R.; Ren, D. Distance-IoU loss: Faster and better learning for bounding box regression. Proc. AAAI Conf. Artif. Intell. 2020, 34, 12993–13000. [Google Scholar] [CrossRef]
  39. Gevorgyan, Z. SIoU loss: More powerful learning for bounding box regression. arXiv 2022, arXiv:2205.12740. [Google Scholar]
  40. Tong, Z.; Chen, Y.; Xu, Z.; Yu, R. Wise-IoU: Bounding Box Regression Loss with Dynamic Focusing Mechanism. arXiv 2023, arXiv:2301.10051. [Google Scholar]
  41. Siliang, M.; Yong, X. MPDIoU: A Loss for Efficient and Accurate Bounding Box Regression. arXiv 2023, arXiv:2307.07662. [Google Scholar]
  42. Wang, C.Y.; Bochkovskiy, A.; Liao, H.Y.M. YOLOv7: Trainable bag-of-freebies sets new state-of-the-art for real-time object detectors. arXiv 2023, arXiv:2207.02696. [Google Scholar]
  43. Ge, Z.; Liu, S.; Wang, F.; Li, Z.; Sun, J. Yolox: Exceeding yolo series in 2021. arXiv 2021, arXiv:2107.08430. [Google Scholar]
  44. Wang, A.; Peng, T.; Cao, H.; Xu, Y.; Wei, X.; Cui, B. TIA-YOLOv5: An improved YOLOv5 network for real-time detection of crop and ed in the field. Front. Plant Sci. 2022, 13, 1091655. [Google Scholar] [CrossRef]
  45. Liu, W.; Anguelov, D.; Erhan, D.; Szegedy, C.; Reed, S.; Fu, C.Y.; Berg, A.C. Ssd: Single shot multibox detector. In Proceedings of the Computer Vision–ECCV 2016: 14th European Conference, Amsterdam, The Netherlands, 11–14 October 2016; Part I 14. Springer International Publishing: Cham, Switzerland, 2016; pp. 21–37. [Google Scholar]
Figure 1. Examples of images from the dataset.
Applsci 13 13074 g001
Figure 2. YOLOv5s Architecture Diagram.
Applsci 13 13074 g002
Figure 3. PConv, Faster-Block, and C3-Faster Structure Diagrams ((a): PConv; (b): Faster-Block; (c): C3-Faster).
Applsci 13 13074 g003
Figure 4. Context aggregation block. Permutations of feature maps are represented as their dimensions, e.g., C × H × W indicates a matrix with a number of channels C, height H, and width W. ⊗ and ⊙ denote batched matrix multiplication and broadcast Hadamard product. Convolution layers used for attention map generation, feature mapping, and context refinement are annotated as blue, red, and green.
Applsci 13 13074 g004
Figure 5. CARAFE module diagram.
Applsci 13 13074 g005
Figure 7. (a) presents the Precision–Recall (PR) curve for YOLOv5s, while (b) depicts the PR curve for CCCS-YOLO.
Applsci 13 13074 g007
Figure 8. The training results for CCCS-YOLO.
Applsci 13 13074 g008
Figure 9. Comparison of detection results in different environments. (ae) represent five different soil conditions, respectively.
Applsci 13 13074 g009
Figure 10. (a) The Precision–Recall (PR) curve for CCCS-YOLO, while (b) depicts the PR curve for YOLOv5s.
Applsci 13 13074 g010
Table 1. Advantages and disadvantages of various detection algorithms.
MethodAdvantagesDisadvantages
Optical DetectionHigh accuracy, fast speedHigh cost, not suitable for multi-target detection
Digital Image ProcessingFast speed, low costLimited applicability, high environmental requirements
Curvelet Transform DetectionFast speedLimited applicability, high detection environmental requirements
Computer VisionHigh accuracy, fast speedRequires a large amount of dataset and computational resources
Table 2. Comparative experiments of YOLOv5s with different loss functions.
MethodsParams (M)FLOPs@640 (B)[email protected]
(%)
[email protected]:0.95(%)Precision
(%)
Recall (%)
yolov5s7.115.876.353.576.971.5
yolov5s + G7.115.877.753.776.372.5
yolov5s + D7.115.877.353.776.972.4
yolov5s + E7.115.877.854.276.973.0
yolov5s + S7.115.877.954.076.572.7
yolov5s + W7.115.875.852.876.271.6
yolov5s + M7.115.875.853.076.671.2
yolov5s + SN7.115.877.357.576.471.3
yolov5s + SN + D7.115.877.657.576.772.4
yolov5s + SN + E7.115.877.657.976.873.0
yolov5s + SN + G7.115.877.757.476.272.6
yolov5s + SN + S7.115.876.757.277.370.6
Table 3. Comparison among different object detection algorithms.
Model[email protected]
(%)
[email protected]:0.95
(%)
Recall (%)F1Precision (%)Weight
(MB)
Params (M)GFLOPs
YOLOv4-tiny50.6830.6946.254.867.8722.46.016.3
Faster-RCNN53.4636.160.152.847.110841.1378.1
SSD46.4831.256.965.075.891.150.4114.2
YOLOx74.8453.771.474.477.6934.38.9426.64
YOLOv5s76.353.571.574.176.913.77.115.8
TIA-YOLOv575.6352.472.474.877.516.89.417.6
YOLOv7-tiny76.951.371.374.778.611.76.113.0
YOLOv8s77.154.072.476.982.121.511.228.6
CCCS-YOLO79.558.674.877.981.314.97.6516.1
Table 4. Ablation experiments.
MethodsParams
(M)
GFLOPs[email protected]
(%)
[email protected]:0.95
(%)
P
(%)
R
(%)
YOLOv5s7.115.876.353.576.971.5
YOLOv5s + C3F6.814.977.753.477.972.8
YOLOv5s + CA7.716.777.953.977.871.8
YOLOv5s + CAR7.1616.077.553.779.872.7
YOLOv5s + SNE7.115.877.657.976.873.0
YOLOv5s + C3F + CA7.515.878.153.878.473.6
YOLOv5s + C3F + CA + SNE7.515.878.958.278.773.6
YOLOv5s + C3F + CA + SNE + CAR7.6516.179.558.681.374.8
Table 5. Comparative experiment on sesame weed dataset.
Model[email protected] (%)[email protected]:0.95 (%)Recall (%)Precision (%)
YOLOv5s87.2%57.3%82.5%81.2%
CCCS-YOLO88.7%58.9%83.1%83.7%
Disclaimer/Publisher’s Note: The statements, opinions and data contained in all publications are solely those of the individual author(s) and contributor(s) and not of MDPI and/or the editor(s). MDPI and/or the editor(s) disclaim responsibility for any injury to people or property resulting from any ideas, methods, instructions or products referred to in the content.

