Article

Shaft Wall Damage to High-Depth Inclined Ore Passes under Impact Wear Behavior

1
School of Civil Engineering and Transportation, South China University of Technology, Guangzhou 510640, China
2
Institute of Safety Science and Engineering, South China University of Technology, Guangzhou 510640, China
3
State Key Laboratory of Subtropical Building Science, South China University of Technology, Guangzhou 510640, China
*
Author to whom correspondence should be addressed.
Appl. Sci. 2023, 13(24), 13065; https://doi.org/10.3390/app132413065
Submission received: 27 October 2023 / Revised: 2 December 2023 / Accepted: 4 December 2023 / Published: 7 December 2023

Abstract

:
In order to study shaft wall damage resulting from ore drawing in ore passes, a theoretical model for predicting the shaft wall damage to high-depth inclined ore passes is constructed based on field surveys of 25 ore passes in a deep mine in Yunnan, China. The mathematical expression of the total shaft wall damage volume is derived using the contact mechanics theory. Considering the structural characteristics of ore passes, and taking No. 1, 2, 3, and 9 ore passes as examples, combined with numerical simulation and an engineering case, the rationality of the proposed theoretical model is verified with respect to the initial collision position and the damage conditions of the shaft wall. The influence of, and sensitivity to, the ore block size P and the structural parameters of high-depth inclined ore passes on the total shaft wall damage volume Qtol are quantitatively analyzed. The results show that the calculation results of the theoretical model and numerical simulation are in good agreement with the actual engineering situations. Moreover, the ore-pass dip angle θ and the inclined angle of the chute α have a significant impact on the damage to the shaft wall, while the effects of the ore-pass depth H and the shaft diameter D are comparatively minor. With an increase in θ or α, Qtol generally first increases and then decreases. Qtol increases exponentially with P and increases steadily with D. H affects Qtol by influencing the collision frequency between the ore and the shaft wall. Therefore, in the mining design of deep mines, θ and α should be minimized as much as possible or adjusted to approach 90°, thereby reducing damage to the shaft wall. Secondly, ore block size should be strictly controlled to prevent collapses in the shaft wall caused by large ore blocks. This work provides technical support for the long-term safe operation of high-depth inclined ore passes.

1. Introduction

Deep mining is a future development trend, and kilometer-deep metal mines are becoming increasingly common [1,2,3,4]. High-depth inclined ore passes (depth exceeding 100 m) are regarded as important projects for the low-cost downward transportation of deep mining and they are the key connection between the middle production levels and haulage ways in underground mines [5,6,7]. Due to the different geological environments, complex mining conditions, and improper structural parameters of ore passes (i.e., the depth and dip angle of ore passes), the impact wear effect of extracted ore blocks can cause the shaft wall to sag and wear, leading to shaft wall damage and collapse accidents. Therefore, the shaft wall damage to high-depth inclined ore passes under impact wear behavior is investigated to ensure long-term safe operation.
At present, some works have been carried out on shaft wall damage in ore passes. Zhao et al. [8] studied the damage characteristics of the shaft wall of a vertical ore pass based on the erosion wear theory and the Hertz contact theory. Yin et al. [9,10] determined the initial collision position distribution of ore transporting in a vertical ore pass and deduced a three-dimensional moving track equation before collision. Deng et al. [11] studied changes in the internal force chain structure of bulk ores under discharge impact at different heights using the PFC (Particle Flow Code) numerical simulation. Through similarity experiments on ore drawing in an ore pass, Liu et al. [12,13] obtained the ore moving track and the shaft wall wear range and developed a panoramic scanning imaging device for use in vertical ore passes. Ren et al. [14] recorded changes in rock strata using the total station observation method, revealing the impact point distribution and its failure rule for ore drawing in vertical ore passes with different geological structures. Esmaieli et al. [15,16] analyzed the stress state around the chute using three-dimensional boundary elements to study the shaft wall failure mechanism under impact load and material flow wear. Campbell [17] built a lateral pressure theory on the basis of lateral pressure and coefficients of lateral pressure using the micromechanics theory. Kulshrestha et al. [18] proposed an ore-pass scanner based on interferometer synthetic aperture radar (InSAR) time series to monitor potential collapse areas in the shaft wall. In addition, scholars have conducted preliminary studies on the influencing factors of shaft wall damage for ore passes, such as the shape and size of the extracted ore [19,20], the size of the ore pass [21], the drawing speed [22], and the crack of surrounding rocks [23]. In general, the relevant research has mainly focused on the damage range of the shaft wall and the ore flow rule in vertical ore passes, while the shaft wall damage caused by the structural parameters of high-depth inclined ore passes and the ore block size is rarely investigated, which makes it difficult to meet the requirements of practical engineering.
In this study, based on a field investigation of 25 ore passes in a deep mine in Yunnan, China, a theoretical model for predicting the shaft wall damage model of high-depth inclined ore passes was established; the total shaft wall damage volume was calculated using the contact mechanics theory; and the influences of the ore block size, the shaft diameter, the inclined angle of the chute, and the ore-pass depth and dip angle on the shaft wall damage volume were evaluated. Taking No. 1, 2, 3, and 9 ore passes as examples, the rationality of the theoretical model was verified via numerical simulation and an engineering case. This paper can provide a new approach to research into damage control and the structural parameter optimization of high-depth inclined ore passes under impact wear behavior.

2. Shaft Wall Damage Model for High-Depth Inclined Ore Passes
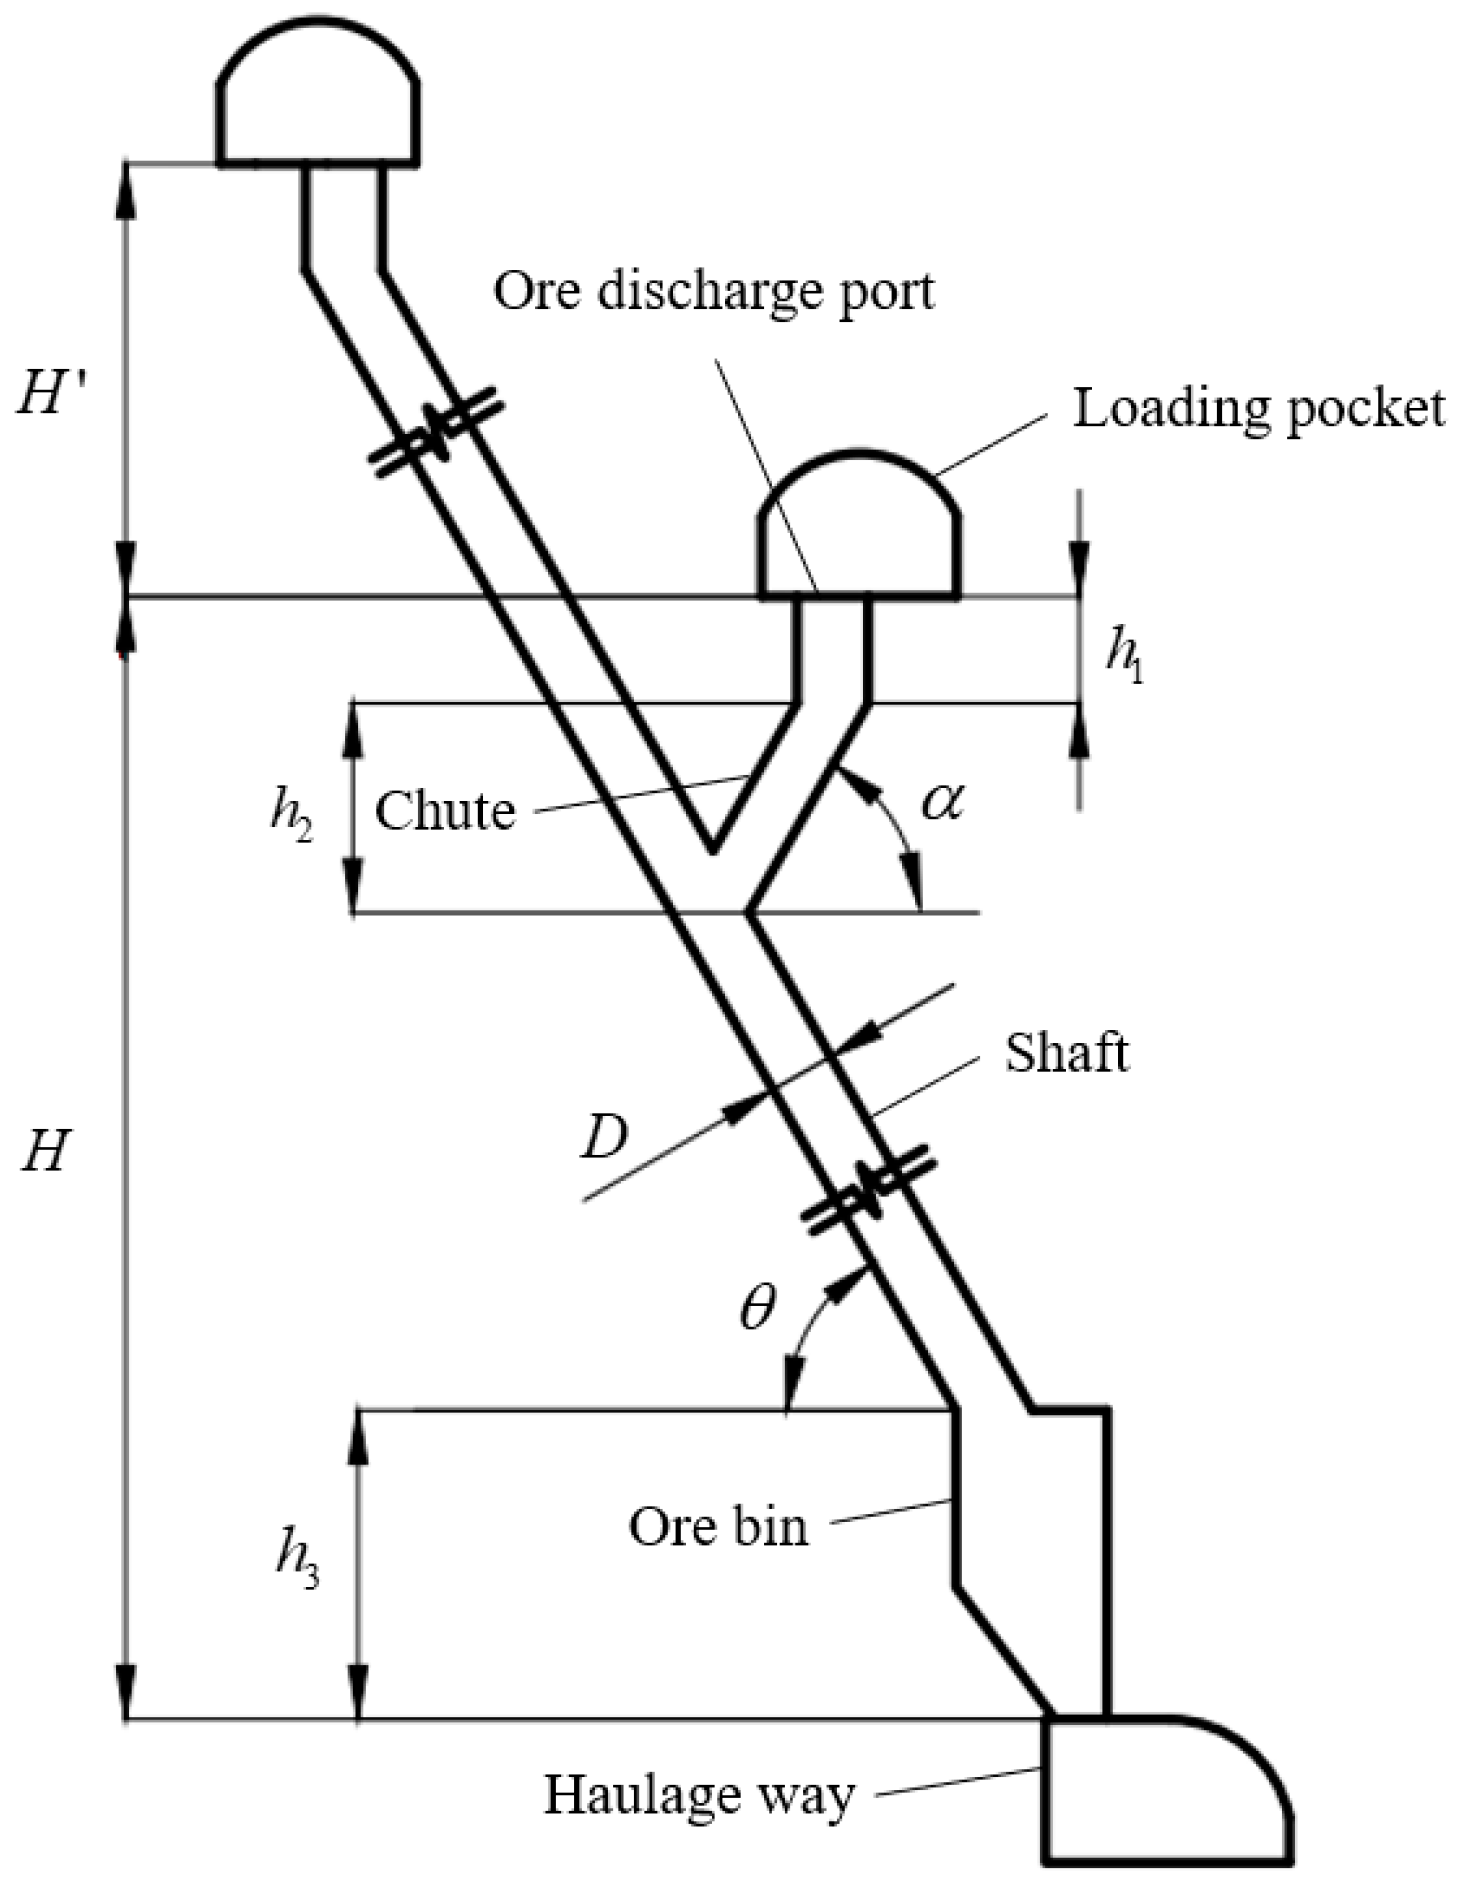
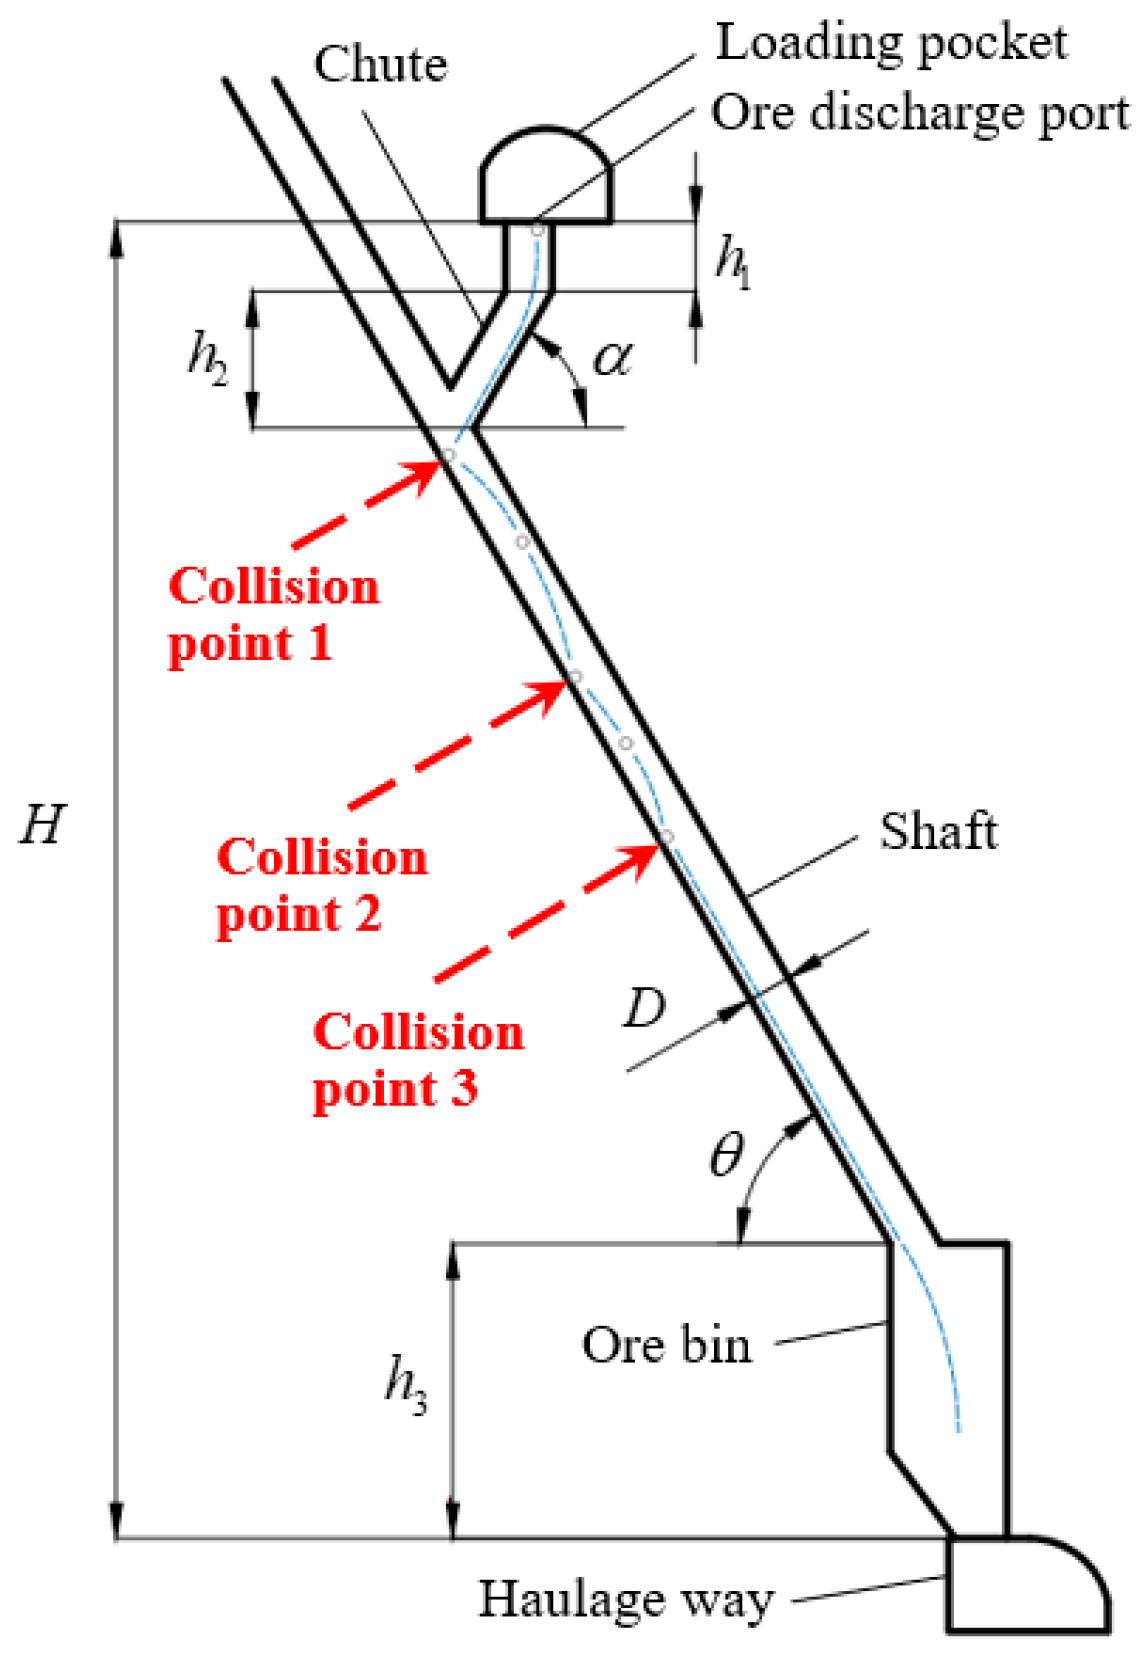
2.1. Basic Model

High-depth inclined ore passes have been widely employed in deep mines, both domestically and internationally [16,24]. Based on the design blueprint of a main ore pass in a deep mine in Yunnan, China, a schematic diagram illustrating the basic structure of this high-depth inclined ore pass is presented (Figure 1). In the diagram, θ is the ore-pass dip angle; α is the inclined angle of the chute; D is the shaft diameter; H and H′, respectively, indicate the depth of the upper- and lower-middle production levels of the ore pass; and h1, h2, and h3, respectively, indicate the heights of the ore discharge port, the inclined chute, and the bottom ore bin.
The ore extracted from the upper- and lower-middle production levels is discharged, respectively, from the ore discharge ports of the corresponding loading pockets. Due to the unique location of the loading pocket in the lower-middle production level, the discharged ore collides with the shaft wall after leaving the inclined chute. The impact wear of the ore may result in problems such as a deep depression and large wear range in the shaft wall, and in severe cases, it may induce large-scale collapse and damage to the shaft wall. The damage areas are mainly concentrated in the vicinity of the junction between the inclined chute and the shaft.
When a large ore block collides with the shaft wall, the ore presses into the wall with the normal impact force Fn and slides relative to the shaft wall surface with the tangential impact force Ft, resulting in damage to the shaft wall. δ, l, and a are, respectively, the ore indentation depth, wear length, and contact radius between the ore and the shaft wall. As shown in Figure 2, the ore indentation depth δ and the wear length l are coupled together to form the shaft wall damage volume Q.

2.2. Basic Assumptions

To simplify the calculation of the shaft wall damage volume, the following assumptions are made:
(1)
The extracted ore is assumed to be a sphere of uniform mass, and the moving ore is regarded as a particle. Only the translation of the ore is considered, while the rotation of the ore is neglected.
(2)
The shaft is a flat and inclined cylinder with the same lithology throughout, and the rock mass of the shaft wall obeys the Mohr–Coulomb criterion.
(3)
Only the interaction between the ore and the shaft wall is considered, while the interaction between ores and the mass loss of ores are neglected.

2.3. Theoretical Solution

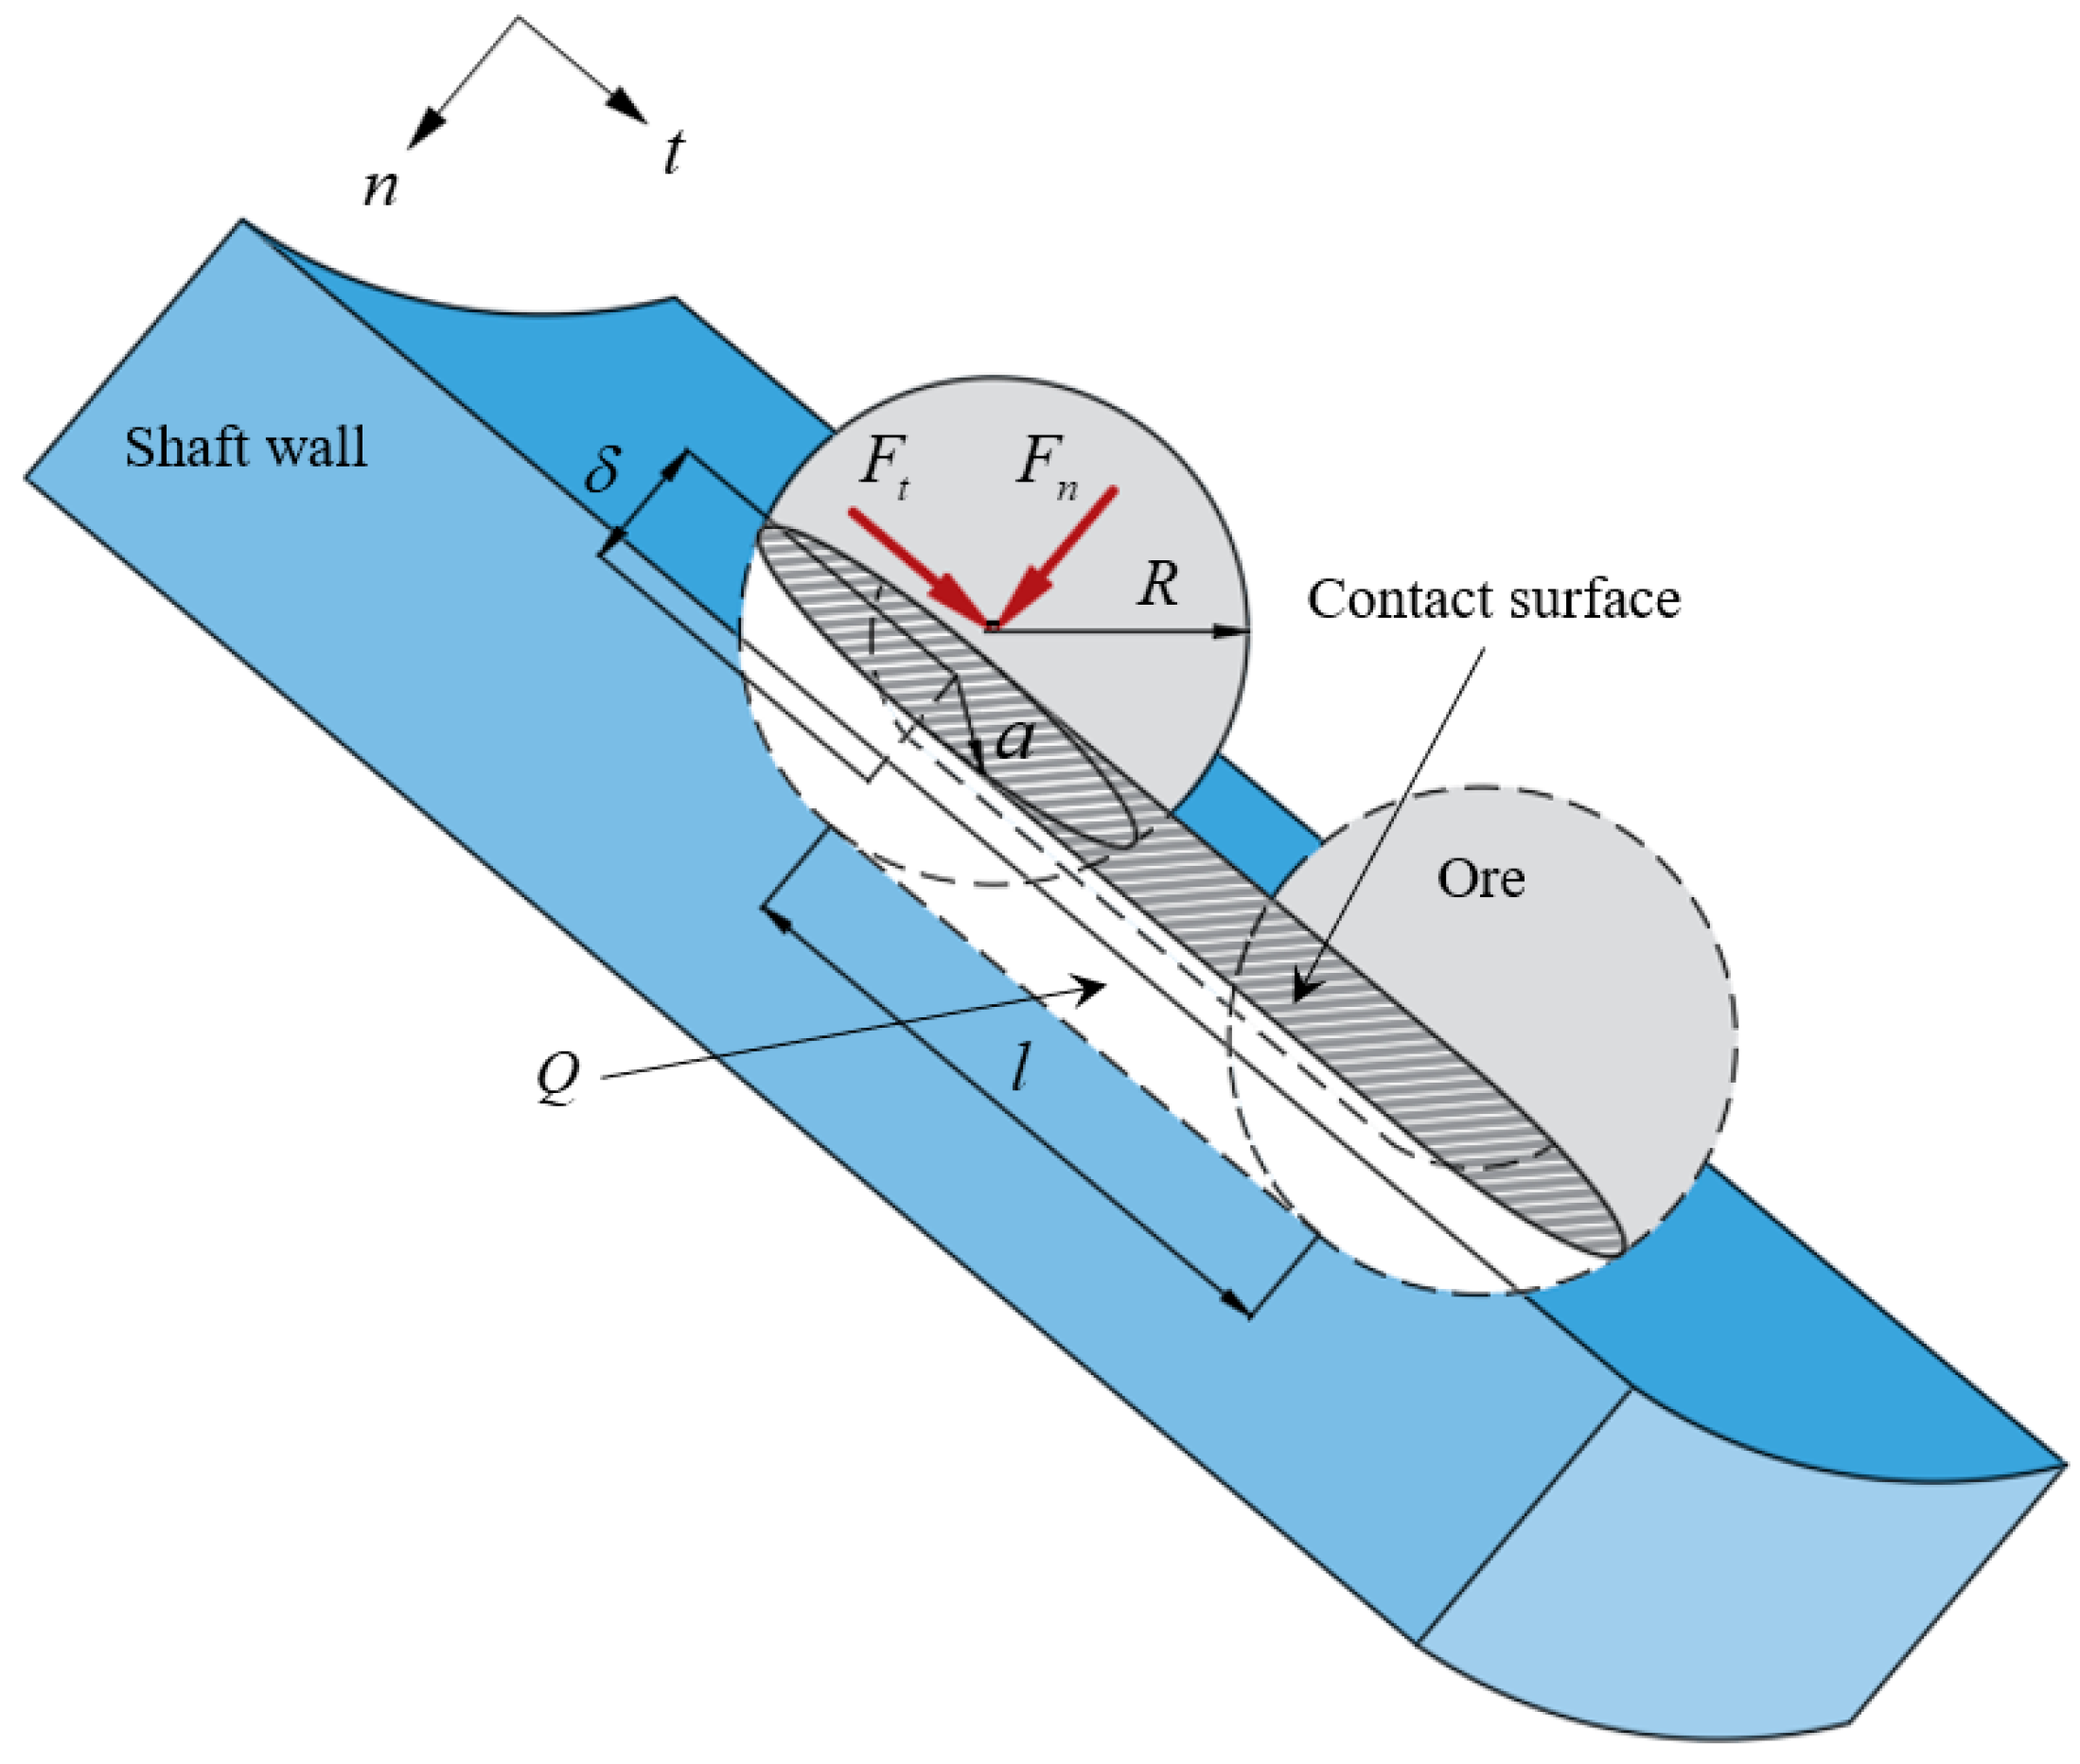
2.3.1. Ore Indentation Depth δ

Based on the contact mechanics theory, the deformation process resulting from the ore colliding with the shaft wall can be roughly divided into two stages: ① the elastic deformation of the shaft wall occurs at the initial stage of contact between the ore and the shaft wall; ② when the deformation of the shaft wall exceeds the elastic limit and reaches the initial yield state of the shaft wall rock mass, plastic deformation of the shaft wall occurs.
(1)
Elastic deformation stage
Due to the low velocity when the ore collides with the shaft wall, the contact between the ore and the shaft wall can be regarded as a quasi-static contact [25]. Based on the quasi-static contact mechanics theory [26], the normal impact force Fn during elastic deformation can be expressed as follows:
F n = 4 3 E R 1 2 δ 3 2
where R is the radius of the spherical ore; P is defined as the ore block size, with P = 2R; and E* is the equivalent elastic modulus, satisfying
1 E = 1 ν 1 E 1 + 1 ν 2 E 2
where E1, ν1, E2, and ν2 are the elastic modulus and the Poisson ratio of the ore and the shaft wall, respectively.
Based on Newton’s second law of motion, the condition for elastic deformation is satisfied that
m d 2 δ d t 2 = 4 3 E R 1 2 δ 3 2
where m is the mass of the spherical ore, with m = 4πρR3/3; ρ is the density of the ore; and d2δ/dt2 is the ore’s normal acceleration at collision. Combined with the initial collision conditions, Equation (4) is obtained via integrating Equation (3) as follows:
m 2 [ v n 2 ( d δ d t ) 2 ] = 8 15 E R 1 2 δ 5 2
where vn is the ore’s normal velocity before collision, and /dt is the ore’s normal velocity at collision.
From the general collision process, the ore’s normal impact velocity decreases continuously from the time when the ore starts to contact the shaft wall to the time when the ore indentation depth reaches the maximum. When dδ/dt = 0, the maximum ore indentation depth δm in the elastic stage can be solved as follows:
δ m = ( 15 m v n 2 16 E R 1 2 ) 2 5
(2)
Plastic deformation stage
Based on the elastic–plastic contact mechanics theory [27], when the shaft wall begins to deform plastically, it is satisfied that
σ n = η σ q
where σn is the normal contact stress between the ore and the shaft wall; σq is the initial yield strength of the rock mass of the shaft wall; and η is a dimensionless factor, with η = 1 when the rock mass of the shaft wall is initially yielding. From Equation (6), the normal impact force Fn* during the plastic deformation of the shaft wall can be written as follows:
F n = π a 2 σ n
where a* is the contact radius between the ore and the shaft wall during plastic deformation, and a* = aq when the rock mass of the shaft wall is initially yielding. The relation between the contact radius a and the ore indentation depth δ is expressed as follows:
a 2 = R δ
Combining Equations (1), (7) and (8), the ore indentation depth δq at the initial yield can be solved as follows:
δ q = 9 π 2 σ q 2 R 16 E 2
According to the law of conservation of energy, the ore’s normal impact kinetic energy is transformed into the elastic deformation energy of the shaft wall and the energy consumed in the plastic deformation. Thus, it is satisfied that
1 2 m v n 2 = U + δ q δ m F n d δ
where δ* and δm* are, respectively, the ore indentation depth when the shaft wall is in plastic deformation and when the plastic deformation reaches the maximum. U is the elastic deformation energy of the shaft wall, which can be expressed as
U = 8 15 E R 1 2 δ 5 2
Substituting Equations (7) and (11) into (10), the maximum ore indentation depth δm* can be solved as follows:
δ m = ( 15 m v n 2 16 E R 1 2 δ q 5 2 15 π R σ q + δ q 2 ) 1 2
By substituting Equation (12) into (7) and omitting the high-order infinitesimal in the obtained solution, the maximum ore normal impact force Fnm* can be expressed as
F n m = [ π R σ q ( m v n 2 + π R σ q δ q 2 ) ] 1 2

2.3.2. Wear Length l

Owing to the tangential impact effect of moving ores, these ores have a slight sliding relative to the shaft wall, resulting in wear to the shaft wall. Based on the kinetic energy theorem, the change in tangential kinetic energy when the ore collides with the shaft wall is transformed into friction work, thereby satisfying the following equation:
μ F n m l = 1 2 m v t 2 ( e t 2 1 )
where vt is the ore tangential velocity before collision; μ is the sliding friction factor; and en and et are, respectively, the normal and tangential collision recovery coefficients. Based on the quasi-static contact mechanics theory, the collision recovery coefficients are expressed as follows [28,29,30]:
{ e n = ( 3 9 4 π 5 4 5 E ) 1 2 ( 8 R 3 σ q 5 m ) 1 8 v n 1 4 e t = 1 μ ( e n + 1 ) ( v n v t )
Combining Equations (14) and (15), the wear length l can be written as
l = m v n ( e n + 1 ) [ 2 v t μ v n ( e n + 1 ) ] 2 F n m

2.3.3. Shaft Wall Damage Volume Q

The shaft wall damage volume Q per unit wear length can be expressed as [31].
d Q d l = R 2 [ arcsin ( δ m 4 R ) 1 2 ( δ m 4 R ) 1 2 ( 1 δ m 4 R ) 1 2 ]
Combining Equations (13)–(17), the shaft wall damage volume Q can be solved as follows:
Q = λ m v n ( 2 v t λ v n ) R 2 2 μ F n m [ arcsin ( δ m 4 R ) 1 2 ( δ m 4 R ) 1 2 ( 1 δ m 4 R ) 1 2 ]
where λ is the coefficient, with λ = μ(en + 1).

3. Engineering Case

3.1. Rationality of the Shaft Wall Damage Model for High-Depth Inclined Ore Passes

Taking the ore-pass engineering system of a deep mine in Yunnan, China, as the research object, the calculation results of the shaft wall damage model are compared with the numerical simulation results and the field engineering situations to verify the rationality of the proposed theoretical model of shaft wall damage for high-depth inclined ore passes.

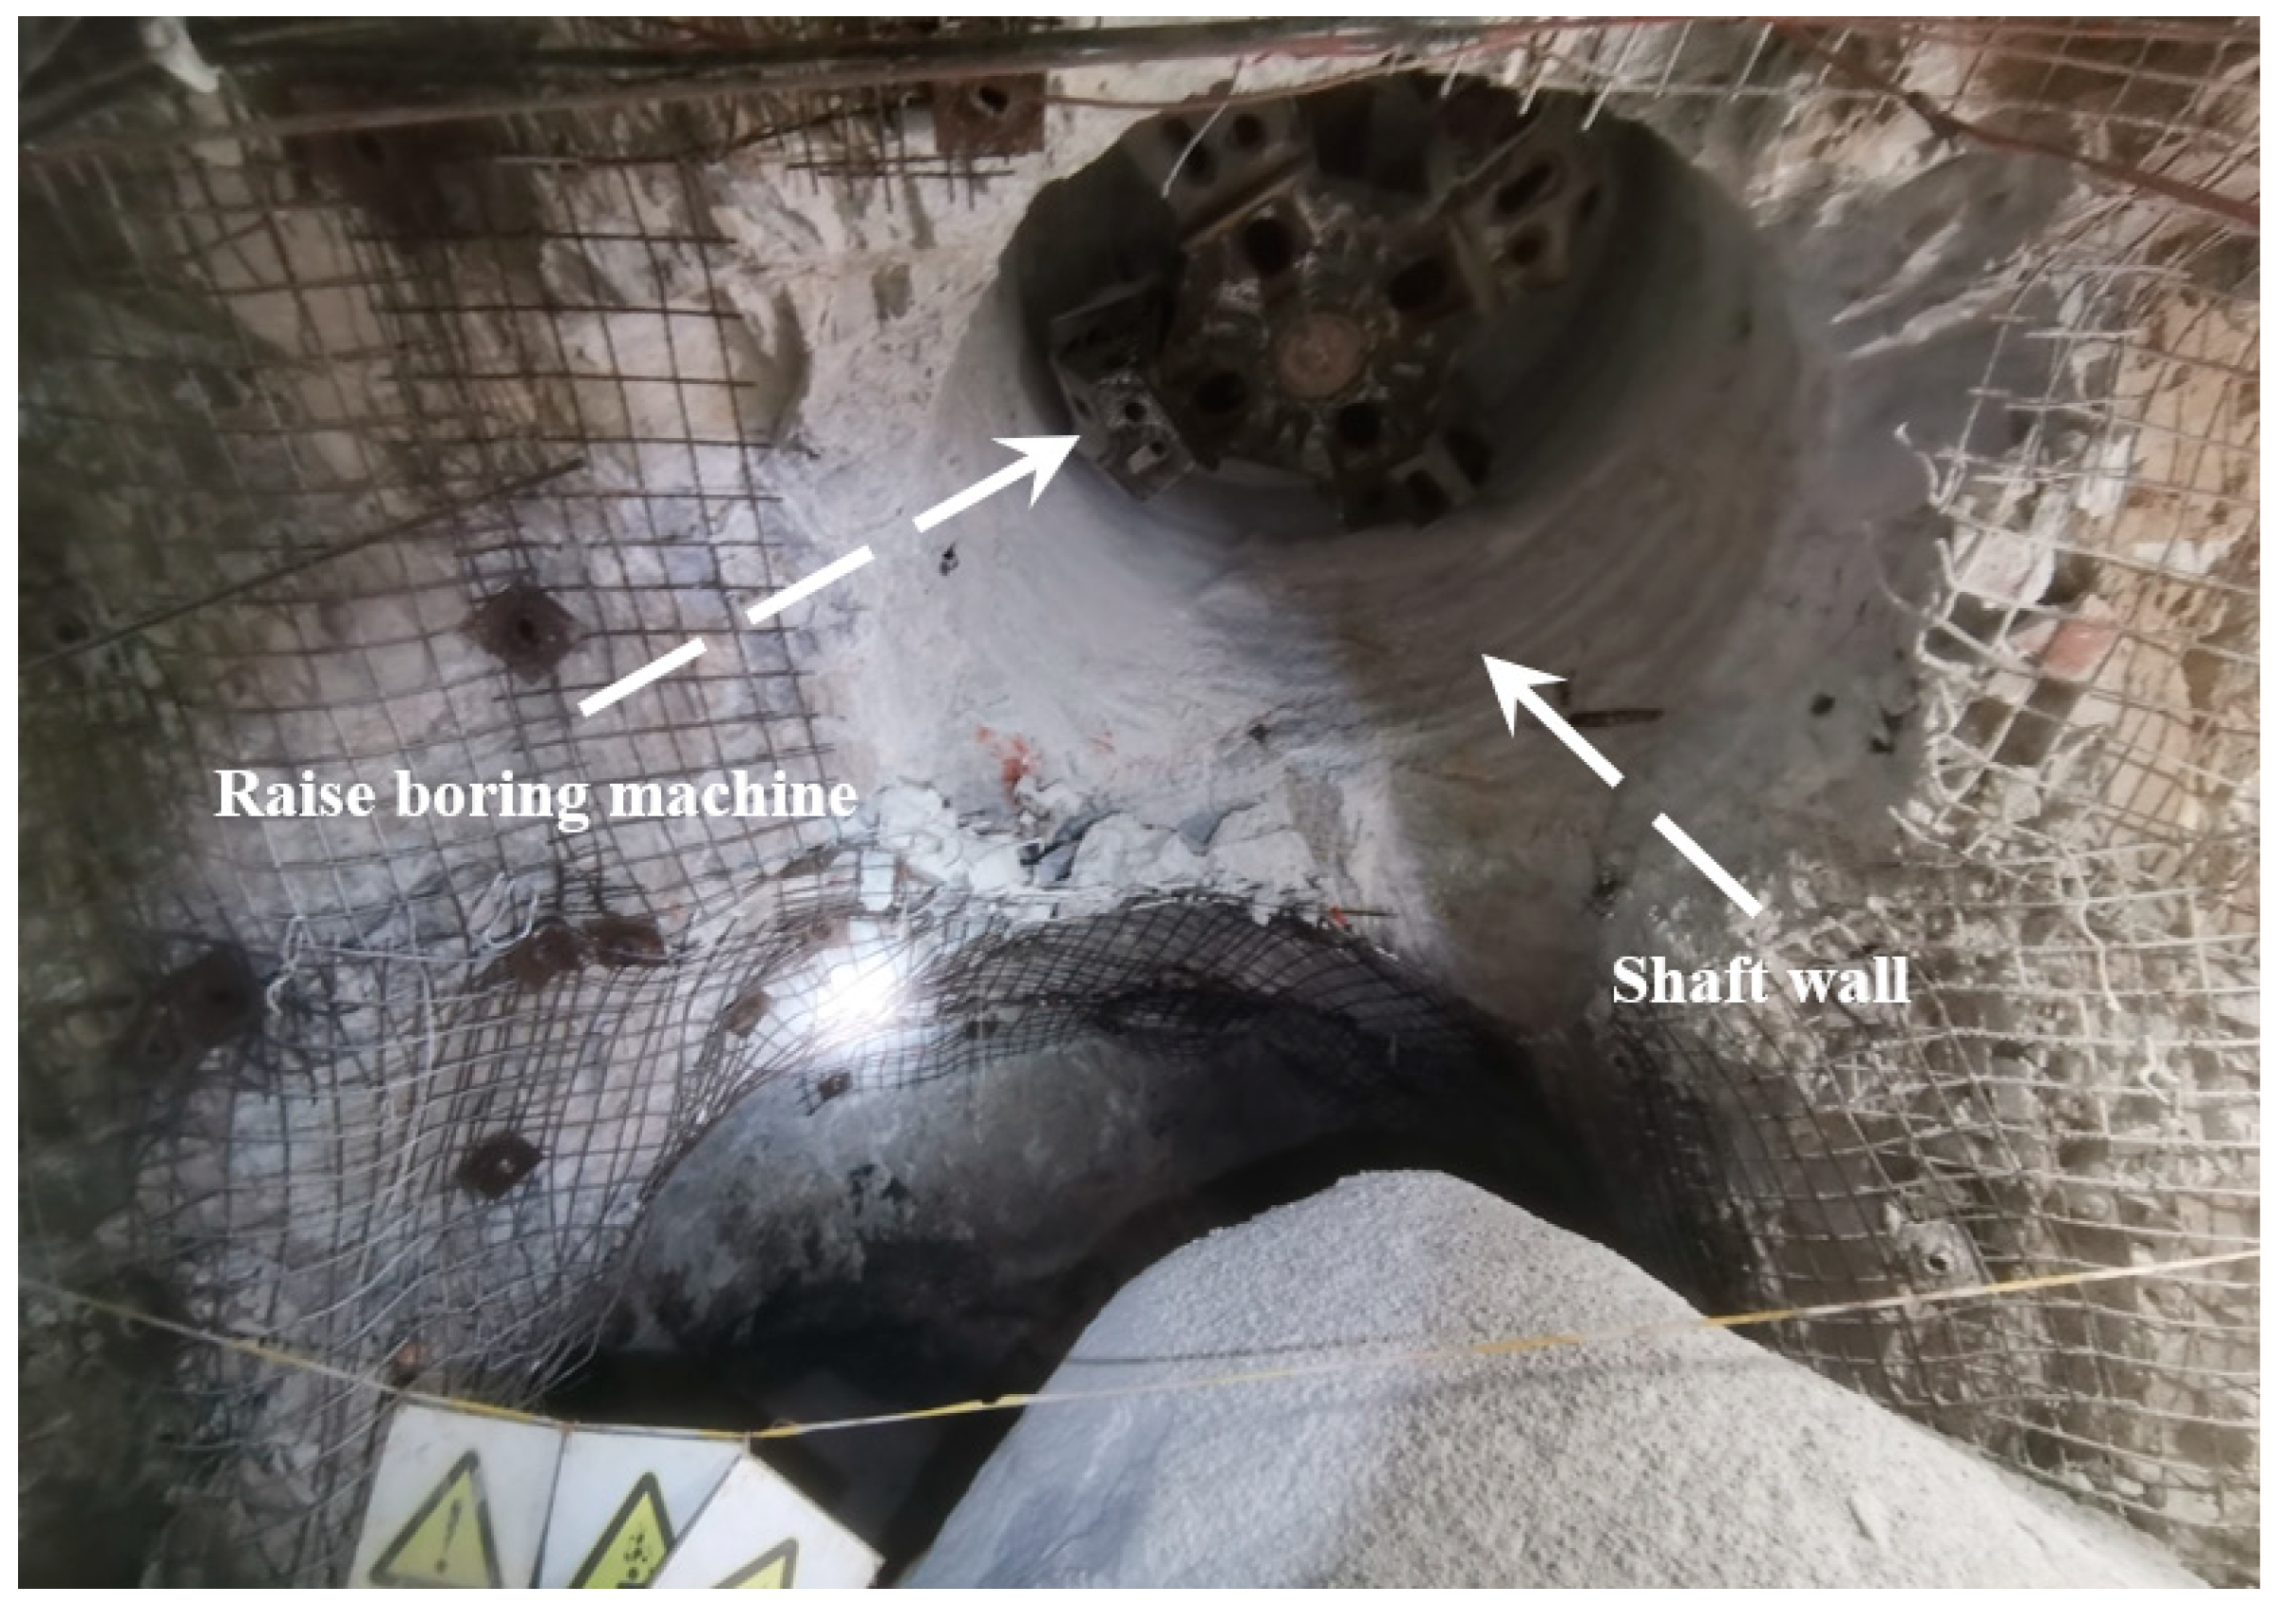
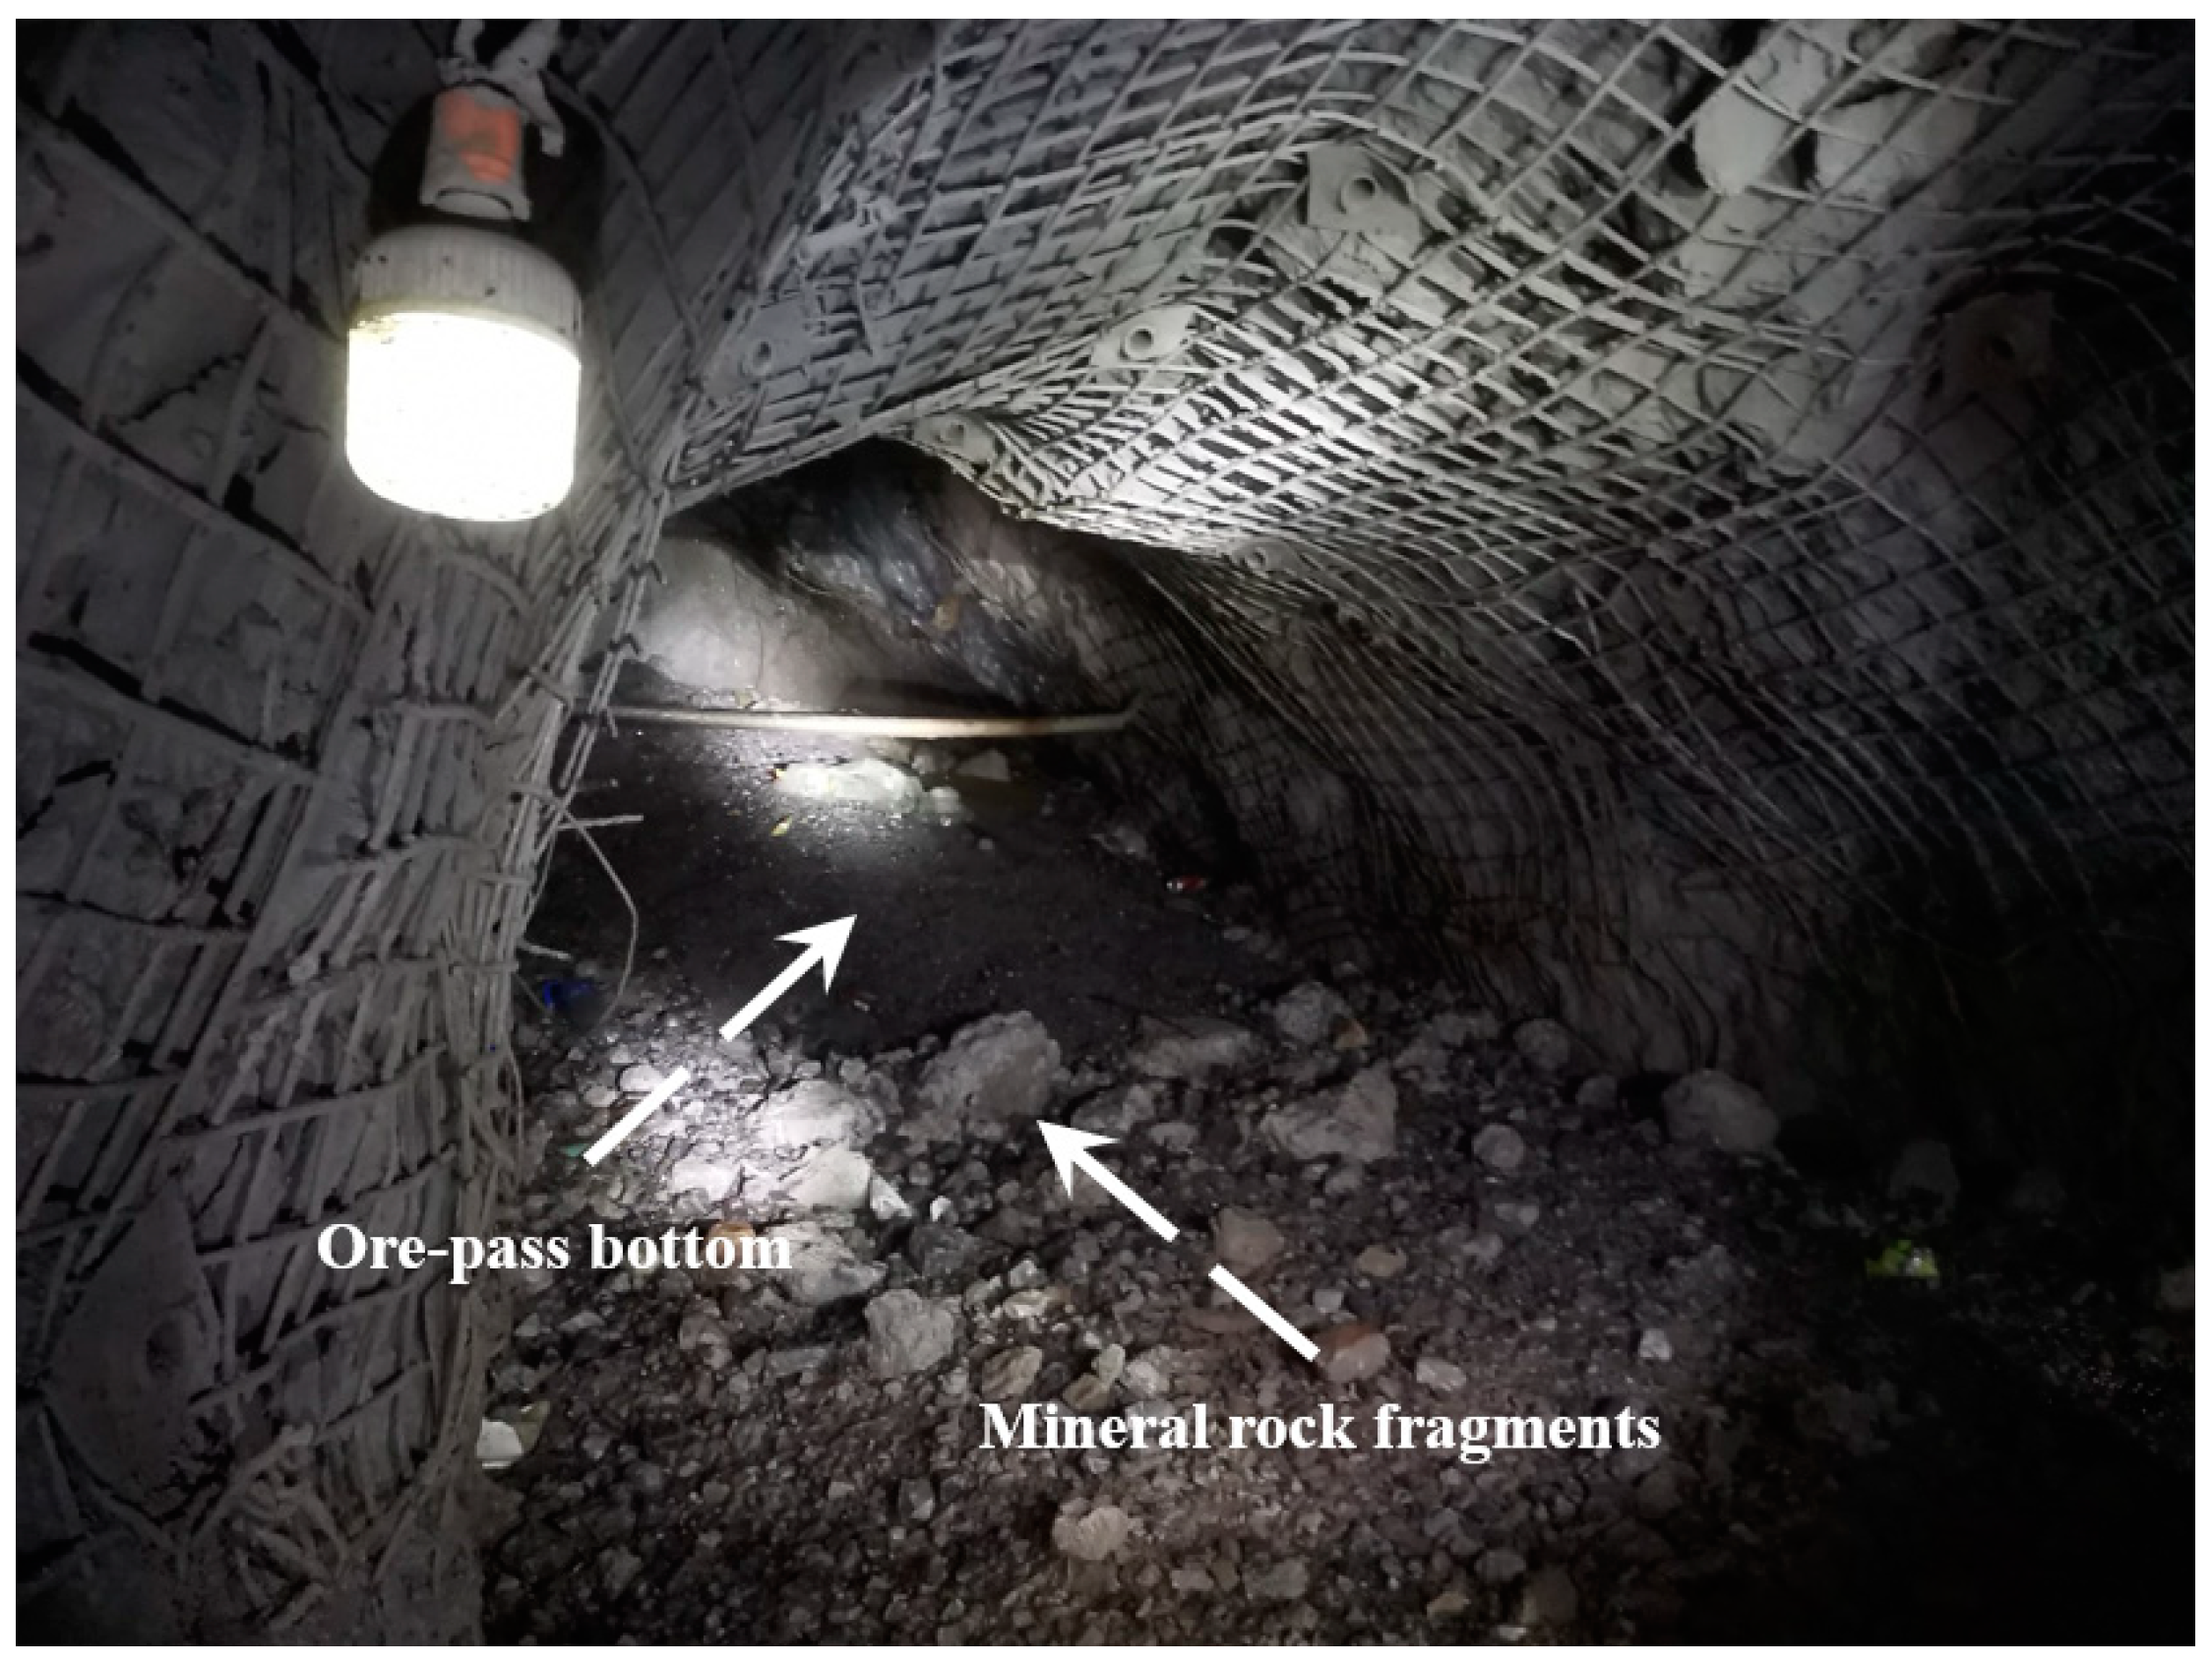
3.1.1. Engineering Survey

The ore body of a deep mine in Yunnan, China mainly occurs in the strata of the Baizuo Formation with rock dip angles of 55–65°, which is like a type of net-vein ore body. The main mining method is the mechanized panel overhand (underhand)-supported mining method, with a production capacity of 700,000–750,000 t/a, and the ores produced are mainly primary lead–zinc sulfide ores. At present, the mining depth and the middle production level height of the mine are 1614 m and 60 m, respectively. After years of mining, paste supporting has been completed in the middle production levels at +1764 m and above; the four middle production levels at +1584 m, +1404 m, +1344 m, and +1274 m are being stopped; and the middle production levels at +1104 m and below are being developed.
It can be seen from Figure 3 that, in the mine, ore passes are drilled using raise-boring machines, and more than 20 ore passes have been completed. All of these ore passes have a shaft diameter of about 2 m, an ore-pass dip angle of 50–80°, an ore-pass depth of 60–360 m, and an inclined angle of the chute of 45–70°.

3.1.2. Parameter Selection

Four ore passes, No. 9, 2, 3, and 1, were selected and labeled, respectively, as operating conditions 1, 2, 3, and 4 for comparative analysis. According to the engineering geological data of the mine, the physical and mechanical parameters of the ore and shaft wall rock mass are reported in Table 1. Due to the construction of ore passes in the case study having been carried out in the deep hard rock of the mine, the effect of soil layers is not basically considered [32,33]. In addition, based on the design blueprint of the ore-pass system of the mine, it can be calculated that the vertical height of the ore discharge port h1, the inclined chute height h2, and the ore bin height h3 of the four ore passes are 4.4 m, 1.0 m, and 19.6 m, respectively. The other structural parameters are shown in Table 2. The block size of the ore in the ore passes is set to be 400 mm.
After calculation and analysis, it was determined that the kinetic energy of an ore significantly decreases after the initial collision with the shaft wall, rendering it unable to maintain contact with the ceiling side of the shaft wall. Therefore, this paper only considers the impact wear effect on the ore pass’s bottom wall. Moreover, it has been reported that the ore kinetic energy and the shaft wall damage volume decrease greatly with an increase in collision frequency; thus, the shaft wall damage volume after more than three collisions is negligible [8,9,10,14]. In this paper, the first three collision positions are taken, and the shaft wall damage volume calculated using Equation (18) is accumulated to obtain the total shaft wall damage volume Qtol. The collision points in a high-depth inclined ore pass of a deep mine are shown in Figure 4.
Considering the structural characteristics of high-depth inclined ore passes, the total shaft wall damage volume Qtol is related to the number of collisions between the extracted ore and the shaft wall. The prerequisite for the k-th collision is that the vertical total displacement of the ore from the inclined chute into the shaft section must be less than the total height of the shaft section. Hence, the total shaft wall damage volume Qtol can be expressed as follows:
Q t o l = { 0 , y 1 > H ( h 1 + h 2 + h 3 ) k = 1 n Q k , k = 1 n y k < H ( h 1 + h 2 + h 3 )
where k is the number of collisions, and yk is the vertical displacement of the ore relative to the shaft wall from the (k − 1)-th collision to the k-th collision. Based on the kinematic principle and the geometrical structure of an ore pass, the relation between the ore vertical displacement and the structural parameters of the ore pass can be derived as follows:
y k = { D cos θ + ξ v 0 2 cos 2 α tan θ g , k = 1 2 v ( k 1 ) n g [ v ( k 1 ) n tan 2 θ + v ( k 1 ) t sin 2 θ tan θ + v ( k 1 ) t sin θ cos θ ] , k = 2 , 3
where ξ is the coefficient, with ξ = (tanθ + tanα) − [(tanθ + tanα)2 + (2gD)/(v02cos2αcosθ)]1/2, and v0 is the velocity at which the ore leaves the inclined chute, with v0 = [2g (h1 + h2μh2cotα)]1/2. vkn and vkt are the normal and tangential velocities before the k-th collision, respectively, and they can be derived as follows:
v k n = { v 0 2 sin 2 ( α + θ ) + 2 g D cos θ , k = 1 e ( k 1 ) n v ( k 1 ) n , k = 2 , 3
v k t = { [ v 0 2 sin 2 ( α + θ ) + 2 g D cos θ v 0 sin ( α + θ ) ] tan θ v 0 cos ( α + θ ) , k = 1 e ( k 1 ) t v ( k 1 ) t + 2 e ( k 1 ) n v ( k 1 ) n sin θ ( cos θ + sin θ tan θ ) , k = 2 , 3

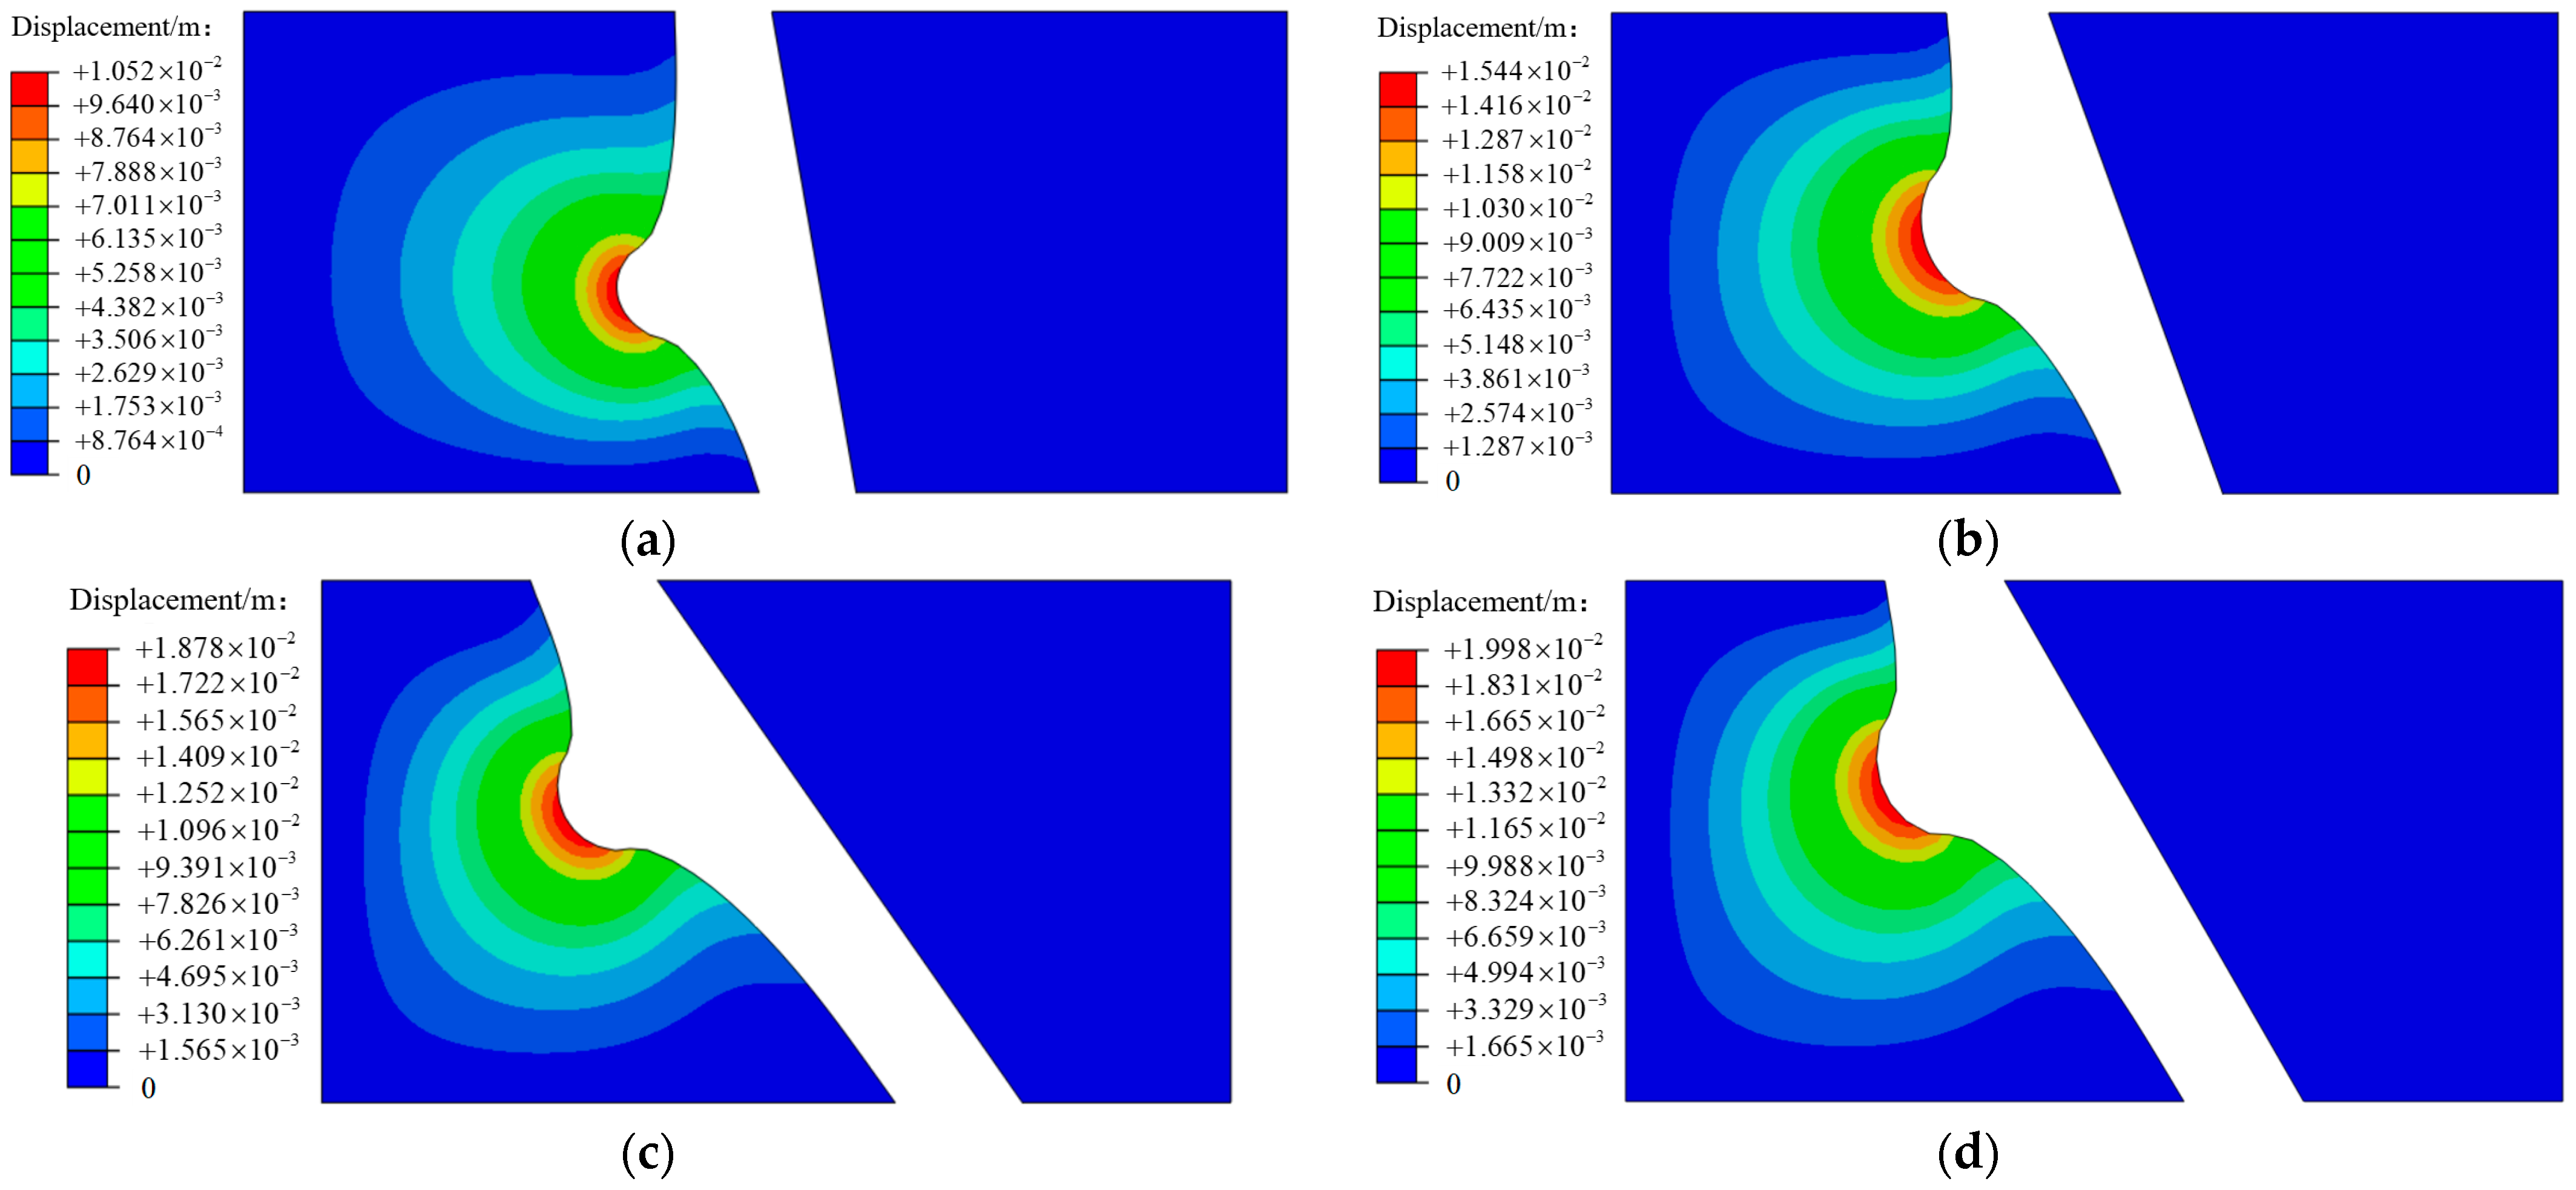
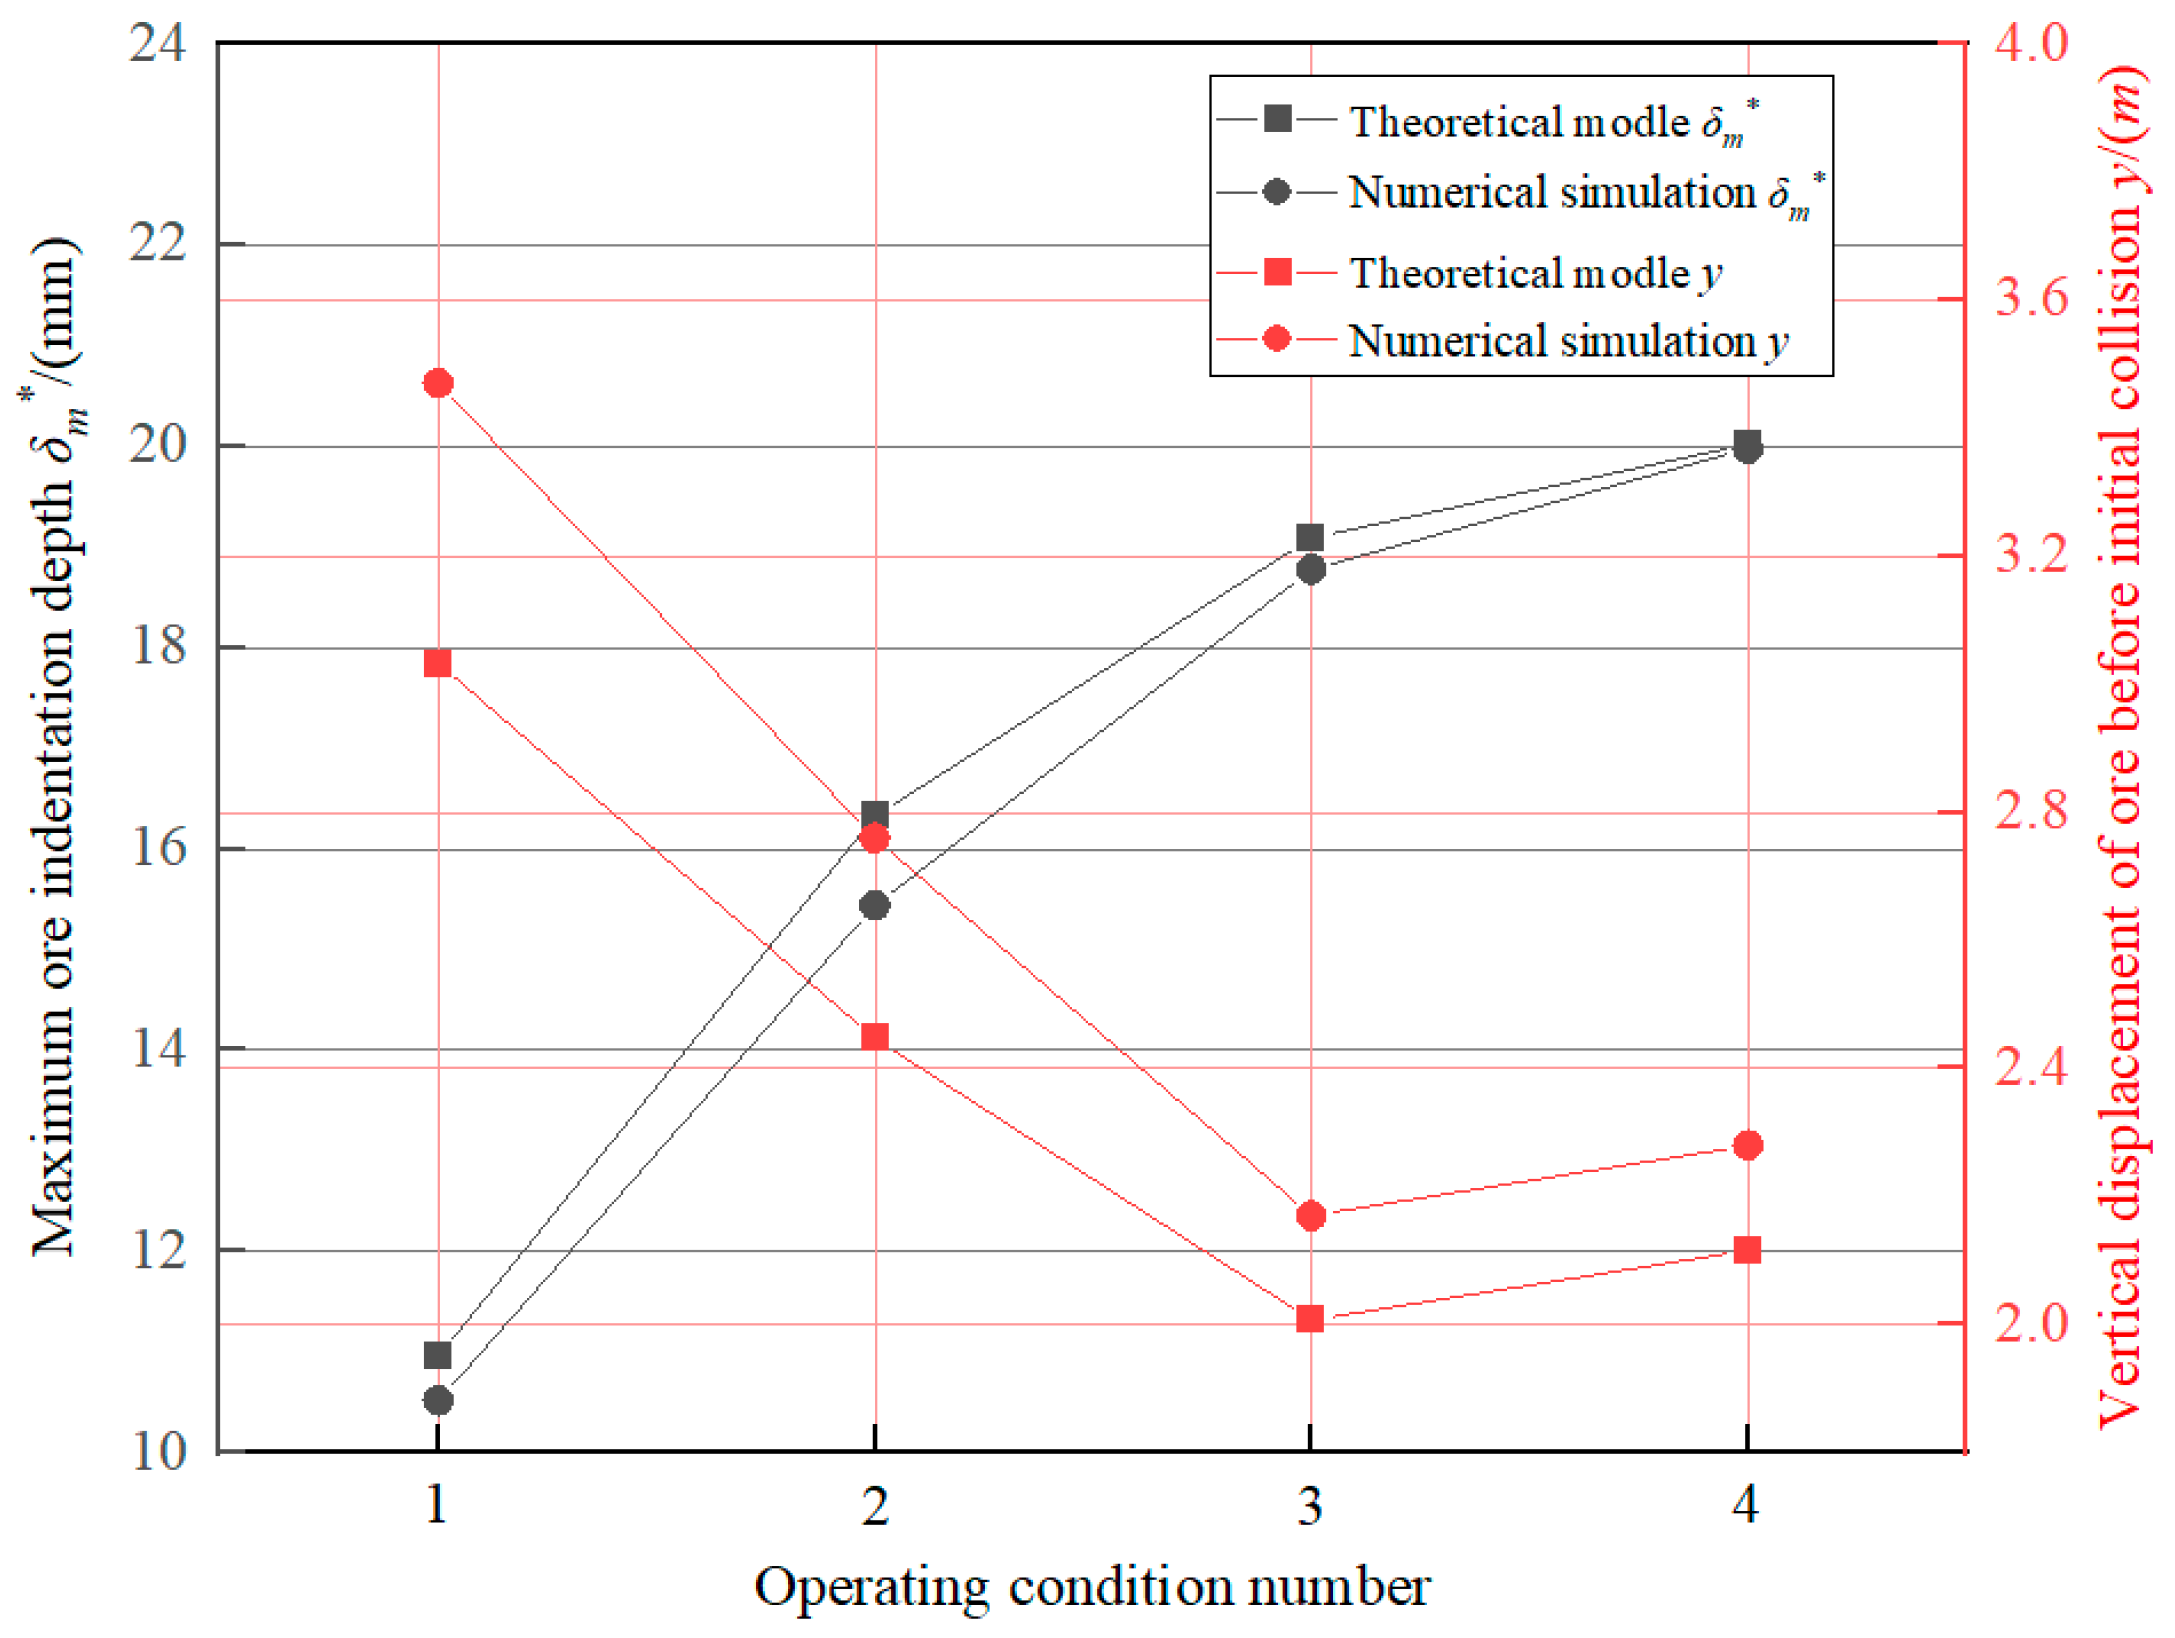
3.1.3. Result Analysis

To validate the rationality of the proposed shaft wall damage model for high-depth inclined ore passes, numerical models for operating conditions 1, 2, 3, and 4 were constructed using the 2021 version of ABAQUS software [34,35,36], and the initial collision positions and the maximum ore indentation depths were quantitatively evaluated. In the numerical simulation, the material properties of four models were defined based on the physical and mechanical parameters shown in Table 1. The mesh types for all four models were set as CPS4I, with mesh quantities of 23,381, 21,590, 22,608, and 22,256, respectively. Except for the unconstrained inner wall of the ore pass, complete fixed constraints were applied to the other boundaries of the models. The failure of the shaft wall rock mass obeys the Mohr–Coulomb criterion. The numerical simulation results for the four operating conditions are presented in Figure 5.
As can be seen from Figure 5, it is evident that there are variations in the initial collision positions and the maximum ore indentation depths between the four operating conditions. Specifically, changes in the maximum ore indentation depth exhibit a radiating distribution from the collision center toward the surrounding areas, with a gradual decrease in magnitude. The calculated results for the initial collision positions and maximum ore indentation depths obtained via the numerical simulation and theoretical model are shown in Figure 6.
From Figure 6, it can be observed that the calculated results of the initial collision positions and the maximum ore indentation depths obtained from both the theoretical model and numerical simulation have a consistent trend. Owing to factors such as the mesh partitioning accuracy, boundary condition settings, component interactions, and nonlinear behaviors in the numerical simulation, there is a certain degree of error in the results obtained by means of both calculation methods. The relative errors in the maximum ore indentation depths are all within 5%, and the relative errors in the initial collision positions are around 15%. Considering the research area with a shaft diameter of 2 m and a height of 10 m, these errors can be considered negligible.
An analysis of Figure 6 further indicates that the maximum ore indentation depths for operating conditions 3 and 4 are relatively deep and close, while the maximum ore indentation depth is smallest for operating condition 1. Through field investigations, the damage conditions of the shaft walls of the four ore passes in the mine were understood. The shaft wall of No. 1 ore pass (operating condition 4) experienced extensive collapse, and the ore pass is now out of use. The shaft wall of No. 3 ore pass (operating condition 3) suffered severe wall damage, resulting in the blockage of the ore bin opening, and this ore pass has been abandoned. The shaft wall of No. 2 ore pass (operating condition 2) has a moderate level of shaft wall damage, with occasional occurrences of large ore blockages at the ore bin opening. No. 2 ore pass can continue operating after the rebar bound charge blasting vibration method is used to dredge the blocked position. Residual fragmented ore rocks are visible at the bottom of No. 2 ore pass (Figure 7). The shaft wall of No. 9 ore pass (operating condition 1) has minimal wall damage, with virtually no instances of wall collapse or ore blockages, and this ore pass is in normal operation. This indicates a complete alignment between the computed results obtained using the theoretical model and numerical simulation and the actual engineering situations. The three methods consistently demonstrate a descending order of shaft wall damage severity, ranked in the order of operating conditions 4, 3, 2, and 1, thereby validating the rationality of the theoretical model.
For No. 1 ore pass, the distance between the ore discharge port and the initial collision position was measured on site using a laser rangefinder, yielding a distance of 8.62 m. Upon calculation, it is determined that the vertical displacement of the ore leaving the inclined chute to reach the initial collision point is 2.39 m, which closely aligns with the numerical simulation result (y = 2.28 m) and the theoretical model calculation result (y = 2.12 m) shown in Figure 6. Figure 8 presents the initial collision position in No. 1 ore pass.
Therefore, this paper utilizes the theoretical model, numerical simulation, and actual engineering situation for mutual validation. It validates the rationality of the proposed shaft wall damage model for high-depth inclined ore passes from two perspectives: the initial collision position and the damage conditions of the shaft wall.

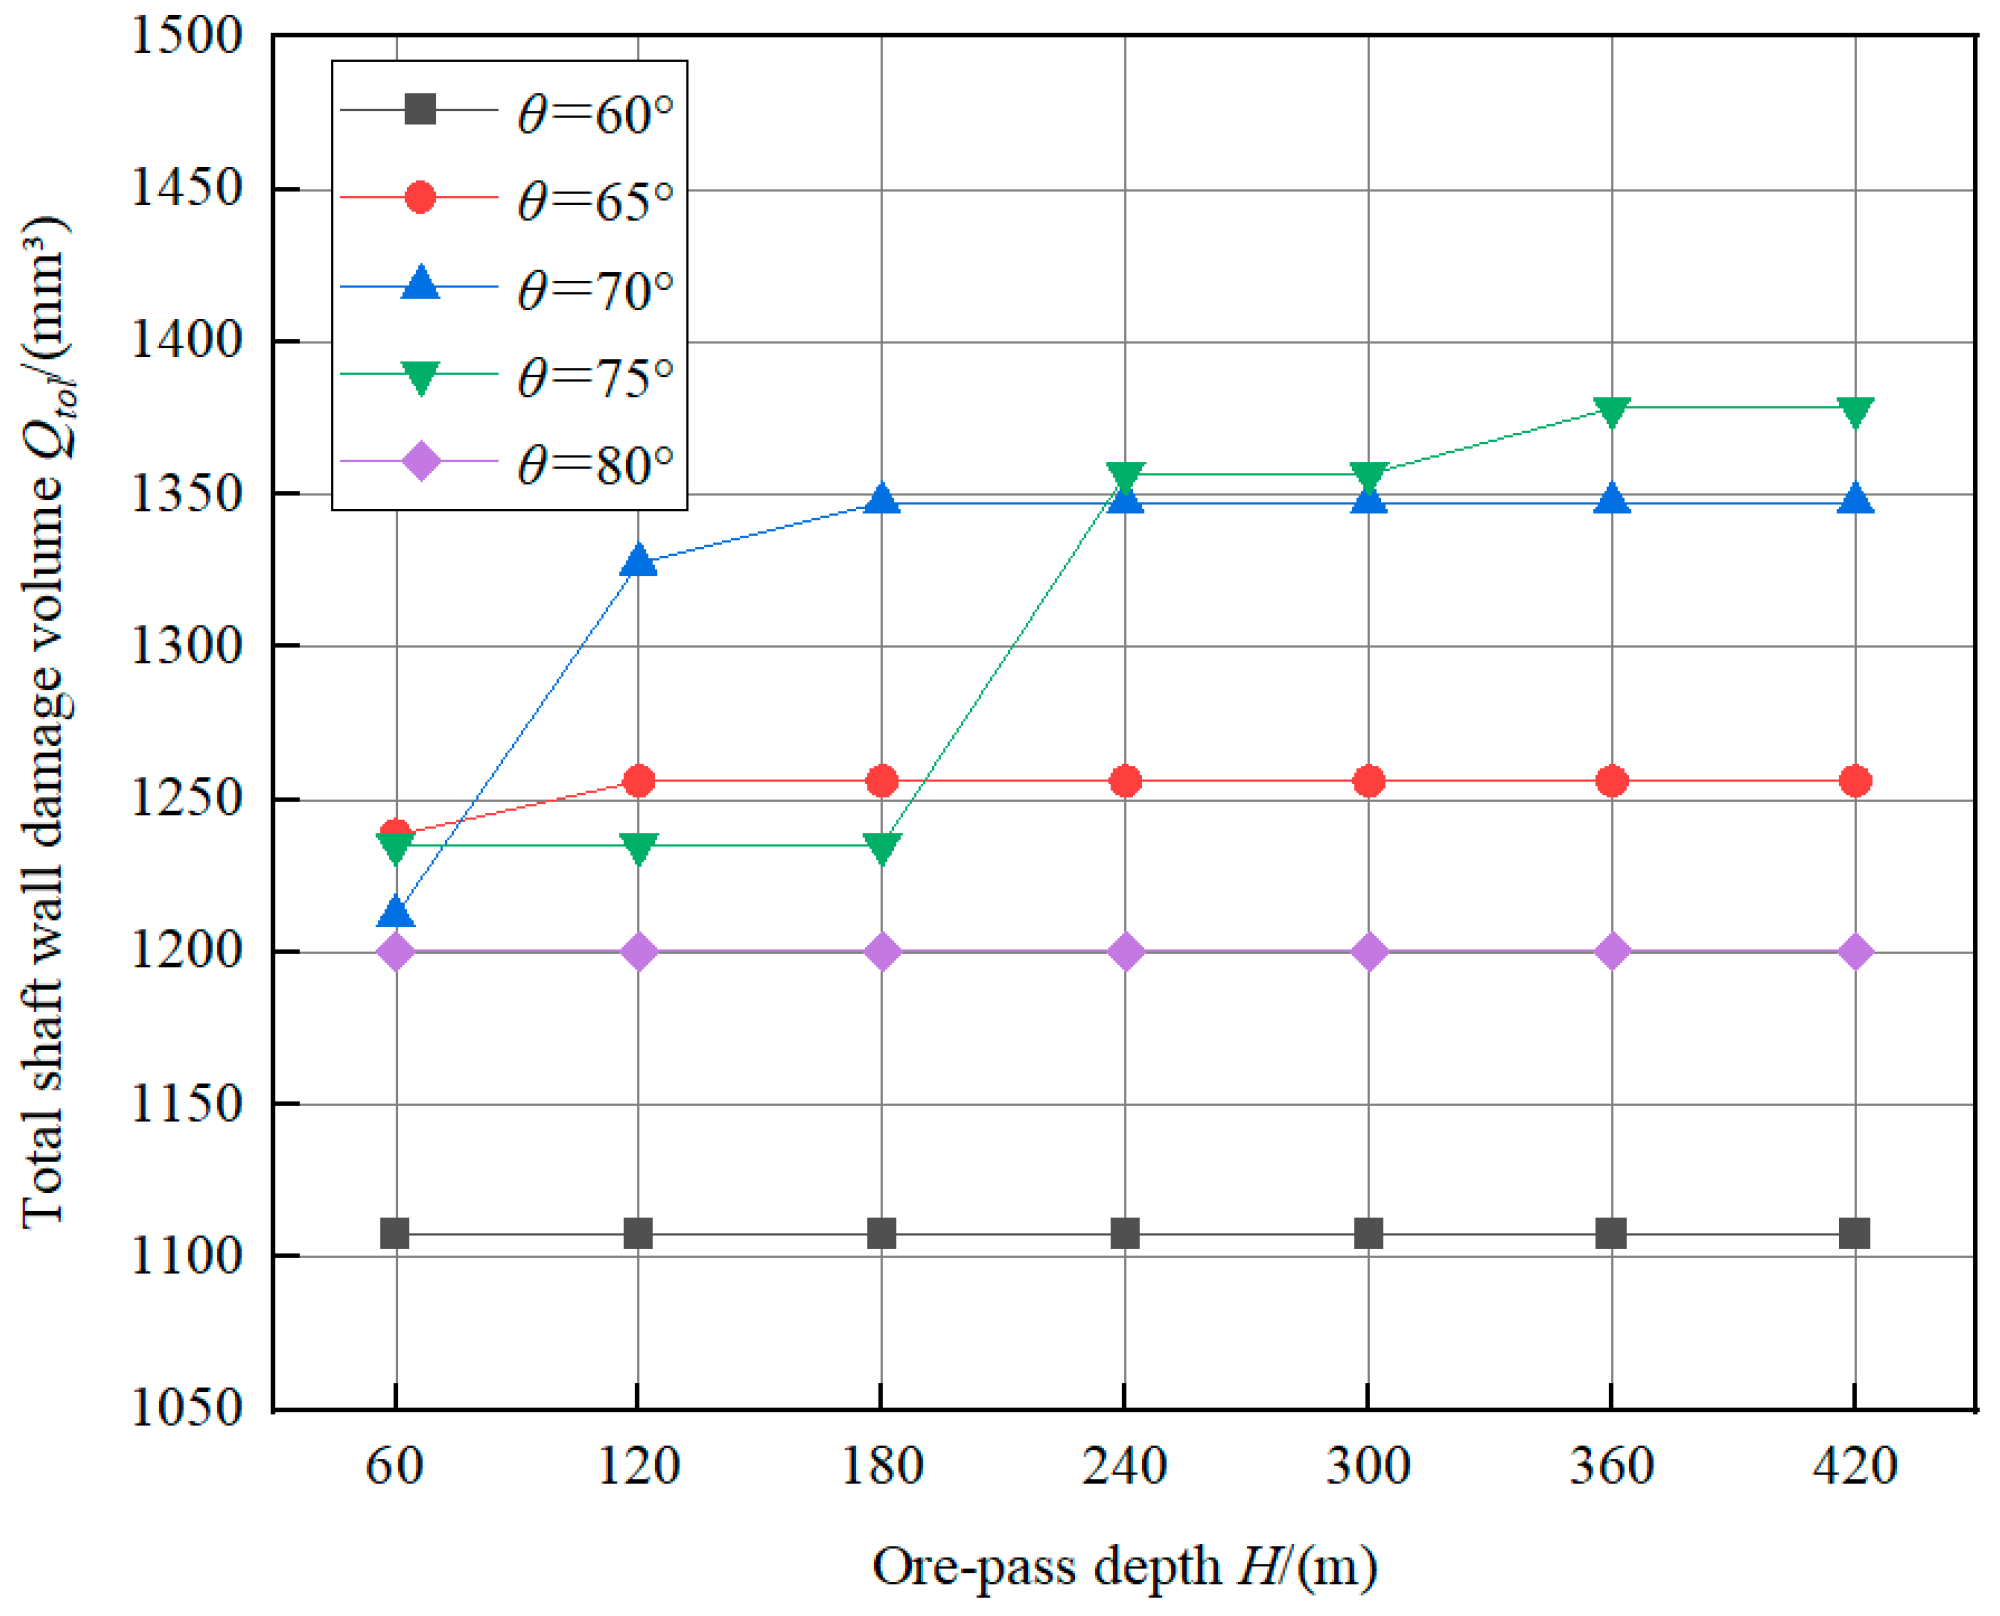
3.2. Influence of Ore-Pass Depth H

To investigate the influence of ore-pass depth on the total shaft wall damage volume, the ore block size (P = 400 mm), the shaft diameter (D = 2 m), and the inclined angle of the chute (α = 60°) were kept constant, and the ore-pass depth H was set between 60 m and 420 m. The ore passes were divided into five groups according to the ore-pass dip angle θ (60°, 65°, 70°, 75° and 80°). Figure 9 presents the variation in total shaft wall damage volume Qtol determined from Equations (18) and (19) with respect to the ore-pass depth H across ore-pass dip angles.
As shown in Figure 9, the ore-pass dip angle θ has a significant influence on the Qtol-H relation curve shape. When θ = 60° and θ = 80°, Qtol remains unchanged with an increase in H. When θ = 65°, θ = 70°, and θ = 75°, Qtol increases at different degrees first and then stabilizes with H.
According to Equation (19), it is discernible that the collision frequency between the ore and the shaft wall increases with an increase in H, resulting in an increase in Qtol. For ore passes with θ = 60° and θ = 80°, as H varies within the range from 60 m to 420 m, the collision frequency remains constant for 3 times and 1 time, respectively, and Qtol remains unchanged. When H changes from 60 m to 120 m, the collision frequency between the ore and the shaft wall with the ore passes of θ = 65° and θ = 70° increases from 1 time to 2 times. When H changes from 120 m to 180 m, the collision frequency with the ore pass of θ = 70° increases from 2 times to 3 times. Similarly, as H varies from 180 m to 360 m, the collision frequency with the ore pass of θ = 75° gradually increases from 1 time to 3 times. Therefore, as H increases, Qtol exhibits the trend presented in Figure 9, corresponding to the increase in collision frequency.
In summary, it is advisable for mines to judiciously determine the ore-pass depth H based on the ore-pass dip angle θ, with the aim of reducing the collision frequency between ores and shaft walls, thereby preventing damage to shaft walls due to multiple collisions.

3.3. Influence of Ore-Pass Dip Angle θ

To reveal the influence of the ore-pass dip angle on the total shaft wall damage volume, the ore block size P, the shaft diameter D, and the inclined angle of the chute α were fixed at 400 mm, 2 m, and 60°, respectively, and the ore-pass dip angle θ was set between 50° and 89°. The ore passes were divided into four groups according to their depth H (60, 120, 180, and 240 m). Figure 10 presents the variation in total shaft wall damage volume Qtol determined from Equations (18) and (19) with respect to the ore-pass dip angle θ across ore-pass depths.
As shown in Figure 10, the ore-pass depth H has a certain influence on the Qtol-θ relation curve shape. Qtol increases first and then decreases with an increase in θ, and the maximum point of the curve exists in the range of θ from 60° to 80°. The three curves for H = 120 m, H = 180 m, and H = 240 m have a maximum point in this range, and the curve for H = 60 m has two maximum points and one minimum point in this range. In addition, the greater the ore-pass depth H, the greater the maximum value of the total shaft wall damage volume Qtol.
Using Equations (21) and (22), it can be inferred that as θ increases, the normal velocity of ore impacting the shaft wall decreases, while the tangential velocity increases. Additionally, based on Equations (12) and (16), as the normal and tangential velocities change, the ore indentation depth δ decreases, and the wear length l increases. In the first half of the curve, the rate of increase in l is greater than the rate of decrease in δ. Conversely, the trend of the curve is reversed in the latter half. Therefore, Qtol coupling with δ and l manifests a tendency of initial increase followed by subsequent decrease.
Furthermore, from Equations (19) and (20), it is evident that H influences the extremum of the Qtol curve by affecting the collision frequency between the ore and the shaft wall. For the ore passes with H = 120 m, H = 180 m, and H = 240 m, the extremum points of the Qtol curve correspond to θ = 70° and θ = 75°, respectively. In the case of the ore pass with H = 60 m, as θ changes from 65° to 70°, Qtol decreases due to a reduction in collision frequency. Subsequently, when θ changes from 70° to 75°, Qtol increases due to an increase in θ.
Therefore, the approach involves either minimizing the ore-pass dip angle θ as much as possible to reduce the wear length l and, consequently, decrease the damage to the shaft wall, or approaching the ore-pass dip angle θ of 90° to reduce the ore indentation depth δ, thereby diminishing the damage to the shaft wall.

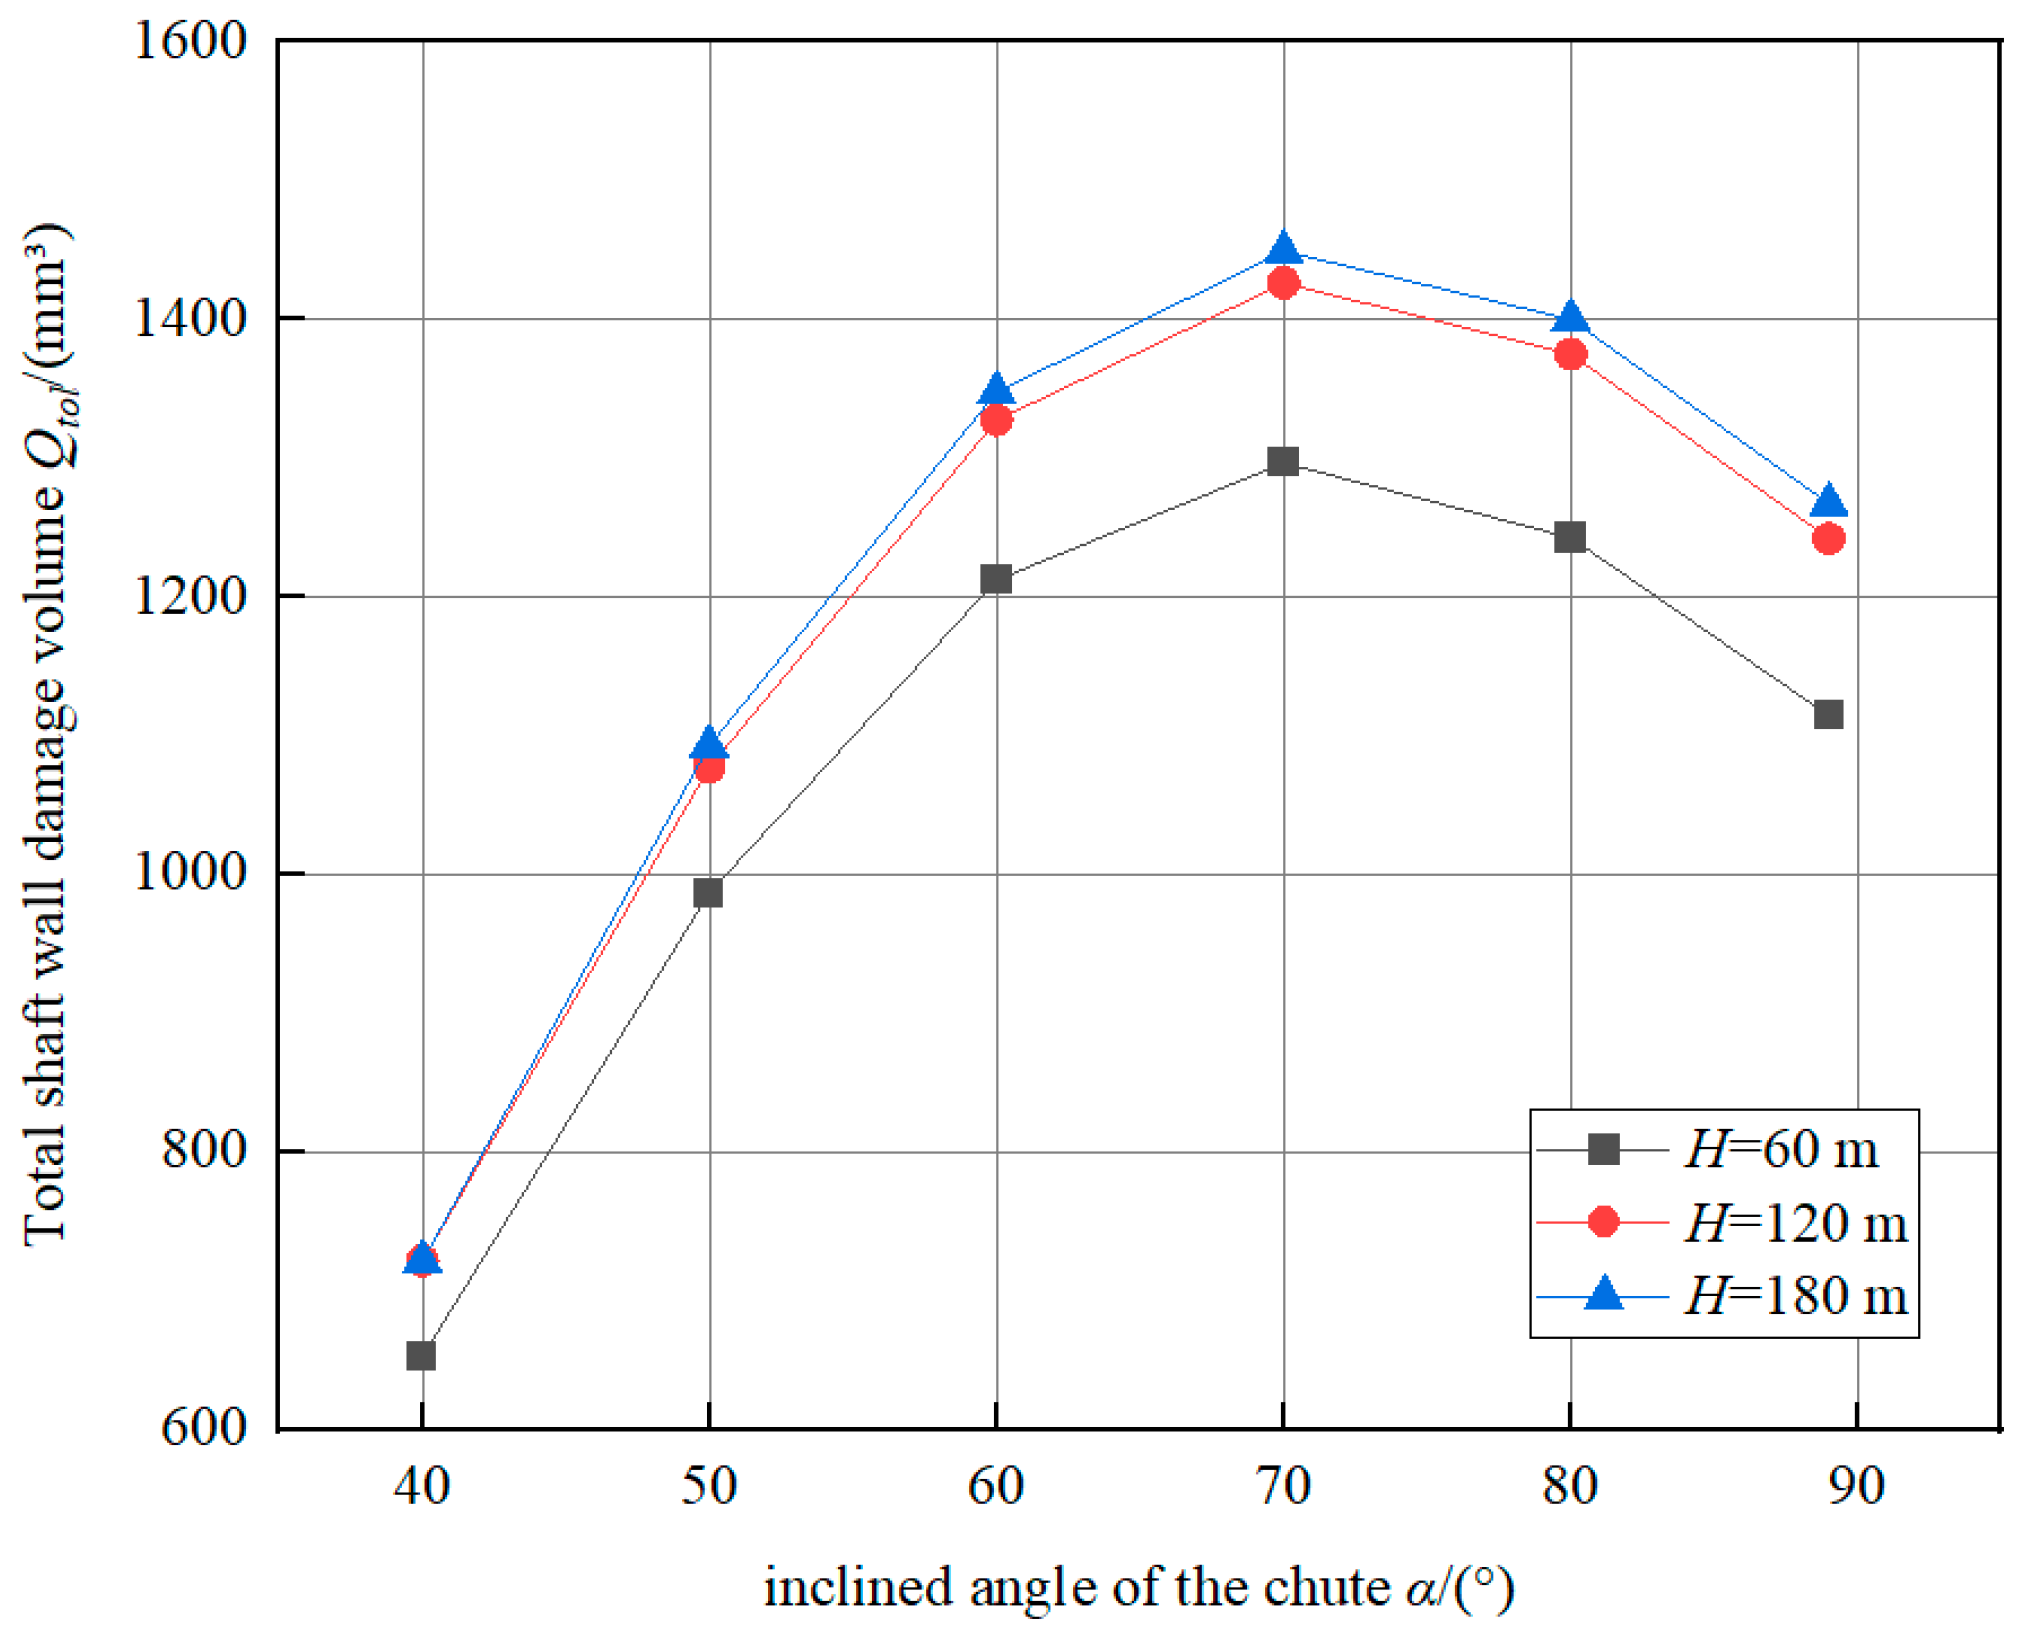
3.4. Influence of Inclined Angle of the Chute α

To study the influence of the inclined angle of the chute on the shaft wall damage volume, the ore-pass dip angle θ, the shaft diameter D, and the ore block size P were fixed at 70°, 2 m, and 400 mm, respectively, and the inclined angle of the chute α was set between 40° and 90°. The chutes of the ore passes were divided into three groups according to their ore-pass depth (60, 120, and 180 m). Figure 11 presents the variation in total shaft wall damage volume determined from Equations (18) and (19) with respect to the inclined angle of the chute α across ore-pass depths.
It can be seen from Figure 11 that the ore-pass depth H plays an important role in the Qtol-α relation curve shape. As H increases, the collision frequency between the ore and the shaft wall increases, leading to a corresponding increase in Qtol. It can also be observed from Figure 11 that Qtol increases first and then decreases with α. When α < 70°, Qtol increases with α, and the increasing rate of the Qtol-α curve decreases. When α > 70°, Qtol decreases with α, and the growth rate of this curve increases gradually. The maximum value of Qtol appears when α = 70°.
The reason is that α determines the velocity direction of the ore hitting the shaft wall. Based on Equations (21) and (22), it is discernible that with an increase in α, the normal velocity of the ore impacting the shaft wall decreases, while the tangential velocity increases. Moreover, as derived from Equations (12) and (16), variations in the normal and tangential velocities lead to a decrease in the ore indentation depth δ and an increase in the wear length l. Hence, similar to the influence of θ on Qtol, α influences Qtol by affecting δ and l, resulting in an initial increase followed by a subsequent decrease in the Qtol-α curve trend.
Therefore, the aim of reducing damage to the shaft wall can be achieved, on the one hand, by minimizing the inclined angle of the chute to be significantly below 70° and, on the other hand, by employing an inclined angle of the chute close to 90°.

3.5. Influence of Shaft Diameter D

The influence of the shaft diameter on the total shaft wall damage volume was evaluated via fixing the inclined angle of the chute (α = 60°), the ore-pass depth (H = 120 m), and the ore block size (P = 400 mm). Moreover, the shaft diameter D was set within 1.0–4.0 m, and the ore passes were divided into three groups according to their ore-pass dip angle (60°, 65°, and 70°). Figure 12 presents the variation in total shaft wall damage volume determined from Equations (18) and (19) with respect to the shaft diameter D across ore-pass dip angles.
It can be seen from Figure 12 that the ore-pass dip angle θ has an obvious influence on the Qtol-D relation curve shape. Qtol increases with an increase in D, and the growth rate of Qtol is relatively stable. For the curve with θ = 70°, when D > 3.5 m, Qtol decreases slowly with D.
According to Equations (18)–(22), it is evident that D can also influence Qtol by impacting the number of collisions between the ore and the shaft wall. When D ranges from 1.0 to 3.5 m, for the ore passes with θ = 60°, θ = 65°, and θ = 70°, the number of collisions between the ore and the shaft wall remains constant at three, thereby maintaining a relatively stable rate of increase in Qtol. However, for the ore pass with θ = 70°, when D changes from 3.5 m to 4.0 m, the ore falls into the ore bin after only one collision with the shaft wall, resulting in a decrease in Qtol.
Therefore, in practical engineering applications, it is advisable to consider a reduction in the shaft diameter as a means to reduce the damage to the shaft wall.

3.6. Influence of Ore Block Size P

The impact of the ore block size on the shaft wall damage volume was investigated via fixing the inclined angle of the chute (α = 60°), the ore-pass dip angle (θ = 70°), and the shaft diameter (D = 2 m). In addition, the ore block size P was set within 100–600 mm, and the ore passes were divided into three groups according to their ore-pass depth (60, 120 and 180 m). Figure 13 shows the variation in the shaft wall damage volume determined via Equations (18) and (19) with respect to the ore block size P across ore-pass depths.
As shown in Figure 13, the ore-pass depth H has a slight influence on the Qtol-P relation curve shape: the greater the ore-pass depth H, the greater the total shaft wall damage volume Qtol. It can also be observed from Figure 13 that Qtol and P are positively correlated, and Qtol increases with an increase in P. Furthermore, the growth rate of the Qtol-P relation curve increases continuously, which indicates that P greatly affects Qtol.
Based on Equations (12)–(16), it is evident that as P increases, the ore indentation depth δ and the wear length l also increase. Hence, Qtol coupling with δ and l exhibits an exponential growth trend.
Therefore, damage to the shaft wall can be reduced via decreasing the ore block size. Mine managers can install grates at the ore discharge port to strictly control the ore block size, thereby preventing collapses in the shaft wall caused by the impact wear of large ore blocks.

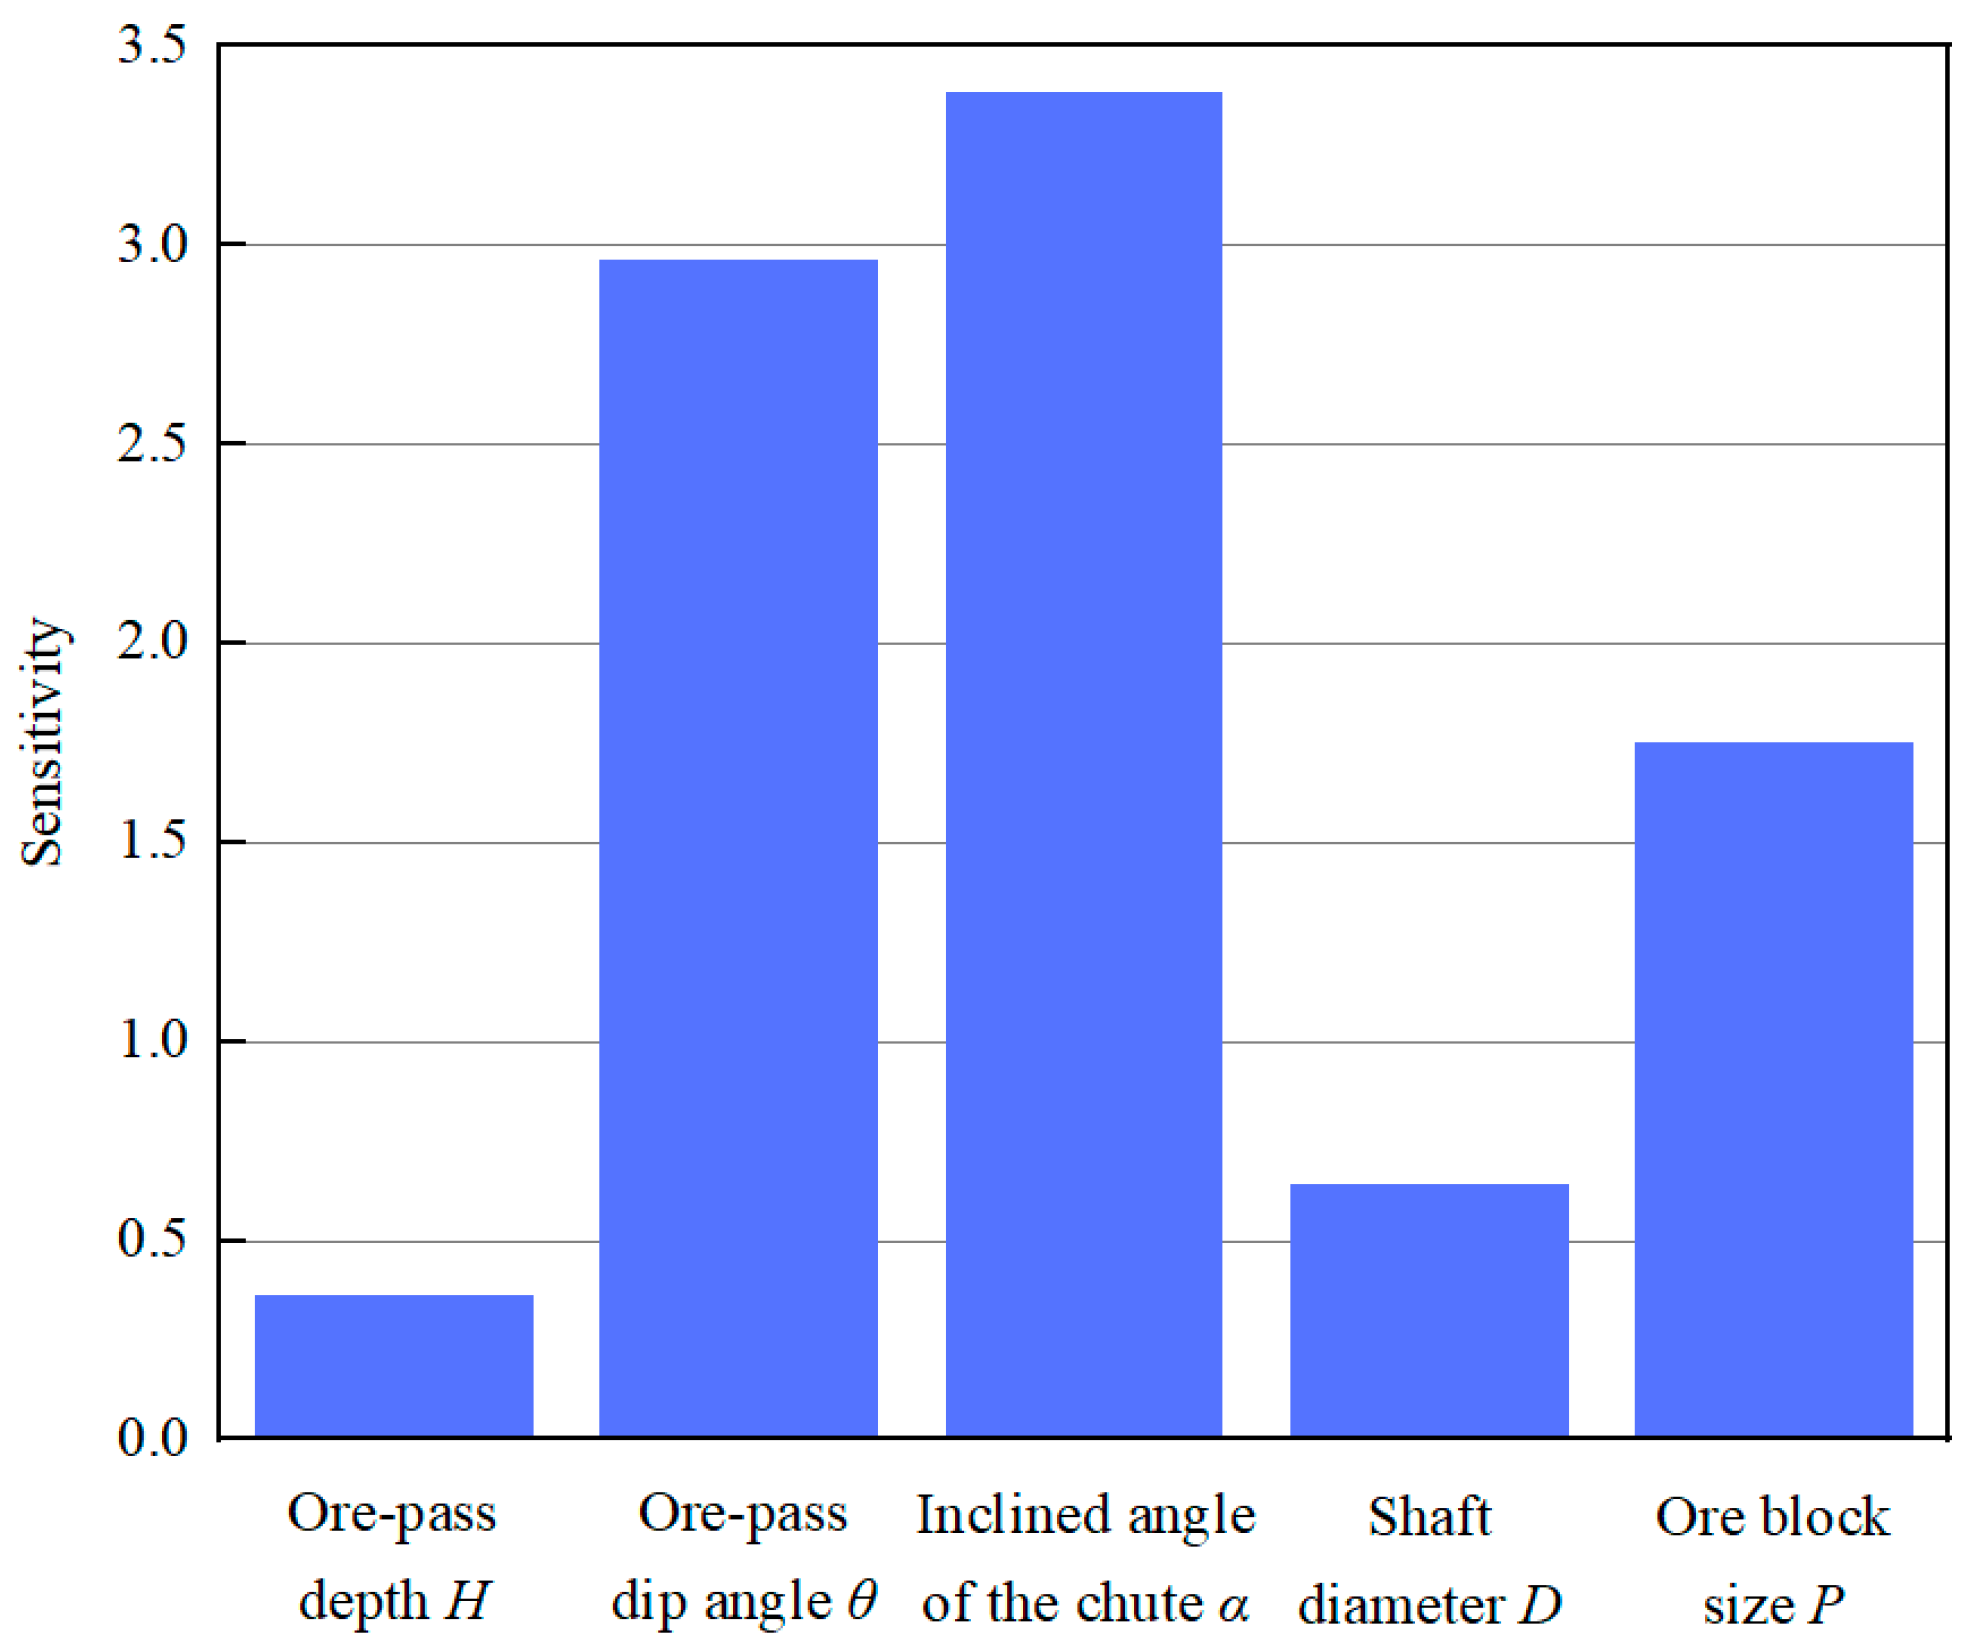
3.7. Sensitivity Analysis of Influencing Factors

Sensitivity analysis is a popular feature selection approach employed to identify the important features in a dataset [37]. Scholars have gained substantial insights using different approaches to sensitivity analysis. Asheghi et al. [38] used diverse sensitivity analysis (SA) methods to prioritize the employed inputs in the optimum predictive models subjected to an artificial neural network (ANN). Ngaradoumbe et al. [39] used sensitivity analysis based on automatic differentiation (AD) to accurately determine the parameters of mathematical models and numerical models. Yang et al. [40] proposed a fast sensitivity analysis algorithm based on the reduced finite element model to avoid the complex calculation required for solving eigenvalues and eigenvectors using the complete model.
According to the sensitivity calculation method described in the literature [41] referenced in this paper, the sensitivity of the total shaft wall damage volume Qtol to five influencing factors, including the ore-pass depth H, the ore-pass dip angle θ, the inclined angle of the chute α, the shaft diameter D, and the ore block size P, can be determined as follows: fH = 0.36, fθ = 2.96, fα = 3.38, fD = 0.64, and fP = 1.75, as presented in Figure 14.
As shown in Figure 14, it can be observed that the sensitivity of each of the influencing factors to Qtol follows the order of fα > fθ > fP > fD > fH. The sensitivity to the ore block size is slightly less than the sensitivity to the inclined angle of the chute and the ore-pass dip angle, while the sensitivity to the ore-pass depth and the shaft diameter is relatively small. Therefore, in mining designs, the primary consideration should be given to the impact of the inclined angle of the chute and the ore-pass dip angle on damage to the shaft wall. Subsequently, attention should be directed toward the influence of the ore block size on shaft wall damage and destruction.

4. Discussion

The ore is regarded as a sphere of uniform mass for studying its impact on the wall surface. Although this is significant in preventing underground engineering disasters [42,43,44], it overlooks the damage caused by irregularly shaped ore blocks to the shaft wall in actual engineering applications. The contact theory between a rigid conical indenter and an elastic half-space or PFC (Particle Flow Code) can be used to simulate the impact damage from an irregularly shaped ore to the shaft wall [22,45]. Moreover, it is assumed that the shaft wall rock mass is isotropic and of uniform lithology, and the impact of the anisotropy, microstructure, and rock structure interaction of deep rock mass on the shaft wall damage is ignored [46,47,48]. In subsequent research, the influence of lithological conditions and rock joint fracture on the damage to the shaft wall can be considered.
Furthermore, in numerical simulations, differences in modeling with different assumptions can lead to varying results. In future studies, the consideration capacity design can enable a clear definition of the strength hierarchies within the system and enhance the correlation between local ductility demands and overall ductility demands, thereby greatly reducing the uncertainty in numerical modeling [49,50,51]. In addition, the setting of mesh and boundary conditions, component interactions, and nonlinear behaviors should be thoroughly discussed [40,52,53,54]. The reliability of numerical models can be improved via probabilistic methods (i.e., Monte Carlo simulations), capacity design, and robust design [55,56]. Methods such as the quad-precision number type, reduced models with fewer degrees of freedoms, discretization, and model order reduction can be employed to minimize the truncation and rounds off errors caused by stored data crossing permissible values, and enhance the scientificity of the shaft wall damage model [57,58,59].
In the current study, the shaft wall damage from an individual ore pass is investigated to provide theoretical references for optimizing the structural parameters of ore passes. In future studies, the shaft wall damage during simultaneous ore drawing from multiple ore passes can be analyzed, thereby optimizing the structure and layout of the entire ore-pass system [60].

5. Conclusions

Aiming to assess the shaft wall damage caused by ore impact, a theoretical model of shaft wall damage for high-depth inclined ore passes is constructed based on field engineering investigations, and the mathematical expression of the total shaft damage volume Qtol is derived using the contact mechanics theory. The influences of the ore-pass depth H, ore-pass dip angle θ, inclined angle of the chute α, shaft diameter D, and ore block size P on Qtol are discussed, and the mechanism of shaft wall damage is revealed. The rationality of the theoretical model is verified by means of numerical simulation and an actual engineering case.
Under the impact wear behavior of an ore, the ore block size and the structural parameters of high-depth inclined ore passes have different effects on the damage to the shaft wall. With increases in θ and α, Qtol generally increases first and then decreases. Qtol increases exponentially with P and increases steadily with D. Furthermore, H affects Qtol by influencing the collisions frequency between the ore and the shaft wall. As H increases, the collision frequency increases, leading to a larger Qtol.
Additionally, based on the sensitivity analysis results of the influencing factors, the influence of the ore-pass dip angle θ and the inclined angle of the chute α on the shaft wall damage from ore passes should be mainly considered in the mining design of deep mines. Shaft wall damage can be reduced by reducing θ and α or increasing θ and α until close to 90°. Subsequently, the mine managers should pay close attention to the damage caused by the ore block size P to the shaft wall and strictly control the ore block size to prevent shaft wall damage under the impact wear of large ore blocks.

Author Contributions

Conceptualization, L.J. and H.J.; methodology, L.J. and H.J.; software, L.J. and H.J.; validation, L.J., H.J. and L.X.; formal analysis, L.J., H.J. and L.X.; investigation, L.J., H.J. and L.X.; resources, L.J.; writing—original draft preparation, L.J. and H.J.; writing—review and editing, L.J., H.J. and L.X. All authors have read and agreed to the published version of the manuscript.

Funding

This research was funded by the National Key Research and Development Program of China, grant number 2022YFC2903802.

Institutional Review Board Statement

Not applicable.

Informed Consent Statement

Not applicable.

Data Availability Statement

The data presented in this study are available on request from the corresponding author. The data are not publicly available due to privacy.

Acknowledgments

Thanks for the great efforts of editors and reviewers.

Conflicts of Interest

The authors declare no conflict of interest.

References

  1. Jiang, L.C.; Jiao, H.Z.; Wang, Y.D.; Wang, G.G. Comprehensive safety factor of roof in goaf underdeep high stress. J. Cent. South Univ. 2021, 28, 595–603. [Google Scholar] [CrossRef]
  2. Li, X.B.; Li, D.Y.; Guo, L.; Ye, Z.Y. Study on mechanical response of highly-stressed pillars in deep mining under dynamic disturbance. Chin. J. Rock Mech. Eng. 2007, 5, 922–928. Available online: http://www.cqvip.com/qk/96026x/20075/25633817.html (accessed on 21 November 2023).
  3. Jiang, L.C.; Zhang, Y.Q. Calculation model of depressurization coefficient for concrete helical pipeline transportation in deep shaft. J. Xi’an Univ. Sci. Technol. 2020, 40, 953–959. [Google Scholar] [CrossRef]
  4. Guo, F.; Zhang, N.; Xie, Z.Z.; Han, C.L.; Zhang, C.H.; Yuan, Y.X.; He, Z.; Liu, J.H. A Three-Dimensional Supporting Technology, Optimization and Inspiration from a Deep Coal Mine in China. Rock Mech. Rock Eng. 2023, 2023, 1–23. [Google Scholar] [CrossRef]
  5. Xie, J.L.; Ning, S.; Zhu, W.B.; Wang, X.Z.; Hou, T. Influence of Key Strata on the Evolution Law of Mining-Induced Stress in the Working Face under Deep and Large-Scale Mining. Minerals 2023, 13, 983. [Google Scholar] [CrossRef]
  6. Li, X.B.; Yao, J.R.; Gong, F.Q. Dynamic problems in deep exploitation of hard rock metal mines. Chin. J. Nonferrous Met. 2011, 21, 2551–2563. [Google Scholar] [CrossRef]
  7. Lu, Z.X.; Ma, C.; Cao, P.; Ma, Q.Y. Study Status and Direction of Orepass Existing Problems in Metal Mine. Met. Mine 2019, 2019, 1–9. [Google Scholar] [CrossRef]
  8. Zhao, Y.; Ye, H.W.; Lei, T.; Wang, C.; Wang, Q.Z.; Long, M. Theoretical study of damage characteristics on ore pass wall based on the erosion-wearing theory. Chin. J. Rock Mech. Eng. 2017, 36, 4002–4007. [Google Scholar] [CrossRef]
  9. Yin, Y.; Lu, Z.X.; Ma, C. Mechanism of Deformation and Failure on Orepass Wall under Impact and Wear. Met. Mine 2020, 2020, 31–36. [Google Scholar] [CrossRef]
  10. Yin, Y.; Lu, Z.X.; Dong, H.W. Analysis and Verification of 3D Motion Track of Ore or Rock in Main Orepass. Met. Mine 2019, 2019, 49–53. [Google Scholar] [CrossRef]
  11. Deng, Z.; Lu, Z.X.; Wang, S.Y.; Ma, Q.Y. Influence and mechanism of upper unloading impact on the pressure distribution of the sidewall in the storage section of the orepass. Nonferrous Met. Sci. Eng. 2023, 14, 257–263. [Google Scholar] [CrossRef]
  12. Liu, Y.Z.; Zhang, B.T.; Ye, Y.C.; Zou, X.T.; Zhang, Q.; Chen, X.Q.; Pan, S.H. Similarity testing study on characteristics of ore motion and wall damage in mine shaft. J. Min. Saf. Eng. 2018, 35, 545–552. [Google Scholar] [CrossRef]
  13. Liu, Y.Z.; Wang, Q.F.; Ye, Y.C.; Zhao, W.; Shi, Z.J.; Tu, F.Q. Ore-pass panoramic scanning imaging device and its experiment to monitor ore-pass wall. Rock Soil Mech. 2013, 34, 3329–3334. [Google Scholar] [CrossRef]
  14. Ren, Z.G.; Ma, H.T.; Wang, S.; Zeng, M.R.; Jin, L.Z. Experimental study on damage laws of ore pass based on similarity simulation. J. Saf. Sci. Technol. 2016, 12, 98–102. [Google Scholar] [CrossRef]
  15. Esmaieli, K.; Hadjigeorgiou, J.; Grenon, M. Stability Analysis of the 19A Ore Pass at Brunswick Mine Using a Two-Stage Numerical Modeling Approach. Rock Mech. Rock Eng. 2013, 46, 1323–1338. [Google Scholar] [CrossRef]
  16. Esmaieli, K.; Hadjigeorgiou, J. Selecting ore pass-finger raise configurations in underground mines. Rock Mech. Rock Eng. 2011, 44, 291–303. [Google Scholar] [CrossRef]
  17. Campbell, C.S. Granular material flows–an overview. Powder Technol. 2006, 162, 208–229. [Google Scholar] [CrossRef]
  18. Kulshrestha, A.; Chang, L.; Stein, A. Sinkhole scanner: A new method to detect sinkhole-related spatio-temporal patterns in InSAR deformation time series. Remote Sens. 2021, 13, 2906. [Google Scholar] [CrossRef]
  19. Remennikov, A.M.; Mutton, V.; Nimbalkar, S. Experimental and numerical investigation of high-yield grout ore pass plugs to resist impact loads. Int. J. Rock Mech. Min. Sci. 2014, 70, 1–15. [Google Scholar] [CrossRef]
  20. Ma, J.Y.; Wei, D.E.; Zhang, Q.S. Experimental study on the probabilities of kinked arches and kinked arch locations in ore passes under the influences of multiple factors. Sci. Rep. 2023, 13, 15364. [Google Scholar] [CrossRef]
  21. Vo, T.; Yang, H.; Russell, A.R. Cohesion and suction induced hang-up in ore passes. Int. J. Rock Mech. Min. Sci. 2016, 87, 113–128. [Google Scholar] [CrossRef]
  22. Yang, Y.J.; Deng, Z.; Lu, Z.X. Effects of ore-rock falling velocity on the stored materials and the force on the shaft wall in a vertical orepass. Mech. Adv. Mater. Struct. 2022, 30, 3455–3462. [Google Scholar] [CrossRef]
  23. Xiong, Y.; Yang, S.L.; Kong, D.Z.; Song, G.F.; Ma, Z.Q.; Zuo, Y.J. Analysis on early warning of coal sample failure based on crack development law and strain evolution characteristics. Eng. Fail. Anal. 2023, 148, 107170. [Google Scholar] [CrossRef]
  24. Hadjigeorgiou, J.; Lessard, J.F. Numerical investigations of ore pass hang-up phenomena. Int. J. Rock Mech. Min. Sci. 2007, 44, 820–834. [Google Scholar] [CrossRef]
  25. Hou, T.X.; Yang, X.G.; Huang, C.; Huang, K.X.; Zhou, J.W. A calculation method based on impulse theorem to determine impact force of rockfall on structure. Chin. J. Rock Mech. Eng. 2015, 34, 3116–3122. [Google Scholar] [CrossRef]
  26. Braccesi, C.; Landi, L. A general elastic–plastic approach to impact analisys for stress state limit evaluation in ball screw bearings return system. Int. J. Impact Eng. 2007, 34, 1272–1285. [Google Scholar] [CrossRef]
  27. Jackson, R.L.; Green, I.; Marghitu, D.B. Predicting the coefficient of restitution of impacting elastic-perfectly plastic spheres. Nonlinear Dyn. 2010, 60, 217–229. [Google Scholar] [CrossRef]
  28. Green, I. The prediction of the coefficient of restitution between impacting spheres and finite thickness plates undergoing elastoplastic deformations and wave propagation. Nonlinear Dyn. 2022, 109, 2443–2458. [Google Scholar] [CrossRef]
  29. Zhang, G.C.; Tang, H.M.; Xiang, X.; Karakus, M.; Wu, J.P. Theoretical study of rockfall impacts based on logistic curves. Int. J. Rock Mech. Min. Sci. 2015, 78, 133–143. [Google Scholar] [CrossRef]
  30. Thornton, C. Coefficient of Restitution for Collinear Collisions of Elastic-Perfectly Plastic Spheres. J. Appl. Mech. 1997, 64, 383. [Google Scholar] [CrossRef]
  31. Benabdallah, S.M.H.; Chalifoux, J.P. Ploughing of soft asperities by a hemispherical slider. Tribol. Int. 1989, 22, 383–388. [Google Scholar] [CrossRef]
  32. Cui, G.S.; Bao, Z.W.; Li, Q. The origin of hydrothermal dolomite in the Huize giant Pb-Zn ore-field in the Yunnan province and its geological implications. Geotecton. et Metallog. 2023, 47, 361–375. [Google Scholar] [CrossRef]
  33. Zhang, Y.; Han, R.S.; Hu, T.C.; Wei, P.T.; Wang, L. The tectonics-fluids-mineralization coupling processes in the Huize ultra-large Ge-rich Pb-Zn deposit. Geotecton. et Metallog. 2023, 47, 969–983. [Google Scholar] [CrossRef]
  34. Vergara, M.R.; Arismendy, A.; Libreros, A.; Brzovic, A. Numerical investigation into strength and deformability of veined rock mass. Int. J. Rock Mech. Min. Sci. 2020, 135, 104510. [Google Scholar] [CrossRef]
  35. Yang, J.P.; Chen, W.Z.; Yang, D.S.; Yuan, J.Q. Numerical determination of strength and deformability of fractured rock mass by FEM modeling. Comput. Geotech. 2015, 4, 20–31. [Google Scholar] [CrossRef]
  36. Giner, E.; Sukumar, N.; Tarancón, J.E.; Fuenmayor, F.J. An Abaqus implementation of the extended finite element method. Eng. Fract. Mech. 2009, 76, 347–368. [Google Scholar] [CrossRef]
  37. Naik, D.L.; Kiran, R. A novel sensitivity-based method for feature selection. J. Big Data 2021, 8, 128. [Google Scholar] [CrossRef]
  38. Asheghi, R.; Hosseini, S.A.; Saneie, M.; Shahri, A.A. Updating the neural network sediment load models using different sensitivity analysis methods: A regional application. J. Hydroinformatics 2020, 22, 562–577. [Google Scholar] [CrossRef]
  39. Ngaradoumbe Nanhorngué, R.; Pesavento, F.; Schrefler, B.A. Sensitivity analysis applied to finite element method model for coupled multiphase system. Int. J. Numer. Anal. Methods Geomech. 2013, 37, 2205–2222. [Google Scholar] [CrossRef]
  40. Yang, Q.; Peng, X. Sensitivity analysis using a reduced finite element model for structural damage identification. Materials 2021, 14, 5514. [Google Scholar] [CrossRef]
  41. Li, H.; Zha, J.; Guo, G. A new dynamic prediction method for surface subsidence based on numerical model parameter sensitivity. J. Clean. Prod. 2019, 233, 1418–1424. [Google Scholar] [CrossRef]
  42. Song, W.D.; Wang, Y.H.; Wang, X.; Du, J.H. Theoretical analysis and test of impact load due to ore dumping in chute. Rock Soil Mech. 2011, 32, 326–332. [Google Scholar] [CrossRef]
  43. Mei, X.F.; Hu, X.W.; Luo, G.; Du, Y.J.; Ma, H.S.; Wu, J.L. A study on the coefficient of restitution and peak impact of rockfall based on the elastic-plastic theory. J. Vib. Shock 2019, 38, 14–20. [Google Scholar] [CrossRef]
  44. Chen, T.J.; Xiang, X.; Zhang, G.C. Characteristic parameters theoretical analysis of rockfall impact on ground based on linear viscoelastic contact theory. Rock Soil Mech. 2022, 43, 2410–2420. [Google Scholar] [CrossRef]
  45. Chen, Q.F.; Liu, E.J.; Qin, S.K. Quantitative study on evolution characteristics of force chain of granular materials in ore drawing from multiple funnels process. J. Cent. South Univ. (Sci. Technol.) 2021, 52, 4046–4054. [Google Scholar] [CrossRef]
  46. Schormair, N.; Thuro, K.; Plinninger, R. The Influence of Anisotropy on Hard Rock Drilling and Cutting; The Geological Society of London: London, UK; IAEG: San Francisco, CA, USA, 2006; Volume 491, pp. 1–11. Available online: http://www.plinninger.eu/images/pdfs/2006_iaeg_anisotropy.pdf (accessed on 20 November 2023).
  47. Bołoz, Ł. Interpretation of the results of mechanical rock properties testing with respect to mining methods. Acta Montan. Slovaca 2020, 25, 1. Available online: https://actamont.tuke.sk/pdf/2020/n1/8boloz.pdf (accessed on 20 November 2023).
  48. Małkowski, P. The impact of the physical model selection and rock mass stratification on the results of numerical calculations of the state of rock mass deformation around the roadways. Tunn. Undergr. Space Technol. 2015, 50, 365–375. [Google Scholar] [CrossRef]
  49. Bachmann, H.; Linde, P.; Wenk, T. Capacity design and nonlinear dynamic analysis of earthquake-resistant structures. IBK Sonderdr. 1994, 1994, 2. [Google Scholar] [CrossRef]
  50. Qu, B.; Bruneau, M. Capacity design of intermediate horizontal boundary elements of steel plate shear walls. J. Struct. Eng. 2010, 136, 665–675. [Google Scholar] [CrossRef]
  51. Broberg, M.; Shafaei, S.; Kizilarslan, E.; Seo, J.; Varma, A.H.; Bruneau, M.; Klemencic, R. Capacity design of coupled composite plate shear wall–concrete-filled system. J. Struct. Eng. 2022, 148, 04022022. [Google Scholar] [CrossRef]
  52. Barbato, M.; Conte, J.P. Finite element response sensitivity analysis: A comparison between force-based and displacement-based frame element models. Comput. Methods Appl. Mech. Eng. 2005, 194, 1479–1512. [Google Scholar] [CrossRef]
  53. Hansson, S.; Jansson, T. Sensitivity analysis of a finite element model for the simulation of stainless steel tube extrusion. J. Mater. Process. Technol. 2010, 210, 1386–1396. [Google Scholar] [CrossRef]
  54. Rooks, N.B.; Besier, T.F.; Schneider, M.T.Y. A Parameter Sensitivity Analysis on Multiple Finite Element Knee Joint Models. Front. Bioeng. Biotechnol. 2022, 10, 841882. [Google Scholar] [CrossRef] [PubMed]
  55. Swendsen, R.H.; Wang, J.S. Nonuniversal critical dynamics in Monte Carlo simulations. Phys. Rev. Lett. 1987, 58, 86. [Google Scholar] [CrossRef] [PubMed]
  56. Theodorou, D.N. Progress and outlook in Monte Carlo simulations. Ind. Eng. Chem. Res. 2010, 49, 3047–3058. [Google Scholar] [CrossRef]
  57. Xu, J.L. Reducing FEM Solution Errors with Quad Precision Arithmetic. Struct. Anal. 2022, 2022, 12–16. Available online: https://www.structuremag.org/?p=22193 (accessed on 27 November 2023).
  58. Jakobsson, H.; Larson, M.G.; Granåsen, G. Reduction of finite element models of complex mechanical components. SIMS 2007, 2007, 88. Available online: https://ep.liu.se/ecp/027/010/ecp072710.pdf (accessed on 28 November 2023).
  59. Dogančić, B.; Jokić, M. Discretization and Model Reduction Error Estimation of Interconnected Dynamical Systems. IFAC-Pap. 2022, 55, 177–182. Available online: https://creativecommons.org/licenses/by-nc-nd/4.0/ (accessed on 28 November 2023). [CrossRef]
  60. Halilović, D.; Gligorić, M.; Gligorić, Z.; Pamučar, D. An Underground Mine Ore Pass System Optimization via Fuzzy 0–1 Linear Programming with Novel Torricelli–Simpson Ranking Function. Mathematics 2023, 11, 2914. [Google Scholar] [CrossRef]
Figure 1. The basic structure of a high-depth inclined ore pass.
Applsci 13 13065 g001
Figure 2. Shaft wall damage model of high-depth inclined ore pass.
Applsci 13 13065 g002
Figure 3. An ore pass drilled using a raise-boring machine.
Applsci 13 13065 g003
Figure 4. Ore collision points in a high-depth inclined ore pass of a deep mine.
Applsci 13 13065 g004
Figure 5. Numerical simulation results of the maximum ore indentation depth at the initial collision positions. (a) Operating Condition 1; (b) Operating Condition 2; (c) Operating Condition 3; (d) Operating Condition 4.
Applsci 13 13065 g005
Figure 6. Comparison of the results of the theoretical model and numerical simulation.
Applsci 13 13065 g006
Figure 7. Bottom of No. 2 ore pass of the deep mine.
Applsci 13 13065 g007
Figure 8. Initial collision position between the ore and the shaft wall of No. 1 ore pass: (a) laser measurement line schematic; (b) site diagram of initial collision position.
Applsci 13 13065 g008
Figure 9. Variation in the total shaft wall damage volume Qtol with respect to ore-pass depth H across ore-pass dip angles.
Applsci 13 13065 g009
Figure 10. Variation in total shaft wall damage volume Qtol with respect to ore-pass dip angle θ across ore-pass depths.
Applsci 13 13065 g010
Figure 11. Variation in total shaft wall damage volume Qtol with respect to the inclined angle of the chute α across ore-pass depths.
Applsci 13 13065 g011
Figure 12. Variation in total shaft wall damage volume Qtol with respect to the shaft diameter D across ore-pass dip angles.
Applsci 13 13065 g012
Figure 13. Variation in total shaft wall damage volume Qtol with respect to the ore block size P across ore-pass depths.
Applsci 13 13065 g013
Figure 14. Sensitivity comparison of influencing factors.
Applsci 13 13065 g014
Table 1. Physical and mechanical parameters of ore and shaft wall rock mass.
TypeElastic Modulus E/(GPa)Poisson Ratio
ν/(-)
Volumetric Weight
γ/(KN·m−3)
Initial Yield Strength
σq/(MPa)
Friction Angle
φ /(°)
Cohesion
c/(MPa)
Coefficient of Sliding Friction
μ /(-)
Shaft wall rock mass16.800.2627.8059.524210.600.40
Ore14.090.2540.80
Table 2. Structural parameters of the ore pass.
Operating ConditionOre-Pass Dip Angle
θ /(°)
Shaft Diameter
D/(m)
Ore-Pass Depth
H/(m)
Inclined Angle of Chute
α /(°)
18027070
270218060
35526065
460218045
Disclaimer/Publisher’s Note: The statements, opinions and data contained in all publications are solely those of the individual author(s) and contributor(s) and not of MDPI and/or the editor(s). MDPI and/or the editor(s) disclaim responsibility for any injury to people or property resulting from any ideas, methods, instructions or products referred to in the content.

