Article

Skin Imaging: A Digital Twin for Geometric Deviations on Manufactured Surfaces

by
Elnaz Ghanbary Kalajahi
1,
Mehran Mahboubkhah
1 and
Ahmad Barari
2,*
1
Department of Mechanical Engineering, University of Tabriz, Tabriz 5166616471, Iran
2
Faculty of Engineering and Applied Science, University of Ontario Institute of Technology (Ontario Tech), Oshawa, ON L1G 0C5, Canada
*
Author to whom correspondence should be addressed.
Appl. Sci. 2023, 13(23), 12971; https://doi.org/10.3390/app132312971
Submission received: 5 October 2023 / Revised: 10 November 2023 / Accepted: 27 November 2023 / Published: 4 December 2023
(This article belongs to the Special Issue Smart Manufacturing and Industry 4.0, 2nd Edition)

Abstract

:
Closed-loop manufacturing is crucial in Industry 4.0, since it provides an online detection–correction cycle to optimize the production line by using the live data provided from the product being manufactured. By integrating the inspection system and manufacturing processes, the production line achieves a new level of accuracy and savings on costs. This is far more crucial than only inspecting the finished product as an accepted or rejected part. Modeling the actual surface of the workpiece in production, including the manufacturing errors, enables the potential to process the provided live data and give feedback to production planning. Recently introduced “skin imaging” methodology can generate 2D images as a comprehensive digital twin for geometric deviations on any scanned 3D surface including analytical geometries and sculptured surfaces. Skin-Image has been addressed as a novel methodology for continuous representation of unorganized discrete 3D points, by which the geometric deviation on the surface is shown using image intensity. Skin-Image can be readily used in online surface inspection for automatic and precise 3D defect segmentation and characterization. It also facilitates search-guided sampling strategies. This paper presents the implementation of skin imaging for primary engineering surfaces. The results, supported by several industrial case studies, show high efficiency of skin imaging in providing models of the real manufactured surfaces.

Graphical Abstract

1. Introduction

One of the key features of Industry 4.0 is the integration of manufacturing and inspection processes, which enables live assessment of the products’ health and quality of the manufacturing processes throughout real-time monitoring of the product in production. The closed-loop approach is an essential and integral concept both in digital metrology, by conducting steps of inspection process in a closed-loop manner, and in digital manufacturing, by integrating the manufacturing and inspection processes in a feedback loop. This approach results in inspection uncertainty reduction, and manufacturing error compensation and correction. Therefore, continuous improvement of the product quality and performance would be achieved. Closed-loop manufacturing is a specific application of this concept, which aims to optimize and control the manufacturing operations by using live data collected by sensors from the workpiece being manufactured. Optical measurement sensors have become more popular than contact coordinate measurement machines (CMM) for in-process coordinate metrology of the surface due to their fastness, higher resolution, and noncontact approach [1,2,3,4]. Cyber–Physical Integrated Inspection System (IIS) adds value to digital metrology to befit Industry 4.0 by reducing uncertainty based on the closed-loop implementation of three sequential tasks of coordinate metrology, i.e., Point Measurement Planning (PMP), Substitute Geometry Estimation (SGE), and Deviation Zone Evaluation (DZE). PMP is the process of planning the approach of selecting a discrete number of points from a measured surface during or after the manufacturing operation such that the selected finite points can be a precise representation of the continuous surface. Using a desired fitting criteria in order to fit the best ideal geometry to the acquired point cloud (PC) is the task of the SGE step.
The ultimate step of coordinate metrology, i.e., DZE, is to evaluate the deviation of the entire surface from the fitted geometry including deviations of the measured locations and even the locations that are not physically measured. In fact, the result of this cyber component of coordinate metrology illustrates the actual geometry (non-ideal surface) of the entire manufactured surface. The actual geometry may differ from the desired CAD model due to probable uncertainties, abnormalities or defects caused during the manufacturing operations. Cyber–Physical IIS [5,6,7] conducts the mentioned sequential steps of coordinate metrology in a closed-loop manner so that the information of each step is dynamically feedbacked to the other steps to improve the inspection quality by reducing the uncertainty of the inspection. Based on the feedbacked information, the PMP step would intelligently sample the most important data points from the measured object, and SGE step can fit the more efficient ideal geometry to the PC. Consequently, a more precise and informative DZE about the actual surface would be obtained. The obtained result from the workpiece in production is not only useful for the online quality inspection of the workpiece but also for the investigation and improvement of the health of the manufacturing system. The comprehensive DZE of the entire measured surface can be used directly for any possible downstream manufacturing processes that need the results of digital metrology process, including precise finishing operations, manufacturing error compensation, or for any tolerance evaluation required during the assembly operations [8,9]. Digital twin has received significant attention in the fields of prognostics and health management mechanical systems by developing a twin system between real-time machinery and the virtual world, in order to tighten the loop between design and execution [10,11,12,13]. Due to inherent uncertainties that always exist with manufacturing processes, achieving the exact geometries of the part is impractical [14]. Inspecting and analyzing the geometric deviation of machined parts allows modeling of the machining error behavior, which contains all the essential information of the error sources in the machining process. Closed-loop machining employs the inspection results of the machined part in the error compensation of the finishing cuts, repetitive production, online process planning, and modification of the machining process [15,16,17]. In this way, closed-loop machining contributes to smart manufacturing [18,19,20] by increasing the productivity, reliability, and sustainability of the machining process. Using the collected information by integrated inspection systems, manufacturing errors can either be corrected on-machine, or additional downstream manufacturing processes can be prescribed for error compensation [21]. Different methods and algorithms have been studied on the two first cyber components of IIS, i.e., PMP [3,22,23,24,25,26,27] and SGE [28,29,30,31,32], but research on DZE is limited to fewer ones, despite its high significance. Poniatowska [33] proposed to use Non-Uniform Rational B-Spline (NURBS) parametric domain on measurement PCs to obtain spatial models of patterns left by the machining process on the surfaces; afterwards this measurement pattern model is superimposed on the nominal CAD model to obtain a CAD model of the product’s surface, which can be used to determine areas of greatest deviations. Jamiolahmadi and Barari [34] have used Laplace equation in the evaluation of deviation zone of the manufactured parts, they also have utilized finite difference method in [35] such that the minimum number of points participate in the geometric deviation of the surface, resulting in reduction of the uncertainty of the process. Jianshun et al. [36] proposed an approach based on curvilinear coordinate system for deviation modeling of the manufactured surfaces; they defined different curvilinear coordinate systems for various manufacturing methods on nominal surfaces.

Motivation and Core Concept

As has been discussed, geometric deviations are inevitably caused during the manufacturing processes, since every manufacturing process is inherently imprecise and every measuring process involves uncertainties. Therefore, when assessing surface quality in industry, in addition to surface roughness, it is important to consider surface geometrical deviation [37]. Hence, the digital modeling of non-ideal parts (actual manufactured surface) is essential. In this regard, Skin Model as a new paradigm for geometric variations modeling has been introduced based on the Geometrical Product Specification (GPS) standards [38] by Zhang et al. [39] and then was further developed and explained by Anwer et al. [40,41] and Schleich et al. [42,43]. Lalehpour and Barari [8] used finite element method in generating Skin Model as the comprehensive geometric deviation of the measured workpiece. Semere et al. [44] demonstrated accurate tolerance and variation analysis by estimating variation from the skin model and comparing it with the nominal model. Actually, the Skin Model of the measured surface is the detailed continuous 3D digital twin of the actual manufactured surface obtained from discrete finite measurement points, i.e., PCs.
Recently, the “Skin Imaging” methodology as a new concept of the skin model has been introduced and discussed in [45]. A skin image is an enriched 2D digital twin of the actual geometric deviation of any surface and evaluates the detailed deviation zone of the surface by intensity variations of its pixels. This has been discussed with several planar case studies, and also the concept of inspection of non-planar surfaces with the skin imaging methodology has been demonstrated on NURBS surfaces, which is the most comprehensive method to model parametric surfaces. Generally, any DZE model of the surface shows the deviation of different location of the surface from the ideal one. But hitherto, no specific method has been introduced to analyze the DZE model and use the potential information included. “Skin image” provides this opportunity since it represents an unorganized and discrete 3D point cloud of the surface in the organized and continuous 2D image, and hence can be processed by well-developed image processing methods. It also facilitates neighbor searching due to its two-dimensional approach. Moreover, it does not need additional data other than the points’ coordinates to be generated.
The application of skin image in automatic detection and correction cycles in manufacturing phases has been discussed in depth in [45]. In a nutshell, 3D defect detection from the PC has been a challenge over the years. The existing approaches mostly require pre-known models about the defects, or, in the case of using machine learning methods, it needs a large number of sample defects to train the machines. But more light-weighted methodologies are necessary for the online detection–correction cycle. Concerning the fact that the boundary of an object in the 2D image is clearer and easier to extract, but the image lacks spatial information, recently, researchers have attempted to boost spatial defect detection by using a concurrent 2D image and 3D PC. They perform defect detection in the 2D space and then add the spatial information of the detected defects using the 3D information of the PC [46,47,48]. However, they were limited to specific kinds of PC, such as dense density points, points acquired in grid form, or requiring careful and tedious calibration of multiple devices. In fact, no general methodology for 3D defect detection has been proposed yet. The “Skin imaging” approach, which represents the spatial information of the point cloud as a 2D image, has shown promising results in precise and efficient 3D defect segmentation and characterization, irrespective of shape or size. Using this approach, the boundary of the 3D defect is extracted and the local details of the surface become available for any downstream manufacturing process on the surface (post-processing, finishing, correcting, etc.).
The current paper is an extension of our previous research [45] to demonstrate the concept of “Skin Imaging” on cylindrical and spherical surfaces, which are widely used in most industrial products. To the best of our knowledge, this is the first time that the detailed deviation zone evaluation (DDZE) of these surfaces is generated from the point cloud captured from the real industrial surfaces. The main aim is to explain the methodology of skin image generation on these surfaces in detail. Thereafter, as the sub-issue, its application for automatic 3D defect detection and characterization on these surfaces will be shown. The defective regions of the surface are automatically extracted from its corresponding skin image, and then their locations are extracted on the 3D surface. The paper demonstrates how this methodology can provide useful feedback about the manufacturing error with several experimental case studies. Reporting these errors to the manufacturing line allows the manufacturing line to modify or correct the upstream manufacturing processes, or compensate the errors by downstream manufacturing processes. In addition to 3D defect segmentation, the accurate magnitude of the errors is also reported. The remainder of the paper is organized as follows: Section 2 explains the fundamentals of skin image methodology. The skin imaging of manufactured cylindrical and spherical surfaces will be discussed in Section 3 and Section 4, respectively. Section 5 deals with the skin imaging of the case studies and its application in closed-loop manufacturing. Eventually, the conclusion is included in Section 6.

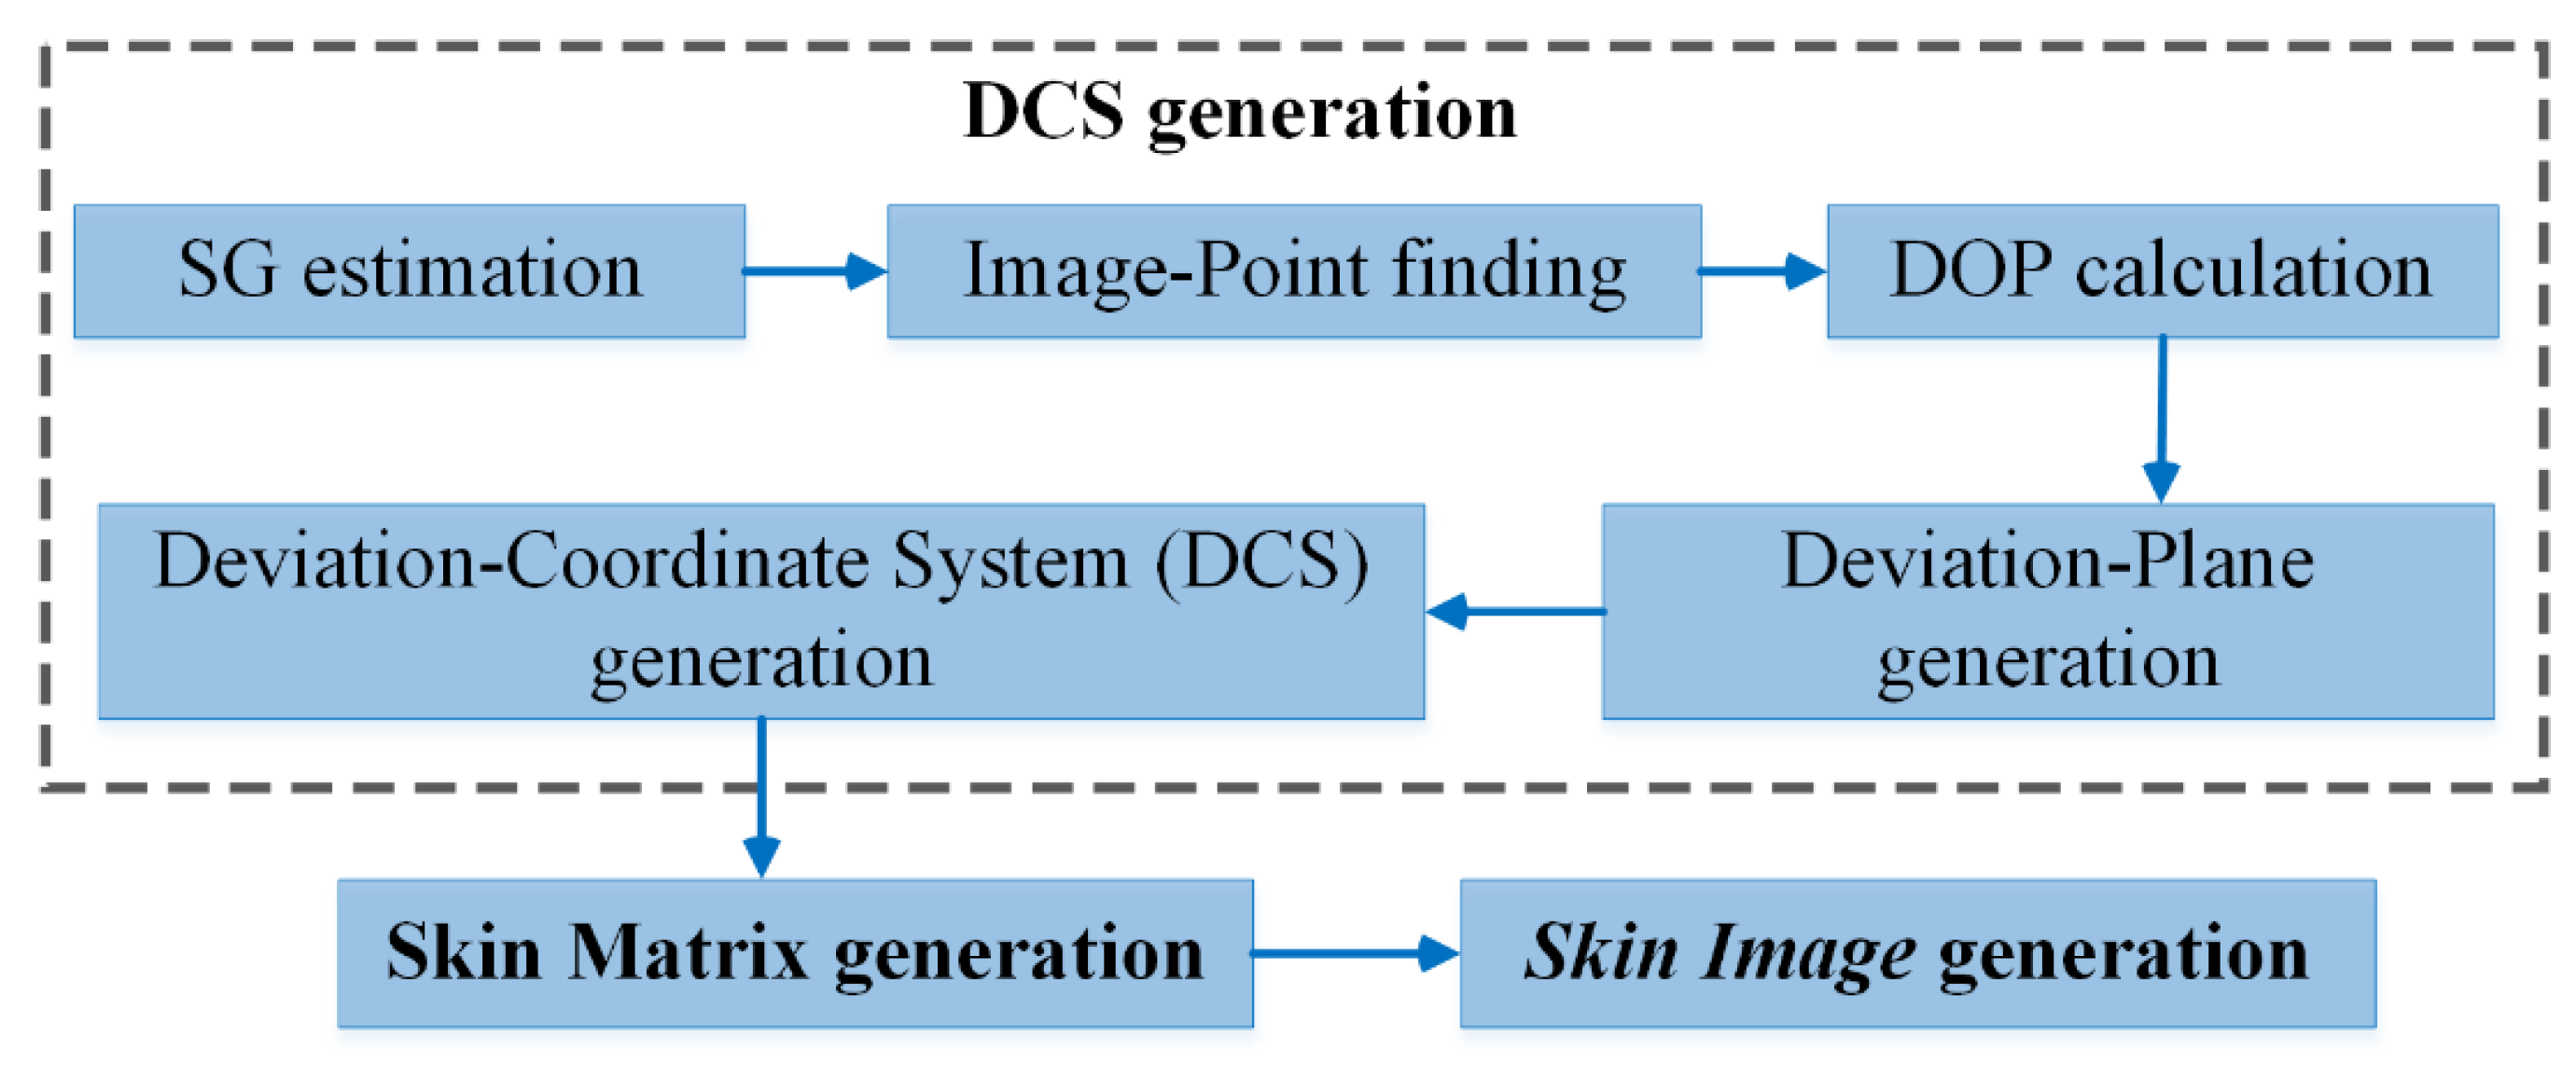
2. Skin Image Methodology

Skin image generation consists of three main steps:
  • I—Deviation-Coordinate System (DCS) generation.
  • II—Skin matrix generation.
  • III—Skin image generation.
Moreover, the first step is conducted through five sub-steps:
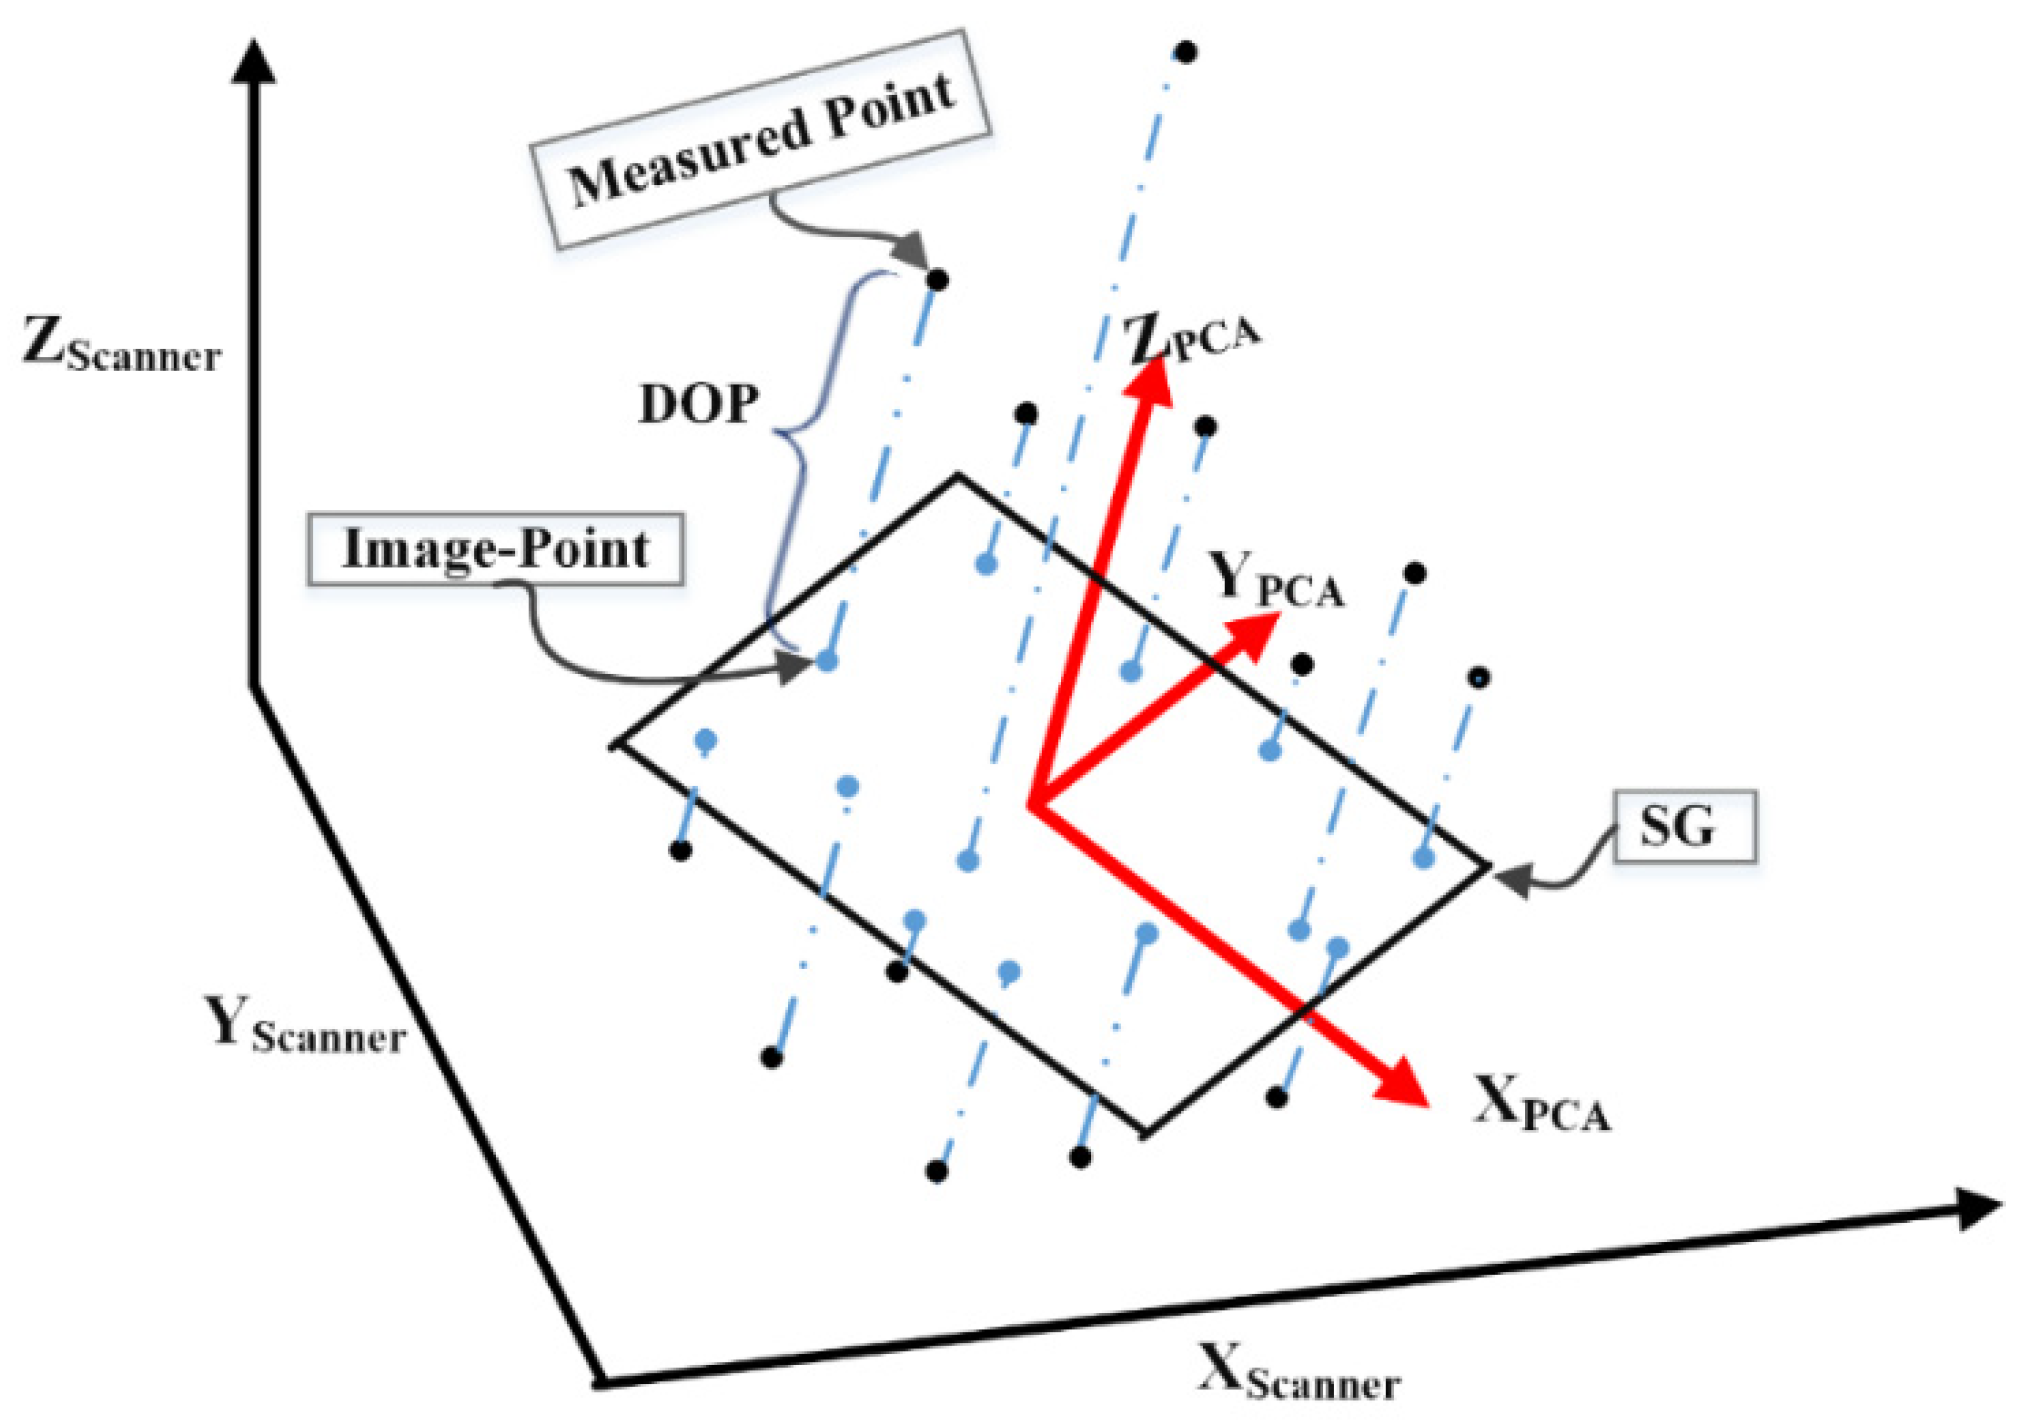
  • I. I—SG estimation: Fit the best substitute geometry to the PCs.
  • I. II—Image-Point finding: Find image of every point on the SG.
  • I. III—DOP calculation: Calculate the deviation of every point from SG.
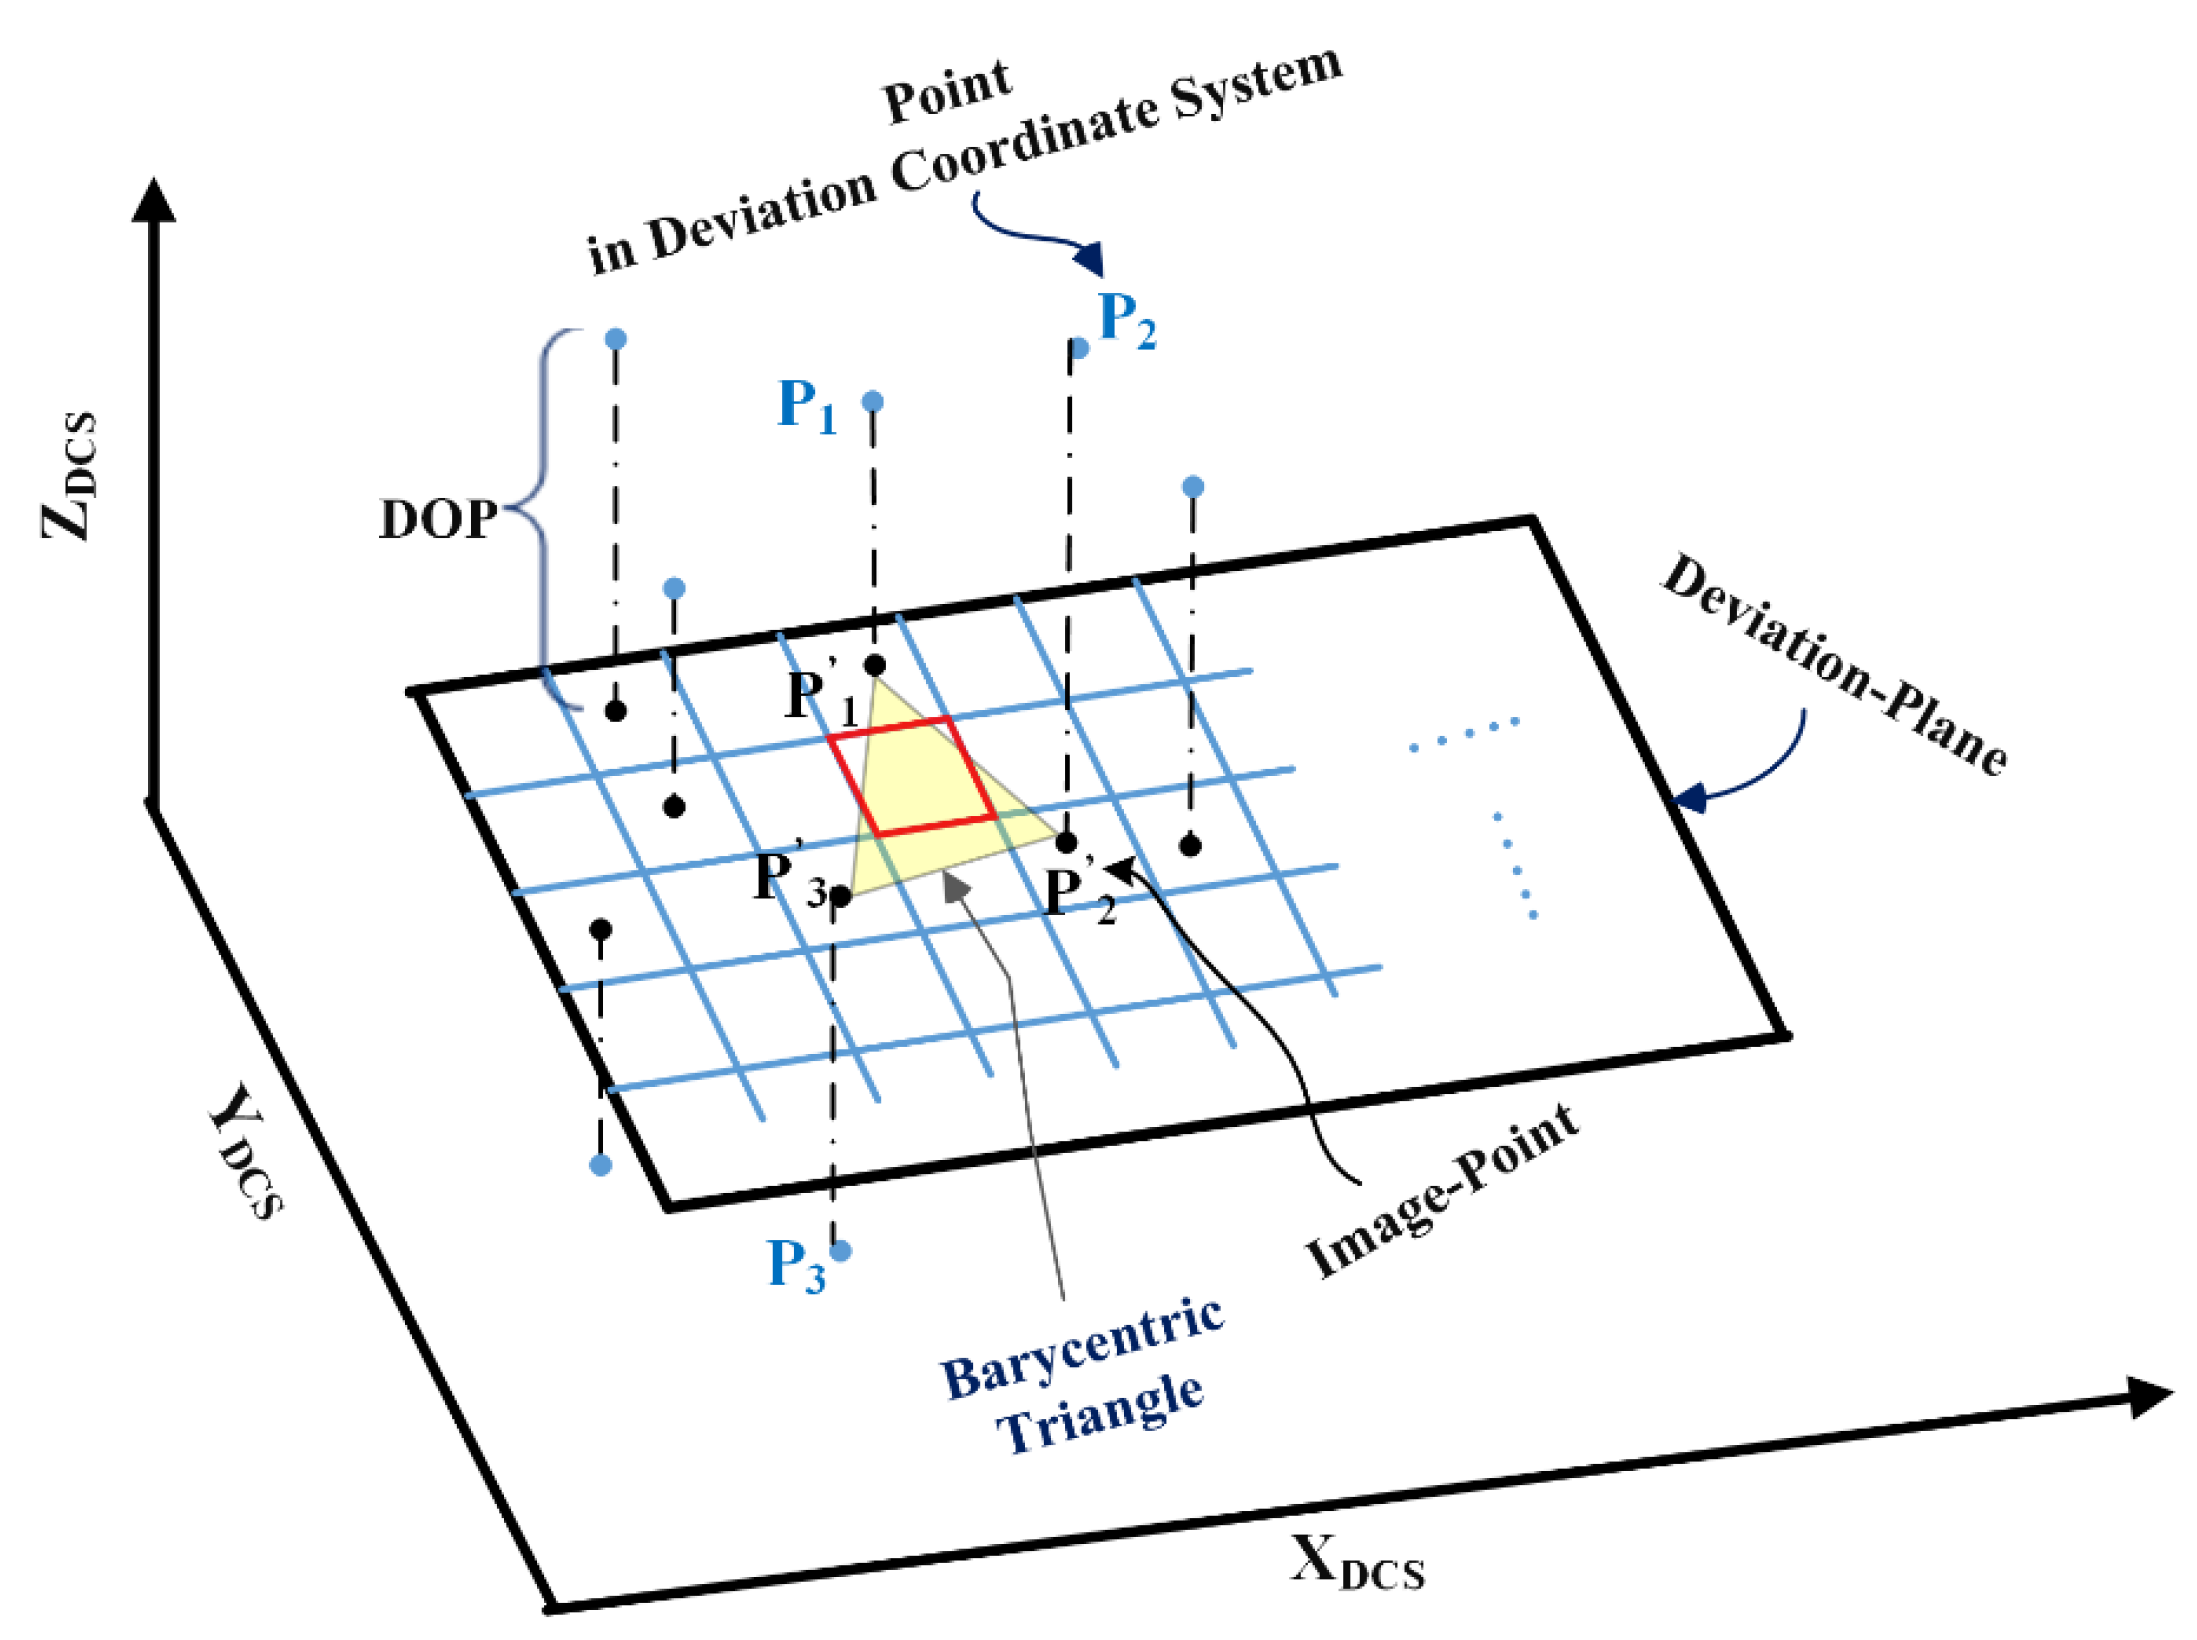
  • I. IV—Deviation-Plane generation: Localization of the Image-Point on the SG.
  • I. V—Deviation-Coordinate System generation: Assign a corresponding coordinate  x D C S y D C S z D C S  for every point with results of two latter sub-steps. Figure 1 illustrates the procedures of skin imaging in a flowchart.
The last two main steps are common for skin image generation of any kind of surface, while the first main step (Deviation-Coordinate System generation) differs. The fundamental of skin imaging has been thoroughly explained in [45]. Hence, in the following, a concise explanation is presented:
  • I—Deviation-Coordinate System generation on the planar surface:
Acquiring the PCs of the inspected planar surface, the best ideal surface fitted to the PCs is obtained with Principal Component Analysis (PCA) (I.I-SG estimation). Consequently, the coordinates of the points (in the scanner coordinate system) are mapped to the PCA-coordinate system. According to [45] if  x i y i z i  is the coordinate of ith measured point by the scanner in the scanner coordinate system and T4×4 is the transformation matrix obtained with the PCA method, the coordinates of data points in PCA coordinate system  x P C A i y P C A i z P C A i  are defined as:
x i P C A y i P C A z i P C A 1 = x i y i z i 1 × T
As Figure 2 illustrates the deviation of the measured point with respect to the fitted plane (SG) is presented as zPCA (I.III-DOP calculation). In this case, [xPCA yPCA] is the position of the Image-Point on the SG (step I.IV).
For the planar surfaces, the Deviation-Coordinate System generation step (I.V) is finalized by substituting [xPCA yPCA zPCA] for [xDCS yDCS zDCS]. Moreover, in this case, Deviation-Plane is the same as the fitted best plane.
Figure 3 illustrates the general concept of skin imaging together with the Deviation-Coordinate System (DCS). The points in blue color are the corresponding of points the measured PC in DCS that are obtained based on the location of the Image-Points on the Deviation-Plane and DOP of the points.
  • II—Skin Matrix generation:
The first measure to generate the matrix of the skin image is normalization of the XDCS–YDCS plane of Deviation-Coordinate System. Then by dividing the normalized plane to the desired number of grids, the cells (elements) of the matrix are obtained. The deviation of the measured points (DOP in Figure 3) are used to define the value of each element of the matrix such that if a cell of the matrix contains an image-point (black points in Figure 3), the point’s deviation is considered as the value of that element. In order to define the value for the elements containing no image-point, e.g., the red cell in Figure 3 (namely blank pixel), interpolation is carried out based on the deviations of the three image-points i.e., P’1, P’2 and P’3 surrounding the cell and make a Barycentric triangle [45].
  • III—Skin Image generation:
According to [45], the obtained skin matrix is a 2D representation of DZE of the measured surface, and the variations of its elements’ values demonstrates the variation of the deviation of the surface with respect to the substituted geometry. Moreover, in order to display the acquired matrix as the skin image of the surface in the standard image format, it is required to map the values of the matrix to its corresponding integer in 0–255 range, which is the standard range for a grayscale image. Afterwards the skin image can be saved as any conventional image format such as .jpg or .tiff.
In the following, the Deviation-Coordinate System generation step for cylindrical and spherical surfaces will be discussed in Section 3 and Section 4, respectively. As was declared before, once this system is generated, the two next main steps of skin imaging are conductible regardless of the kind of the surface.

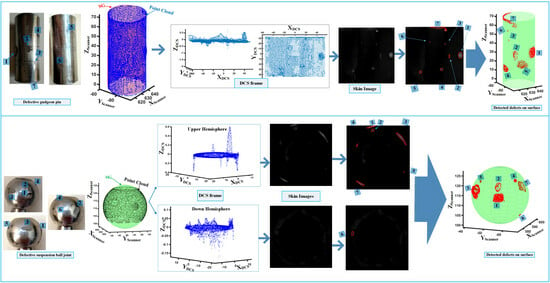
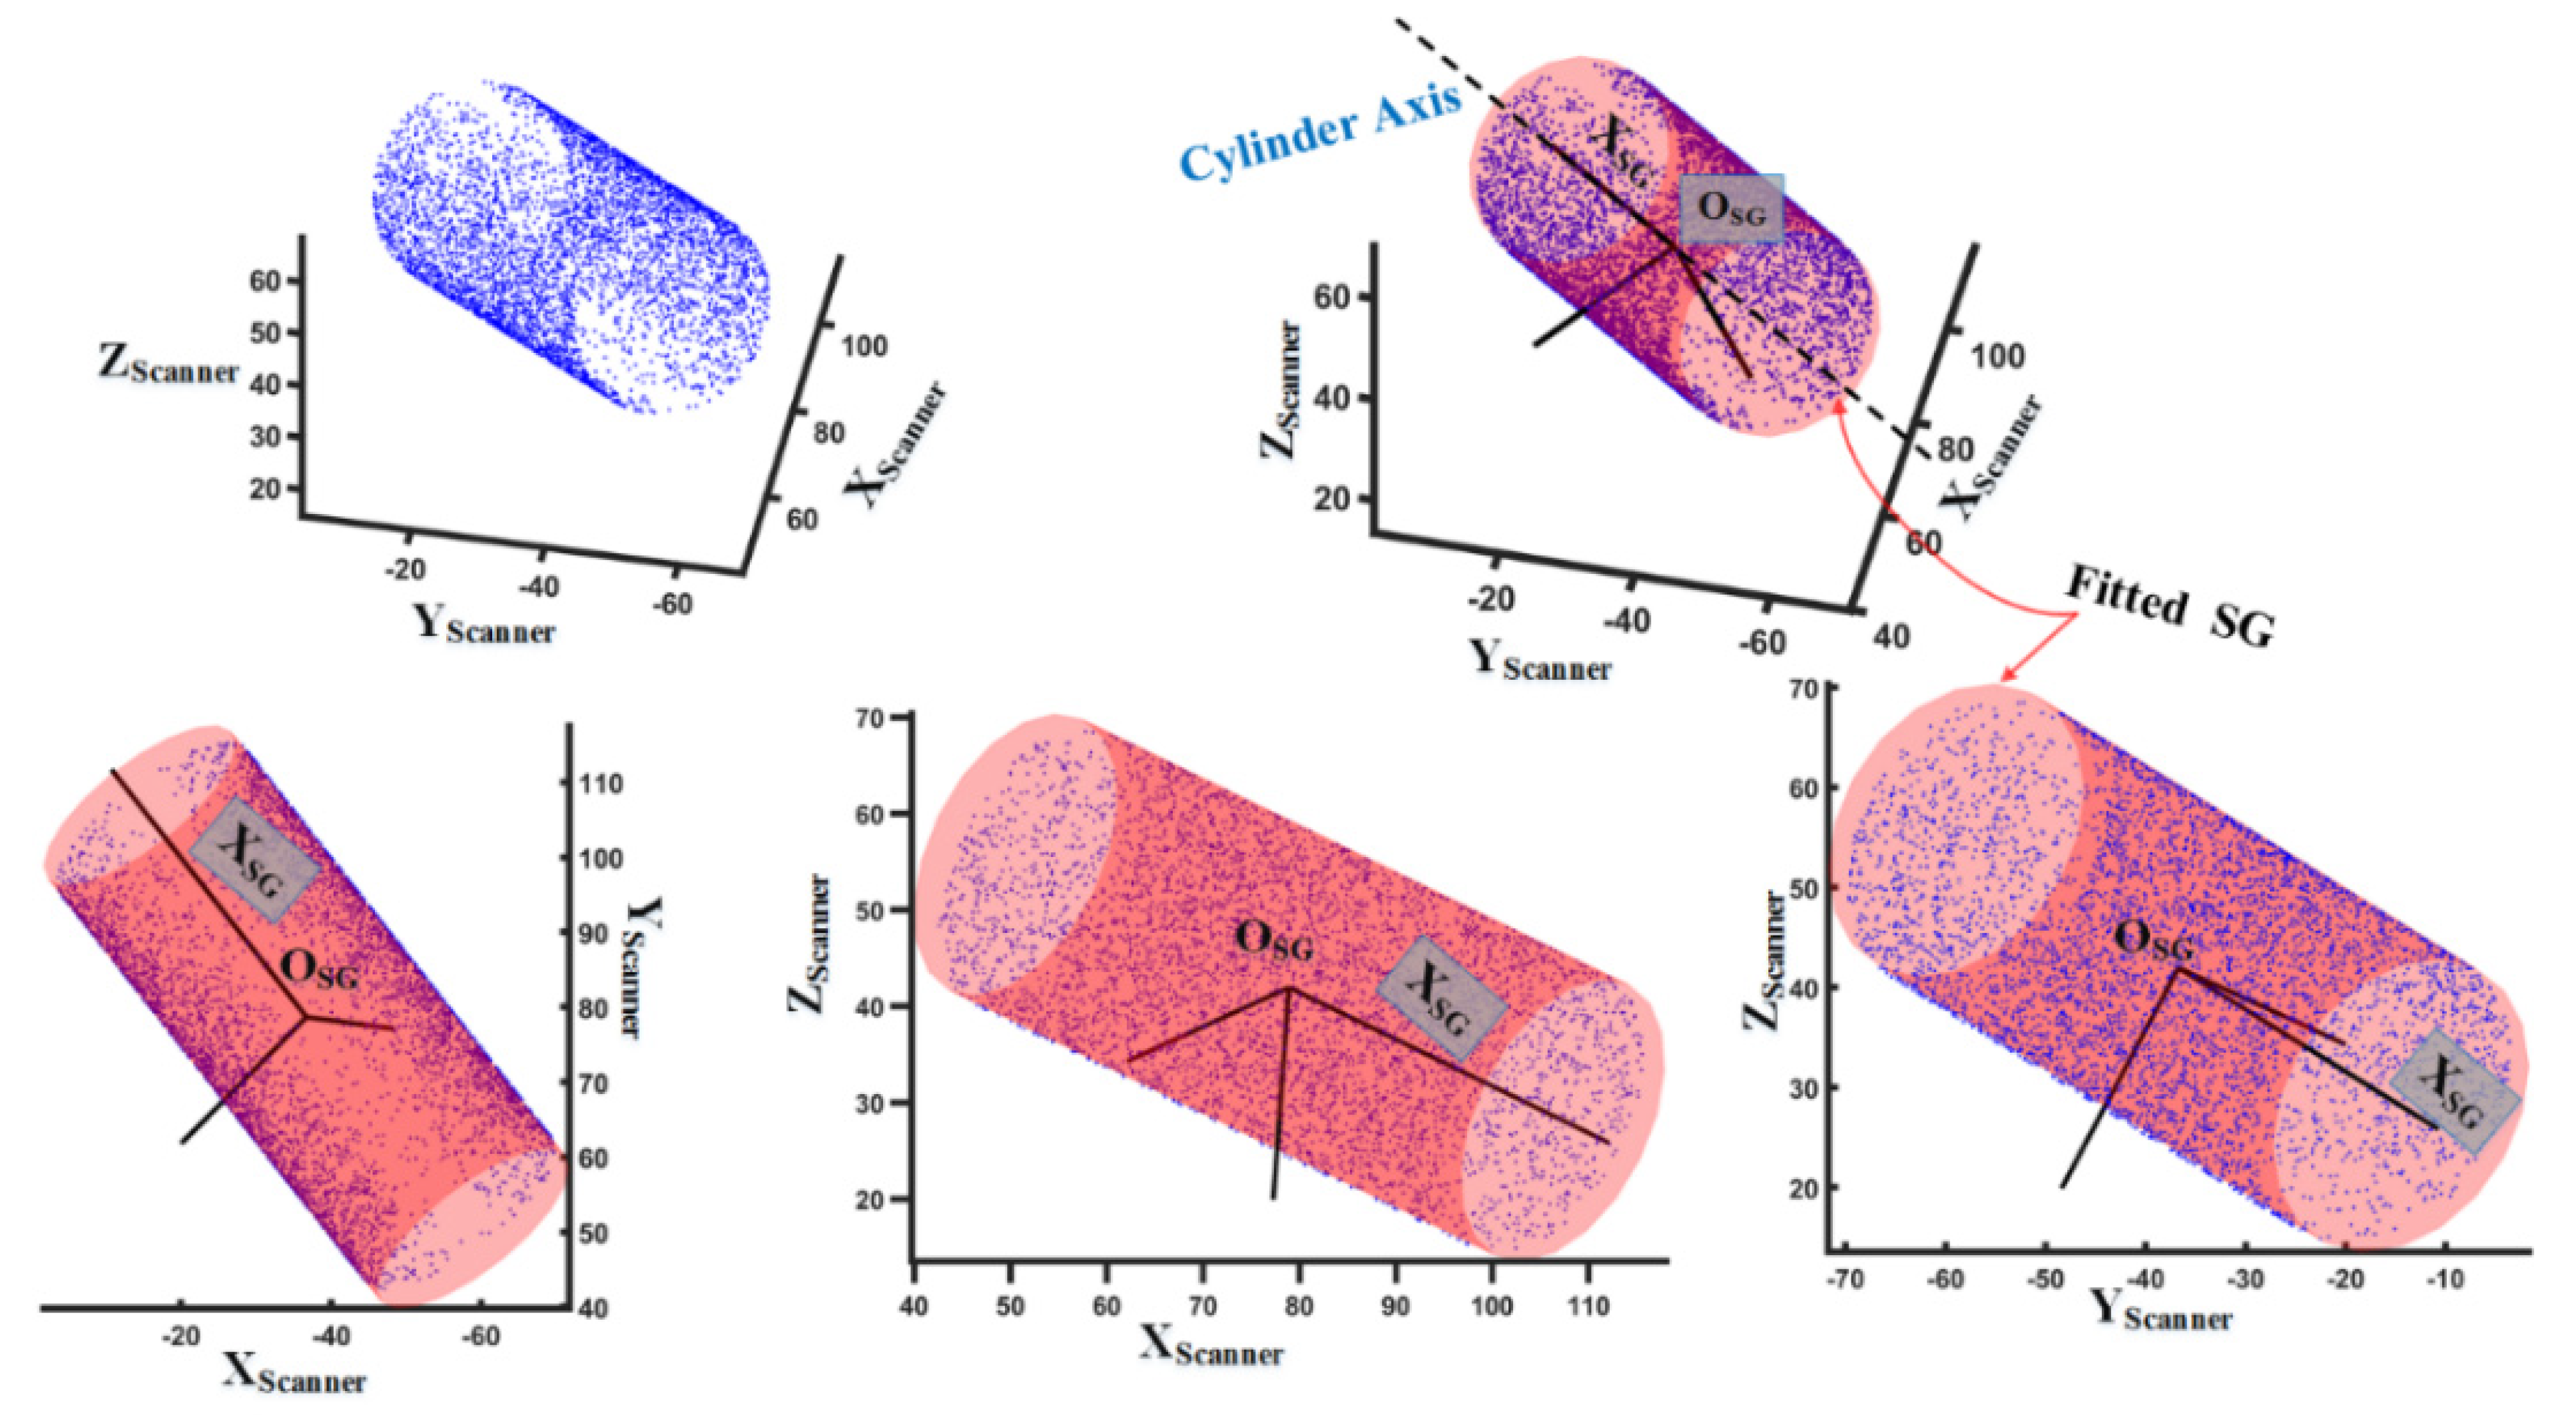
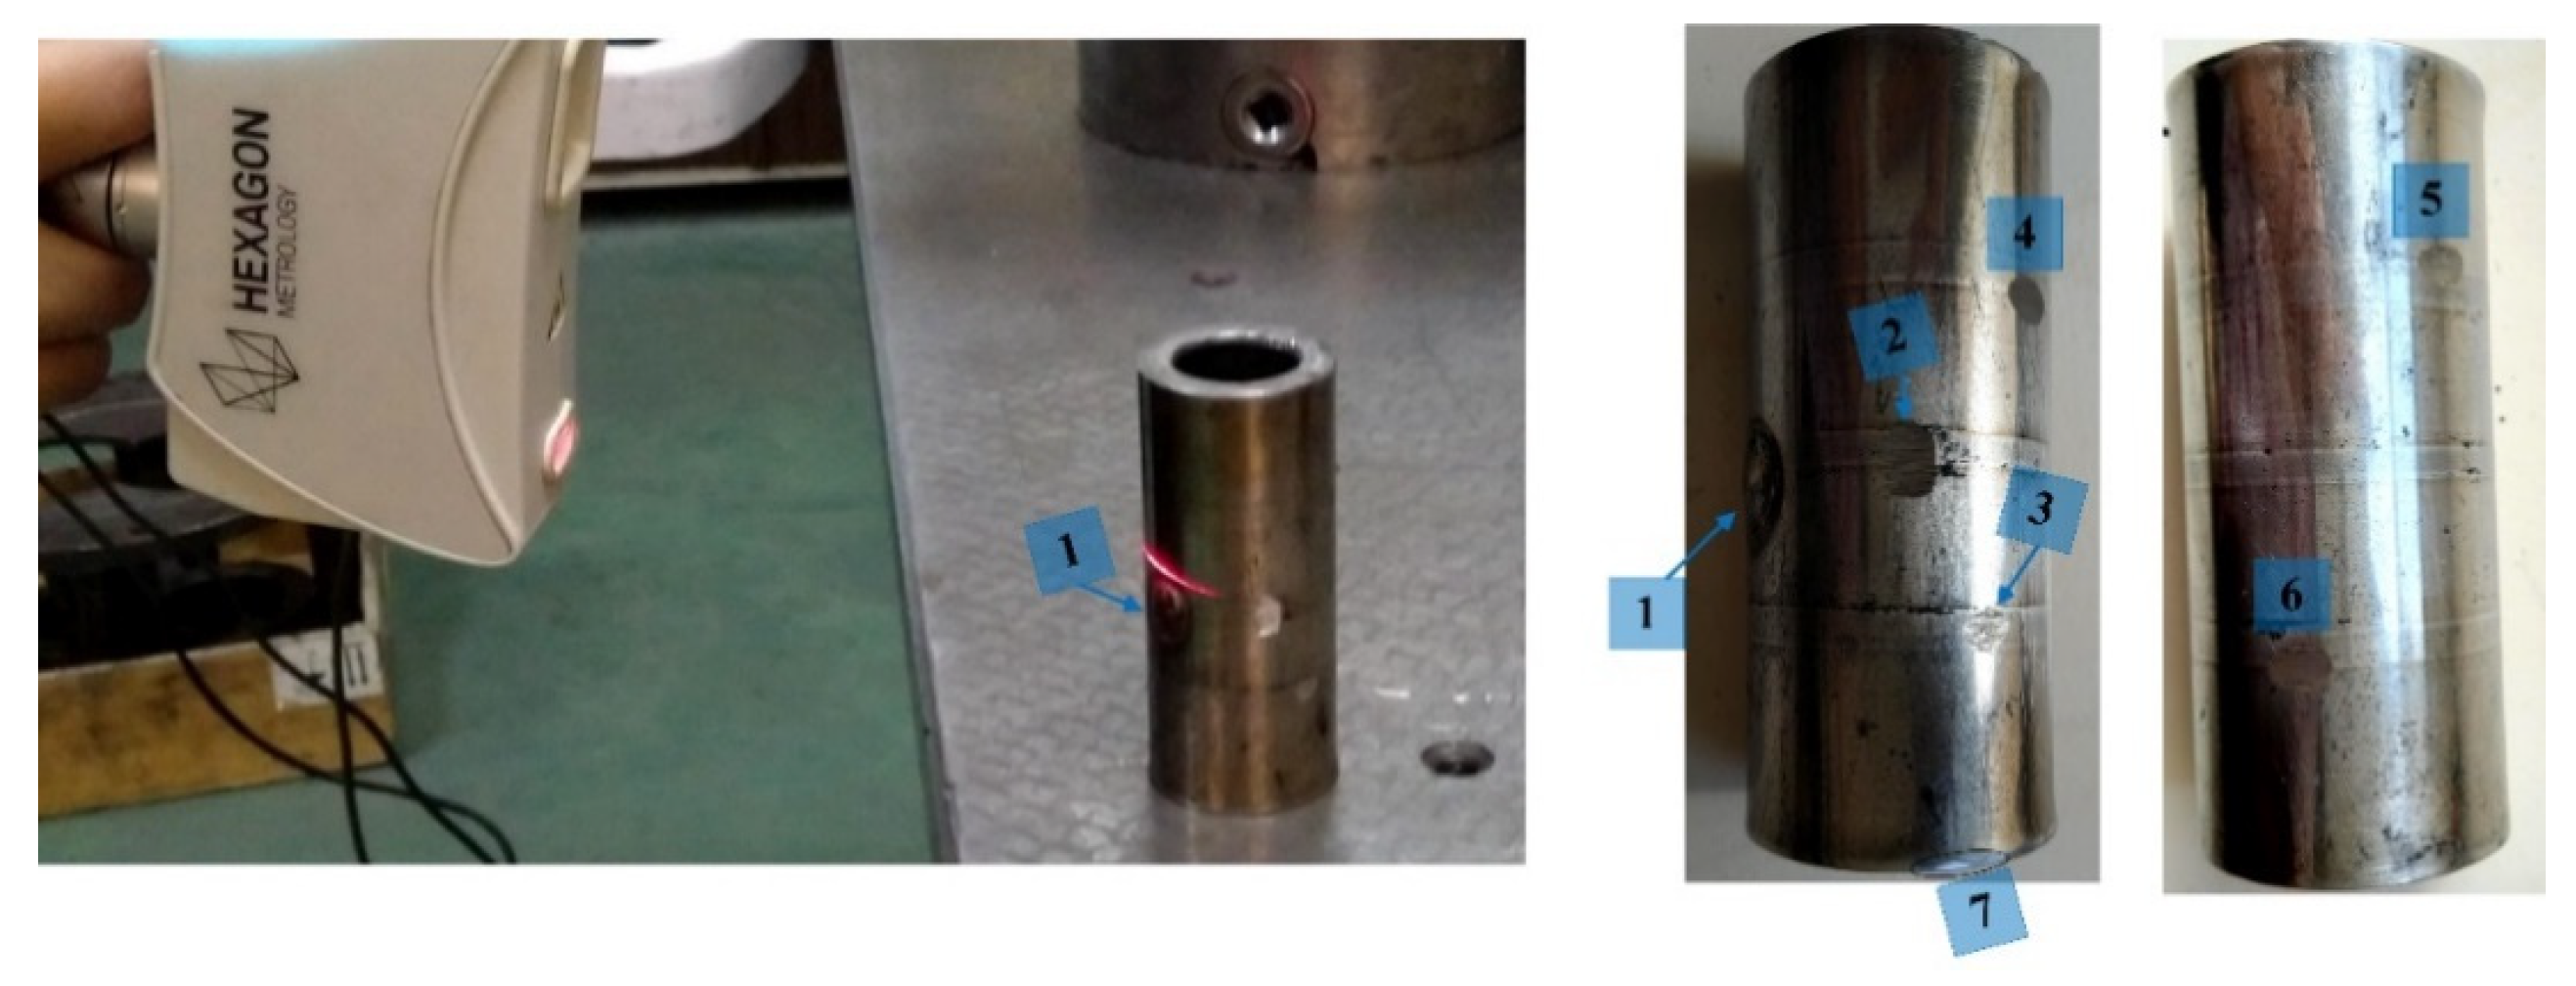
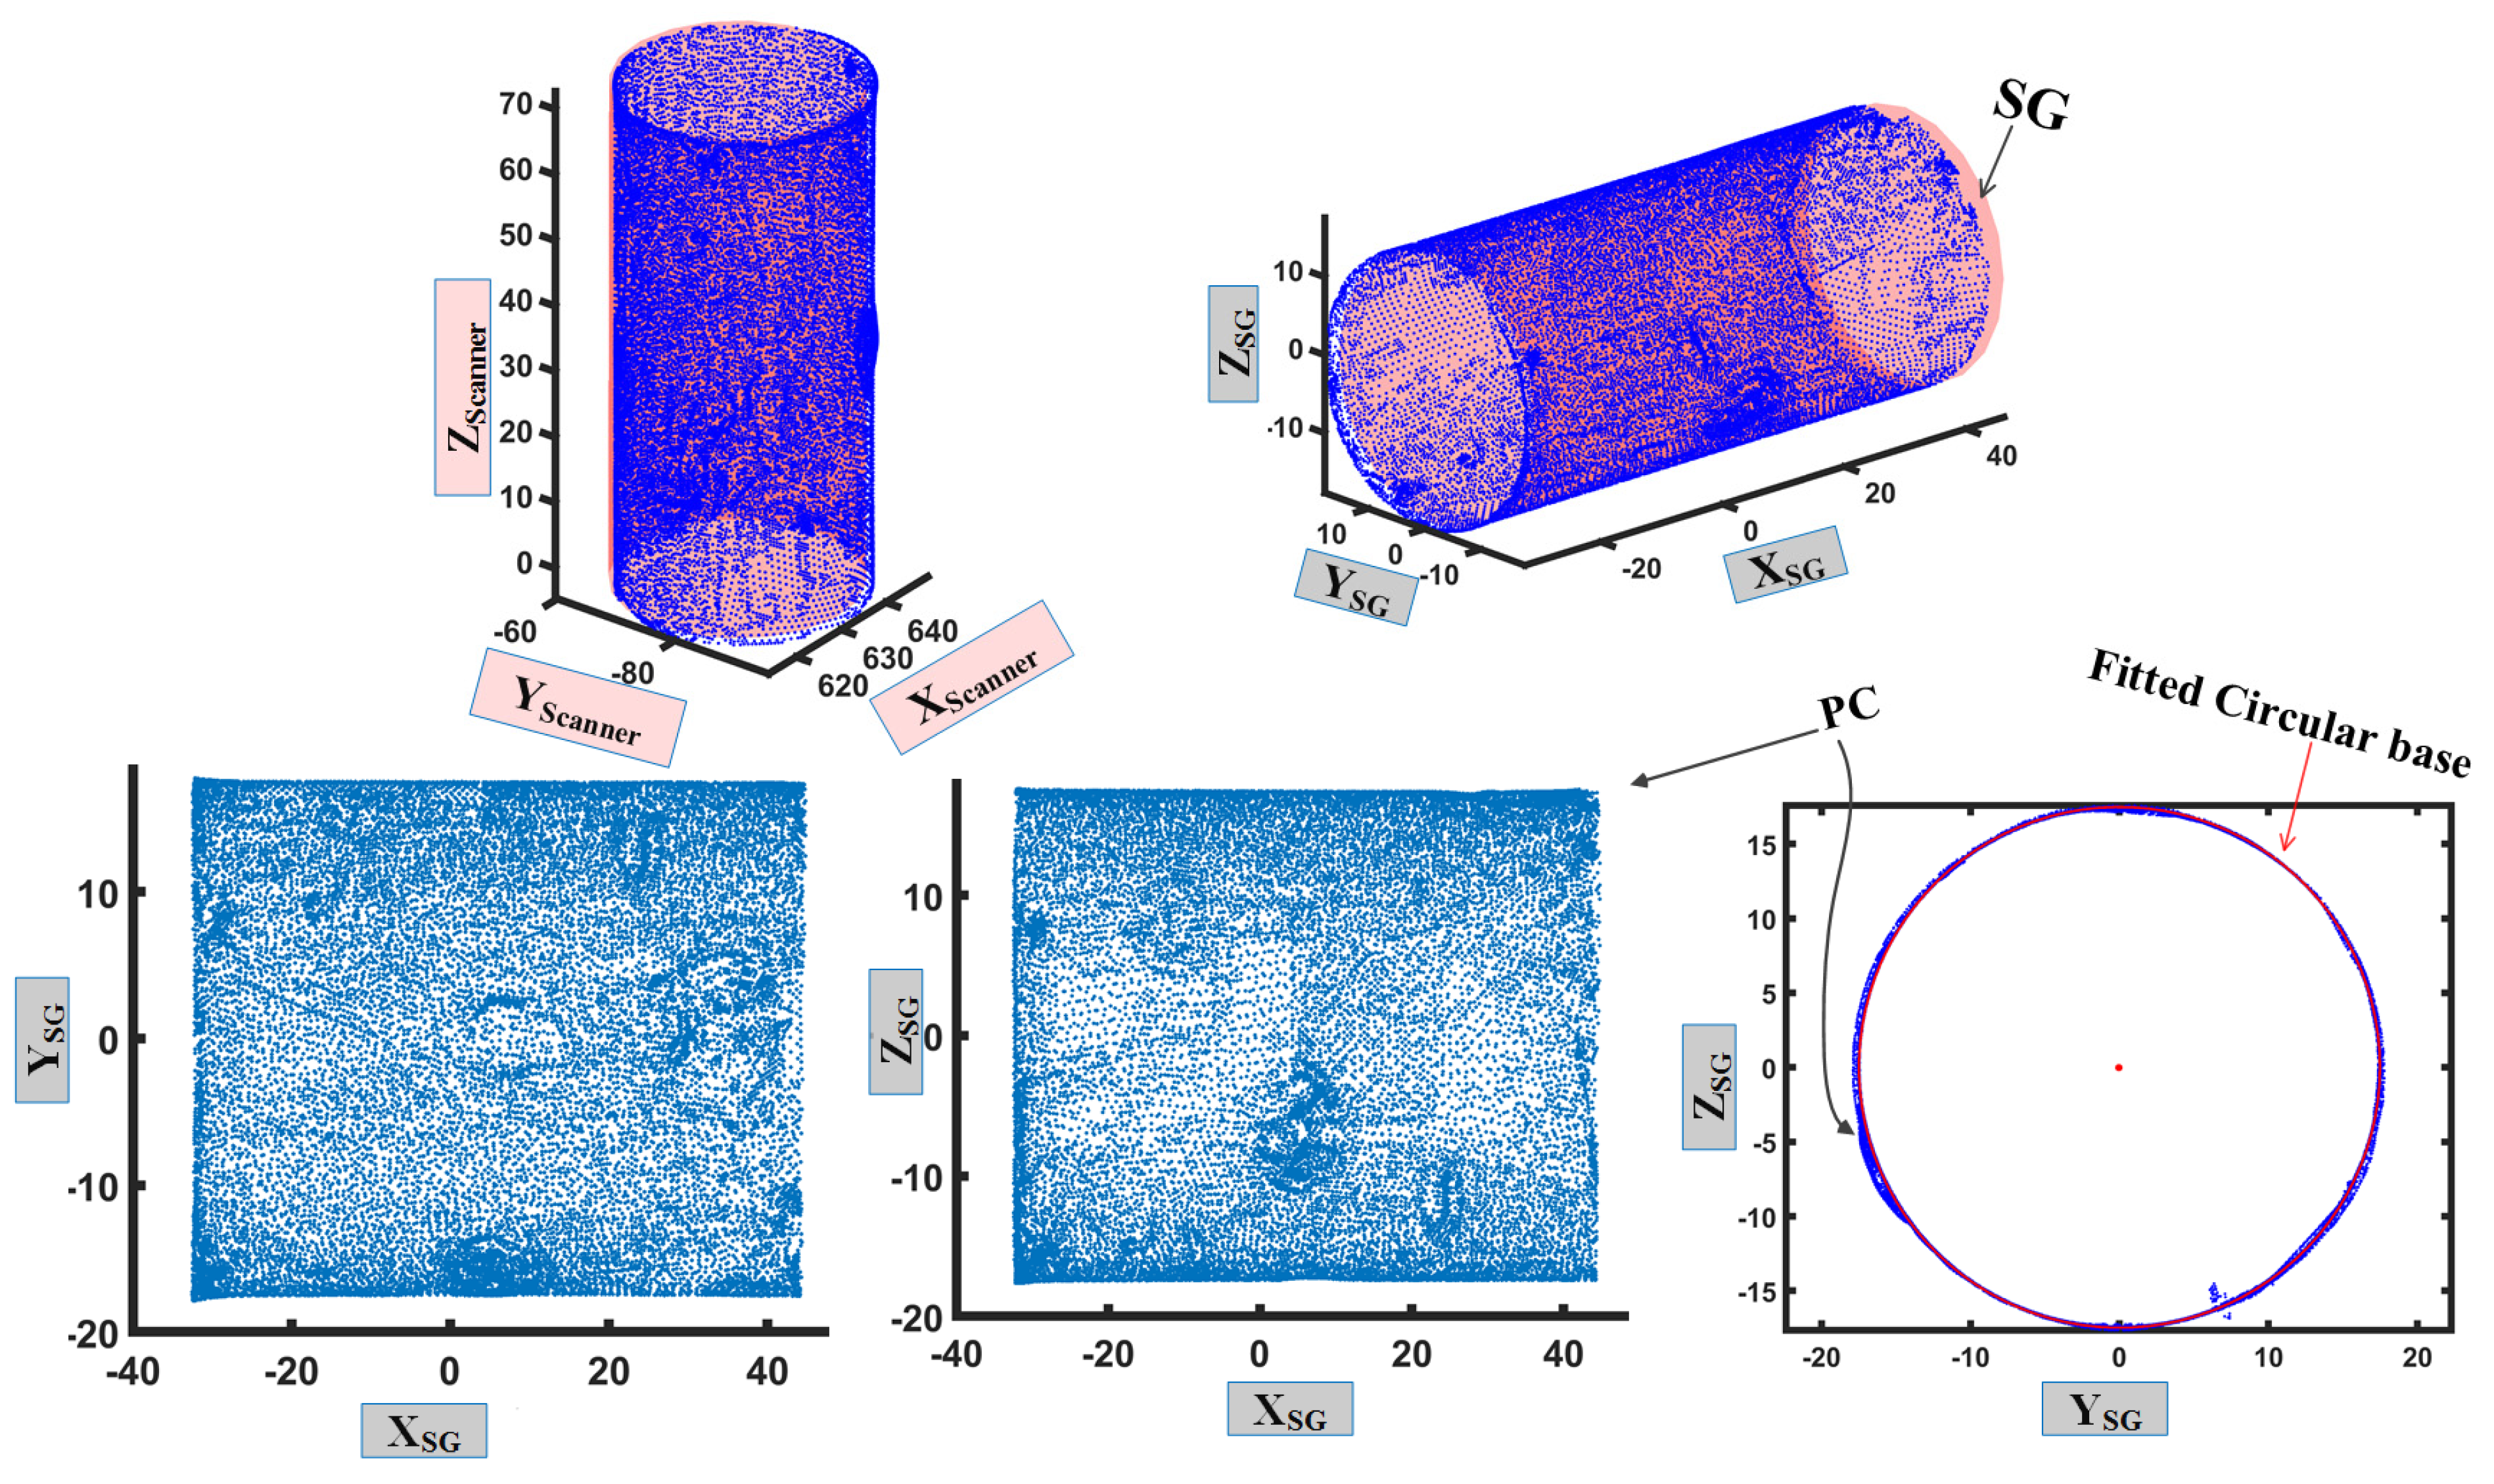
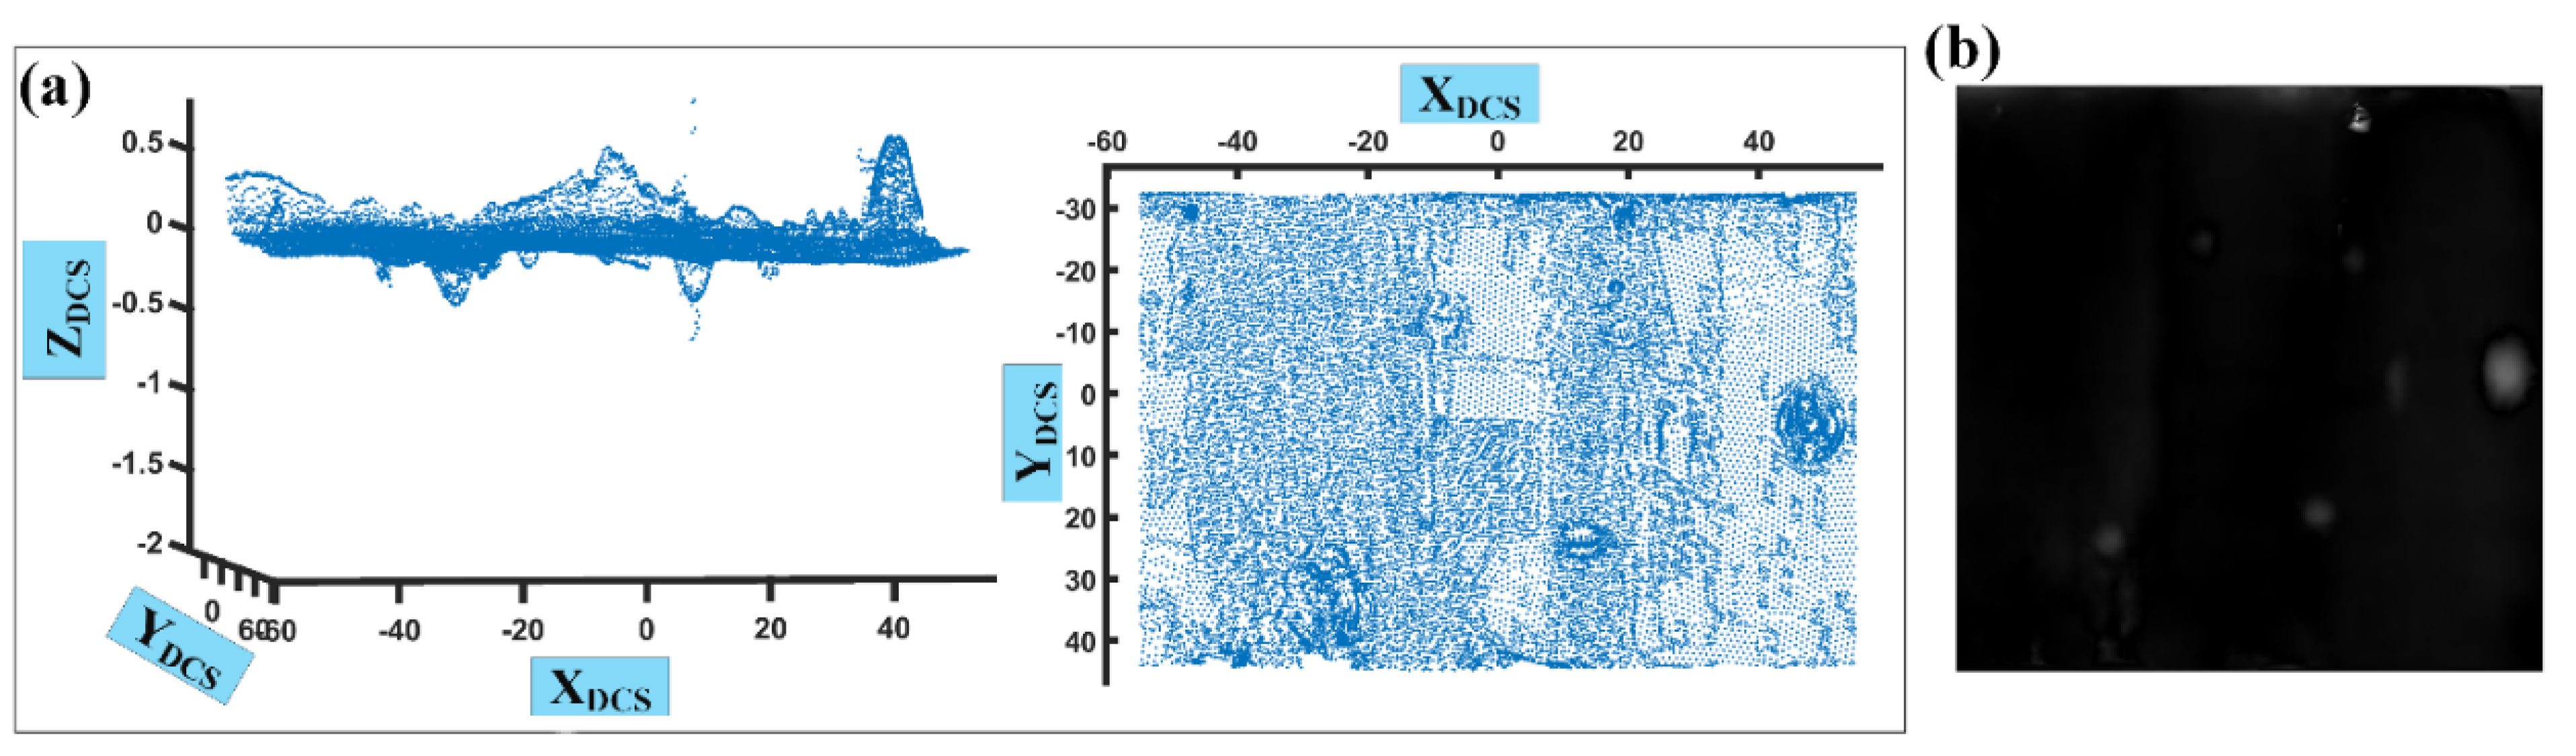
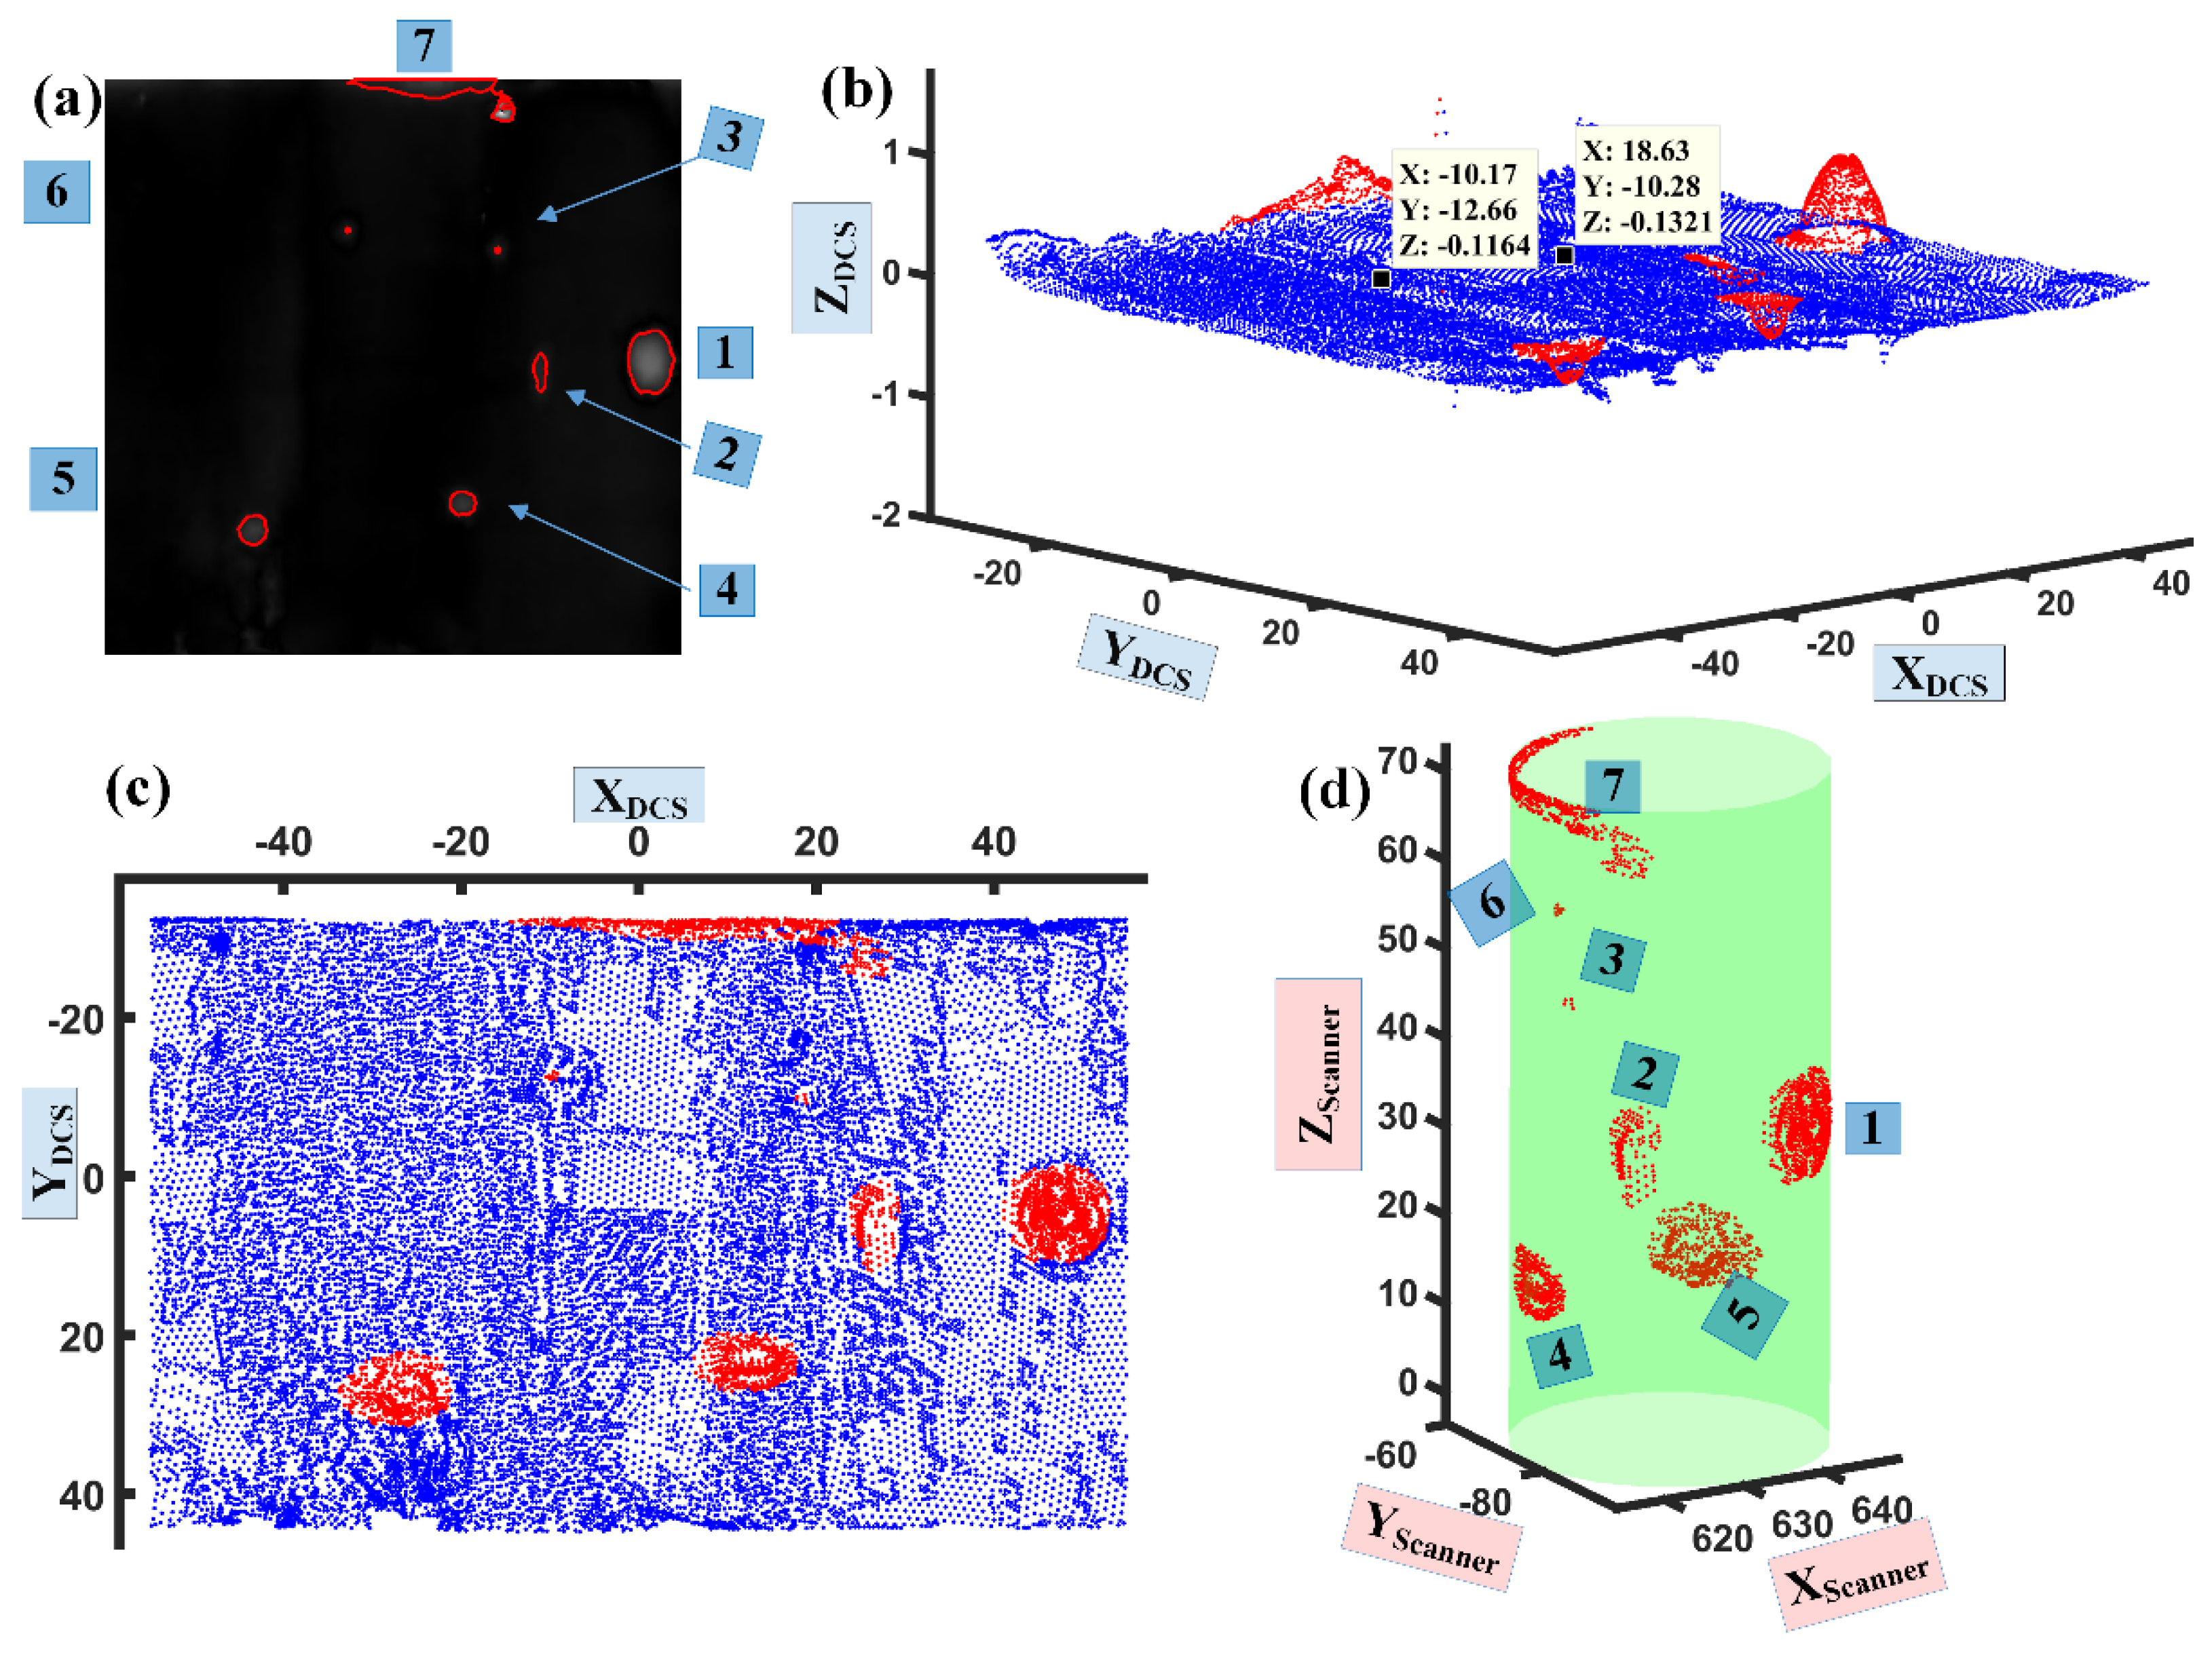
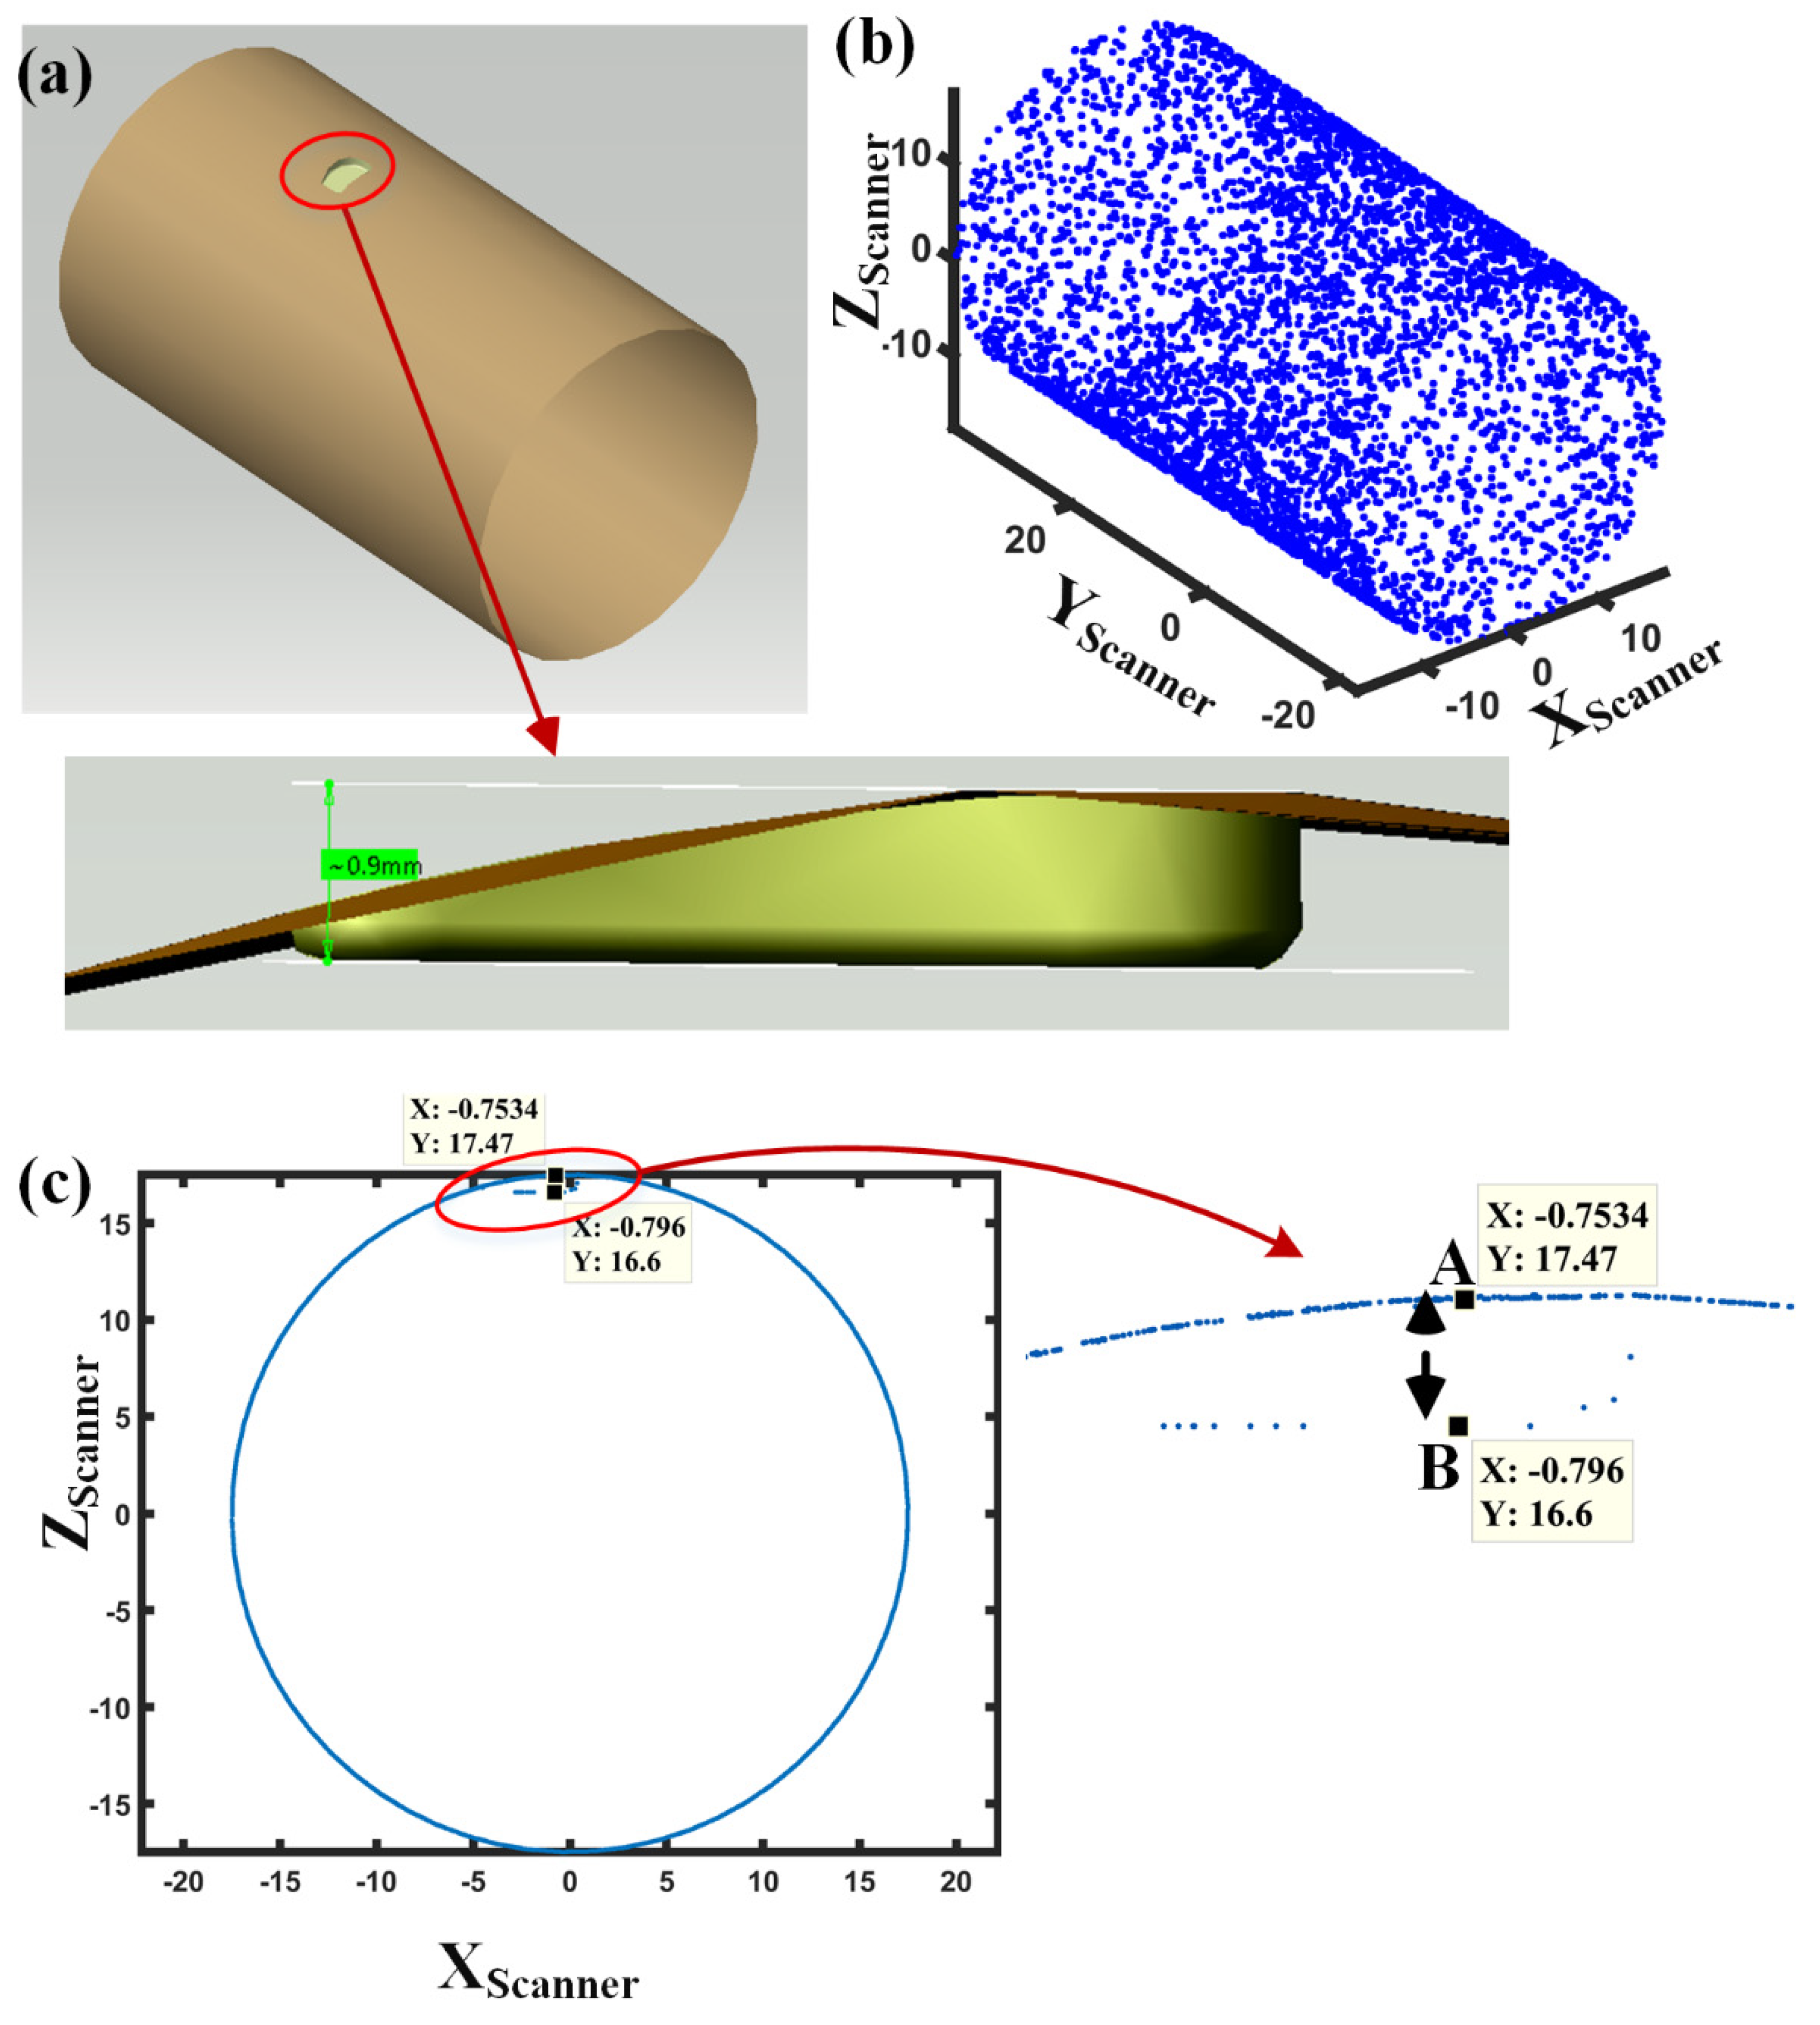
3. Skin Imaging of Manufactured Cylindrical Surface
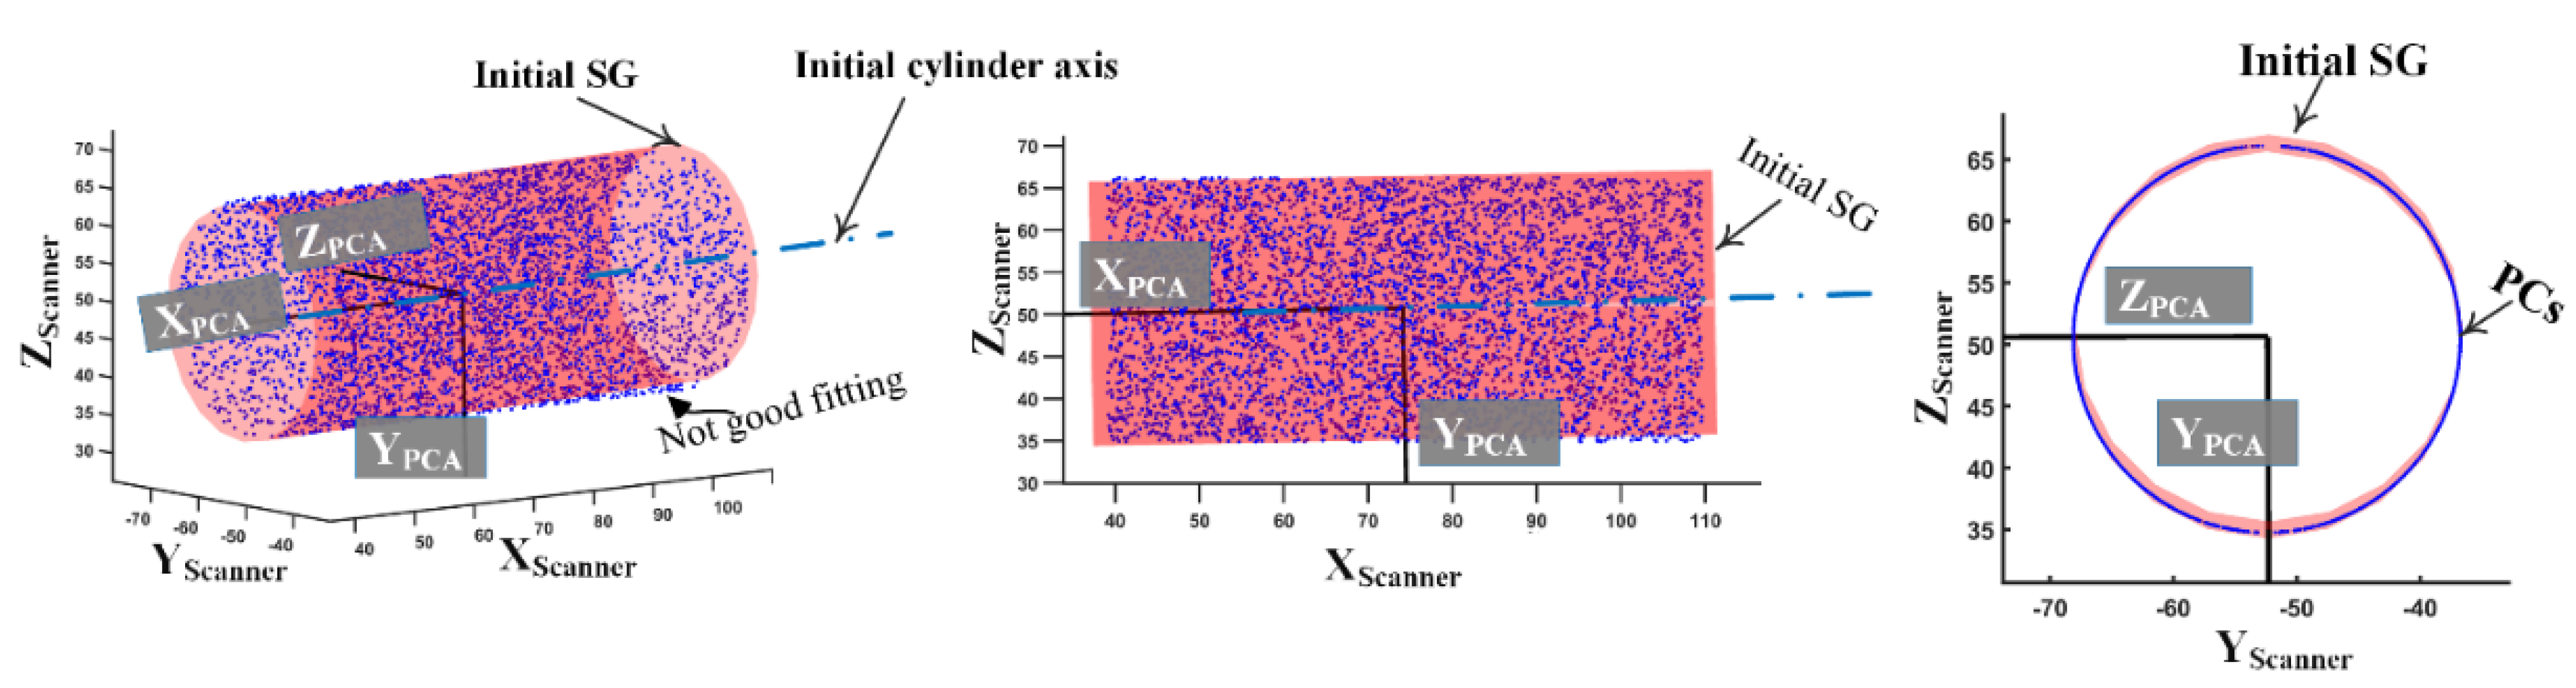
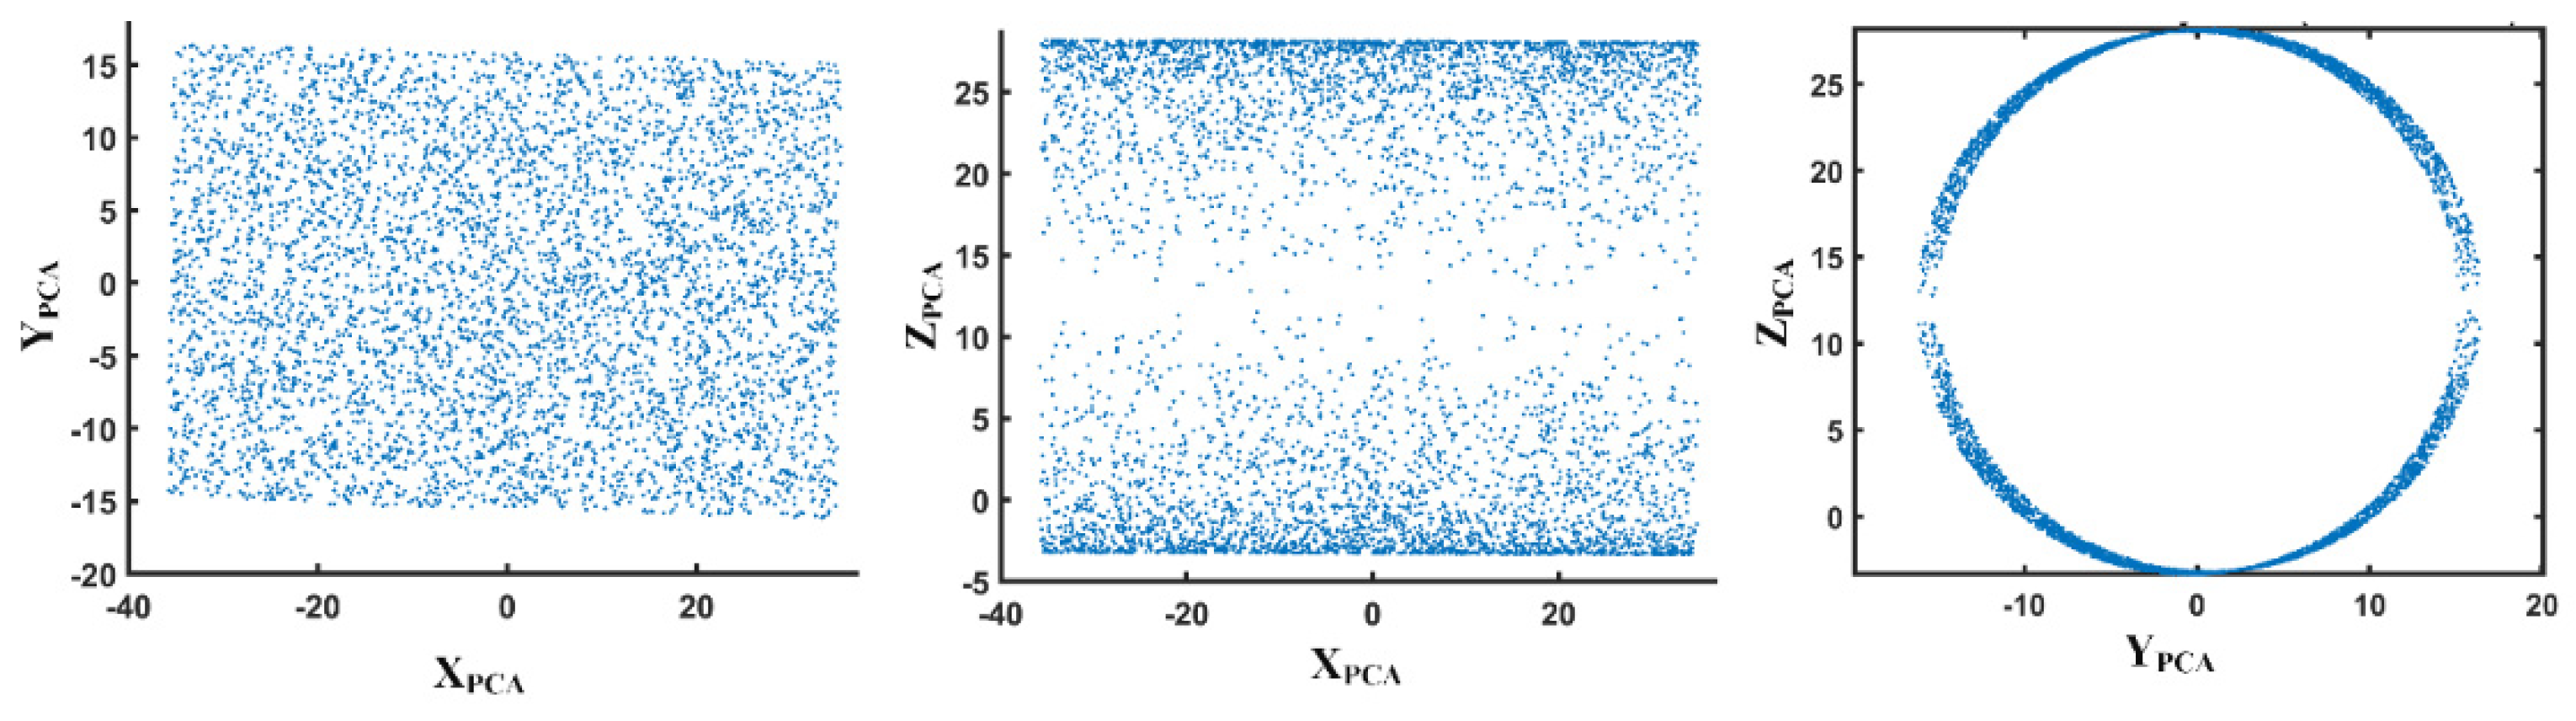
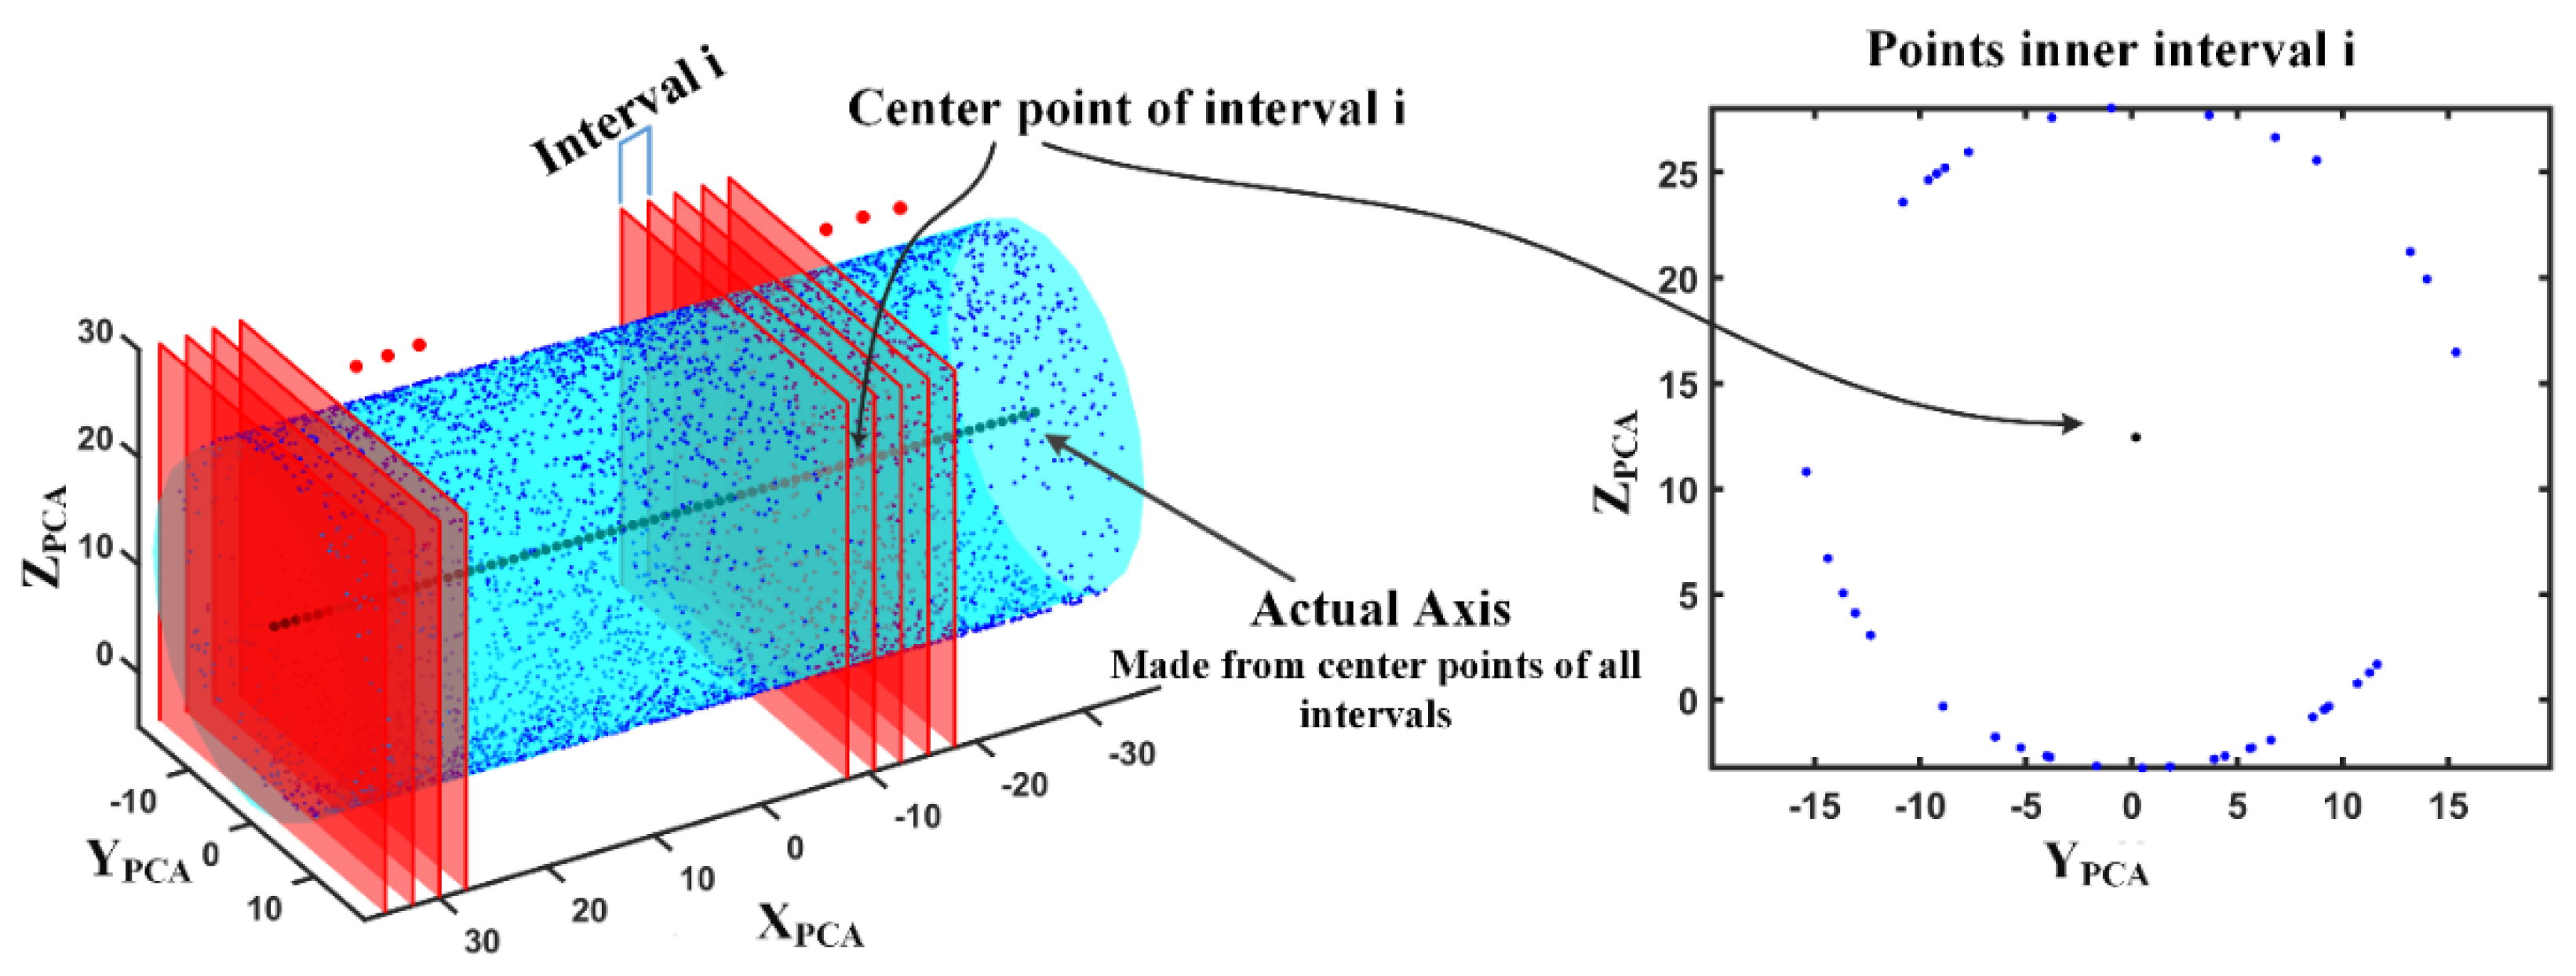
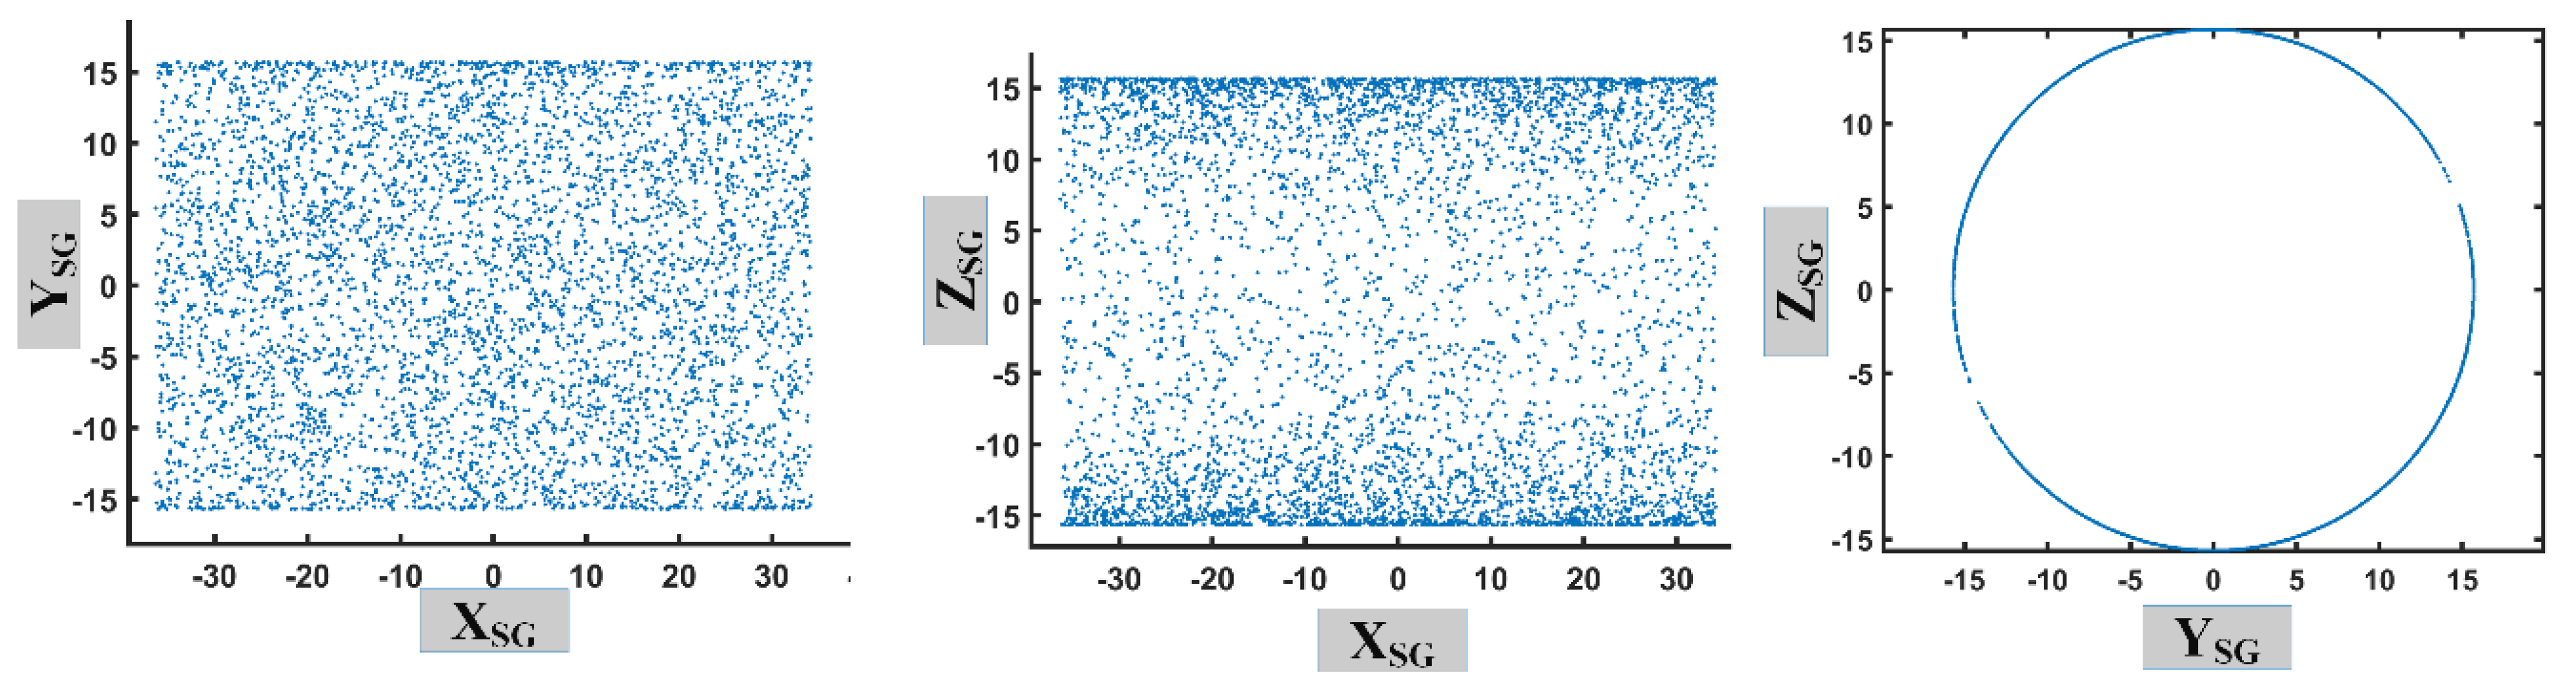
Deviation-Coordinate System generation for cylinder surface is carried out as follows.

3.1. SG Estimation

Fitting the best substitute cylinder to the PCs, obtained from surface of the manufactured cylinder, requires estimation of the cylinder’s axis orientation and its radius.
Initial estimation of cylinder’s axis: Conventional methods to find the axis of a cylinder, such as PCA and Robust PCA [49], can estimate the axis with approximate accuracy but this estimation requires a modification. Figure 4 illustrates the estimated axis for PC of an ideal cylindrical surface with Robust PCA method, which is not a satisfactory estimation and leads to faulty results in the next steps. Applying PCA-based methods on PCs of the cylinder surface, the principal that corresponds to maximum eigenvalue, i.e., XPCA, is the axis of the cylinder. According to Figure 4, the initial SG does not fit well on the PCs (blue points) and hence some parts of the points have pseudo deviation when they should not. This is clearly obvious in Y–Z view in Figure 4 that the fitted SG does not coincide with the PC in some parts. Figure 5 displays the PC after mapping to PCA coordinate system which again illustrates essentiality of the modification of the SG fitting process. It is noteworthy to say that the PCs are centered in the X–Y plane during mapping.
Modification of initial estimated axis: In order to modify the initial estimation of the axis, the initial fitted cylinder is divided to several small intervals along XPCA axis, which is the initial estimated axis of the cylinder. By considering the YPCA–ZPCA coordinates of data points inner each interval and fitting the best circle to them, the centers of the fitted circles make a line in space which is the actual axis of the cylinder (Figure 6). Rotating the initial fitted cylinder by the angle between this line and X axis, the modified axis of the cylinder is obtained.
The initial SG estimation with PCA method, i.e.,  x i P C A y i P C A z i P C A  in Equation (1) is then multiplied by the rotation matrix (Rθ) obtained through modification process to find the ultimate coordinates of fitted points i.e.,  x i S G y i S G z i S G  in Equation (2) (namely SG coordinate system). Figure 7 shows the result of mapping PCs to the ultimate coordinate system of fitted cylinder and declares the positive impact of modification procedure.
x i S G y i S G z i S G = x i P C A y i P C A z i P C A × R θ
In order to demonstrate the efficiency of the proposed SG estimation for the PC of any cylindrical surface, a PC, in which the axis of the cylinder is not even partially parallel with any of the axes of the measurement frame (scanner frame) is considered. Figure 8 shows the fitted cylinder (in red color) to this PC (in blue color) together with the SG frame on the original PC in different views in scanner coordinate system; as expected, the obtained XSG is the axis of the cylinder.
Radius estimation: After accurate estimation of the cylinder axis, considering the YSG-ZSG coordinates of all data points the best circle is fitted by a linear least squares approach proposed in [50], which is robust to outliers. Therefore, the radius of the fitted cylinder (RC) is attained.

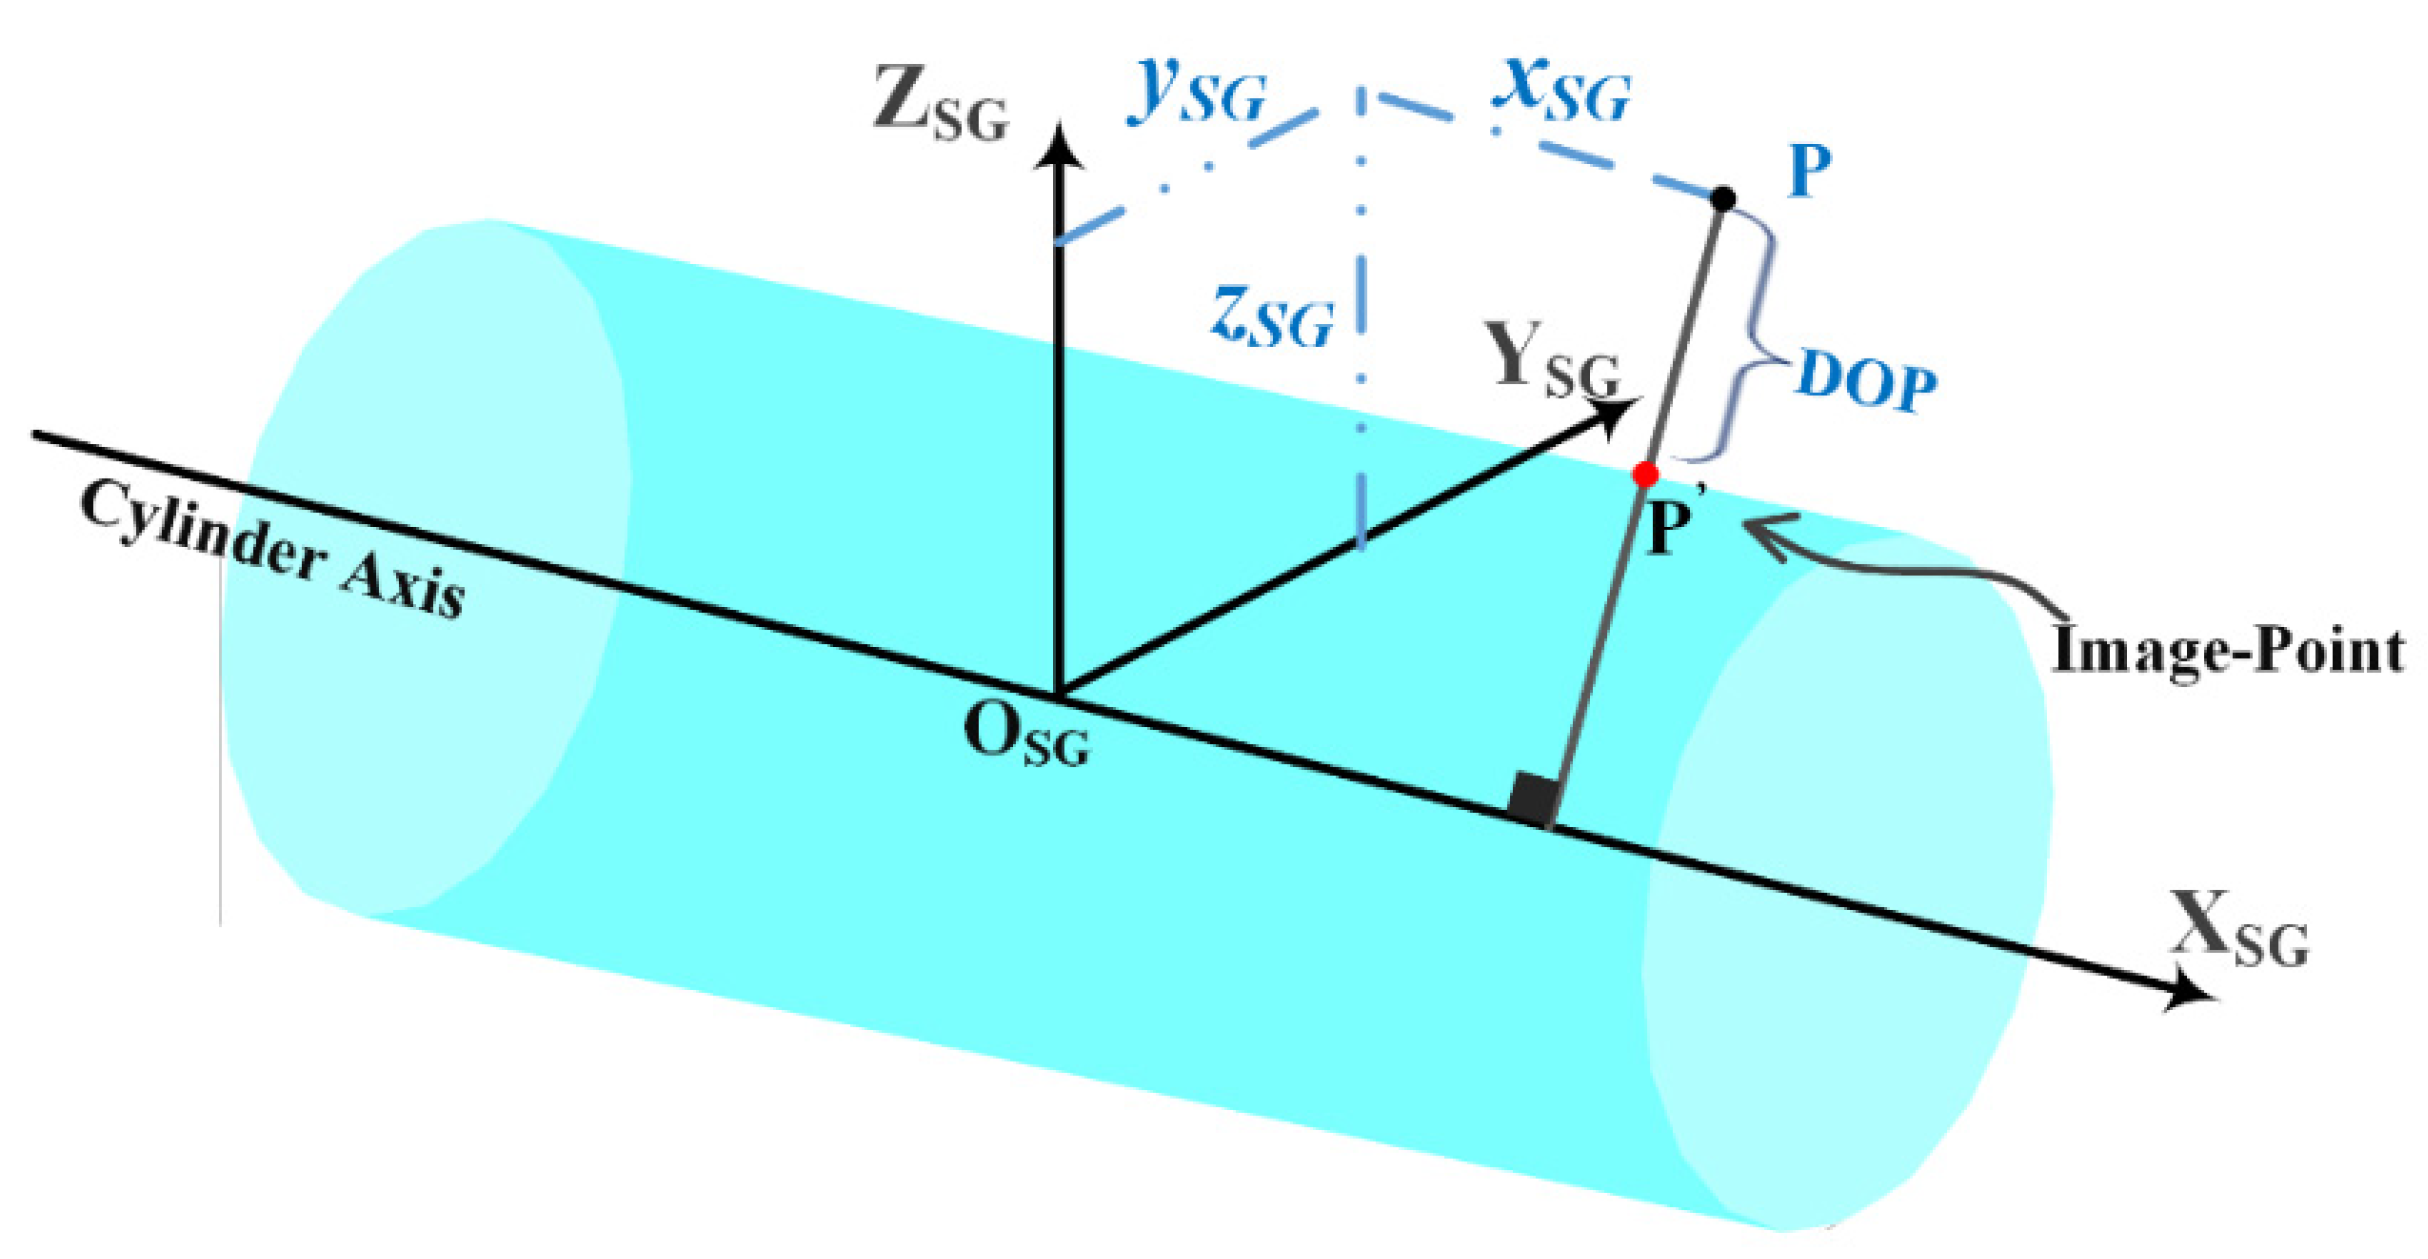
3.2. Image-Point Finding and DOP Calculation

Considering the perpendicular line from each measured point (P in Figure 9) to the cylinder axis, the intersection of this line and the fitted cylinder surface is the Image-Point (P’). Moreover, the calculation of the deviation of every point from the fitted surface is carried out as:
D O P = y S G z S G R C
where  x S G y S G z S G  is the coordinate of P in SG frame.

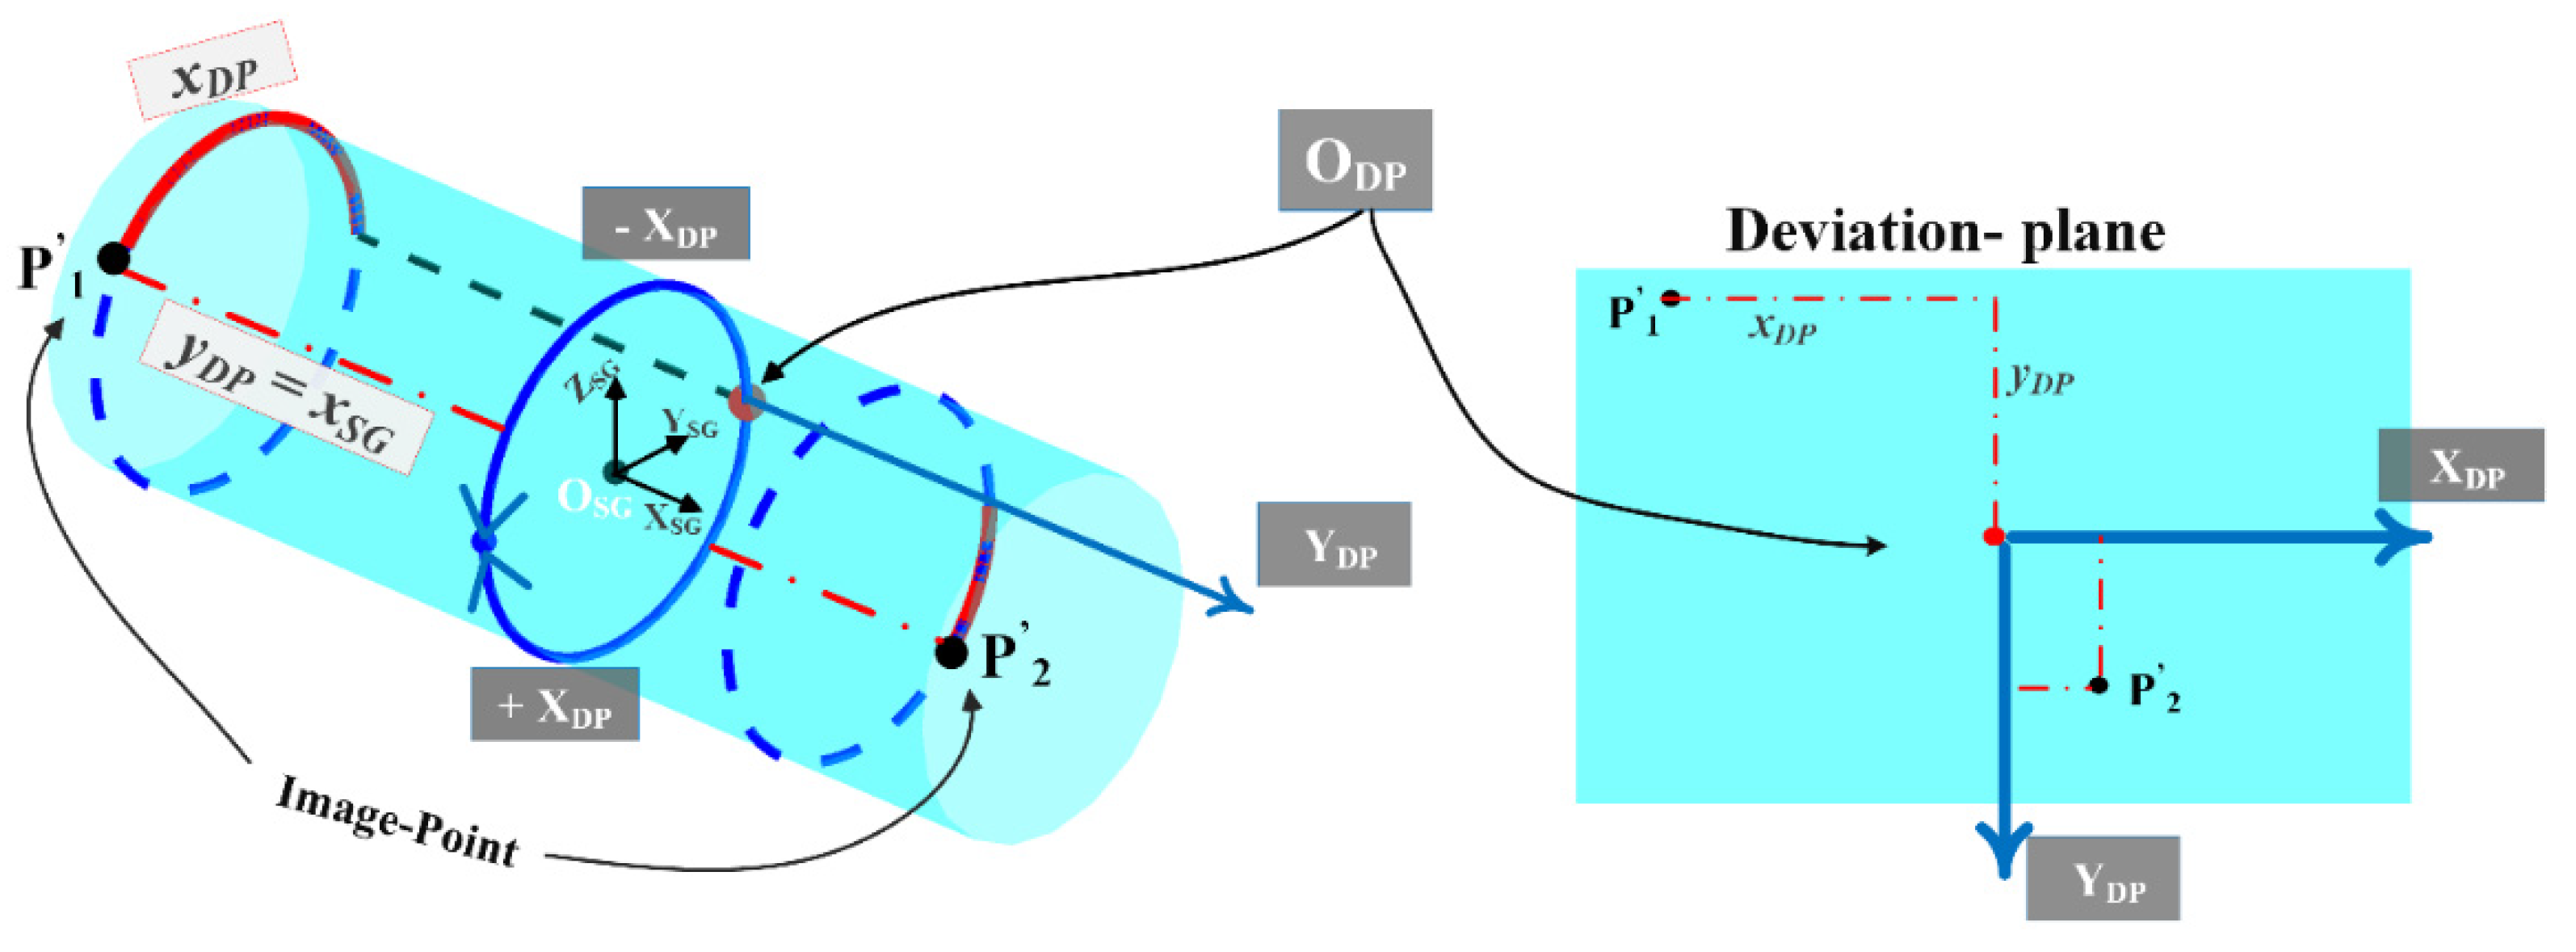
3.3. Deviation-Plane Generation

The idea is to unfold the fitted cylinder into a flat rectangle as Deviation-Plane, and then localize all the surface’s image-points on it. The image-point’s coordinate in SG coordinate system has been obtained as  x S G y S G z S G . The aim is to find its corresponding point  x D P y D P  on the Deviation-Plane. Figure 10 illustrates Deviation-Plane definition and localization of the Image-Point on it. The length of the deviation plane is equal to the perimeter of the circular base of the cylinder, and the width of the deviation plane is the same as the cylinder axis length. Considering the SG coordinate system, the intersection of the positive direction of YSG axis and the fitted cylinder is defined as the origin of the Deviation-Plane coordinate system (ODP). The line passing from this point and parallel with the cylinder axis defines the YDP axis; in other words, xSG of each image-point is substituted for yDP of its corresponding point on the deviation plane. Furthermore, the XDP axis corresponds to the perimeter of the cylinder’s circular base at OSG. Moreover, in order to determine the value of xDP on the Deviation-Plane for each point, the circular base at xSG is considered, then the length of the circle’s arc between that image-point and the intersection point of YDP axis on the considered circle is the desired value for xDP.

3.4. Deviation-Coordinate System Generation

By assigning a DOP of each measured point (Equation (3)), as the third coordinate to its corresponding localized point on the Deviation-Plane, defined in previous section, the coordinates of the point in the Deviation-Coordinate System, declared in Figure 3, are obtained, in which xDCS = xDP, yDCS = yDP, and zDCS = DOP.
Having the Deviation-Coordinate system, skin image can be generated by conducting steps II and III of the skin imaging methodology explained in Section 2.

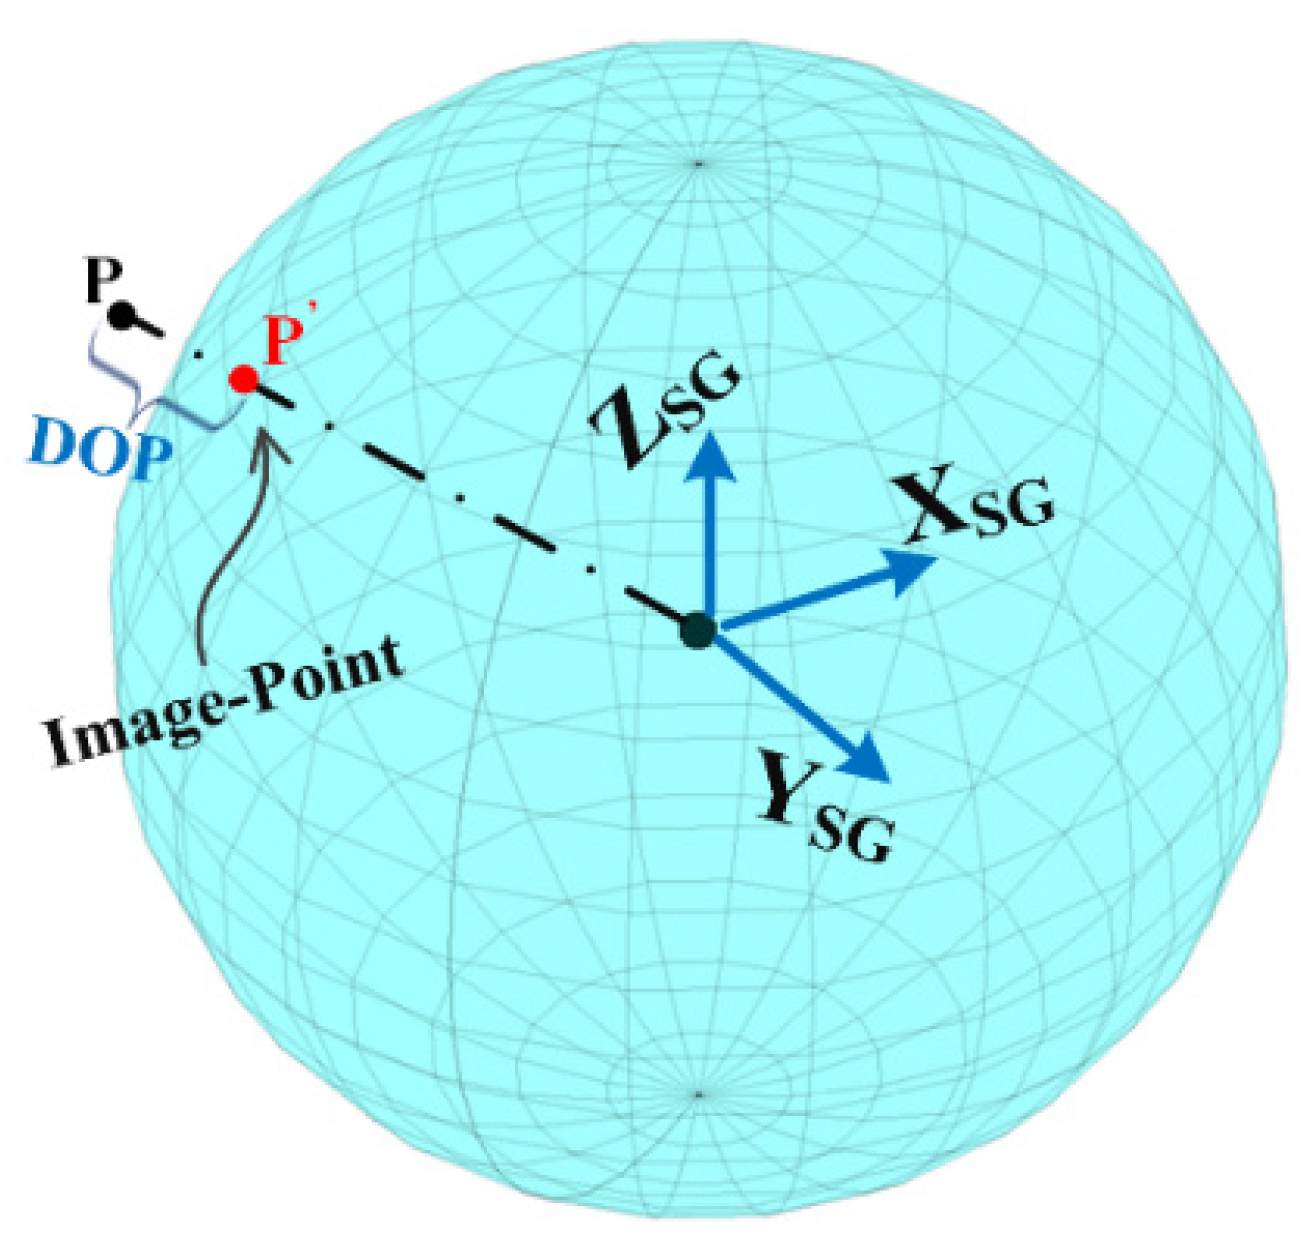
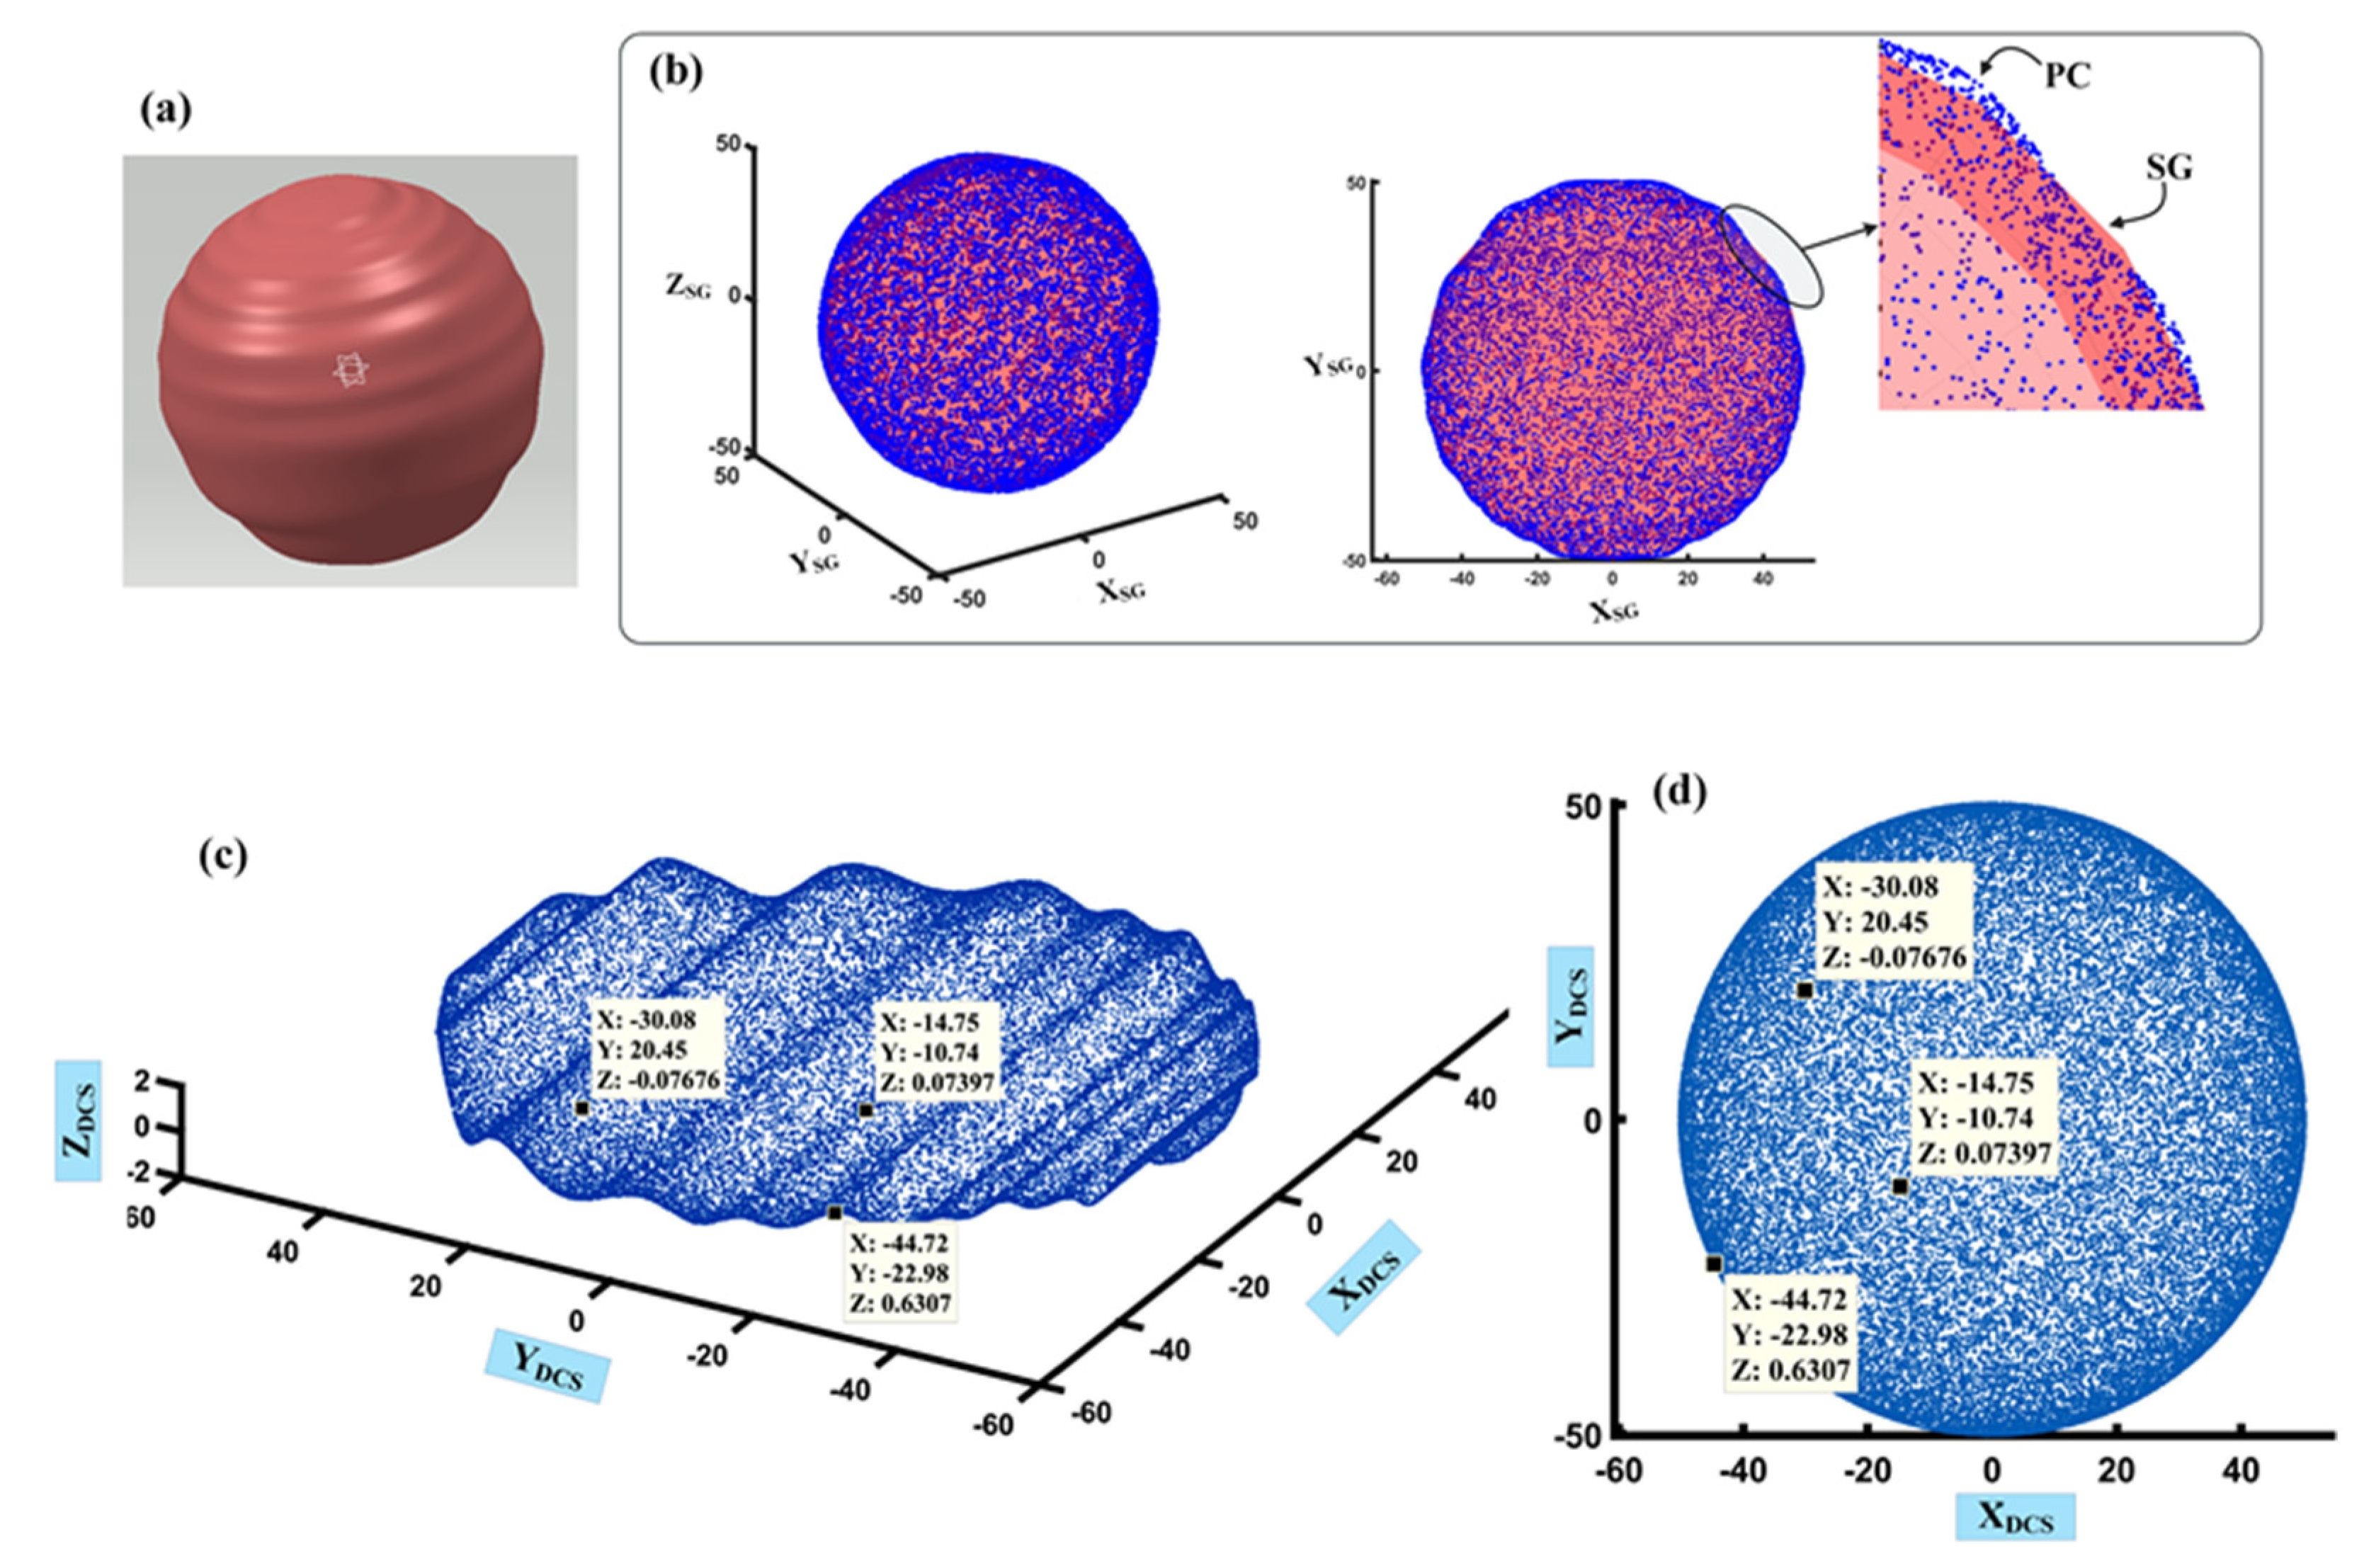
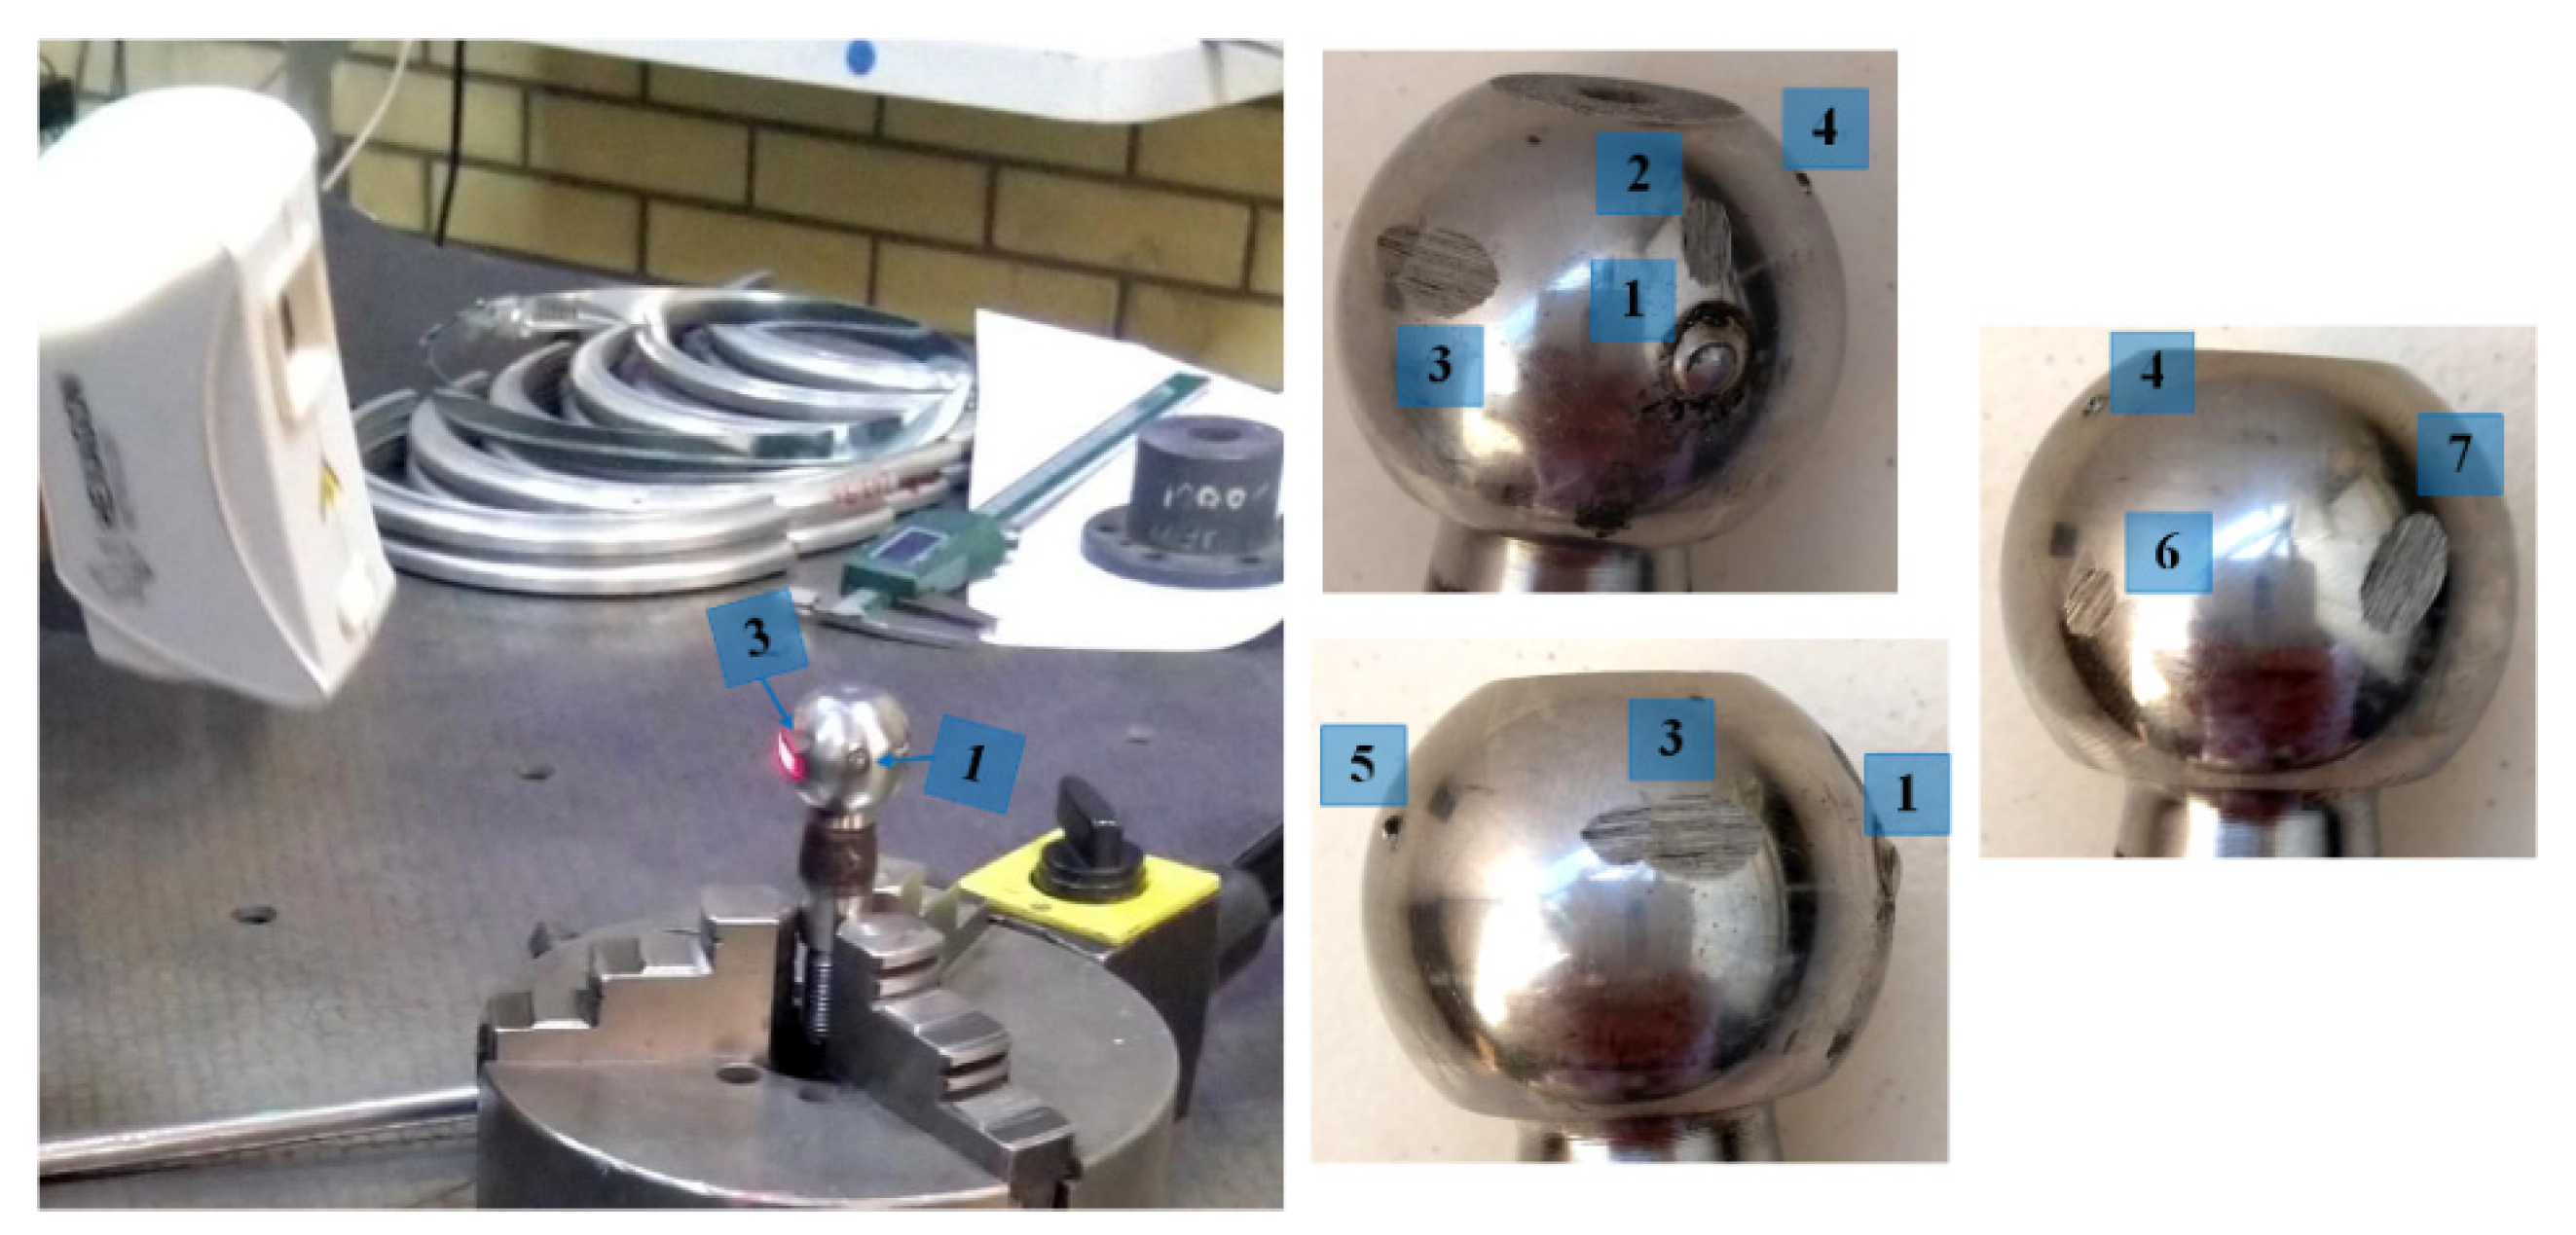
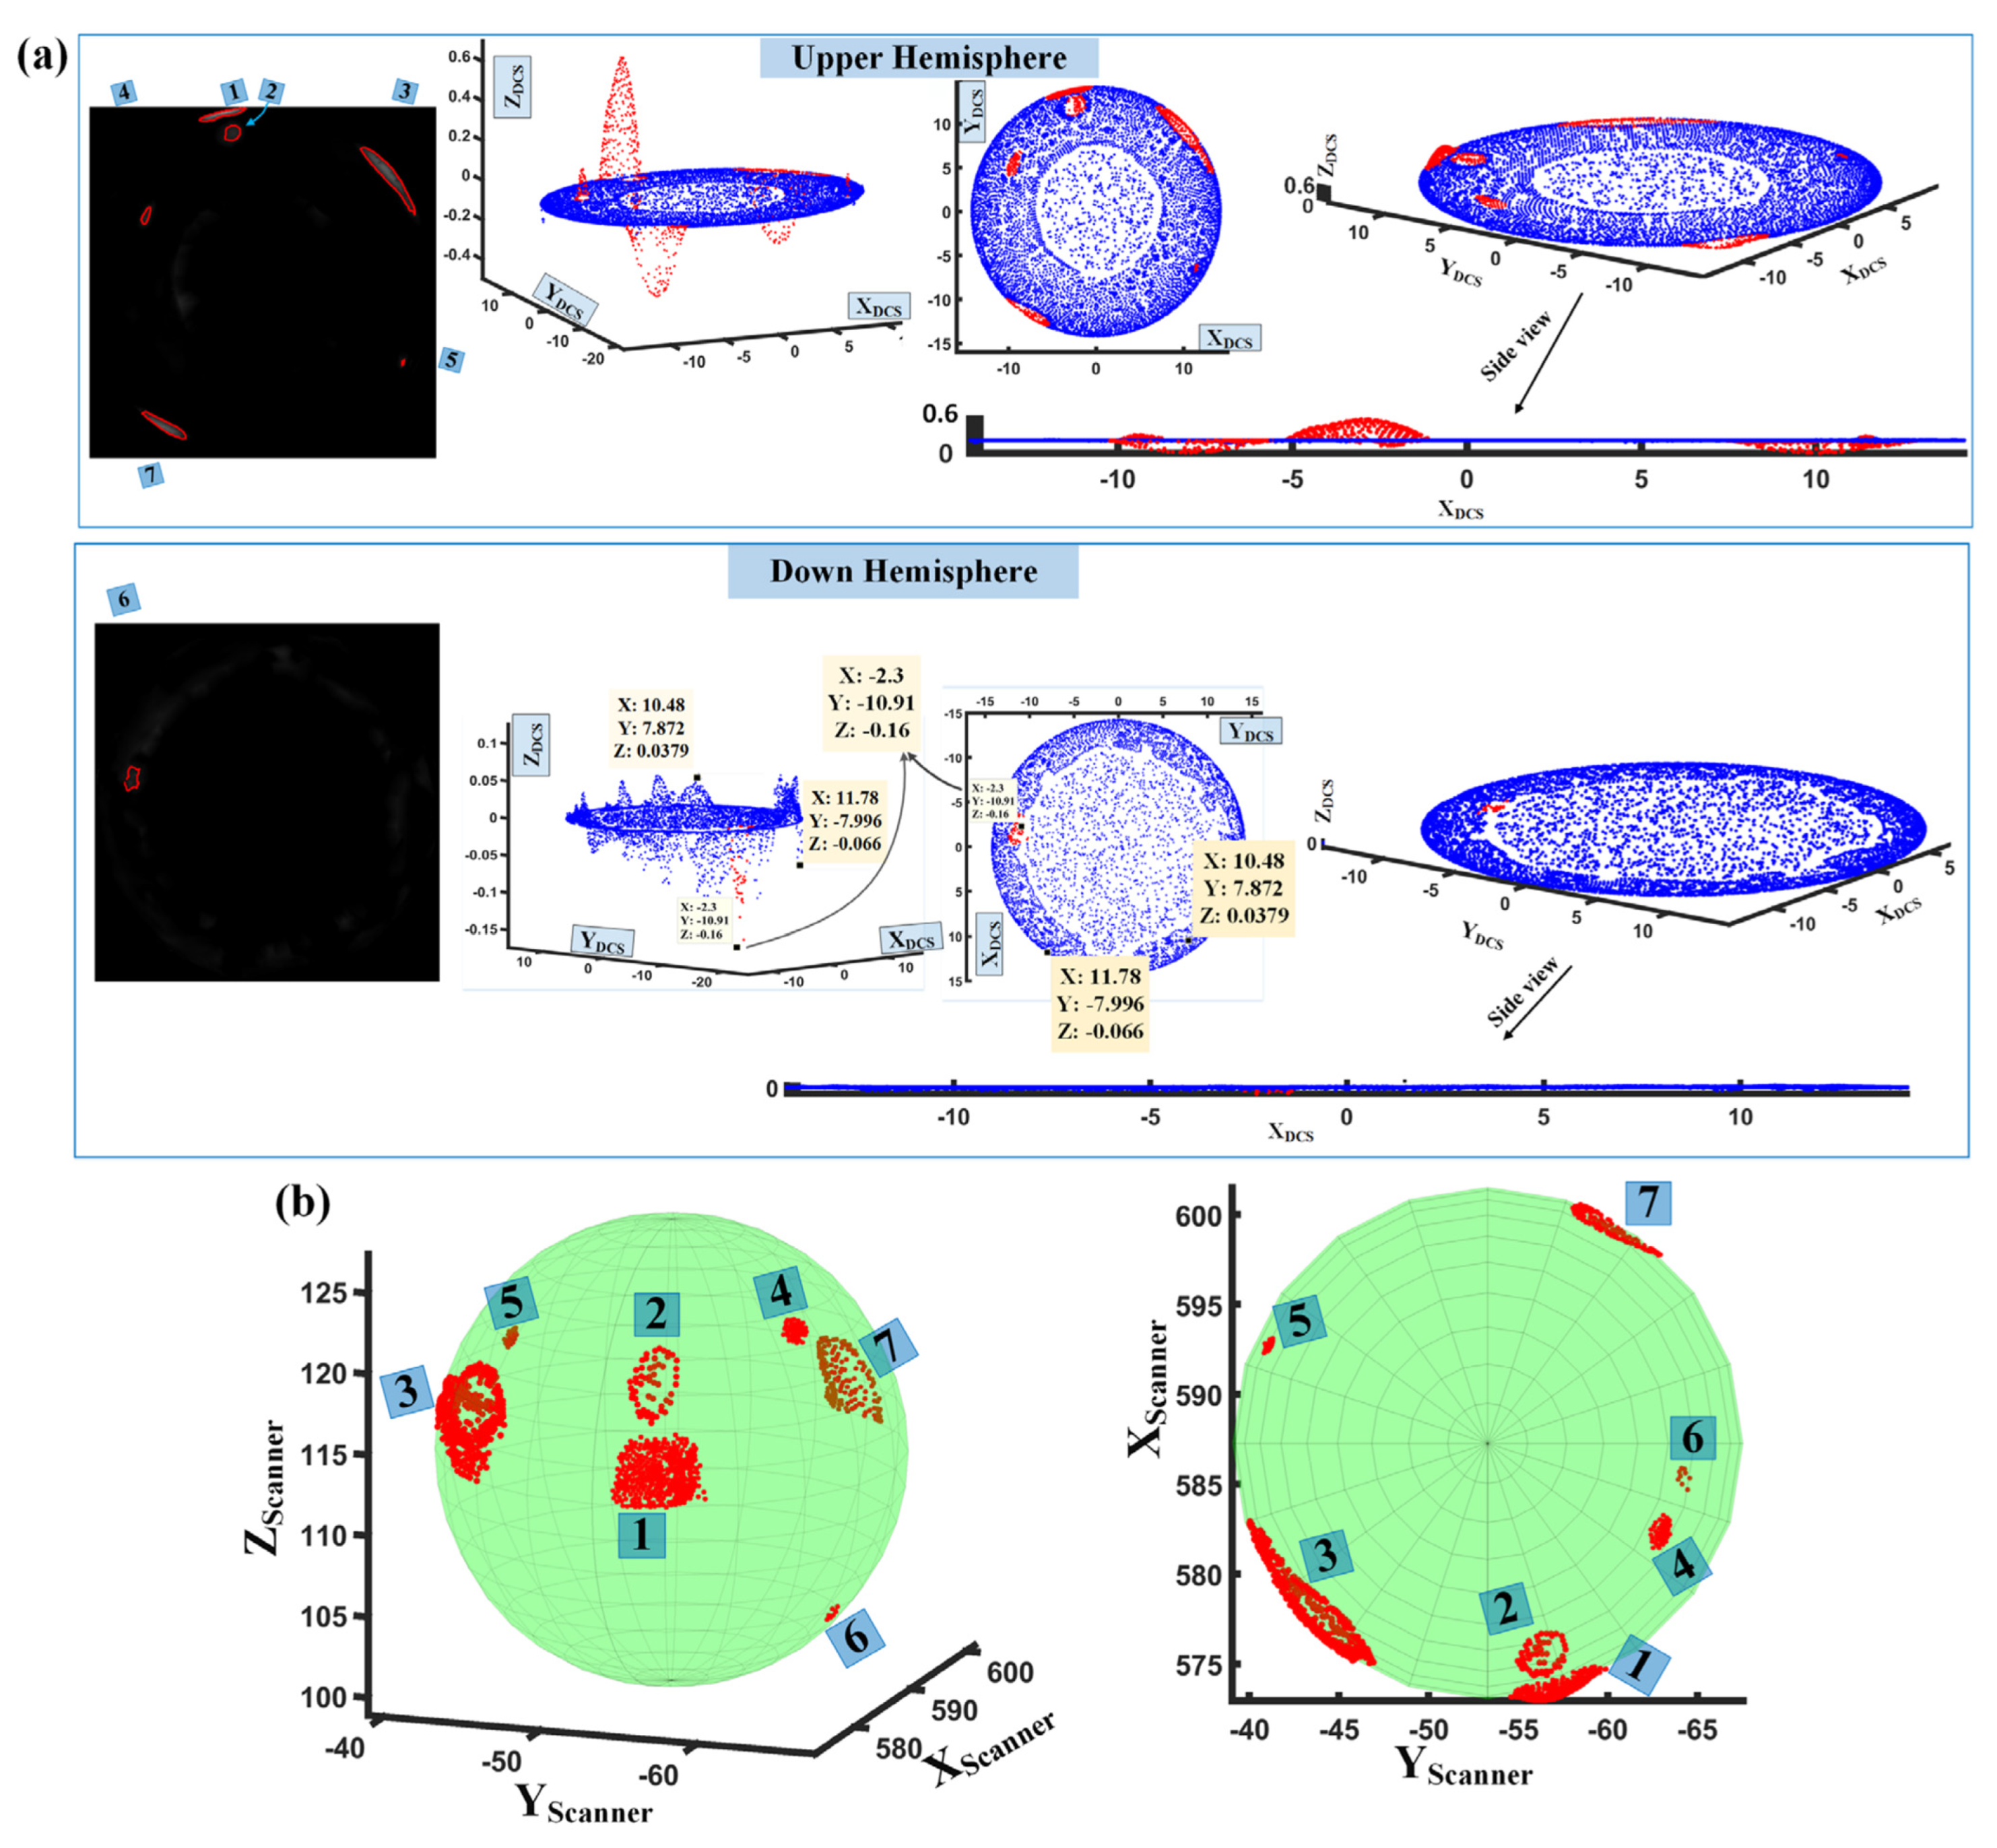
4. Skin Imaging of Manufactured Spherical Surface
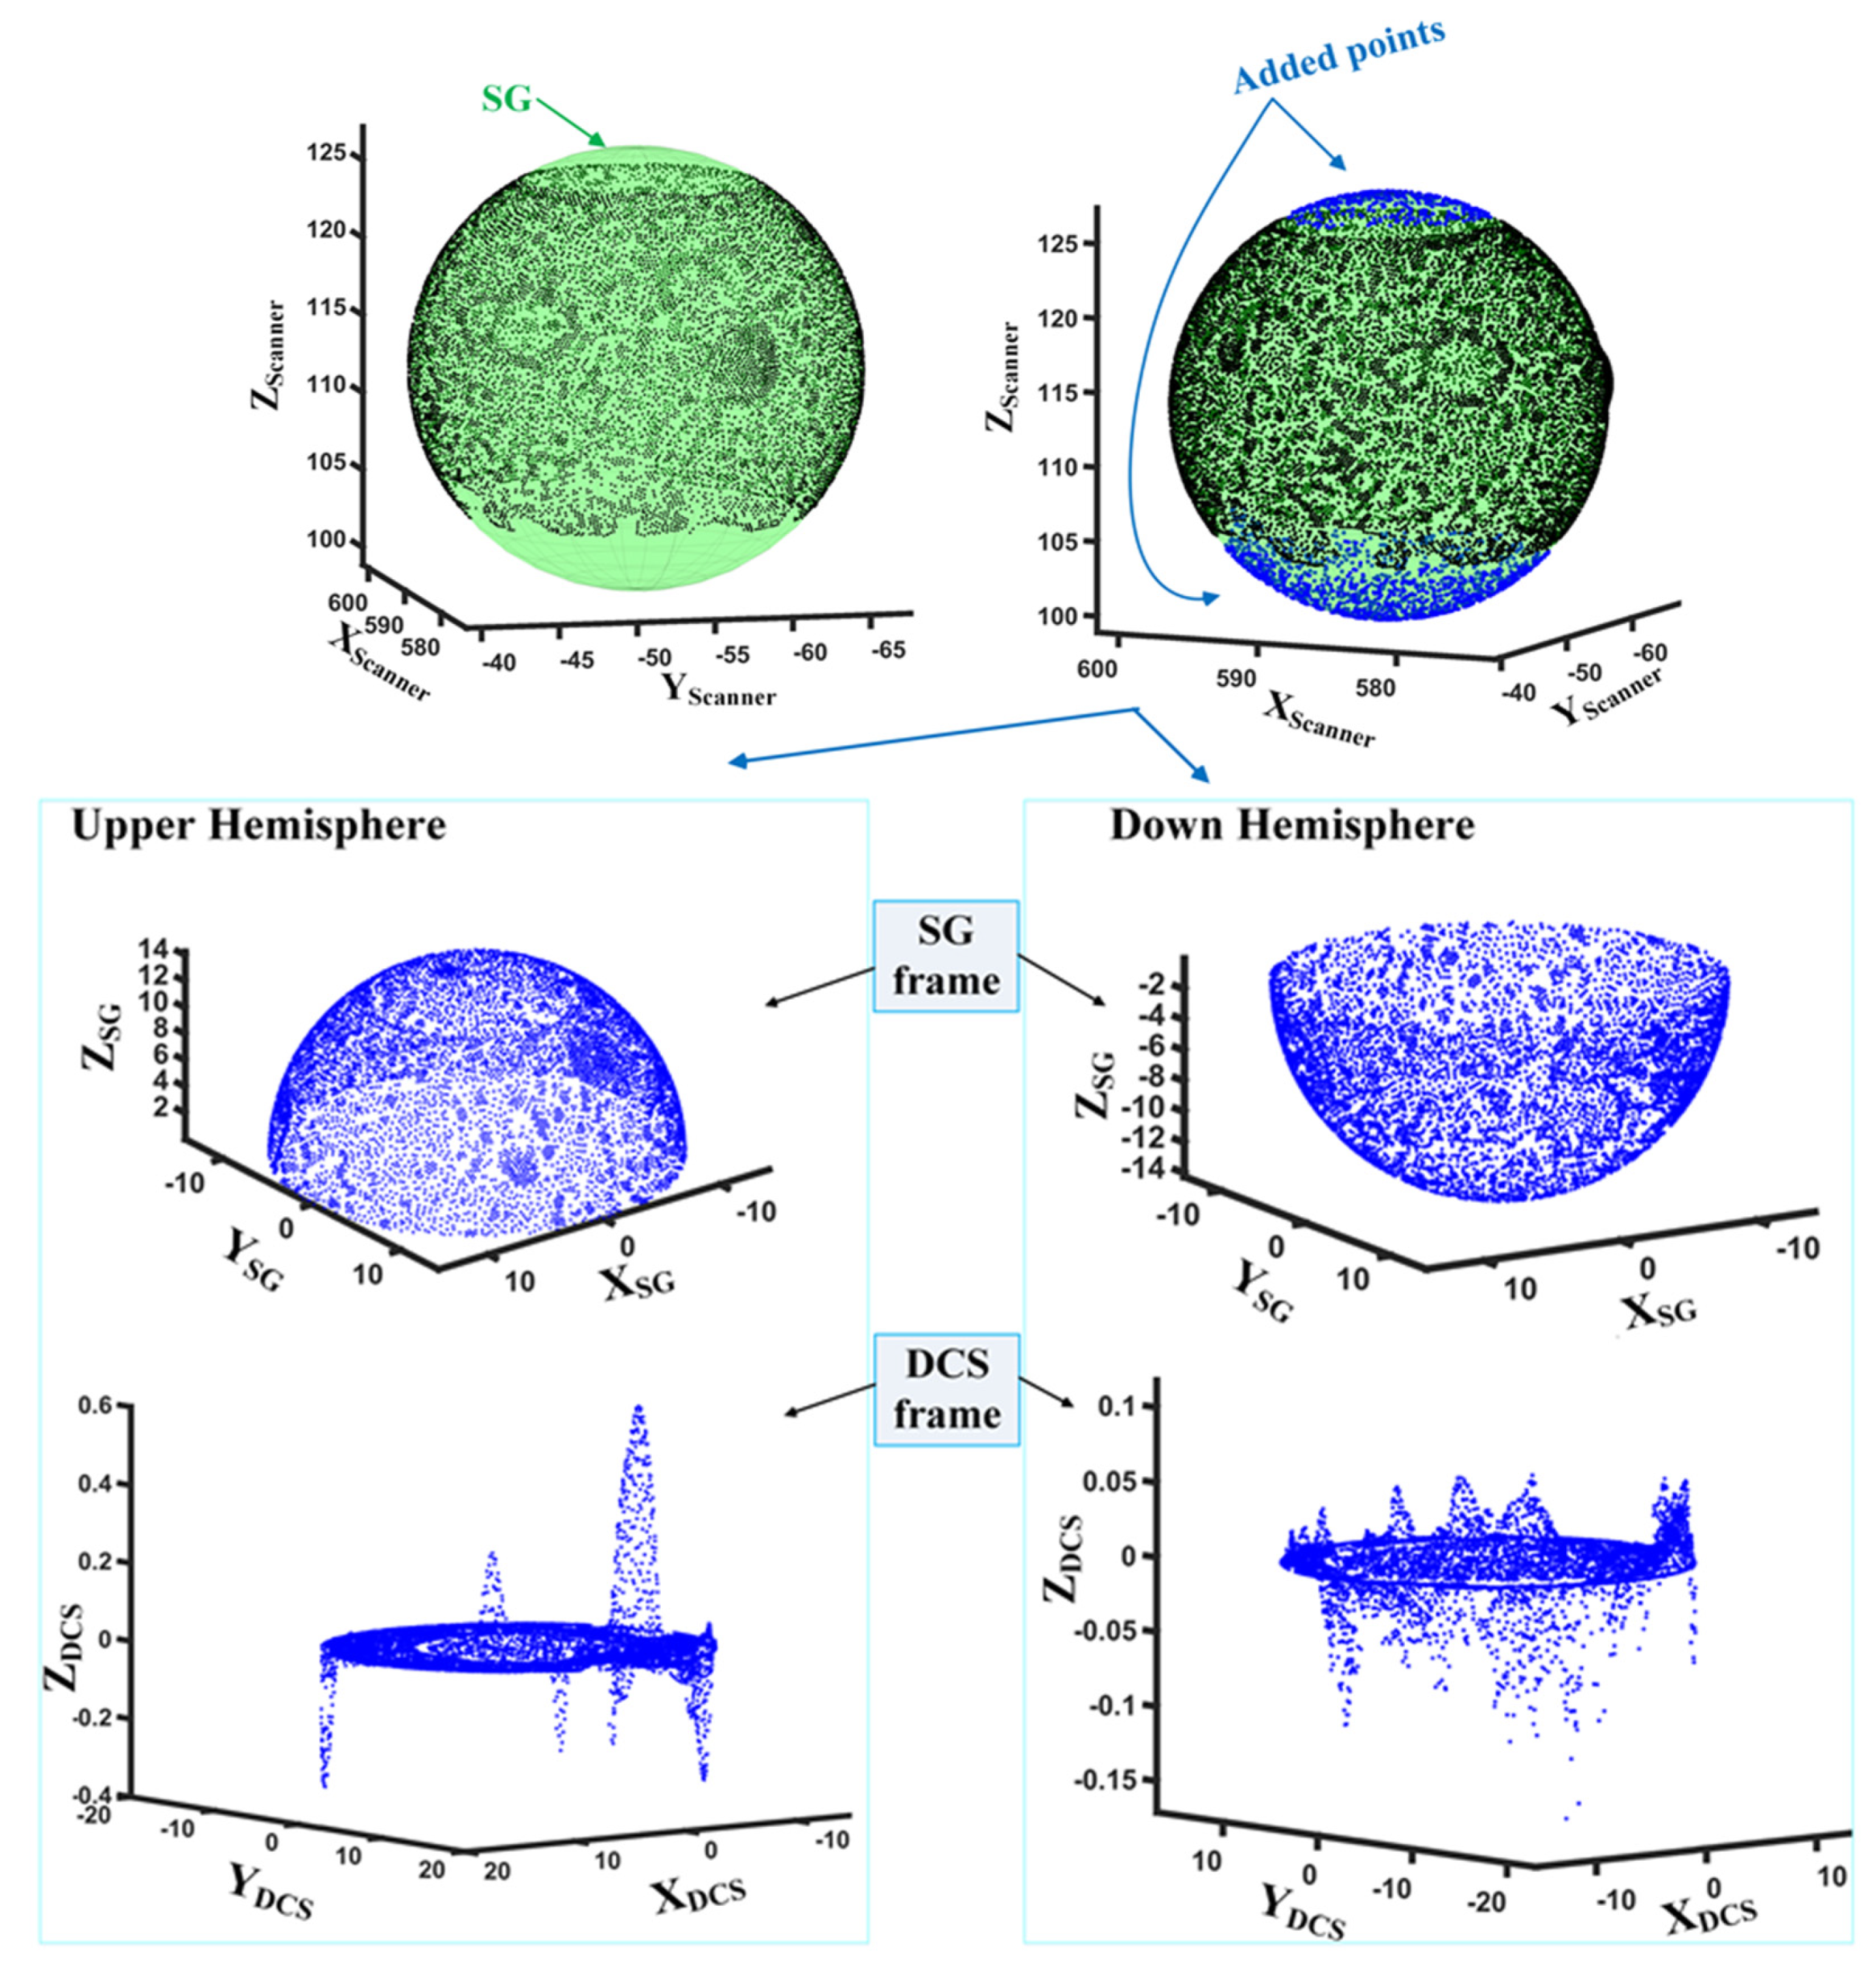
Deviation-Coordinate System generation for spherical surface is done as the following.

4.1. SG Estimation

The aim is to find the radius and the center of the best substitute sphere on the PC acquired from the surface of the manufactured spherical workpiece. The equation of the sphere is:
( x i x ¯ ) 2 + ( y i y ¯ ) 2 + ( z i z ¯ ) 2 = R S 2
where  x i y i z i  and  x ¯ y ¯ z ¯  are the coordinate of ith measured point and the center of the fitted sphere, both in the scanner coordinate system, respectively. RS is the sphere radius. Expanding and simplifying Equation (4) gives:
α x i + β y i + γ z i + η = x i 2 + y i 2 + z i 2
where:
α = 2 x ¯ β = 2 y ¯ γ = 2 z ¯ η = R S 2 x ¯ 2 y ¯ 2 z ¯ 2
Therefore, Equation (5) can be written as:
x i y i z i 1 A α β γ η X = x i 2 + y i 2 + z i 2 B
Using the least squares approach, the matrix of unknown variable (X) in Equation (6) and hence the center and radius of the fitted sphere are attained. Figure 11 shows the best-fitted sphere on the PC of an ideal spherical surface.

4.2. Image-Point Finding and DOP Calculation

The normal line to the sphere surface passing through the measured point intersects the sphere at image-point (Figure 12). If the point in the SG coordinate system is defined as  x P S G y P S G z P S G , the deviation of the point from the fitted sphere is calculated as:
D O P = x P S G y P S G z P S G R S

4.3. Deviation-Plane and Deviation-Coordinate System Generation

In order to make the Deviation-Plane and then Deviation-Coordinate system for the spherical surface, the sphere is divided into two hemispheres by XSG–YSG plane which finally results in two skin images for the analyzing system. Notably, thanks to the traceability of the system, all the analyzed data on any skin image is returnable on to the 3D surface and no information will be lost.
For each hemisphere the Deviation-Plane is generated directly by considering  x P S G y P S G  of the image points located on it. In fact, the Deviation-Plane is a circular plane which has the same axes as XSG and YSG axes of the fitted sphere. Afterwards, the Deviation-Coordinate system of each hemisphere is generated by assigning DOP of the measured point (Equation (7)), as the third coordinate to its corresponding localized image-point on the Deviation-Plane of the hemisphere. This step will be explained with examples in Section 5.1. Once the Deviation-Coordinate system is generated, by conducting steps II and III of the skin imaging methodology explained in Section 2, the skin image of each hemisphere is made.

5. Experimental Results and Discussion

In this section the implementation of all the steps of skin imaging methodology on several case studies is shown and discussed together with the analyzing procedure of the generated skin image in order to investigate the geometric deviation behavior of the manufactured surfaces. All the steps are run automatically, and the method is compatible with the inspection data collected by any typical coordinate metrology machine that provides the XYZ information of some discrete measurement points from the inspected surface. Section 5.1 deals with the skin image-generation procedures of the case studies and skin image analyzing for the purpose of the surface inspection will be discussed in the Section 5.2.

5.1. Skin Imaging of the Case Studies

Figure 13 shows a defective gudgeon pin, from which a set of PC data is acquired by a laser scanner. The imperfections are labeled on the figure. The best fitted cylinder (SG estimation step) to its PC is displayed in red color in Figure 14, both in the scanner coordinate system and SG coordinate system. Moreover, its PC in SG coordinate frame is shown in different views. As is clear, the fitted cylinder axis is obtained totally parallel with the XSG, while the axis of PC’s original coordinate system, i.e., scanner coordinate frame was not. This again demonstrates the efficiency of the modification step in SG estimation of the cylindrical surfaces discussed in Section 3.1.
Conducting the procedure discussed in Section 3.2, Section 3.3 and Section 3.4, the Deviation-Coordinate system for the gudgeon pin surface is generated (Figure 15a). Consequently, by applying the steps II and III of the skin imaging methodology (Section 2), the skin image of the scanned gudgeon pin is obtained (Figure 15b), which can be more processed to extract useful information about the surface deviation and therefore the manufacturing process that will be more discussed in the Section 5.2.
For more clarification of the implementation of skin imaging methodology on spherical surfaces, which has been discussed in Section 4, a spherical shape with a wavy surface is made (Figure 16a), from which a set of PC data is extracted. By fitting SG to its PC (Figure 16b), the Deviation-Coordinate system for its upper hemisphere is illustrated in Figure 16c and Figure 16d in the 3D view and X–Y view, respectively. The waviness of the sphere surface is completely clear on the generated Deviation-Plane. Afterwards the skin image of the upper hemisphere of this surface is generated, which is shown in Figure 17. Notably, for spherical skin image, there are four corners on the image, called void parts that are added just for completeness of the image and these parts are considered as the background and will not affect the surface inspection procedure.
As an industrial spherical surface, the PC of a defective suspension ball joint (Figure 18) is imported to the proposed system. After fitting the best spherical to the captured PC, some (virtual) points that are located on the fitted ideal sphere are added to the measured PC in order to fill the two sections on the surface that actually have not been designed to be manufactured in spherical shape. Then all points are mapped to the SG coordinate system. As is shown in Figure 19, the sphere is divided into two hemispheres with XSG–YSG plane, and the Deviation-Plane and Deviation-Coordinate system are generated for each hemisphere. Figure 20 presents the skin image of both hemispheres together with their points in the XDCS–YDCS view.

5.2. Skin Image Analyzing

Studying the behavior of the intensity of the skin image, the geometric deviation behavior of the manufactured surface is inspectable. In [45], it is demonstrated that by considering the intensity distribution of a skin image, e.g., the histogram graph, one can detect that the surface has general deformation or only has imperfection on some parts of it, and also by extracting the objects of the skin image can determine the location and the required characteristics of the local imperfections on the surface. For instance, in Figure 21 the histogram of the skin images generated in the previous section are shown. According to the figure, the histogram of the wavy sphere (Figure 21a) appears in a wide shape, while the histograms of the gudgeon pin (Figure 21b) and the suspension ball joint (Figure 21c,d) are in compressed form. This is because the wavy sphere is a deformed surface and its deviation gradually changes between ups and downs in a wide area, and consequently the intensity of its corresponding skin image gradually varies from a maximum value to a minimum in the whole image, in which almost all intensity bins have considerable counts. In contrast, for the two latter case studies just the defected parts have considerable deviations with respect to the surface which leads to a limited number of intensity bins with considerable counts in their histograms. The wide histogram represents a deformation on whole the surface (general defect), while the compressed histogram shows local defects existence on the surface.
The defective area of the surface appears as an object on the generated skin image due to its different deviation in comparison with its surrounding areas, which allows the use of image processing methods such as global thresholding in defect detection [45]. The defective regions of the surface are extracted from its corresponding skin image, and hence their locations are detected on the 3D surface, which can be reported to any manufacturing process upstream or downstream, as the most likely locations of the manufactured surface that are prone to the occurrence of crucial geometric errors such as out of cylindricity or out of sphericity. The accurate magnitude of the errors can also be reported. For instance, a wide histogram conveys the message that there may be crater tool wear in the machining process, which changes the cutting force and temperature. This affects the material properties and ultimately causes the deformation of the surface. Detected local geometric errors on the surface can be a sign of inappropriate clamping force, or excessive and uncontrolled cutting temperature that causes thermal expansion in the detected areas. It must be mentioned that the interpretation of the information that the skin image provides, depends on the specific desired application and not on the ones mentioned.
Figure 22a,d shows the detected imperfections of the gudgeon pin on its skin image and on the measured surface in the original coordinate system (scanner frame), respectively; the defects are also labeled according to the labels in Figure 13. Additionally, the defective regions are displayed in Deviation-Coordinate system of the points in Figure 22b,c. Furthermore, Table 1 includes the out of cylindricity value for each region. According to this table the maximum out of cylindricity on the surface is 0.65 mm and occurs in the location of label 1. The maximum deviation for the defective regions with label 3 and 6 is 0.18 mm and 0.19 mm, which is the lowest among other regions, hence they have appeared as objects with minimum intensity value in the generated skin image (namely Magnitude in Table 1) as is also illustrated in the Figure 22a. The magnitude is the average intensity of detected defect’s pixels on the skin image that is a representative of the deviation and can be used directly for surface investigation without returning to the PC’s information.
For the ball joint displayed in Figure 18, the extracted defective regions are shown on the skin images of its hemispheres in Figure 23a. Six defects are located on upper hemisphere and one of them on the down hemisphere. The defective parts are shown with their labels on the skin images, and also are illustrated in red color on the PC in DCS frame, both in non-uniform and uniform scale of the axes for better visualization. Since the lower half includes a small defective area its corresponding skin image is almost dark and the defect, which is labeled as 6, has been appeared in a small lighter object with respect to the background. For more clarification, the maximum DOP of this defect is marked on DCS frame together with two healthy points of the surface (Figure 23a). According to Table 2, this region (label 6) has the minimum out of sphericity error among other defective regions on the ball joint. Both defect 2 and defect 6 are shallow dents on the surface and have approximately the same out of sphericity, in terms of maximum value in Table 2, but the average out of sphericity for defect 2 is higher than defect 6. This means that defect 2 has more deviated points than the ones in defect 6 which leads to its slightly wider bright area on the skin image such that the magnitude of defect 2 and defect 6 are reported as 40 and 23 in the Table 2, respectively, which is also obvious on the final inspected surface in Figure 23b.
Although the accuracy and efficiency of the proposed methodology have been comprehensively discussed in the previous paper, here, a virtual defective cylindrical surface is investigated in order to reaffirm the methodology’s precision. Figure 24 shows this surface and the PC acquired from it. Generating the surface’s skin image (Figure 25a), the defective region is detected on it (Figure 25b). As it was mentioned before, thanks to the traceability of the system, all the analyzed data on any skin image is returnable onto its 3D PC, regardless of the type of the surface. Therefore, no information will be lost. For more clarification, the set of points belonging to the segmented defect is also shown in blue color on the skin image displayed in Figure 25b.
Moreover, according to Figure 24a, the maximum depth of the defect on the designed model is 0.9 mm. However, it must be mentioned that it is smaller in the PC generated from the model’s surface (Figure 24c). Hence, the actual maximum DOP of the defect in the PC, on which the skin imaging is implemented, is 0.87 mm (‖AB‖ in Figure 24c). On the other hand, as is illustrated in Figure 25c, the reported maximum DOP by the skin image system is 0.88 mm. This clearly demonstrates that all the 3D information is preserved through skin imaging.

6. Conclusions

The skin imaging methodology provides an enriched 2D digital twin of the actual geometric deviation of any manufactured 3D surface including analytical geometries and sculptured surfaces. It is a new paradigm for DZE cyber component of IIS that employs intensity variation to model geometric deviation. The in-process inspection of the geometric deviation of the surface provides live data about the probable manufacturing errors which would be dynamically feed backed to the manufacturing site in order to modify or improve the manufacturing processes or compensate the errors. Skin image can technically provide a rich set of information generated from raw 3D data points into a 2D image, which is much easier and faster for any process. In this paper, the three main steps of skin imaging on any surface, which are Deviation Coordinate system generation, skin matrix generation and skin image generation, have been totally explained. Afterwards, the implementation of the methodology is thoroughly discussed when studying the geometric deviation of cylindrical and spherical surfaces due to their wide application in industry. It was also demonstrated that all the 3D information is preserved through skin imaging. Moreover, it has been demonstrated through industrial case studies that skin image is capable and efficient at providing valuable information to any manufacturing process upstream or downstream regarding the most likely locations of manufactured surfaces that are susceptible to critical geometric errors, such as out of cylindricity or out of sphericity. It also accurately reports the magnitude of these errors. Additionally, in the SG estimation step of the cylindrical surfaces, an efficient and accurate approach to determine the optimal axis for the best fitted cylinder on the PC is proposed. The skin imaging methodology has been fully implemented and is compatible with the inspection of data points acquired from any kind of metrology devices that provide XYZ information of the measurement points. Future works will deal with other applications of skin imaging, such as its utilization in dynamic improvement of other cyber components of IIS in closed-loop metrology.

Author Contributions

Conceptualization, E.G.K., M.M. and A.B.; methodology, E.G.K., M.M. and A.B.; software, E.G.K.; validation, E.G.K., M.M. and A.B.; formal analysis, E.G.K., M.M. and A.B.; investigation, E.G.K., M.M. and A.B.; resources, E.G.K. and A.B.; data curation, E.G.K.; writing—original draft preparation, E.G.K.; writing—review and editing, E.G.K., M.M. and A.B.; visualization, E.G.K.; supervision, M.M. and A.B.; project administration, E.G.K.; funding acquisition, A.B. All authors have read and agreed to the published version of the manuscript.

Funding

This research received no external funding.

Institutional Review Board Statement

Not applicable.

Informed Consent Statement

Not applicable.

Data Availability Statement

The data presented in this study are available on request from the corresponding author. The data are not publicly available due to privacy.

Conflicts of Interest

The authors declare no conflict of interest.

References

  1. Catalucci, S.; Thompson, A.; Piano, S.; Branson, D.T.; Leach, R. Optical metrology for digital manufacturing: A review. Int. J. Adv. Manuf. Technol. 2022, 120, 4271–4290. [Google Scholar] [CrossRef]
  2. Tang, S.; Wang, G.; Zhang, H. In situ 3D monitoring and control of geometric signatures in wire and arc additive manufacturing. Surf. Topogr. Metrol. Prop. 2019, 7, 025013. [Google Scholar] [CrossRef]
  3. Kalajahi, E.G.; Mahboubkhah, M.; Barari, A. Reducing Noises in Digital Surface Inspection Using a Data Clustering Approach. IFAC-PapersOnLine 2021, 54, 193–198. [Google Scholar] [CrossRef]
  4. Hua, S.; Li, B.; Shu, L.; Jiang, P.; Cheng, S. Defect detection method using laser vision with model-based segmentation for laser brazing welds on car body surface. Measurement 2021, 178, 109370. [Google Scholar] [CrossRef]
  5. Gohari, H.; Berry, C.; Barari, A. A Digital Twin for Integrated Inspection System in Digital Manufacturing. IFAC-PapersOnLine 2019, 52, 182–187. [Google Scholar] [CrossRef]
  6. Bondoc, A.E.; Tayefeh, M.; Barari, A. Employing LIVE Digital Twin in Prognostic and Health Management: Identifying Location of the Sensors. IFAC-PapersOnLine 2022, 55, 138–143. [Google Scholar] [CrossRef]
  7. Malek, N.G.; Tayefeh, M.; Bender, D.; Barari, A. LIVE Digital Twin for Smart Maintenance in Structural Systems. IFAC-PapersOnLine 2021, 54, 1047–1052. [Google Scholar] [CrossRef]
  8. Lalehpour, A.; Barari, A. Developing skin model in coordinate metrology using a finite element method. Measurement 2017, 109, 149–159. [Google Scholar] [CrossRef]
  9. Berry, C.; Tsuzuki, M.S.G.; Barari, A. Data Analytics for Noise Reduction in Optical Metrology of Reflective Planar Surfaces. Machines 2021, 10, 25. [Google Scholar] [CrossRef]
  10. Grieves, M. Digital Twin: Manufacturing Excellence through Virtual Factory Replication. In Digital Twin White Paper; Institute of Digital Engineering, Loughborough University: London, UK, 2015. [Google Scholar]
  11. Grieves, M. Digital Twin Certified: Employing Virtual Testing of Digital Twins in Manufacturing to Ensure Quality Products. Machines 2023, 11, 808. [Google Scholar] [CrossRef]
  12. del Real Torres, A.; Andreiana, D.S.; Ojeda Roldán, Á.; Hernández Bustos, A.; Acevedo Galicia, L.E. A Review of Deep Reinforcement Learning Approaches for Smart Manufacturing in Industry 4.0 and 5.0 Framework. Appl. Sci. 2022, 12, 12377. [Google Scholar] [CrossRef]
  13. Bendowska, K.; Zawadzki, P. Development and Verification of a Simulation Model of an Automated Assembly Line. Appl. Sci. 2023, 13, 10142. [Google Scholar] [CrossRef]
  14. Umaras, E.; Barari, A.; Horikawa, O.; Tsuzuki, M.S.G. Dimensional Tolerances in Mechanical Assemblies: A Cost-Based Optimization Approach. Appl. Sci. 2023, 13, 9202. [Google Scholar] [CrossRef]
  15. Kandavalli, S.R.; Khan, A.M.; Iqbal, A.; Jamil, M.; Abbas, S.; Laghari, R.A.; Cheok, Q. Application of sophisticated sensors to advance the monitoring of machining processes: Analysis and holistic review. Int. J. Adv. Manuf. Technol. 2023, 125, 989–1014. [Google Scholar] [CrossRef]
  16. ElMaraghy, H.A.; Barari, A.; Knopf, G.K. Integrated Inspection and Machining for Maximum Conformance to Design Tolerances. CIRP Ann. 2004, 53, 411–416. [Google Scholar] [CrossRef]
  17. Barari, A.; Pop-Iliev, R. Reducing rigidity by implementing closed-loop engineering in adaptable design and manufacturing systems. J. Manuf. Syst. 2009, 28, 47–54. [Google Scholar] [CrossRef]
  18. Kusiak, A. Smart manufacturing. Int. J. Prod. Res. 2017, 56, 508–517. [Google Scholar] [CrossRef]
  19. Barari, A.; Tsuzuki, M.S.G. Smart Manufacturing and Industry 4.0. Appl. Sci. 2023, 13, 1545. [Google Scholar] [CrossRef]
  20. Najafabadi, R.H.; Goto, T.G.; Falheiro, M.S.; Martins, C.T.; Barari, A.; Tsuzuki, M.S.G. Smart Topology Optimization Using Adaptive Neighborhood Simulated Annealing. Appl. Sci. 2021, 11, 5257. [Google Scholar] [CrossRef]
  21. Berry, C.; Barari, A. Cyber-Physical System Utilizing Work-Piece Memory in Digital Manufacturing. IFAC-PapersOnLine 2019, 52, 201–206. [Google Scholar] [CrossRef]
  22. Lalehpour, A.; Berry, C.; Barari, A. Adaptive data reduction with neighbourhood search approach in coordinate measurement of planar surfaces. J. Manuf. Syst. 2017, 45, 28–47. [Google Scholar] [CrossRef]
  23. He, G.; Sang, Y.; Pang, K.; Sun, G. An improved adaptive sampling strategy for freeform surface inspection on CMM. Int. J. Adv. Manuf. Technol. 2018, 96, 1521–1535. [Google Scholar] [CrossRef]
  24. Jalid, A.; Hariri, S.; Laghzale, N.E. Influence of sample size on flatness estimation and uncertainty in three-dimensional measurement. Int. J. Metrol. Qual. Eng. 2015, 6, 102. [Google Scholar] [CrossRef]
  25. Barari, A.; Mordo, S. Effect of sampling strategy on uncertainty and precision of flatness inspection studied by dynamic minimum deviation zone evaluation. Int. J. Metrol. Qual. Eng. 2013, 4, 3–8. [Google Scholar] [CrossRef]
  26. Mian, S.H.; Al-Ahmari, A.M. Application of the sampling strategies in the inspection process. Proc. Inst. Mech. Eng. Part B J. Eng. Manuf. 2017, 231, 565–575. [Google Scholar] [CrossRef]
  27. Martins, T.C.; Tsuzuki, M.S.G.; Takimoto, R.Y.; Barari, A.; Gallo, G.B.; Garcia, M.A.A.; Tiba, H. Algorithmic iterative sampling in coordinate metrology plan for coordinate metrology using dynamic uncertainty analysis. In Proceedings of the 2014 12th IEEE International Conference on Industrial Informatics (INDIN), Porto Alegre, Brazil, 27–30 July 2014; pp. 316–319. [Google Scholar] [CrossRef]
  28. Yi, B.; Liang, R.; Wang, X.; Wu, S.; Huang, N. Free-form surface form error evaluation based on smaller-scale sampling points in touch-trigger probing. Precis. Eng. 2022, 76, 255–260. [Google Scholar] [CrossRef]
  29. Barari, A. A Best-Fit Method to Maximize Conformance to Tolerance in Surface Coordinate Metrology. J. CMSC 2012, 7, 20–27. [Google Scholar]
  30. Gu, R.; Wang, Z.; Ma, L.; Nie, J. Calibration method of laser scanning measurement system for large-scale component using a free-form surface reconstruction model. Measurement 2023, 210, 112511. [Google Scholar] [CrossRef]
  31. Barari, A. Inspection of the machined surfaces using manufacturing data. J. Manuf. Syst. 2013, 32, 107–113. [Google Scholar] [CrossRef]
  32. Mehrad, V.; Xue, D.; Gu, P. Prediction of surface reconstruction uncertainties for freeform surface inspection. Measurement 2013, 46, 2682–2694. [Google Scholar] [CrossRef]
  33. Poniatowska, M. Deviation model based method of planning accuracy inspection of free-form surfaces using CMMs. Measurement 2012, 45, 927–937. [Google Scholar] [CrossRef]
  34. Jamiolahmadi, S.; Barari, A. Surface Topography of Additive Manufacturing Parts Using a Finite Difference Approach. J. Manuf. Sci. Eng. 2014, 136, 061009. [Google Scholar] [CrossRef]
  35. Jamiolahmadi, S.; Barari, A. Study of detailed deviation zone considering coordinate metrology uncertainty. Measurement 2018, 126, 433–457. [Google Scholar] [CrossRef]
  36. Wu, J.; Qiao, L.; Huang, Z. Deviation modeling of manufactured surfaces from a perspective of manufacturing errors. Int. J. Adv. Manuf. Technol. 2018, 98, 1321–1337. [Google Scholar] [CrossRef]
  37. Polini, W.; Corrado, A. A Unique Model to Estimate Geometric Deviations in Drilling and Milling Due to Two Uncertainty Sources. Appl. Sci. 2021, 11, 1996. [Google Scholar] [CrossRef]
  38. ISO 17450-1:2011; Geometrical Product Specifications (GPS)—General Concepts. ISO: Geneva, Switzerland, 2011.
  39. Zhang, M.; Anwer, N.; Stockinger, A.; Mathieu, L.; Wartzack, S. Discrete shape modeling for skin model representation. Proc. Inst. Mech. Eng. Part B J. Eng. Manuf. 2013, 227, 672–680. [Google Scholar] [CrossRef]
  40. Anwer, N.; Ballu, A.; Mathieu, L. The skin model, a comprehensive geometric model for engineering design. CIRP Ann. 2013, 62, 143–146. [Google Scholar] [CrossRef]
  41. Anwer, N.; Schleich, B.; Mathieu, L.; Wartzack, S. From solid modelling to skin model shapes: Shifting paradigms in computer-aided tolerancing. CIRP Ann. 2014, 63, 137–140. [Google Scholar] [CrossRef]
  42. Schleich, B.; Anwer, N.; Mathieu, L.; Wartzack, S. Skin Model Shapes: A new paradigm shift for geometric variations modelling in mechanical engineering. Comput.-Aided Des. 2014, 50, 1–15. [Google Scholar] [CrossRef]
  43. Schleich, B.; Walter, M.; Wartzack, S.; Anwer, N.; Mathieu, L. A Comprehensive Framework for Skin Model Simulation. Eng. Syst. Des. Anal. 2012, 44861, 567–576. [Google Scholar] [CrossRef]
  44. Semere, D.; Yacob, F.; Hedlind, M.; Bagge, M. Skin Model Based Tolerance and Variations Analysis. Procedia CIRP 2018, 72, 726–731. [Google Scholar] [CrossRef]
  45. Ghanbary Kalajahi, E.; Mahboubkhah, M.; Barari, A. On detailed deviation zone evaluation of scanned surfaces for automatic detection of defected regions. Measurement 2023, 221, 113462. [Google Scholar] [CrossRef]
  46. Zong, Y.; Liang, J.; Wang, H.; Ren, M.; Zhang, M.; Li, W.; Lu, W.; Ye, M. An intelligent and automated 3D surface defect detection system for quantitative 3D estimation and feature classification of material surface defects. Opt. Lasers Eng. 2021, 144, 106633. [Google Scholar] [CrossRef]
  47. Huang, C.; Wang, G.; Song, H.; Li, R.; Zhang, H. Rapid surface defects detection in wire and arc additive manufacturing based on laser profilometer. Measurement 2022, 189, 110503. [Google Scholar] [CrossRef]
  48. Wells, L.J.; Shafae, M.S.; Camelio, J.A. Automated Surface Defect Detection Using High-Density Data. J. Manuf. Sci. Eng. 2016, 138, 071001. [Google Scholar] [CrossRef]
  49. Nurunnabi, A.; Sadahiro, Y.; Lindenbergh, R.; Belton, D. Robust cylinder fitting in laser scanning point cloud data. Measurement 2019, 138, 632–651. [Google Scholar] [CrossRef]
  50. Coope, I.D. Circle fitting by linear and nonlinear least squares. J. Optim. Theory Appl. 1993, 76, 381–388. [Google Scholar] [CrossRef]
Figure 1. Skin image generation steps.
Applsci 13 12971 g001
Figure 2. SG estimation for planar surface with illustration of DOP and Image-Point.
Applsci 13 12971 g002
Figure 3. Skin imaging methodology with Deviation-Coordinate System (DCS) (Red box is blank pixel).
Applsci 13 12971 g003
Figure 4. Initial cylinder fitting in scanner coordinate system (PC is in blue and SG is in red color).
Applsci 13 12971 g004
Figure 5. PCs after mapping to PCA coordinate system.
Applsci 13 12971 g005
Figure 6. Modification concept of initial estimated axis of cylinder.
Applsci 13 12971 g006
Figure 7. PCs in SG coordinate system after modification.
Applsci 13 12971 g007
Figure 8. Demonstration of the efficiency of the cylinder axis estimation procedure.
Applsci 13 12971 g008
Figure 9. Image-Point and DOP calculation for points of a cylindrical surface.
Applsci 13 12971 g009
Figure 10. Deviation-Plane definition and localization of image-point on it.
Applsci 13 12971 g010
Figure 11. Sphere fitting on measured PC of an ideal surface (PC is in blue and SG is in red color).
Applsci 13 12971 g011
Figure 12. Image-Point and DOP of measured point on the spherical surface.
Applsci 13 12971 g012
Figure 13. Defective gudgeon pin.
Applsci 13 12971 g013
Figure 14. SG estimation for PC of gudgeon pin surface.
Applsci 13 12971 g014
Figure 15. (a) Deviation-Coordinate system, (b) skin image of the measured gudgeon pin.
Applsci 13 12971 g015
Figure 16. (a) Model of the wavy sphere, (b) Its PC and fitted SG, (c) Deviation-Coordinate system for a wavy spherical surface (upper hemisphere) (d) Deviation-Coordinate system in X-Y plane.
Applsci 13 12971 g016
Figure 17. Skin image of the wavy spherical.
Applsci 13 12971 g017
Figure 18. Defective suspension ball joint (labels are the number of the defects).
Applsci 13 12971 g018
Figure 19. SG estimation and Deviation-Coordinate system generation for the ball joint.
Applsci 13 12971 g019
Figure 20. Skin images of the ball joint’s hemispheres.
Applsci 13 12971 g020
Figure 21. Histogram of skin images of: (a) wavy sphere, (b) defective gudgeon pin, (c,d) upper and down hemispheres of defective ball joint.
Applsci 13 12971 g021
Figure 22. Detected defects on gudgeon pin, (a) on skin image, (b) on DCS (c) on XDCS–YDCS plane (d) on the 3D surface (All the labels correspond to the number of defects illustrated in Figure 13).
Applsci 13 12971 g022
Figure 23. Detected defects on ball joint, (a) from left to right: on skin image, on DCS with non-uniform scale of axes, on XDCS–YDCS plane, on DCS with uniform scale of axes, (b) on the 3D surface in scanner frame (All the labels correspond to the number of defects illustrated in Figure 18).
Applsci 13 12971 g023
Figure 24. (a) Model of virtual defective cylinder, (b) its PC, (c) its PC on the plane that is normal to the cylinder axis (‖AB‖ is the actual maximum depth of the defect).
Applsci 13 12971 g024
Figure 25. (a) Skin image of the cylinder of Figure 24, (b) illustration of the detected defect (in red color) and the PC of the segmented defect (in cyan color) on the skin image, (c) the detected defect in DCS, (d) the detected defect on the original cylinder in the scanner coordinate frame (in red color).
Applsci 13 12971 g025
Table 1. Out of cylindricity of the defective gudgeon pin.
DefectMagnitudeOut of Cylindricity (mm)
(Average)
Out of Cylindricity (mm)
(Maximum)
1910.33200.6501
2330.13810.2321
3270.15740.1808
4470.170.34
5470.15660.3532
6270.17570.1931
7870.26310.5126
Table 2. Out of sphericity of the defective suspension ball joint.
DefectMagnitudeOut of Sphericity (mm)
(Average)
Out of Sphericity (mm)
(Maximum)
11450.320.57
2400.13730.1730
3630.18190.3309
4440.14120.1957
5390.120.2059
6230.080.16
7640.23650.3502
Disclaimer/Publisher’s Note: The statements, opinions and data contained in all publications are solely those of the individual author(s) and contributor(s) and not of MDPI and/or the editor(s). MDPI and/or the editor(s) disclaim responsibility for any injury to people or property resulting from any ideas, methods, instructions or products referred to in the content.

