Article

Synchronous Grouting Analysis of Shield Tunneling through High Water Pressure Fault Fracture Zone

1
Shanghai Tunnel Engineering & Rail Transit Design and Research Institute, Shanghai 200235, China
2
College of Civil and Transportation Engineering, Shenzhen University, Shenzhen 518060, China
3
Key Laboratory of Coastal Urban Resilient Infrastructures (MOE), Shenzhen University, Shenzhen 518060, China
4
Shenzhen Key Laboratory of Green, Efficient and Intelligent Construction of Underground Metro Station, Shenzhen 518060, China
5
School of Civil Engineering, Central South University, Changsha 410083, China
*
Author to whom correspondence should be addressed.
Appl. Sci. 2023, 13(24), 12972; https://doi.org/10.3390/app132412972
Submission received: 10 October 2023 / Revised: 6 November 2023 / Accepted: 21 November 2023 / Published: 5 December 2023

Abstract

:
Using numerical software to establish a three-dimensional geological model of shield tunneling through fault fracture zones, considering the synchronous grouting effect at the shield tail, the disturbance of various geotechnical structures in the fault fracture zone under deep burial and high water pressure conditions is studied. According to the comparison between the numerical model analysis results and the on-site inspection results of the entire process of Shiziyang B3 section, synchronous grouting at the shield tail is the main reason for the changes in soil and water pressure in the fault fracture zone area. The soil and water pressure changes strongly during shield tunneling, and the maximum excess pore pressure value occurs when the shield tail passes. When the shield tunneling machine is far away, the soil and water stress shows a downward trend. The impact of synchronous grouting decreases with the increase in tunneling distance. Due to the difference in permeability, the variation law of pore pressure in the fault fracture zone is significantly different from the original rock, leading to a faster increase in pore pressure in the fracture zone area and a wider range of influence.

1. Introduction

Shield tunneling has developed rapidly since the 19th century, and with the advancement of technology, its characteristics have gradually become challenging. Large burial depth, long distance, high water pressure, and complex geology have become new technical challenges for shield tunneling. At present, indoor model testing is an important means in the theoretical research of shield tunneling grouting [1,2,3,4,5,6,7], but it is difficult to meet various working conditions. Numerical methods can effectively simulate and restore the real engineering background, not only dynamically display the impact of the entire process of shield tunneling on the strata [8,9,10,11,12,13,14], but also provide corresponding solutions for different working conditions. It has the characteristics of intuition and efficiency and is one of the more powerful means for studying construction in complex geotechnical engineering environments.
Shield tunneling is completed by a combination of multiple construction processes. Due to complex on-site conditions, it is often necessary to simplify the numerical model in order to study the impact of a certain construction process. Load is the main influencing factor during shield tunneling construction, mainly including the stress field of rock and soil, the self-weight of the shield tunneling machine, the mud pressure on the excavation surface, and the grouting pressure at the tail of the shield.
Previous studies have shown that the main influencing factors of shield tunneling on rock and soil disturbance problems include grouting pressure at the shield tail, mud pressure at the face of the tunnel, shield machine posture, and shield over-excavation or under-excavation [15,16,17,18,19,20,21]. This article uses numerical software to establish a three-dimensional geological model of shield tunneling through fault fracture zones, with a focus on the synchronous grouting effect at the shield tail. It studies the disturbance of various rock and soil structures in the fault fracture zone under deep burial and high water pressure conditions and focuses on analyzing the impact of synchronous grouting effect of shield tunneling on the surrounding rock and soil seepage flow field, stress field, and displacement field. Combined with on-site full process monitoring tests, it studies the action law of synchronous grouting of shield tunneling on rock and soil, Analyze the impact of shield tunneling on surrounding rock and provide reference for the study of grouting technology in fault fracture zones.

2. Fault Fracture Zone Model

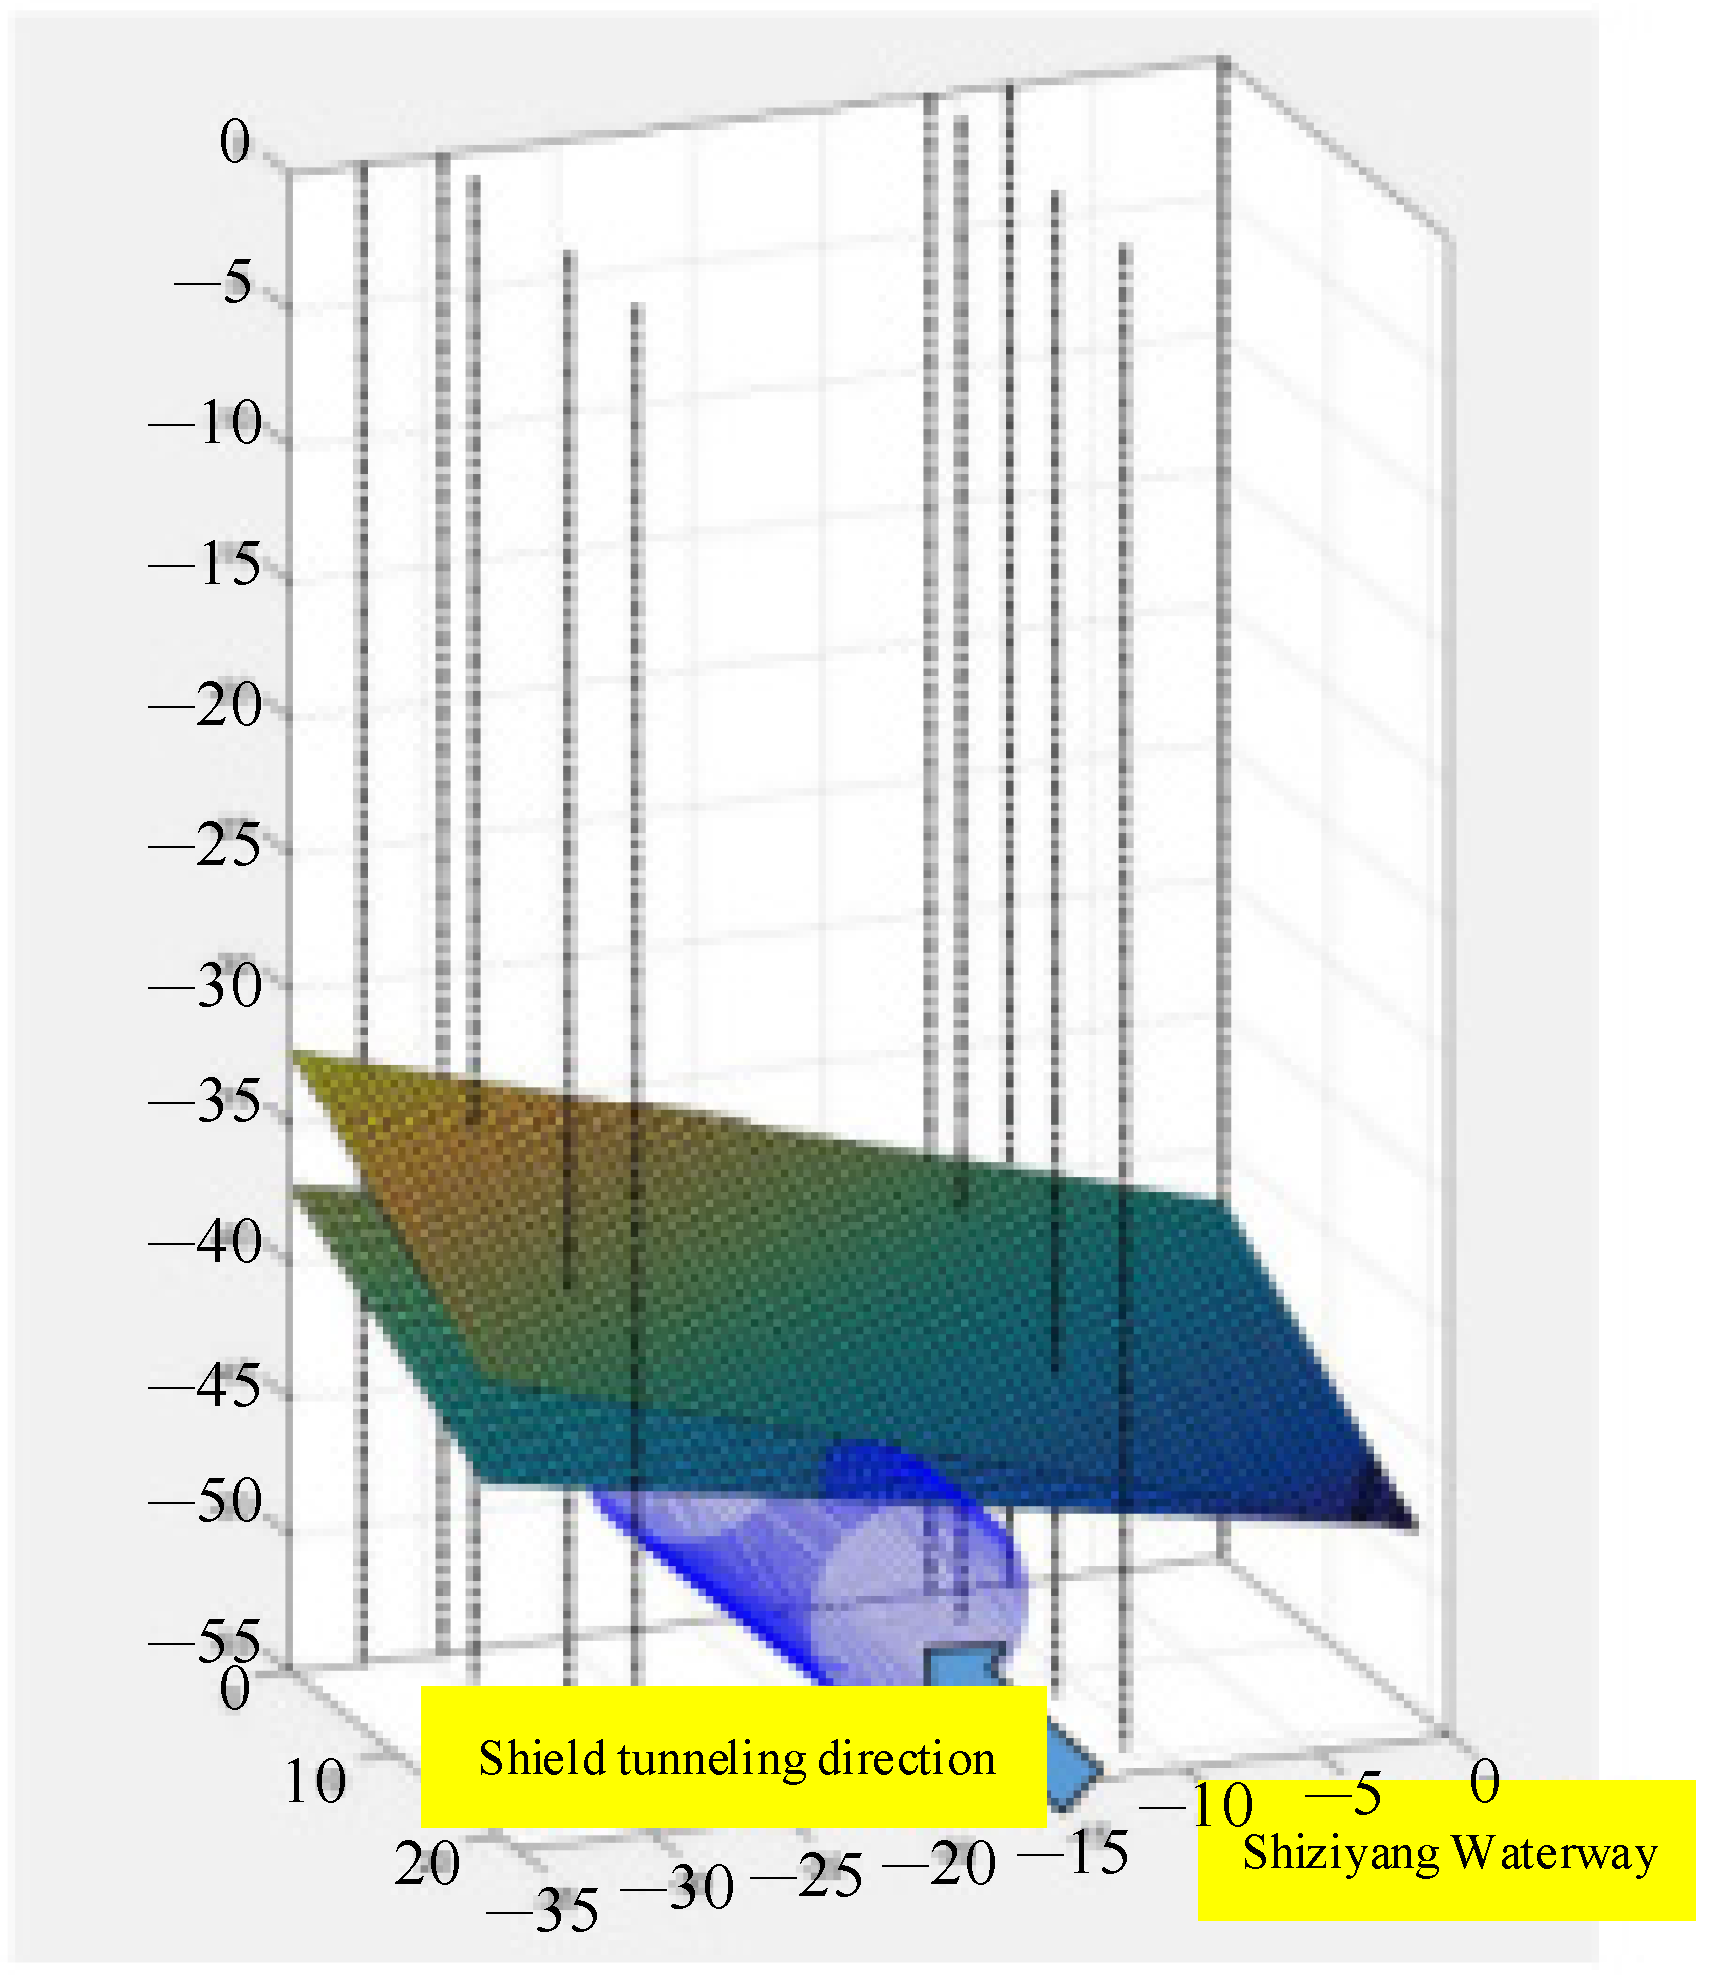
2.1. Project Overview

The background project of this article is the Chunfeng Tunnel in Shenzhen, China, which is currently the largest diameter tunnel under construction in China. The entire line of this project is approximately 5.08 km long, with a tunnel closure section of 4.27 km in length. The shield tunneling section of this project passes through the main bridge and ramp bridge of Hongling Interchange, Bao’an Interchange, Bujihe Bridge, Chunfeng Viaduct, Renmin South Road Channel Bridge, Yanhe Road Viaduct, etc. The specific underpass situation is shown in Table 1.

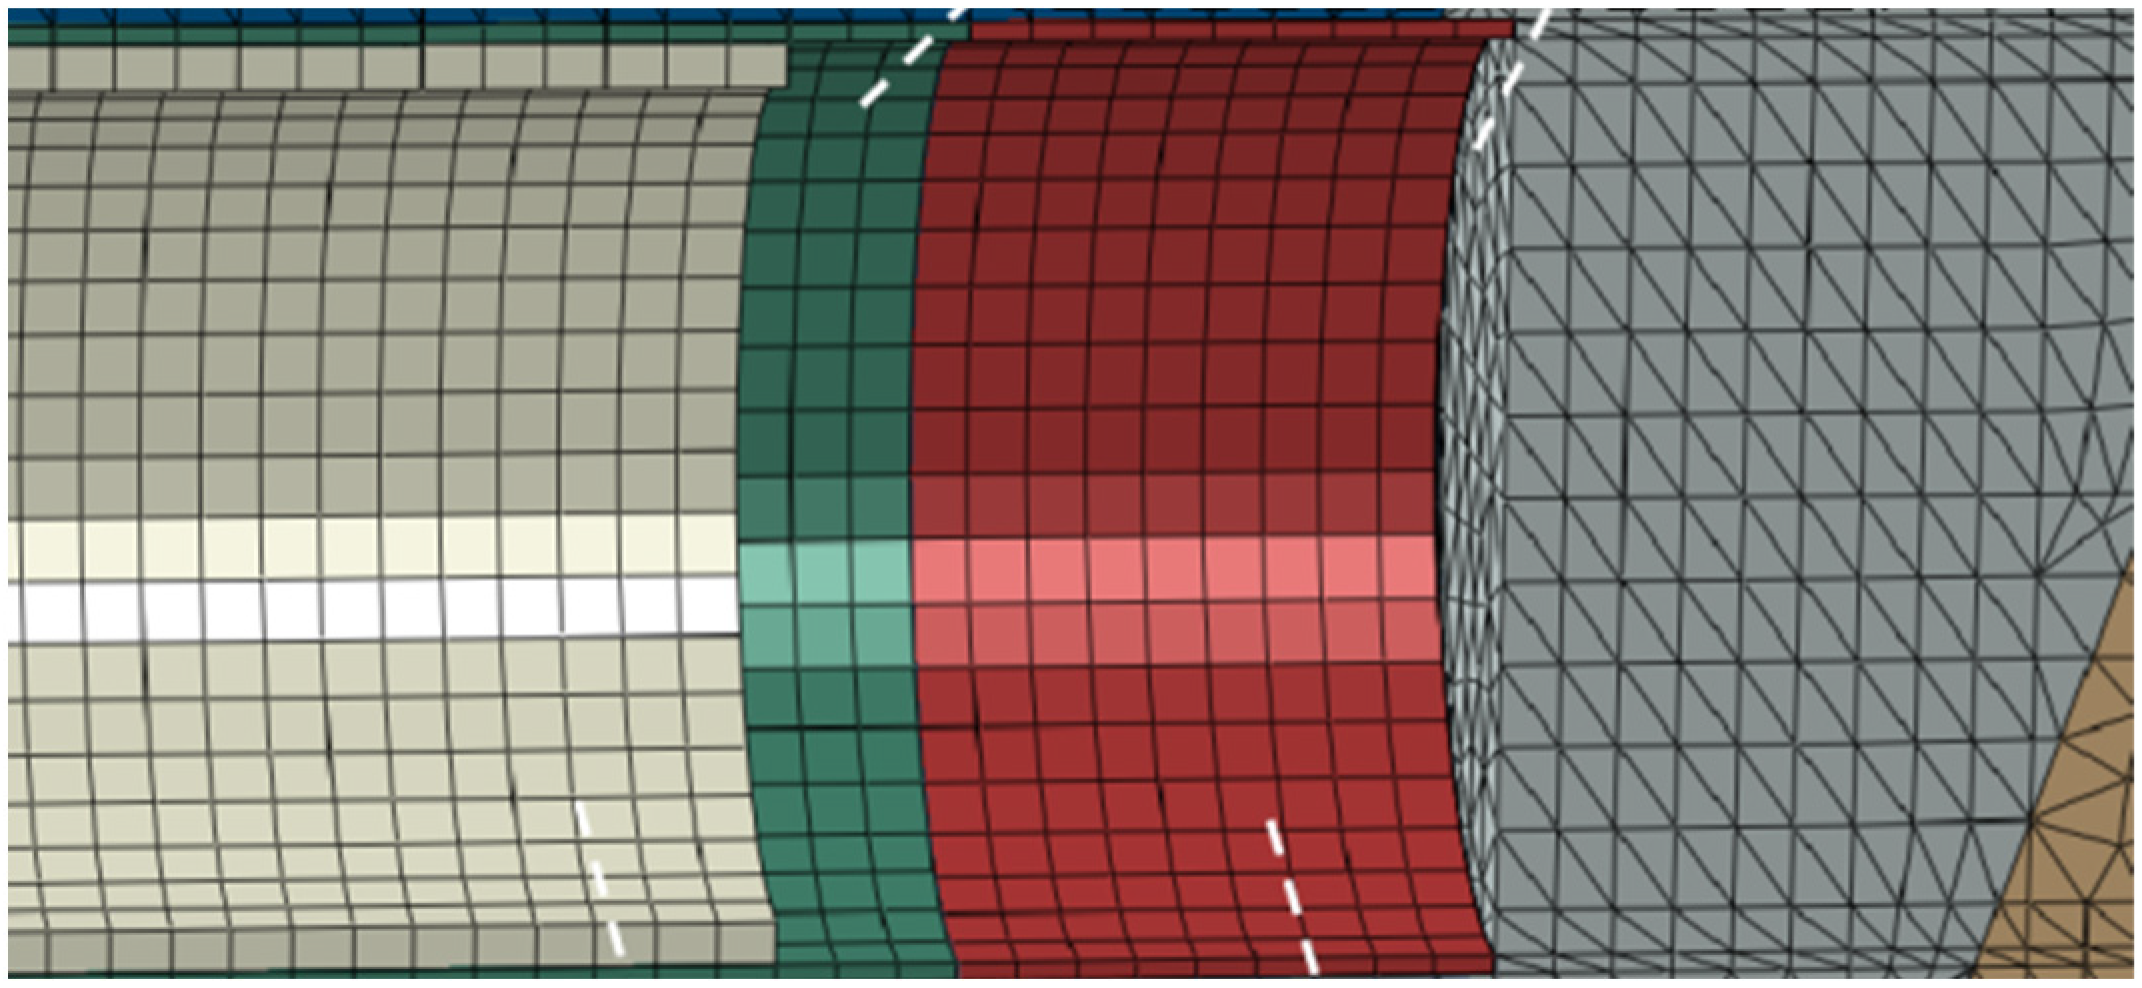
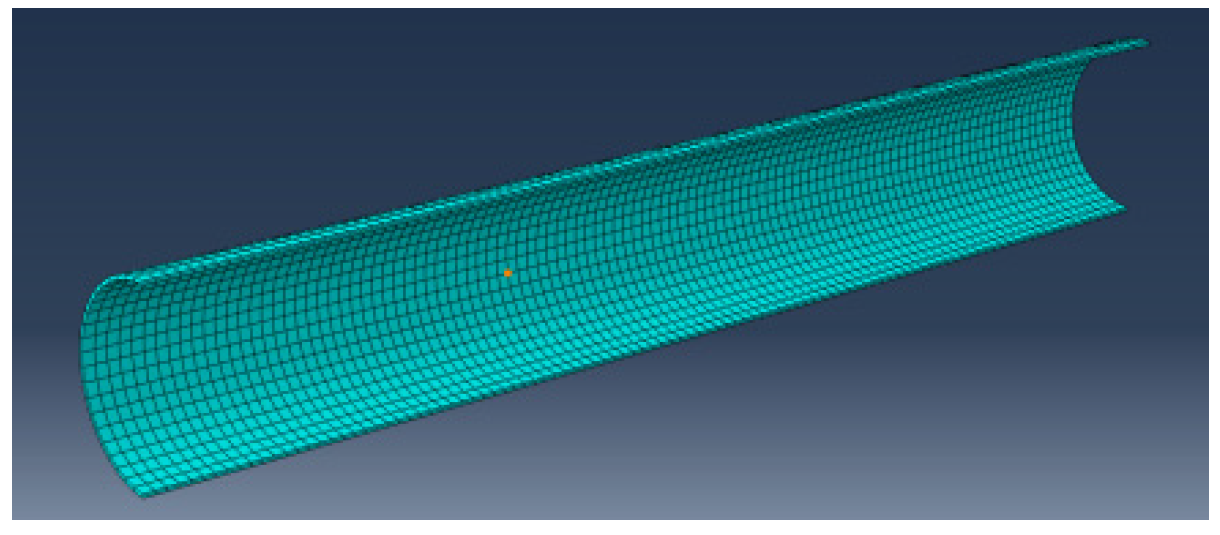
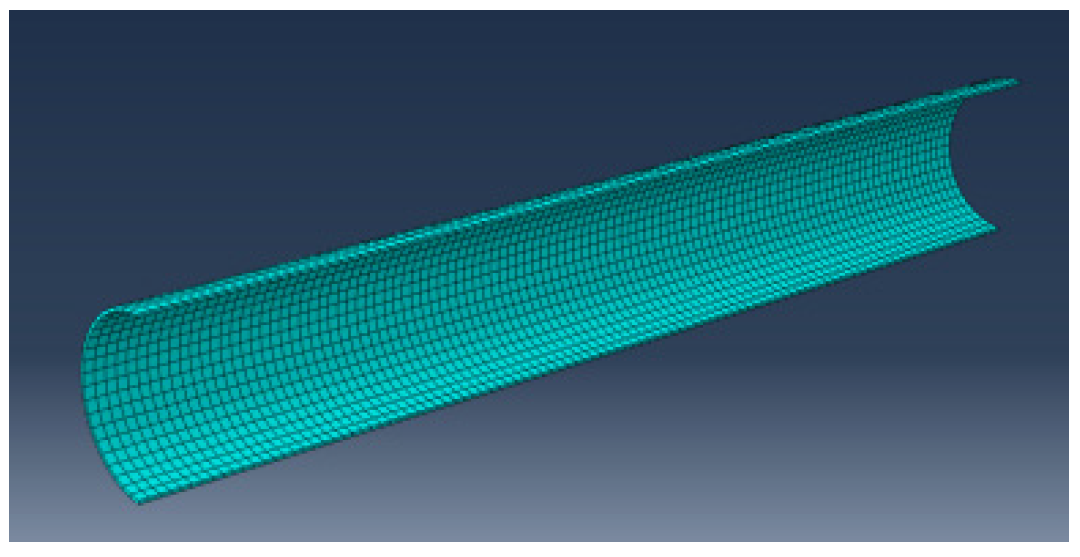
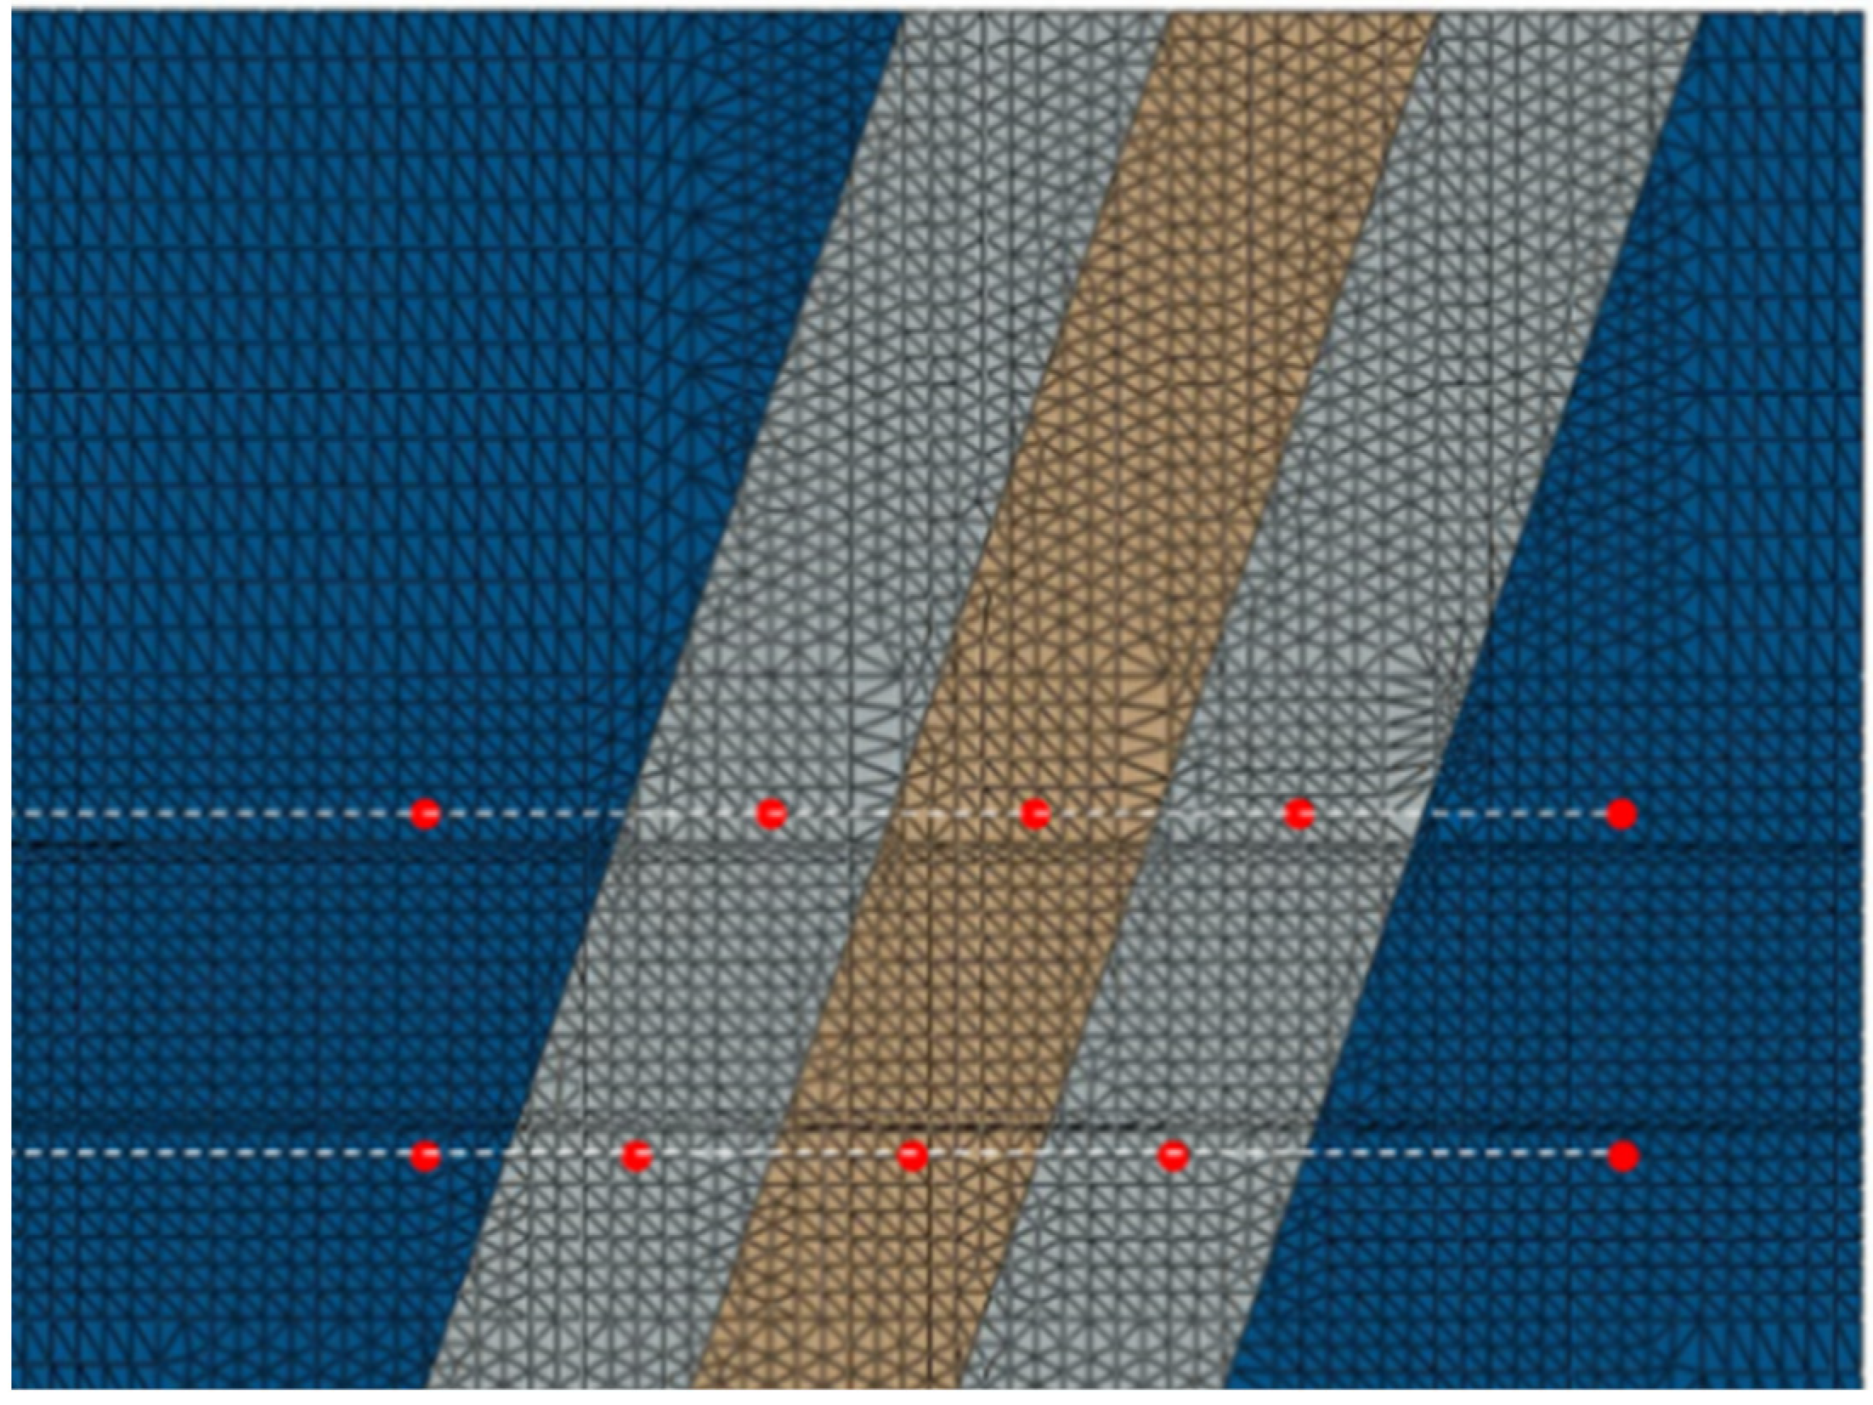
2.2. Establishment of Fault Fracture Zone Model

Due to the formation process of fault fracture zones leading to their structural diversity, in order to better study the synchronous grouting law of fault fracture zone strata, the fault fracture zone structure adopts a symmetrical and complete structure, including upper and lower wall induced crack zones and sliding fracture zones. A three-dimensional numerical model of shield tunneling machine passing through the complete fault fracture zone is established. At the same time, it is assumed that the calculation domain of the strata is symmetrical about the tunnel axis, and half of the strata are taken for modeling and calculation. Based on the study of the B3 section of the Pearl River Delta Water Resource Allocation Project, the water conveyance tunnel in this section runs from Dongyong Town to Shatian Town, Dongguan City. Two shield tunneling machines are used to enter Haiou Island 6 well in Panyu District, Guangzhou from Shagongbao location 5 to the east, and from Shatian Town 7 underground to Haiou Island 6 well, forming a single line shield tunnel with a total length of approximately 6.62 km. Using on-site shield machine data, as shown in Table 2. According to the Saint Venant principle and boundary effects, the following issues should be noted:
(1) The distance from the bottom of the tunnel to the bottom of the soil layer should be controlled at three times the tunnel diameter;
(2) The width of the soil on the side of the tunnel is generally controlled at six times the tunnel diameter.
Therefore, the cross-sectional size of the model is taken as 40 m × 56 m × 60 m, the distance from the top to the bottom of the model is 60 m, and the buried depth at the top of the tunnel is 25 m. The numerical model is shown in Figure 1. And the schematic diagram of model components is shown in Figure 2.
(1) Excavation construction simulation method:
The model is based on the stiffness transfer method and uses the “Model Change” command in ABAQUS to kill and activate elements, simulating the excavation of soil by shield tunneling. Each time the shield machine advances a ring (with a width of 1.6 m), a grouting unit is activated behind the shield tail. As the excavation surface advances, the shield machine gradually pushes in and the shield tail gradually pushes out. The shield tunneling is studied as a discontinuous process, and the disturbance changes of soil and water pressure during the excavation process are obtained through finite element calculation.
(2) Boundary conditions:
The axisymmetric plane of the model limits its displacement in the X direction and is set to be impermeable to the water surface; both sides of the soil calculation domain restrict their displacement degrees of freedom perpendicular to the surface, and apply the pore pressure corresponding to the hydrostatic pressure; the groundwater level is located on the surface of the soil layer and the pore water pressure is set to 0; the direction of gravity load is downward along the Z direction.
(3) Grouting simulation:
Existing research has shown that the distribution of grouting pressure is related to the grouting method. This article relies on the shield tunneling machine equipped with six grouting holes. During the construction process, only the upper and middle four grouting holes are often used for simultaneous grouting. According to the on-site measurement of synchronous grouting pressure in the literature, it is shown that the distribution pattern of grouting pressure is mostly small in the upper part and large in the lower part, and the pressure distribution is symmetrical and relatively uniform, as shown in Figure 3. And the model construction load is shown in Figure 4.
Therefore, this article applies a uniformly distributed grouting pressure on the contact surface between the grouting layer unit and the soil within a range of 3.2 m (2 rings) behind the shield tail, which deviates from the tunnel axis. As the shield tunneling and slurry hardening, the grouting pressure decreases. Considering the self-weight of the slurry, the pressure increases along the depth of 10 kN/m3, and the same grouting pressure is also applied on the contact surface between the grouting layer and the pipe segment; during synchronous grouting of shield tunneling, pore pressure boundary conditions are applied at the interface between the grouting layer and the soil. According to literature, it takes a long time for pore water pressure to dissipate in weakly permeable formations. However, in reality, the pressure of the shield tail slurry will dissipate quickly due to hydration and hardening. Therefore, transient analysis is used in the analysis step to consider the process of pore pressure change.
(4) Complete construction steps:
Firstly, the stress balance of the fault fracture zone model is analyzed to restore the true stress state; in the first analysis step, the element life and death function in ABAQUS is used to remove the excavated soil element at the first ring, simulate shield tunneling, and apply mud pressure and pore pressure boundary to the tunnel face to simulate shield tunneling mud; in the second analysis step, the next ring of soil unit is excavated, and the next ring of shield machine unit is activated. The mud pressure and pore pressure boundary move forward by a distance of one ring and are applied to the position of the palm face during the excavation of the second ring to simulate the propulsion of the second ring of shield machine. When the previous ring of shield machine is removed, the grouting layer unit and segment unit inside the ring are activated to form support. At the same time, radial grouting pressure and pore pressure boundary are applied to the ring to simulate the grouting process at the shield tail, In the subsequent analysis steps, the grouting pressure gradually decreases and the grouting layer material is strengthened to simulate the solidification of the slurry and the dissipation of grouting pressure; in the following analysis steps, repeat the above process to simulate the continuous advancement of the shield machine.
In order to simulate the grouting process at the tail of the shield, the shield unit is killed at the initial position, the first ring lining unit and the grouting layer unit are activated, and radial grouting pressure and pore pressure boundary are applied to the grouting layer unit. In the second and third analysis steps, gradually reduce the grouting pressure and pore pressure boundary of the ring, and then strengthen the material modulus of the grouting layer unit to simulate the dissipation of grouting pressure and slurry hardening.

2.3. Model Parameter Selection

Fault zones represent complex geological structures composed of various rocks with many different material characteristics. The geological and mechanical properties of fault rock masses are difficult to describe, as it is difficult to obtain representative samples during on-site investigation, sample preparation, and laboratory testing. According to Marinos’ suggestion for heterogeneous rock masses, the equivalent material properties of fault zones can be reasonably approximated by the “weighted average” of the complete strength characteristics of strong and weak materials (such as the uniaxial compressive strength UCS of intact rocks). Therefore, for shear failure of fault zones, the model assumes that the rock and soil mass conform to ideal elastic-plastic materials and adopts the Mohr Coulomb yield criterion. The rock and soil element adopts a tetrahedral linear stress seepage coupling element (C3D4P), and the rock and soil parameters of the fault fracture zone are selected based on the geological survey report, as shown in Table 3.
In practical engineering, the working state of concrete is mostly linear elasticity, so in this model, the linear elastic constitutive equation is used for the pipe segment. The shield tunnel shell, grouting body, and pipe segments all adopt a linear elastic model, and consider the effects of pipe segment joints to reduce the stiffness of the pipe segment concrete, with a reduction coefficient of 80%. During the excavation process, the slurry will gradually harden after synchronous grouting at the shield tail. The hardening process of the slurry is simulated by changing the elastic modulus and Poisson’s ratio of the grouting unit. The selection of mechanical parameters for the segment, slurry, and shield machine casing is shown in Table 4.
The soil, shield machine, pipe segments, and grouting layer in the model are all simulated using solid elements. The segment and shield tunneling adopt an isotropic linear elastic model based on the generalized Hooke’s law. Due to the good impermeability of the lining, the seepage effect of the lining is not considered in the model. The segment, shield tunneling machine, and grouting body adopt an eight-node linear reduced integral hexahedral element (C3D8R).

3. Analysis of Synchronous Grouting Results in Fault Fracture Zones

By establishing a fault fracture zone model, numerical simulation of the shield tunneling process is conducted, with a focus on analyzing the disturbance of rock and soil during the shield tunneling process, including analysis of surrounding rock deformation, effective stress of rock and soil, and changes in pore pressure. This article takes the model simulation results of grouting pressure of 450 kPa, top support pressure of 300 kPa, burial depth of 25 m, and water cover depth of 25 m as examples for analysis.
Perform geostress balance on the fault fracture zone formation model to restore the true geostress state. Firstly, calculate the initial geostress of the rock and soil, select a fixed increment type, and then apply the calculated geostress file as a prestressing condition to the model for secondary balance. If the accuracy of the balance result still does not meet 10-5 m, multiple balances need to be performed.
From Figure 5, Figure 6 and Figure 7, it can be seen from the analysis of the results of the geostress balance that after the geostress balance, there is a significant distortion of vertical stress at the fault structure without excavation. The vertical stress inside the fault is significantly lower than that of the adjacent normal surrounding rock strata, which is related to the formation process of the fault fracture zone. The fault area is actually formed after the formation of strata movement and fracture, with many fillers combined in the middle, and the physical and mechanical properties such as gravity and strength are significantly reduced, the strata have large deformation and belong to the stress release zone, so the stress in the fault zone is relatively low. From Figure 8 and Figure 9, it can be seen that after the second balance, the initial displacement field of the geostress balance is very small, and the balance effect is good.
After the ground stress is balanced, the soil elements of the excavation surface are gradually removed, and the shield tail lining and grouting layer elements are activated simultaneously to simulate tunnel excavation construction. Use software post-processing tools to obtain the displacement and stress fields of the model rock and soil, extract the output data of each field during the excavation process, select monitoring points in the ordinary surrounding rock, crack zone, and fractured zone rock and soil, and analyze the changes in stress, displacement settlement, and pore pressure of the soil units at 0.8 m above and below the tunnel top and bottom. The Schematic diagram of longitudinal section monitoring points of the model is shown in Figure 10.

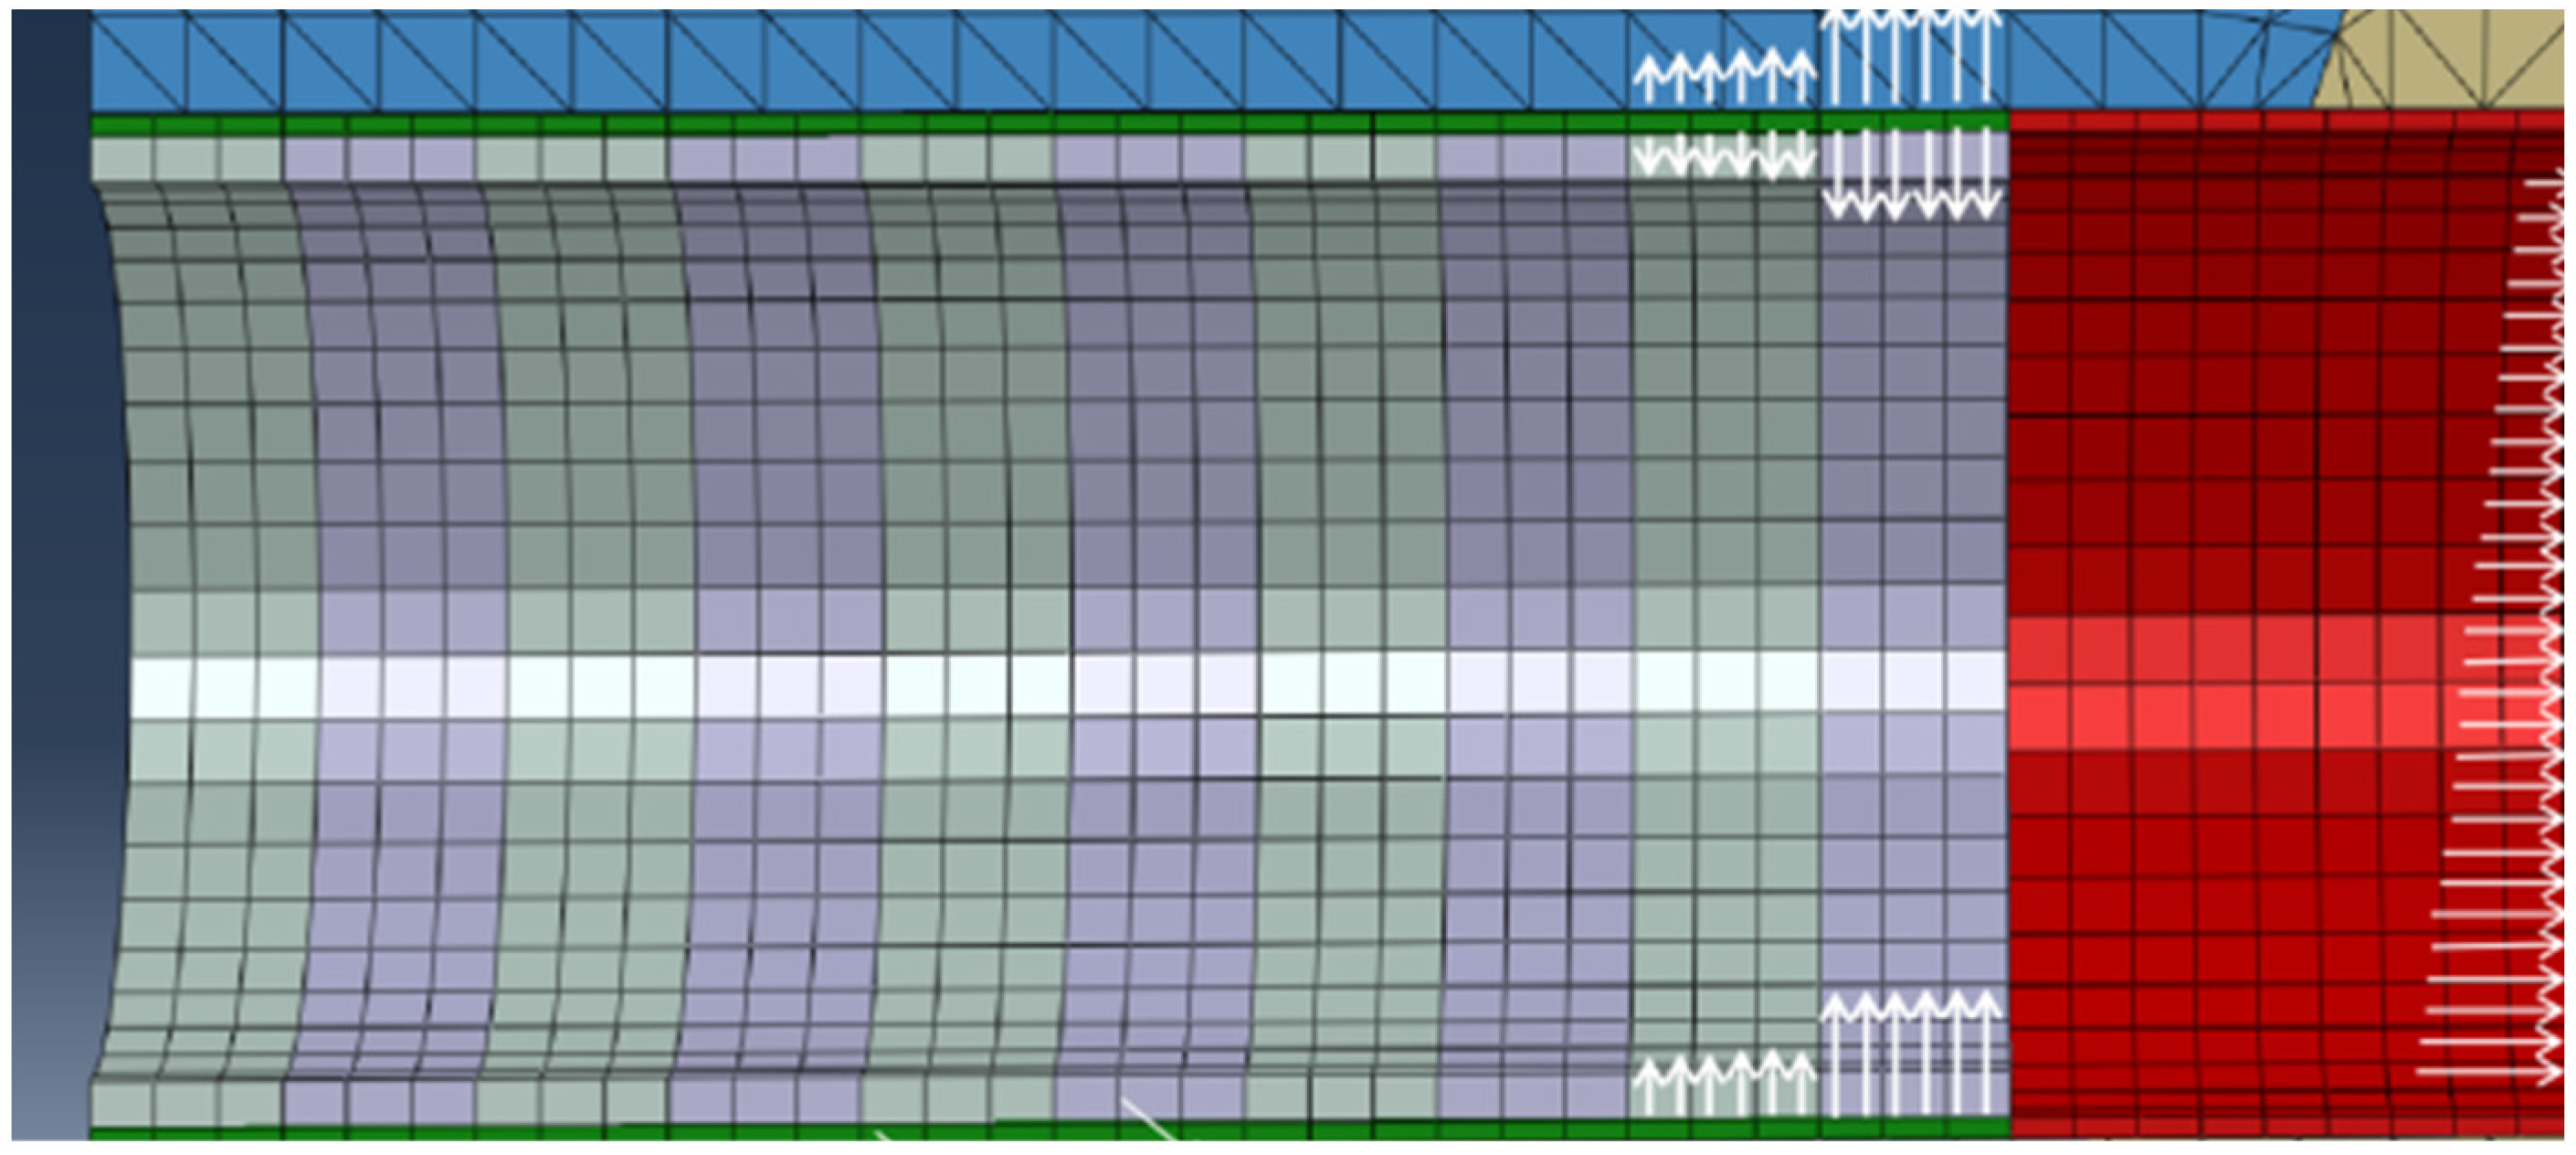
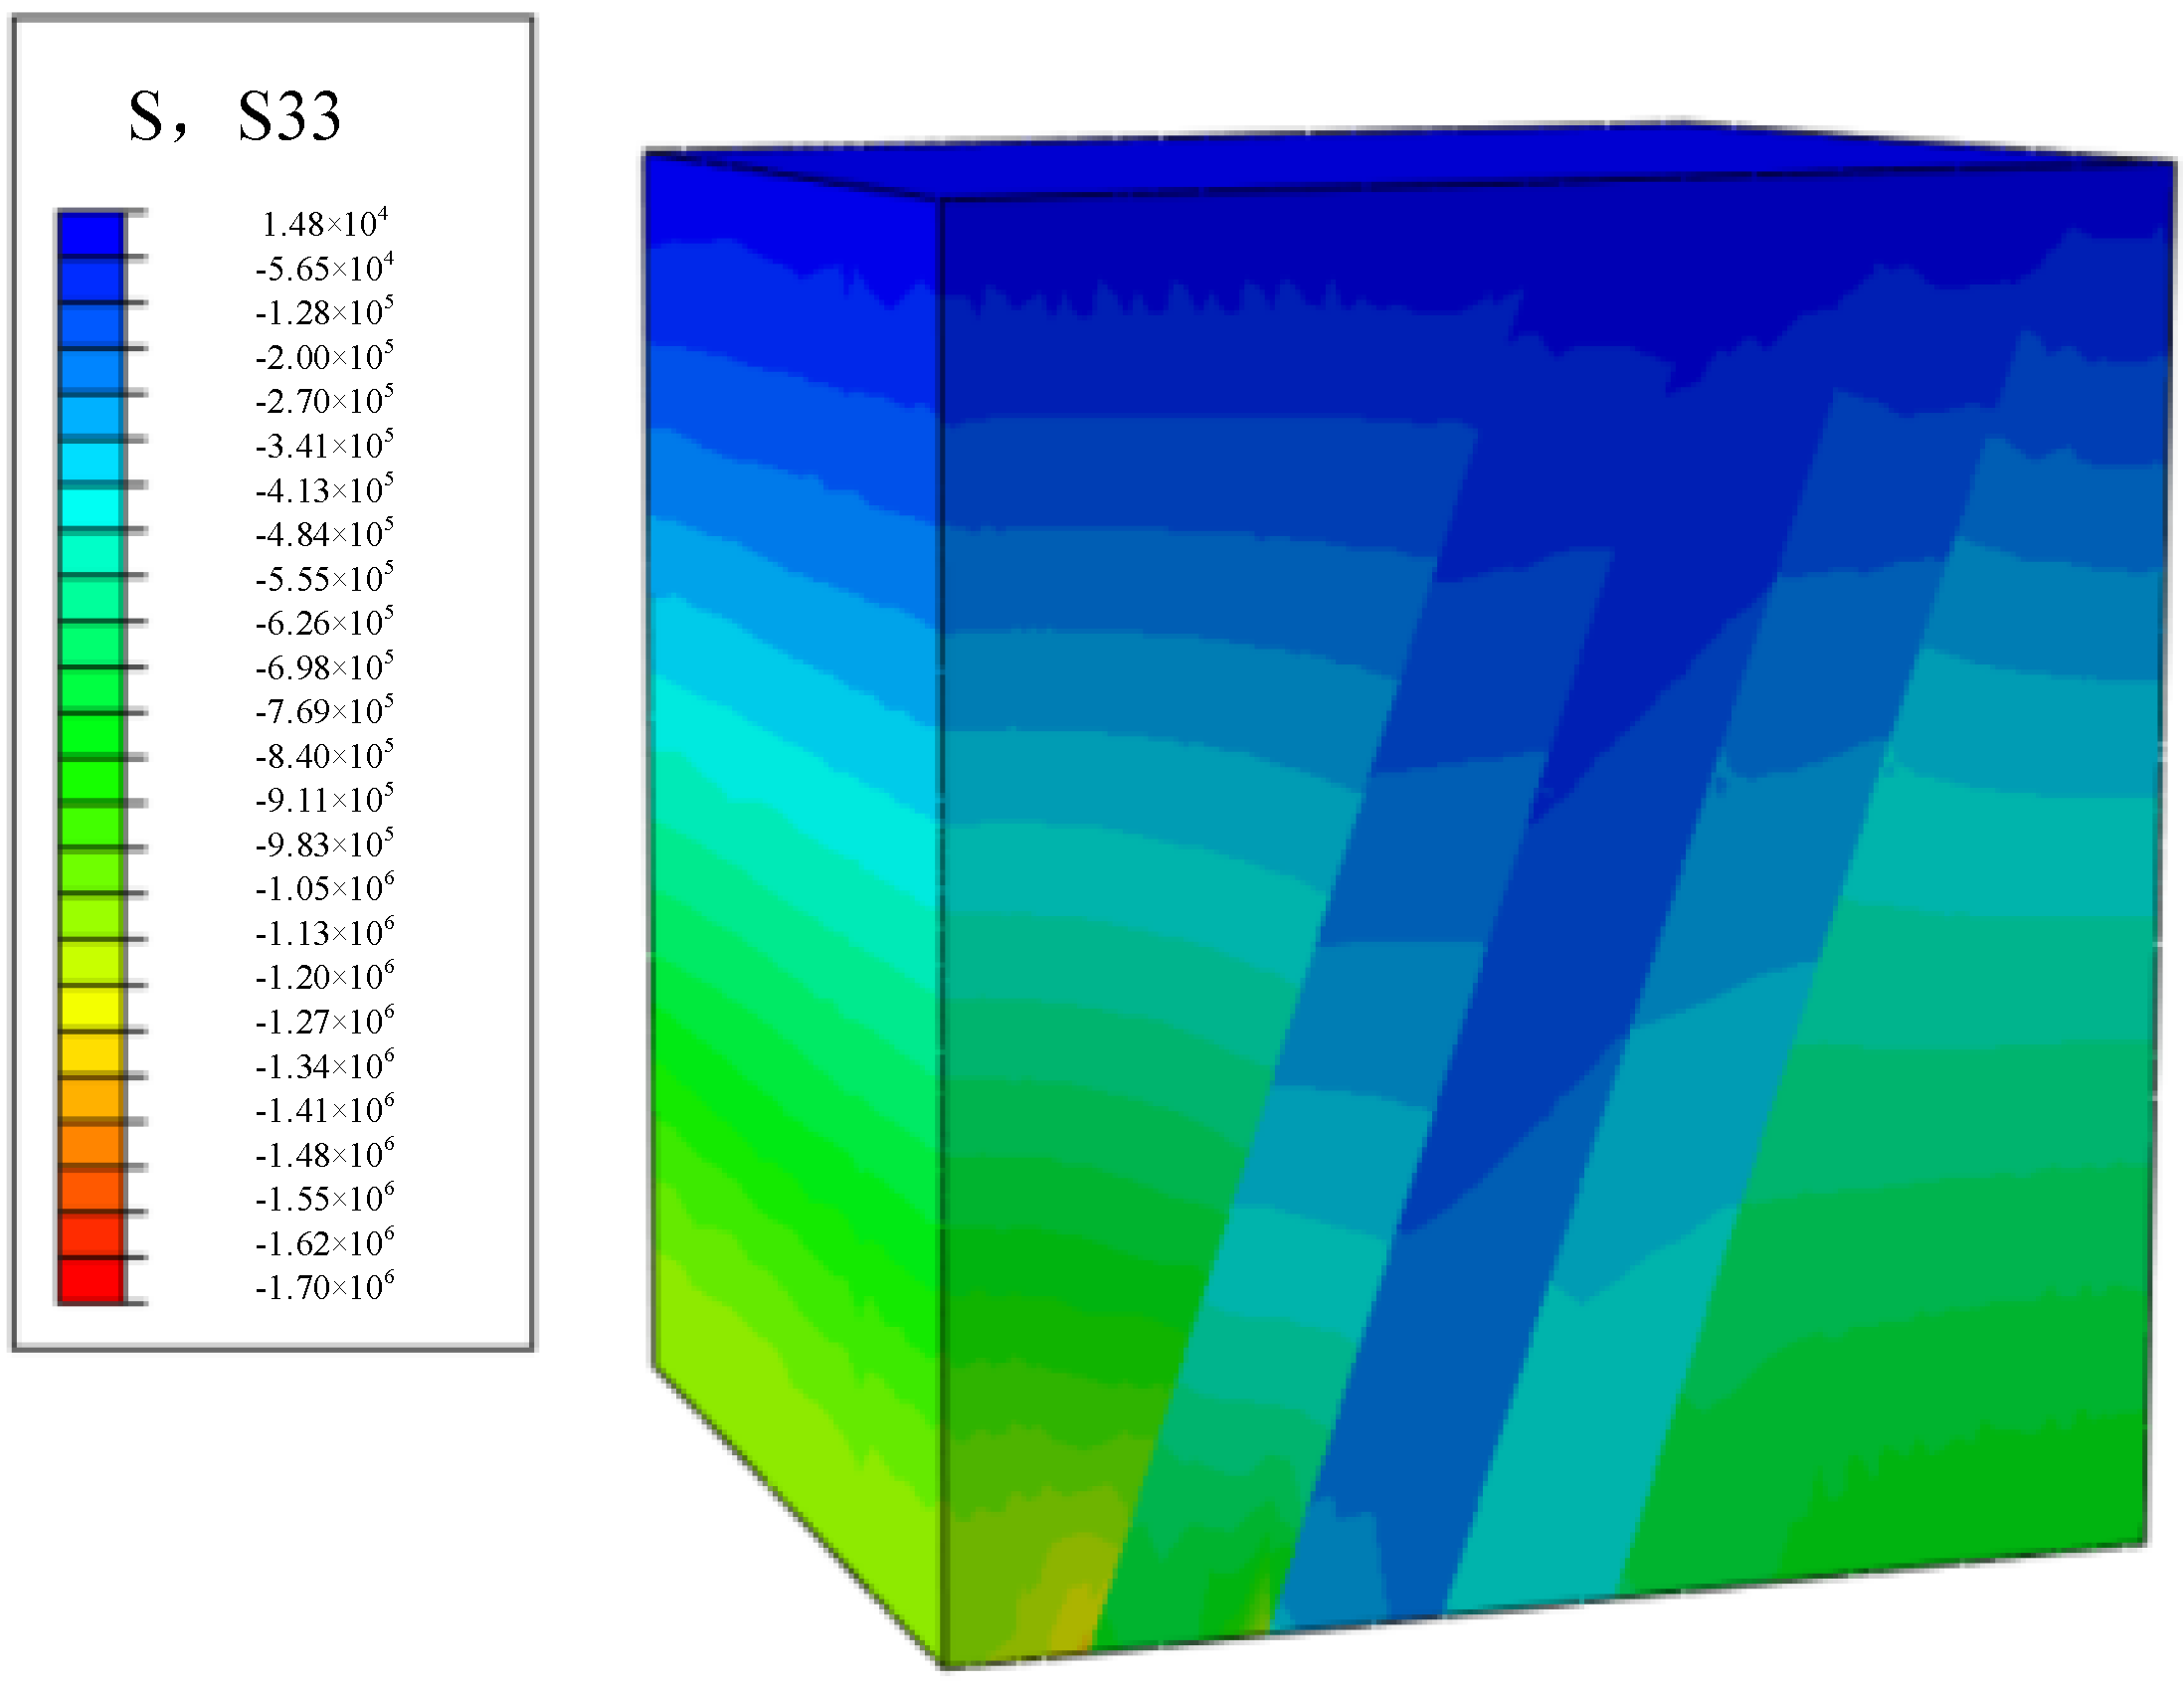
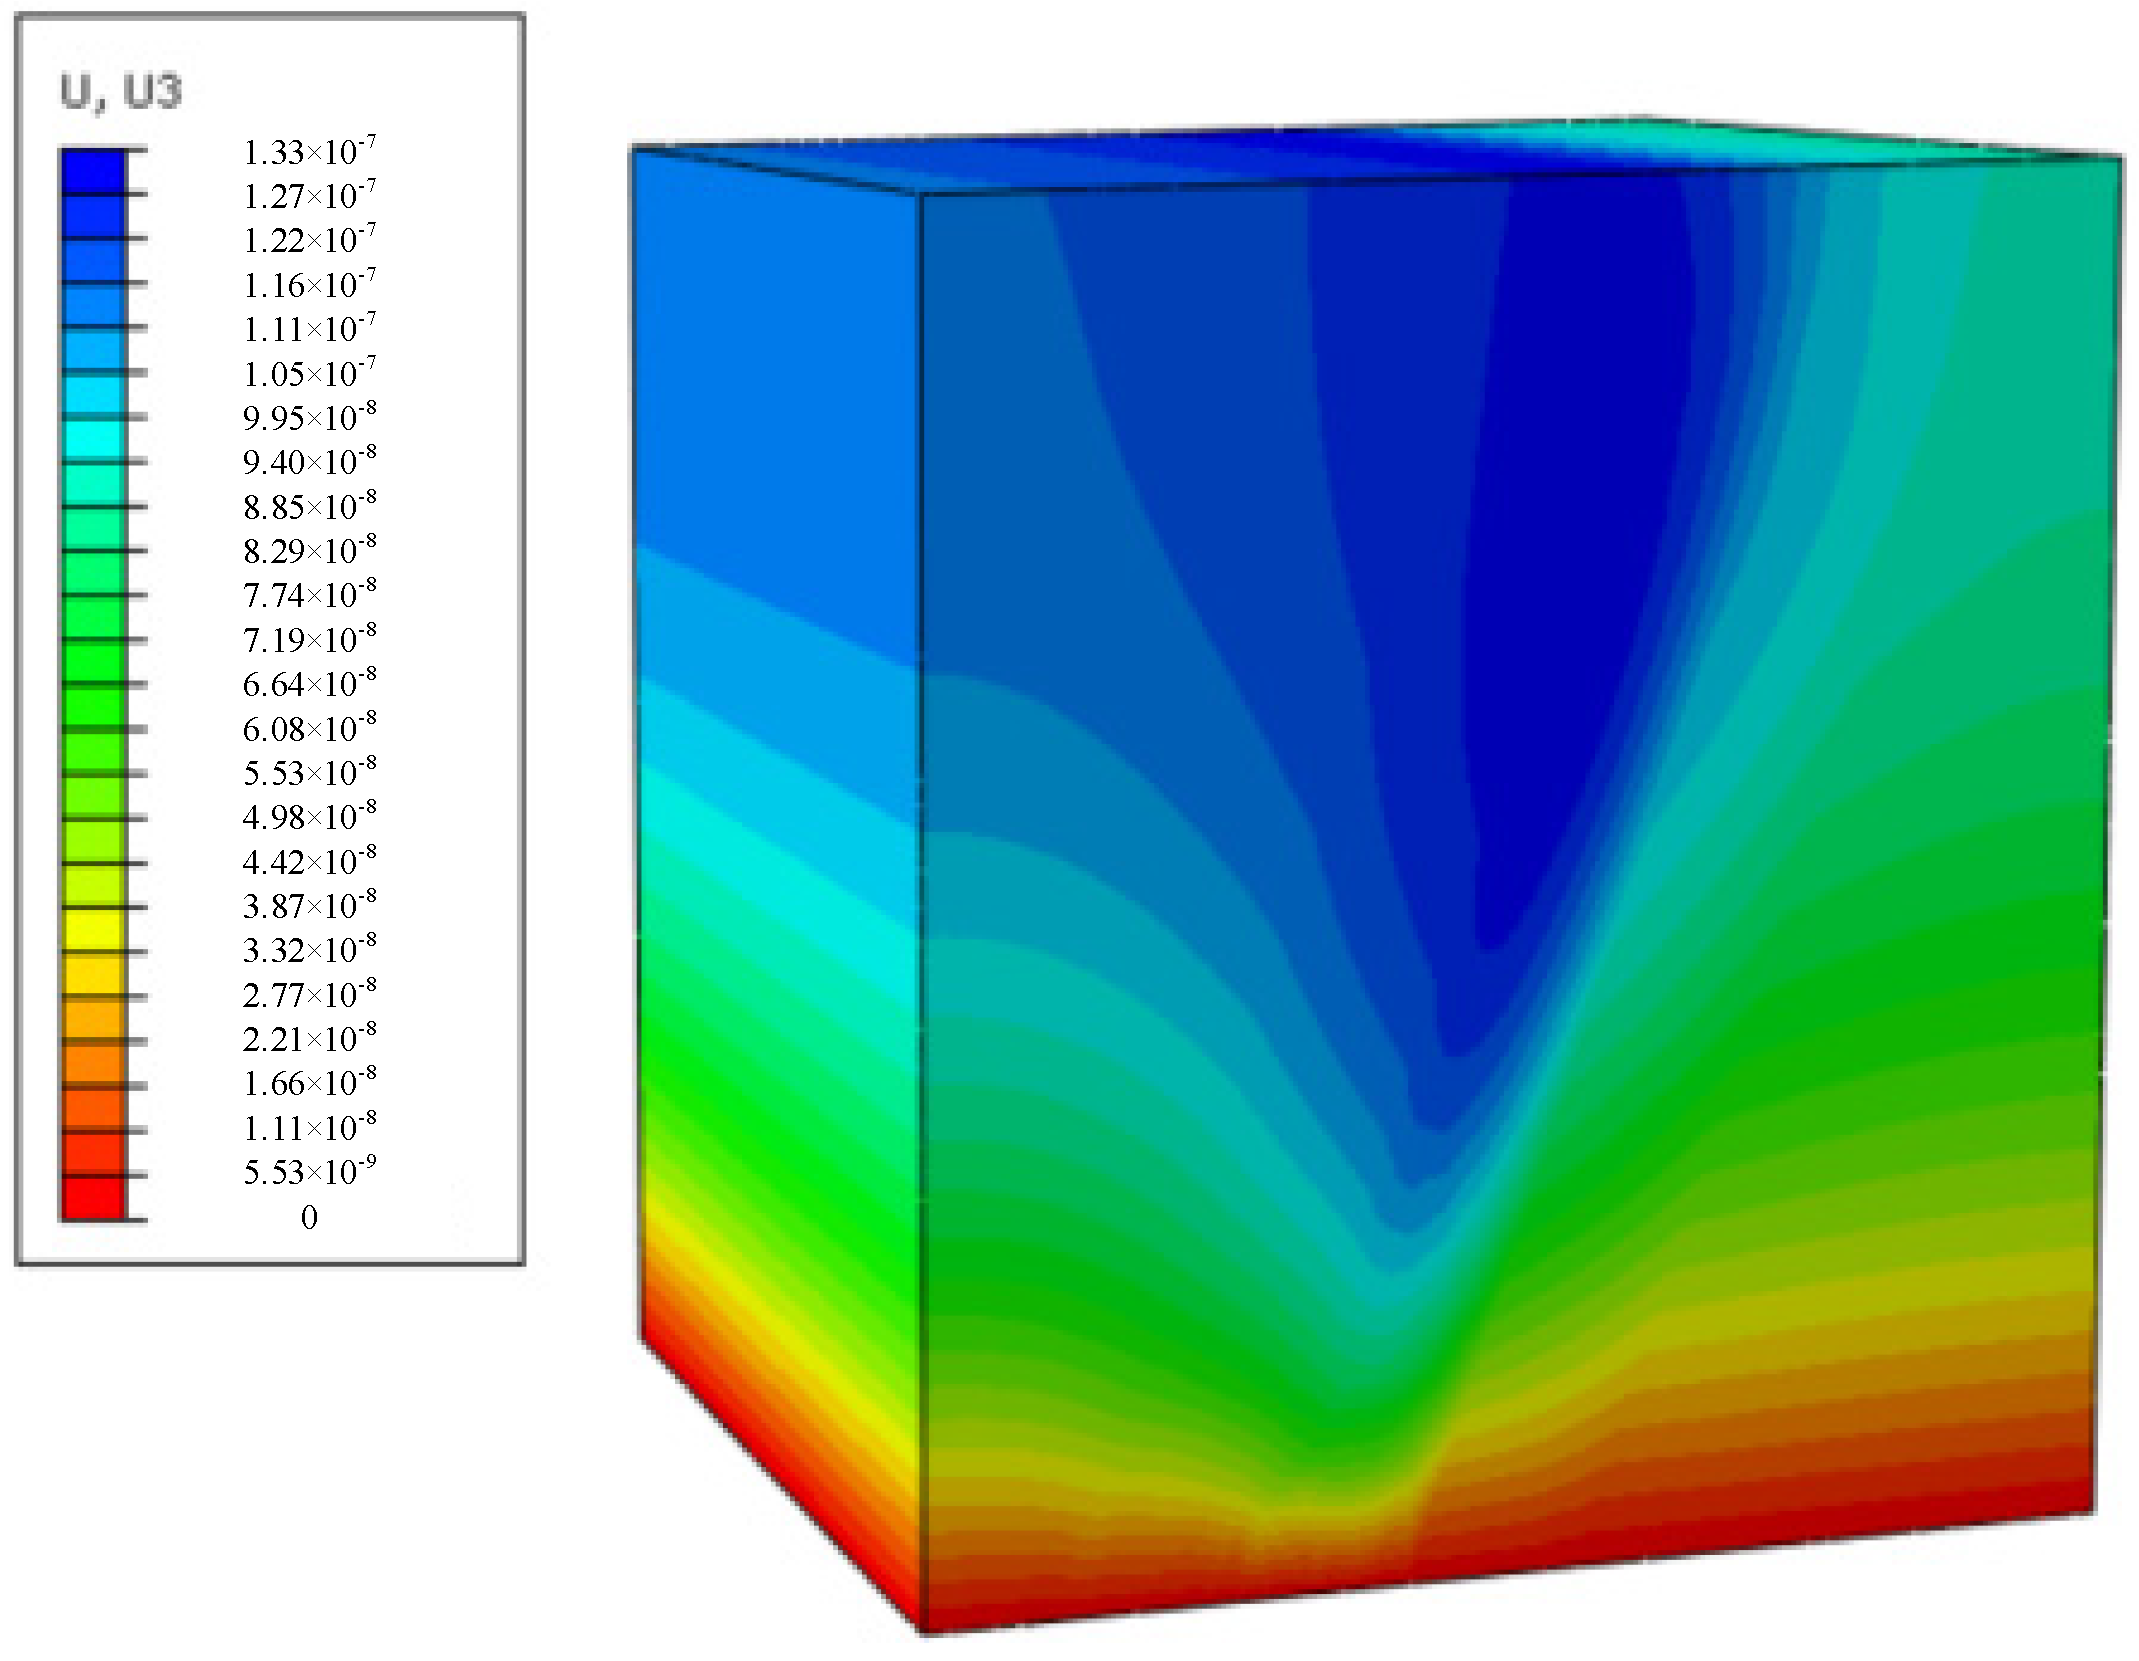
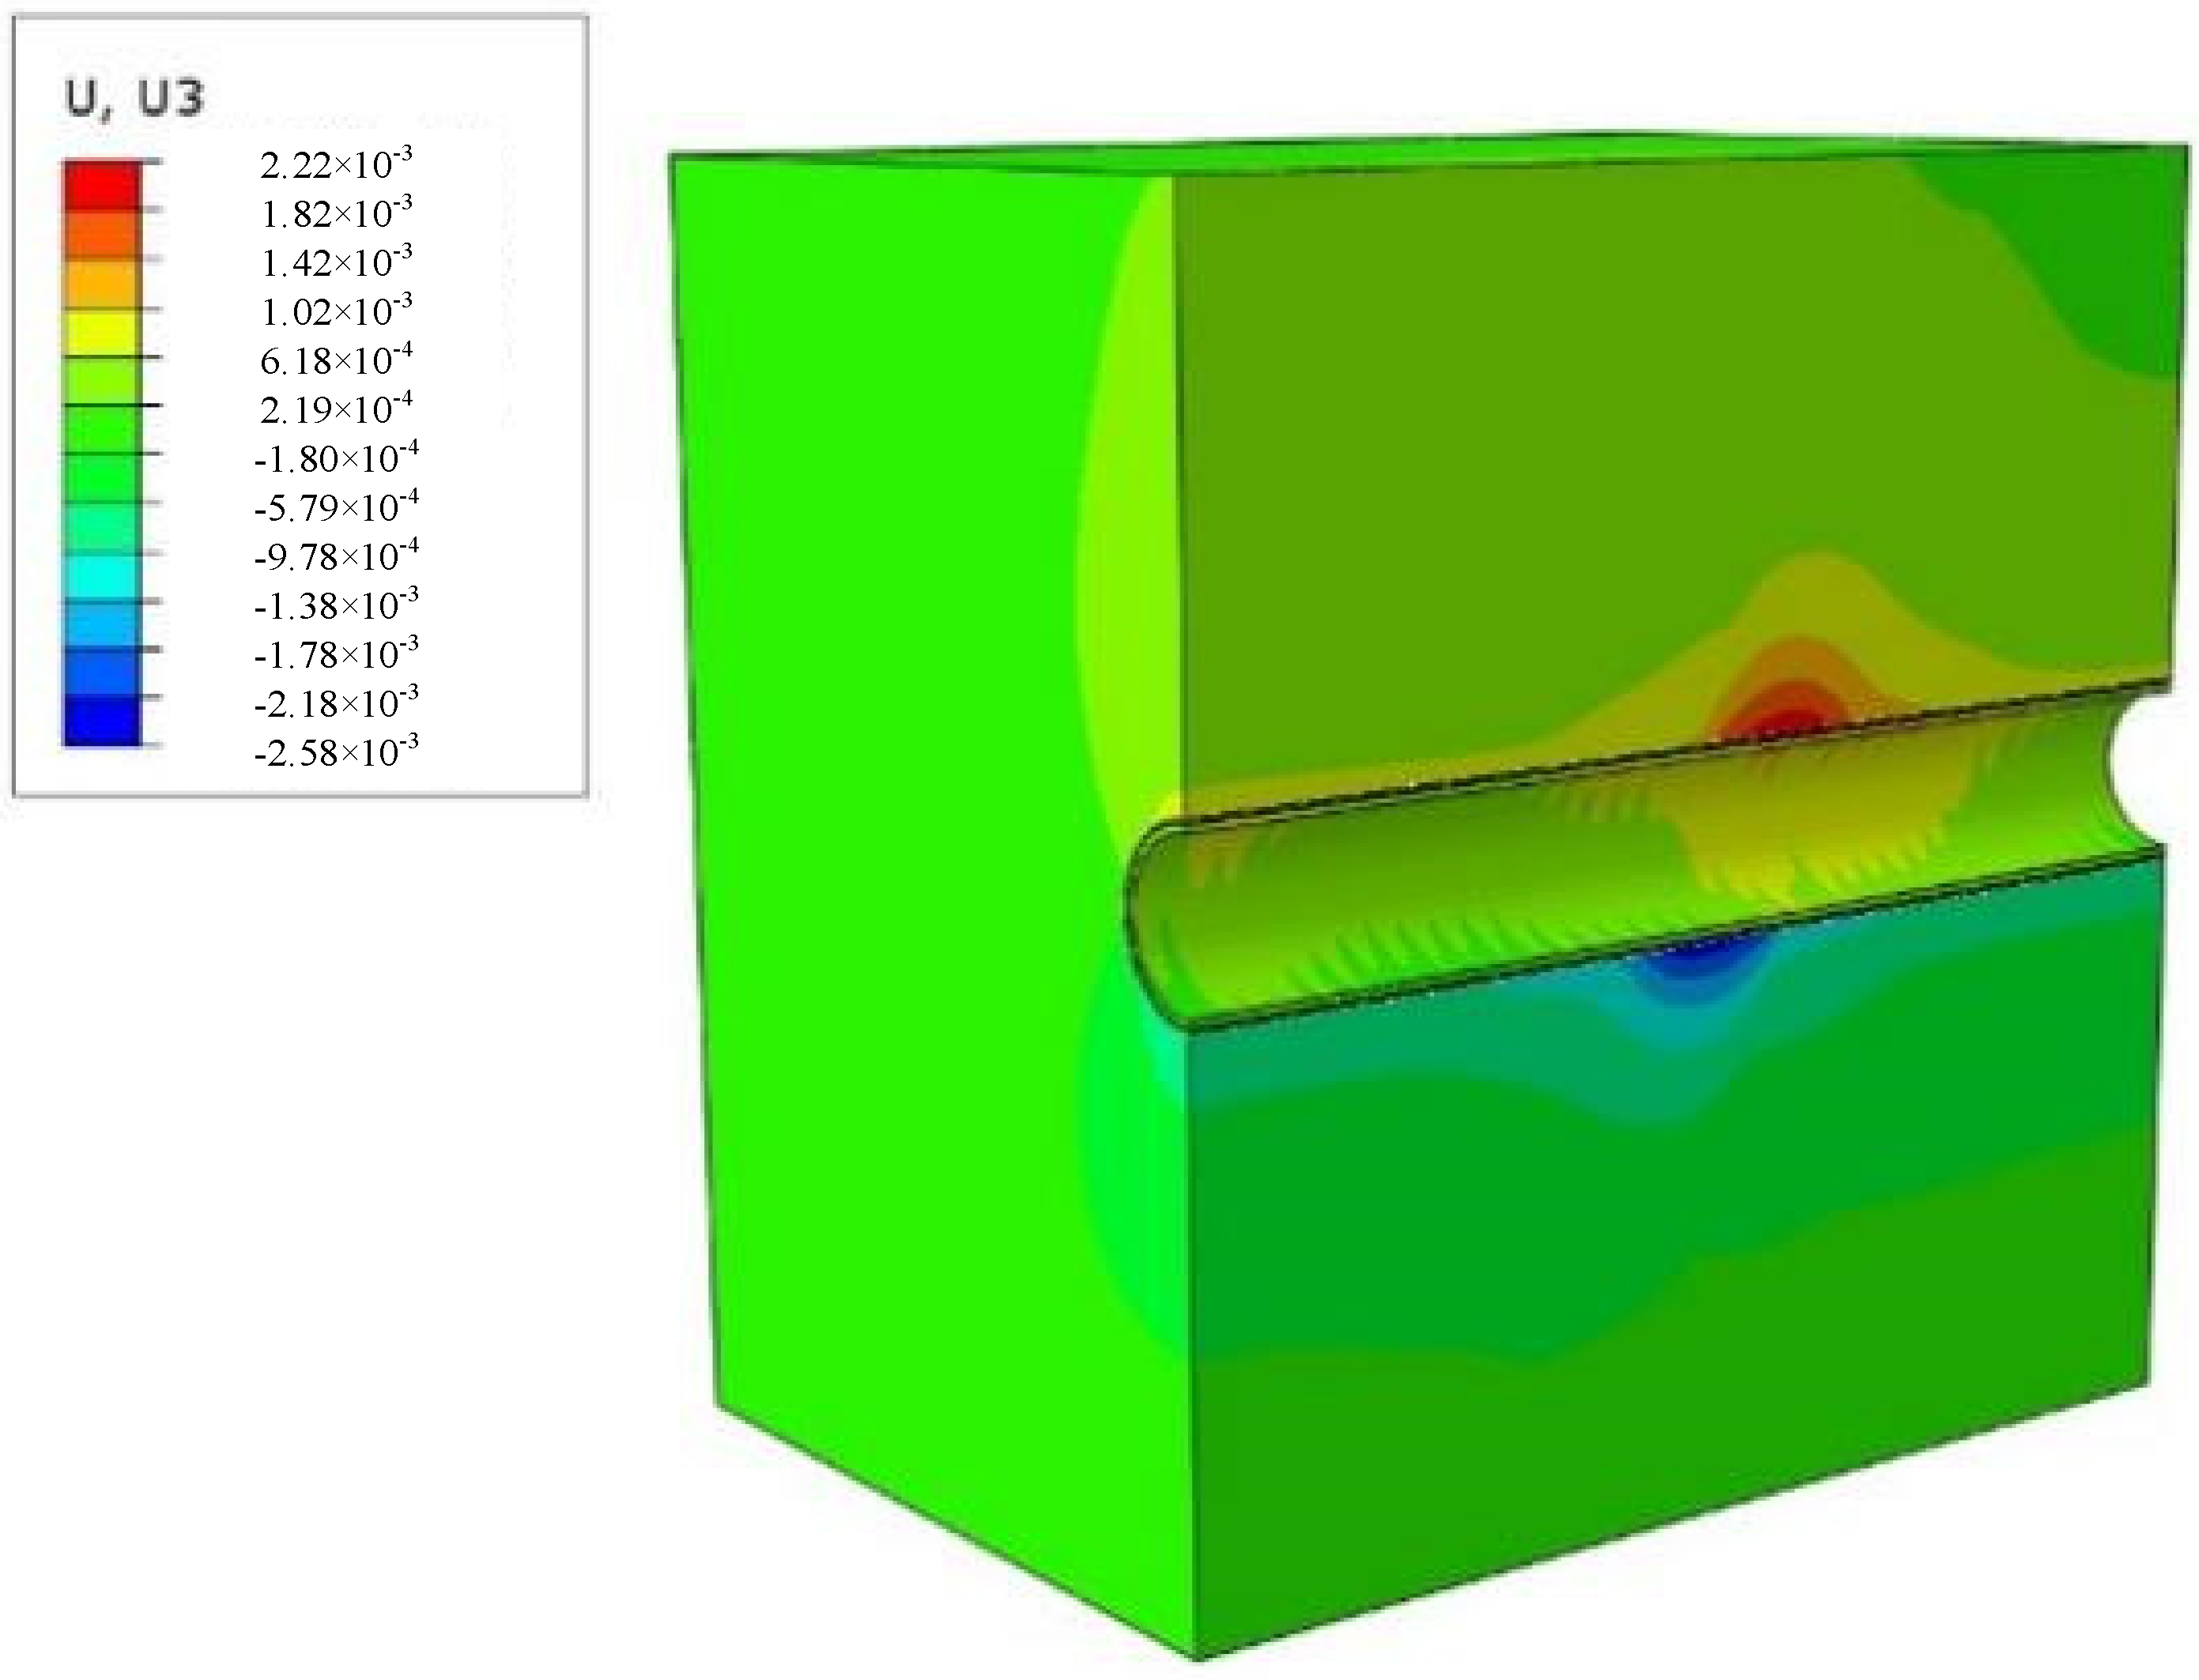
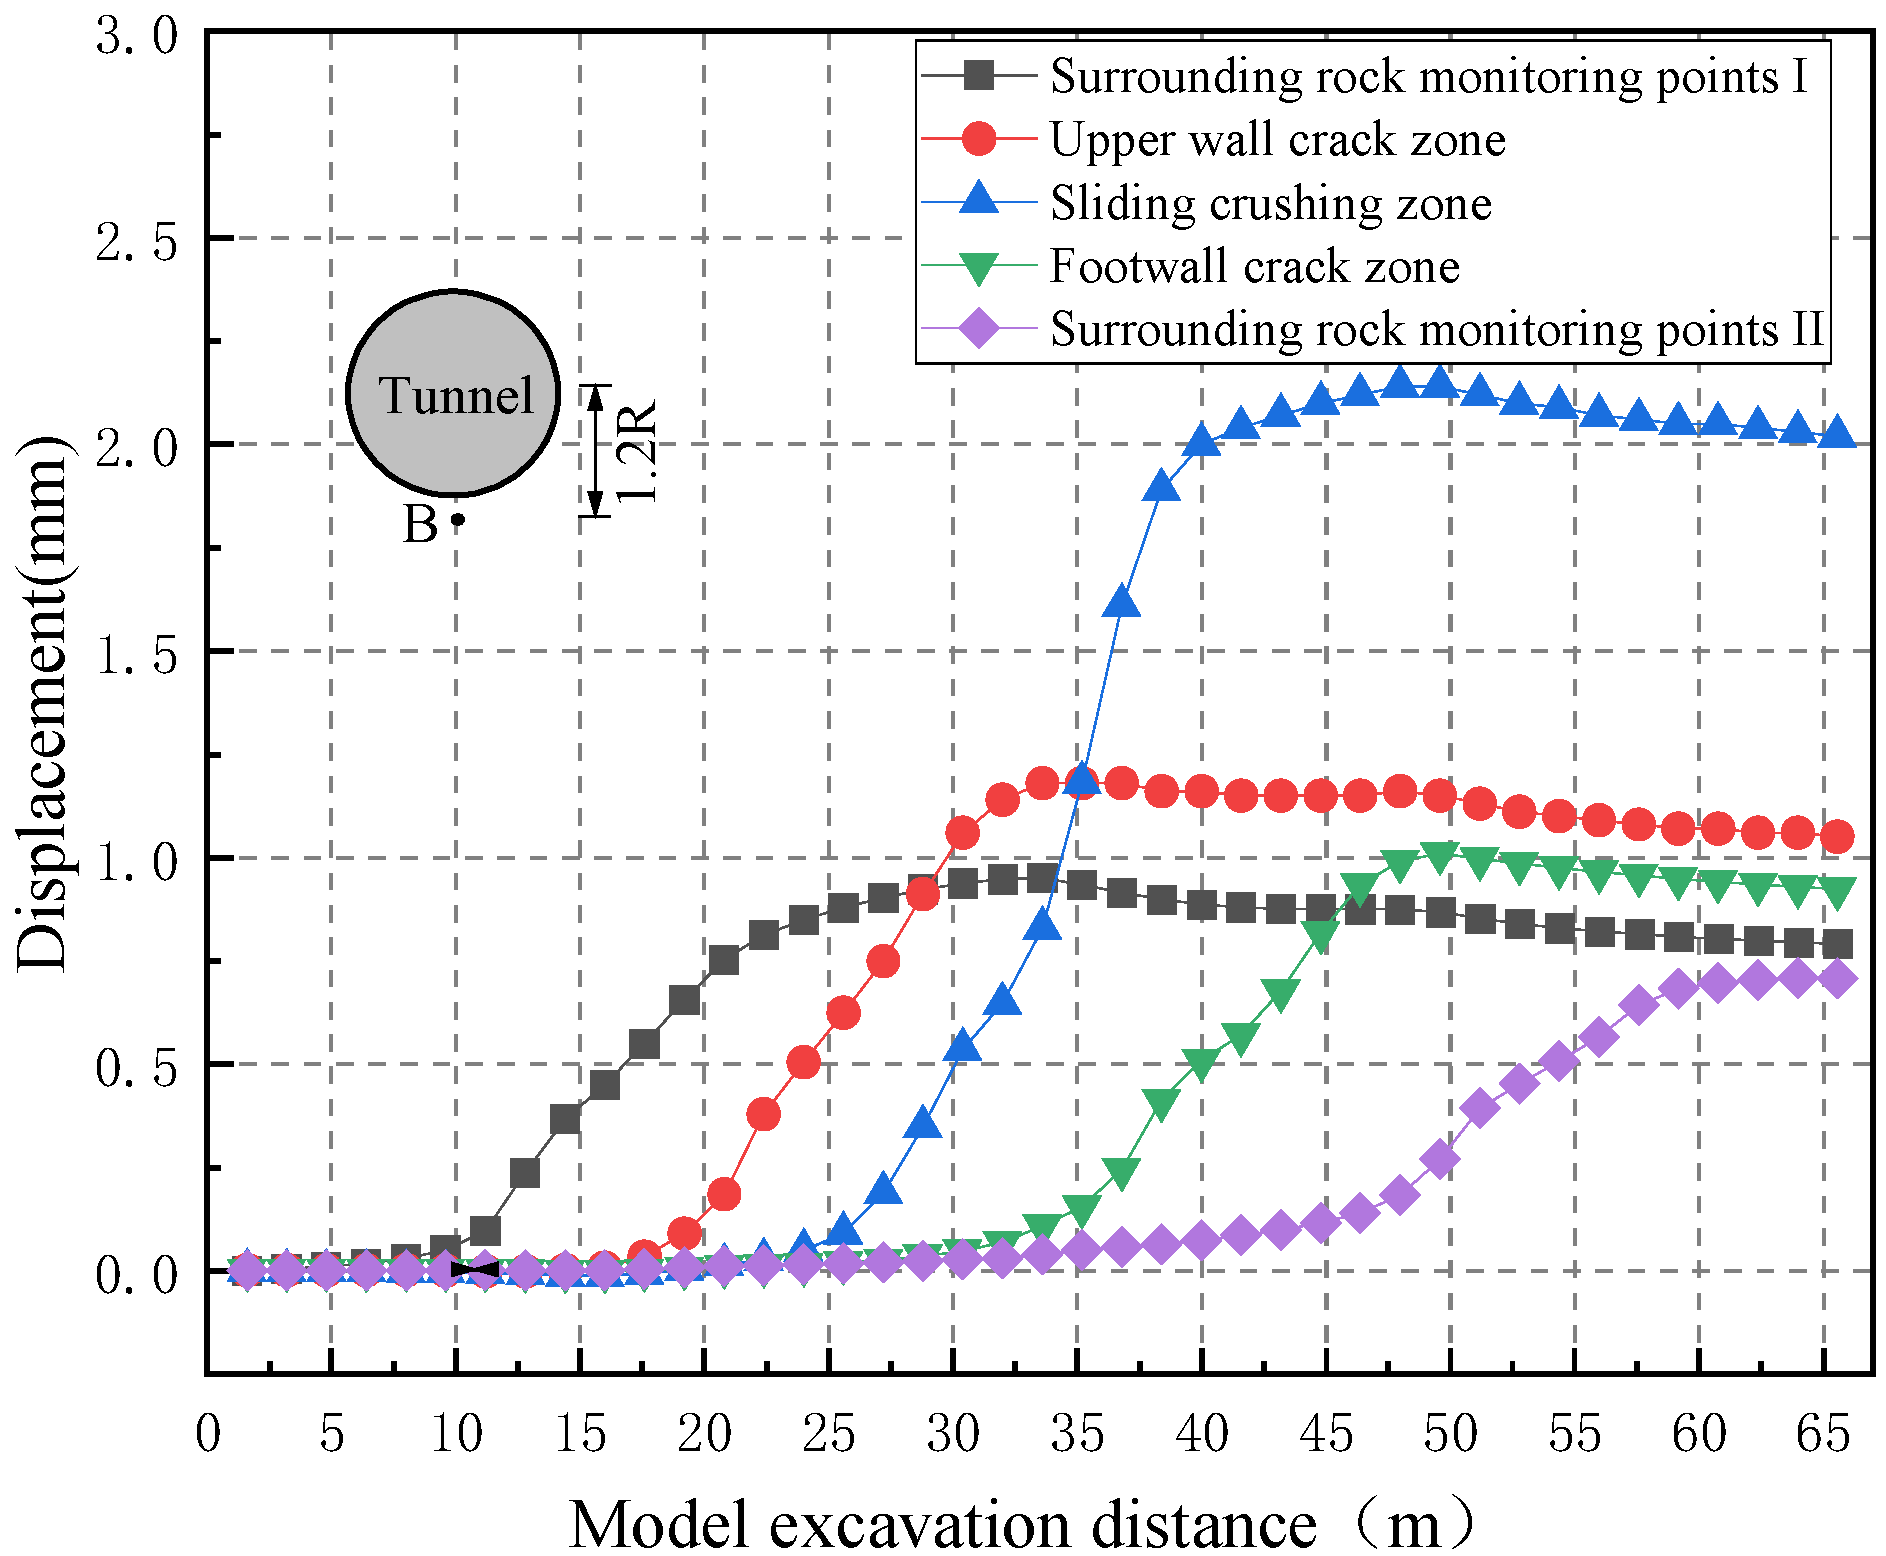
3.1. Analysis of Settlement and Deformation of Surrounding Rock

The displacement field during excavation is shown in Figure 11. And the displacement field after excavation completion is shown in Figure 12.
As shown in Figure 13 and Figure 14, the displacement curves of the observation points at 0.8 m above and below the tunnel as the shield tunneling progresses. As the shield tunneling machine advances, the monitoring points above the tunnel slowly move upwards. When the shield tail synchronous grouting passes through the monitoring points, the monitoring points reach their maximum upward movement. After the shield tunneling machine cutterhead section passes, the monitoring points begin to settle downwards. When synchronous grouting is carried out, the development of downward displacement slows down significantly. During the hardening process, the displacement of the monitoring points rapidly develops downwards and eventually stabilizes. For the monitoring points at the bottom of the tunnel, before the shield machine passes through, the mud pressure on the face of the tunnel has almost no effect on the displacement of the monitoring points. Until the shield machine cutterhead section passes through the monitoring points, the displacement of the monitoring points gradually rises upwards, and finally reaches stability. Compared with the monitoring points of rock and soil before and after the fault fracture zone, the displacement of the monitoring points inside the fracture zone is significant, and the deformation is significantly higher than that of the crack zone and ordinary normal surrounding rock monitoring points. The maximum displacement deformation reaches 2.2 mm.

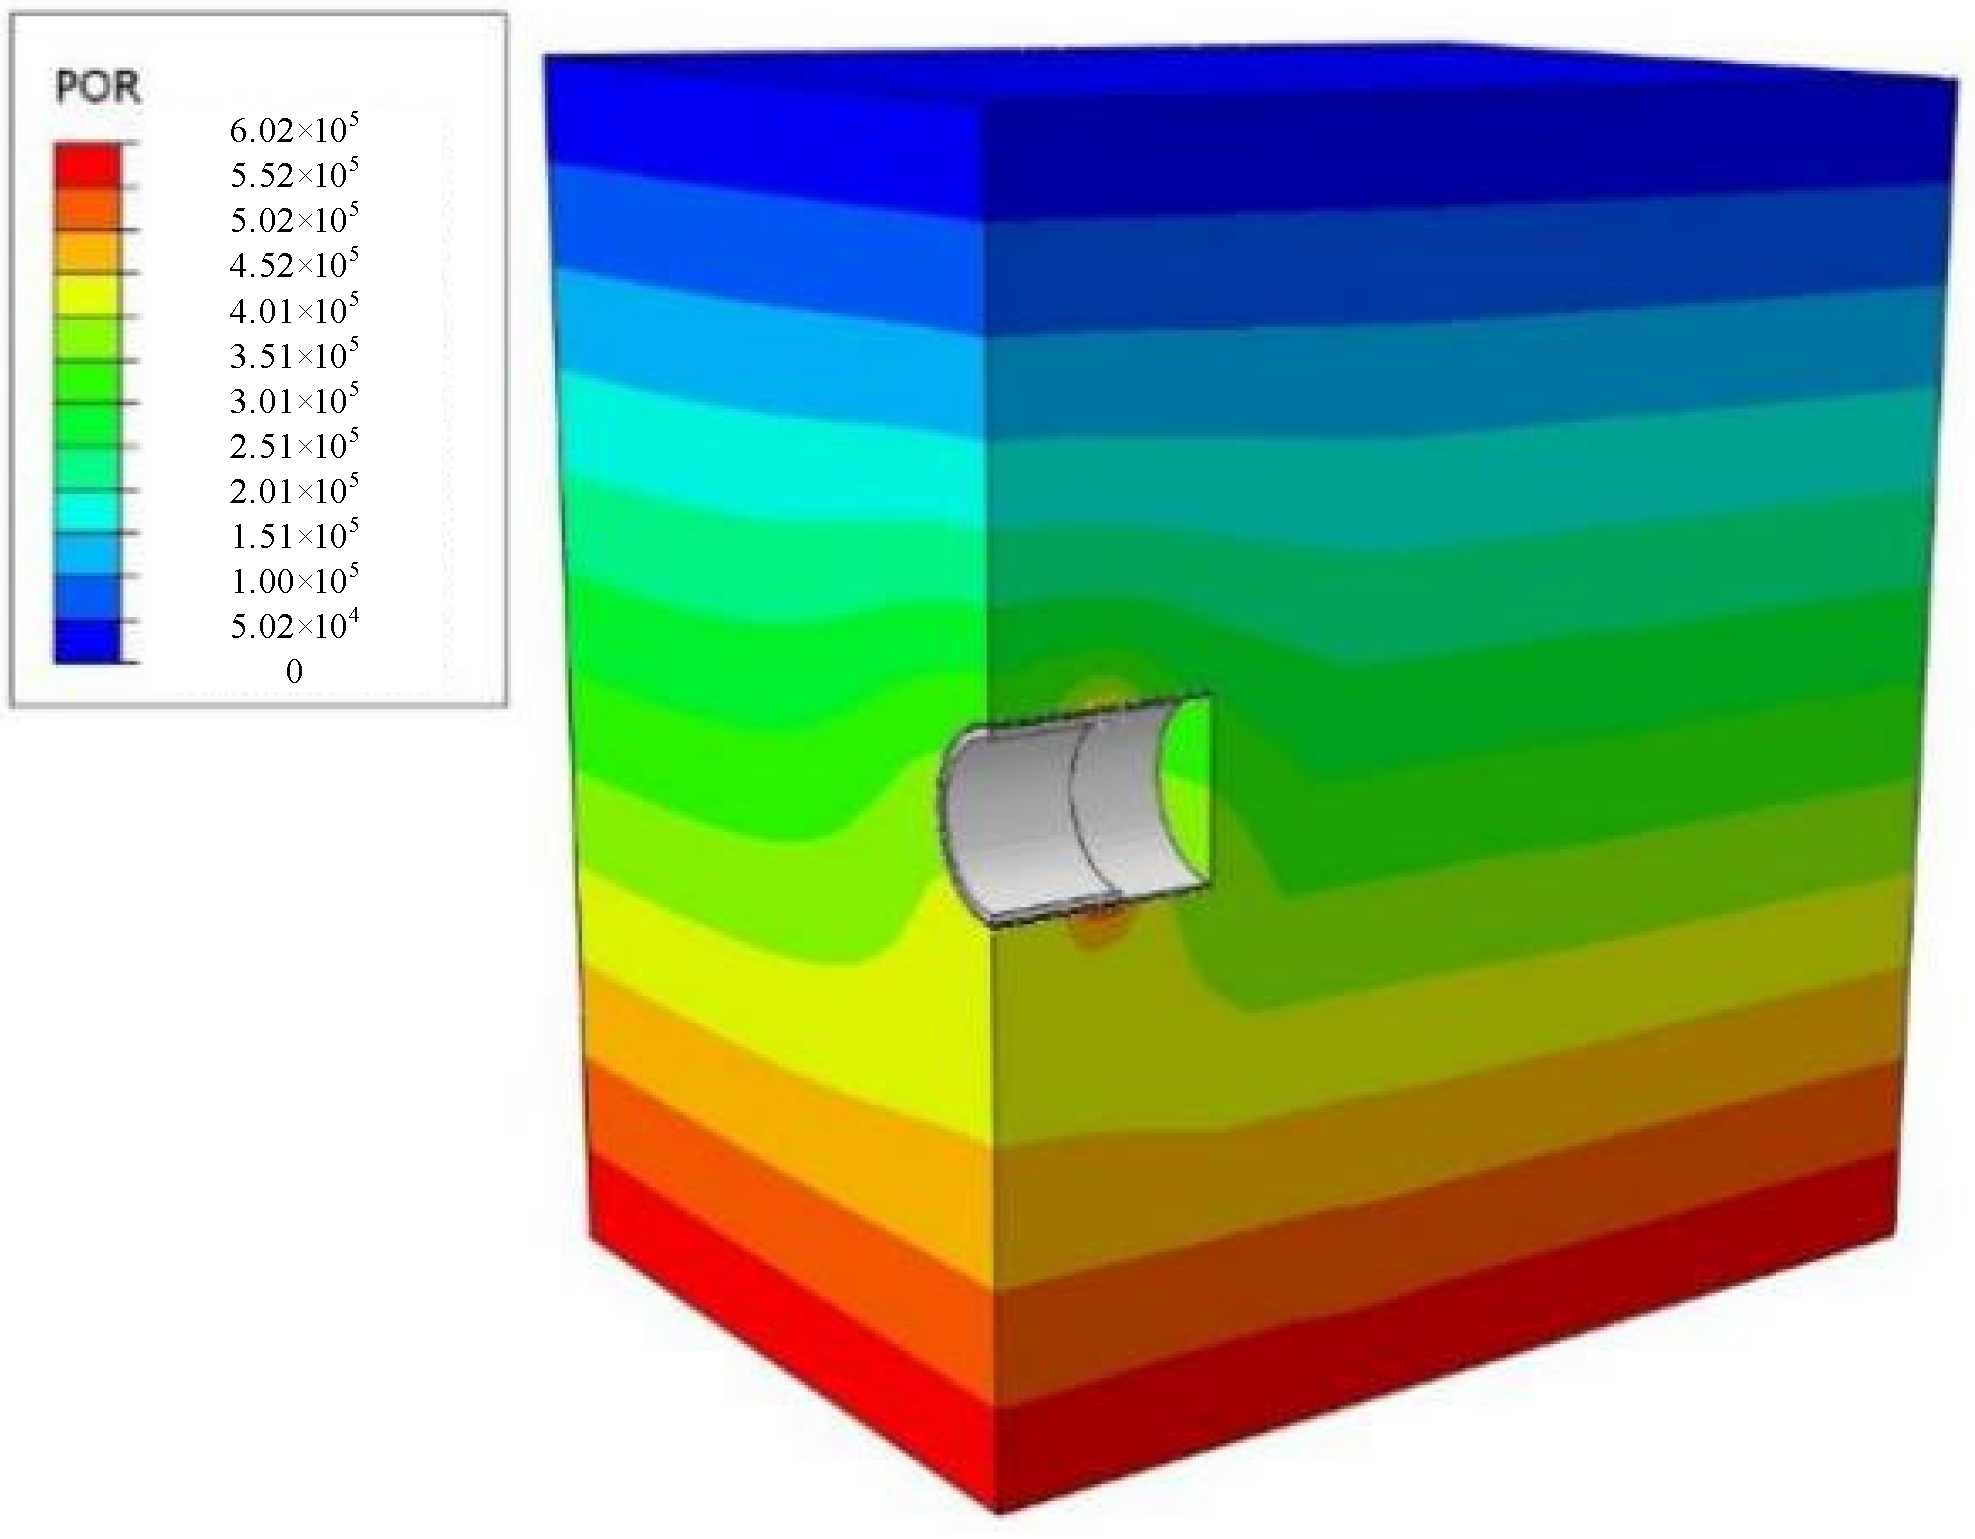
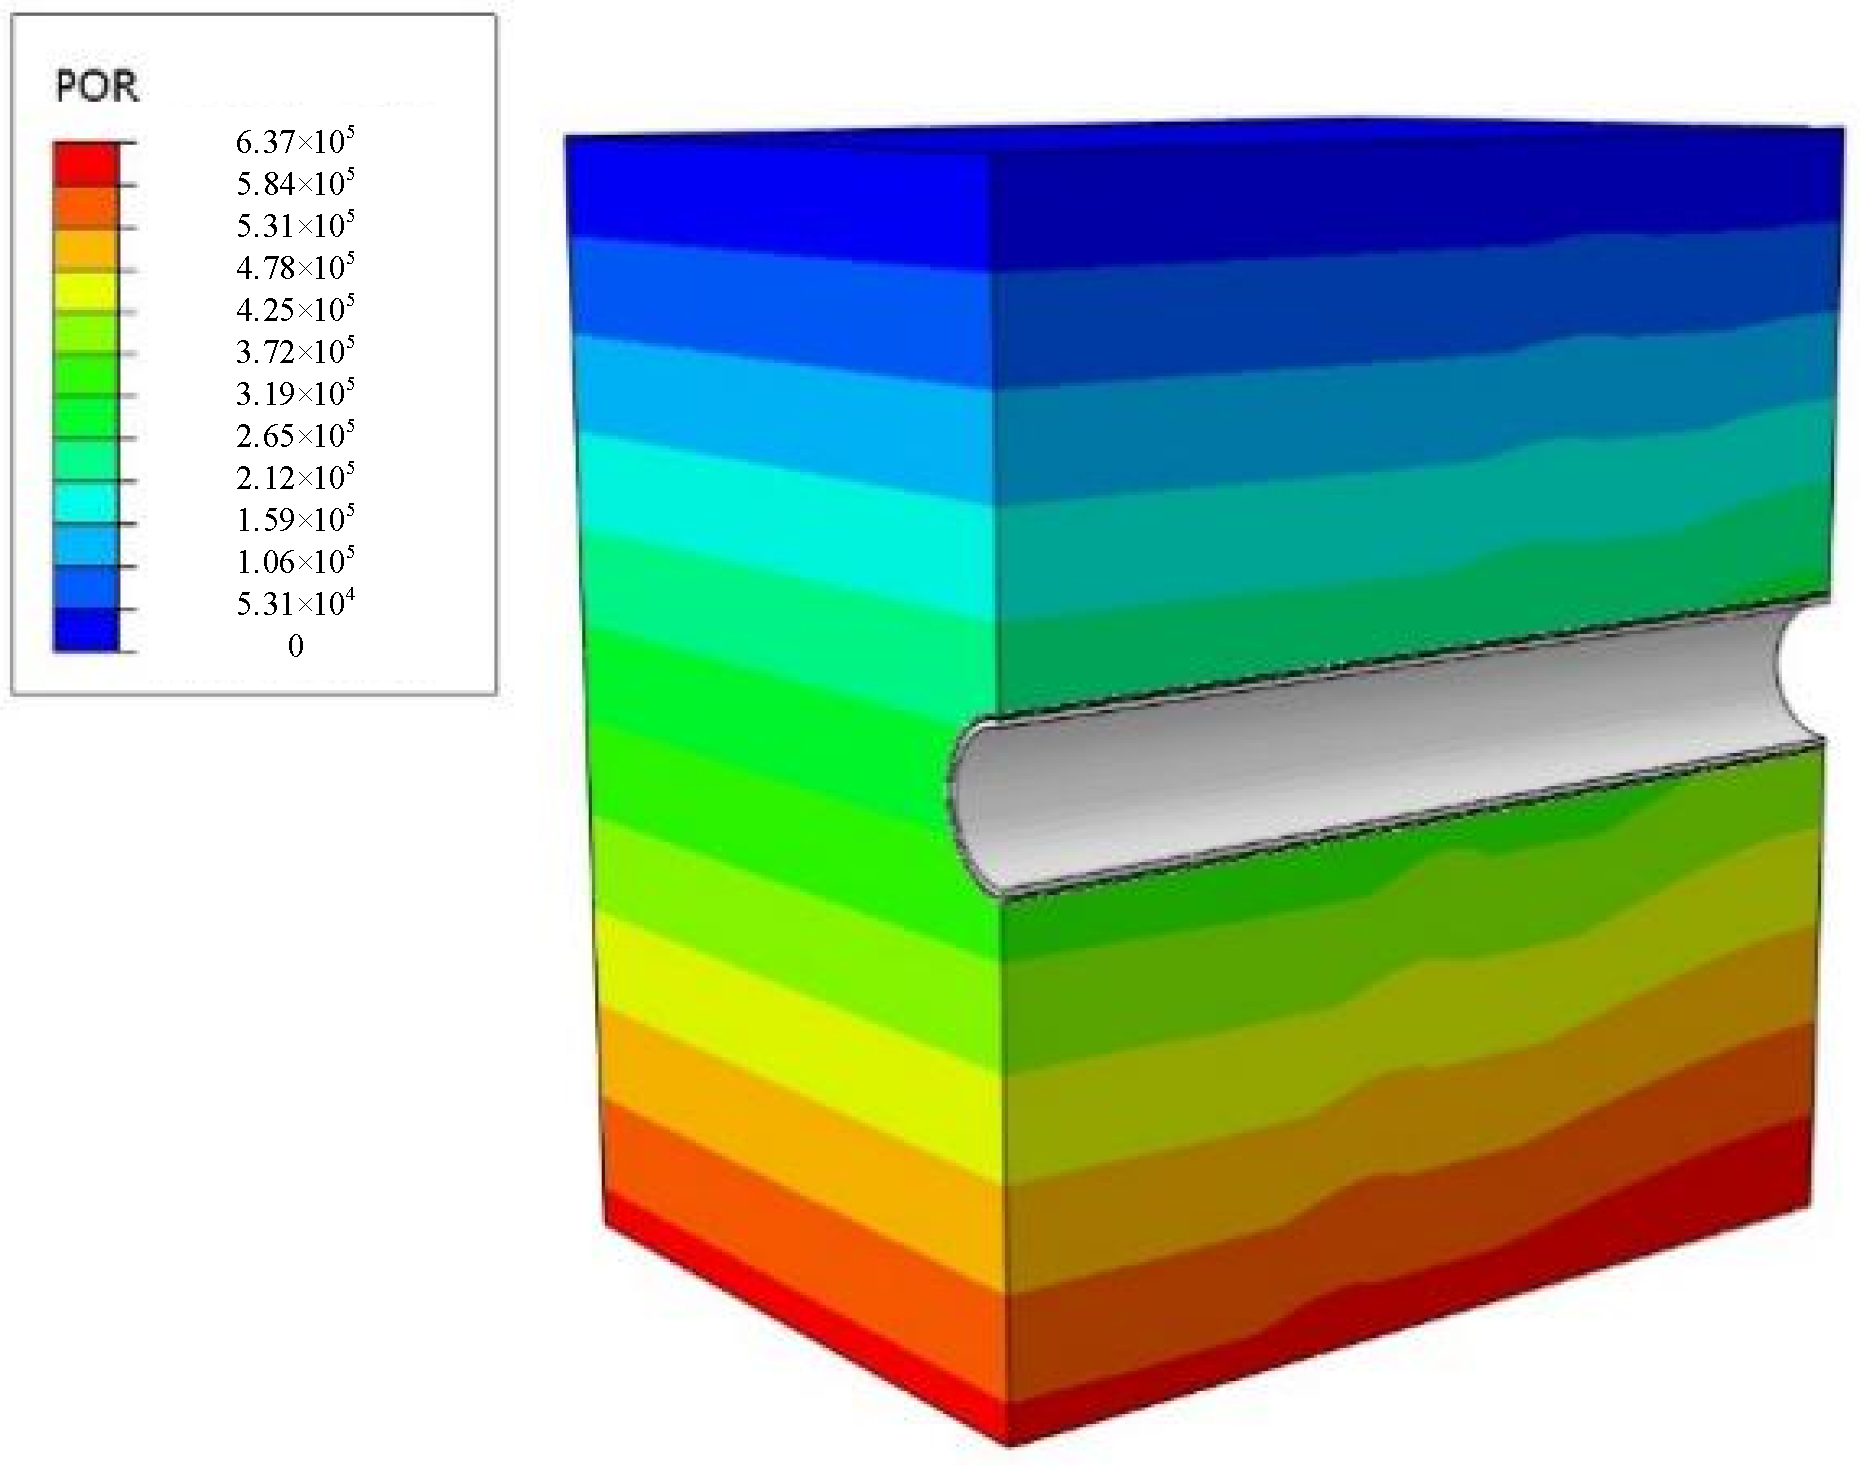
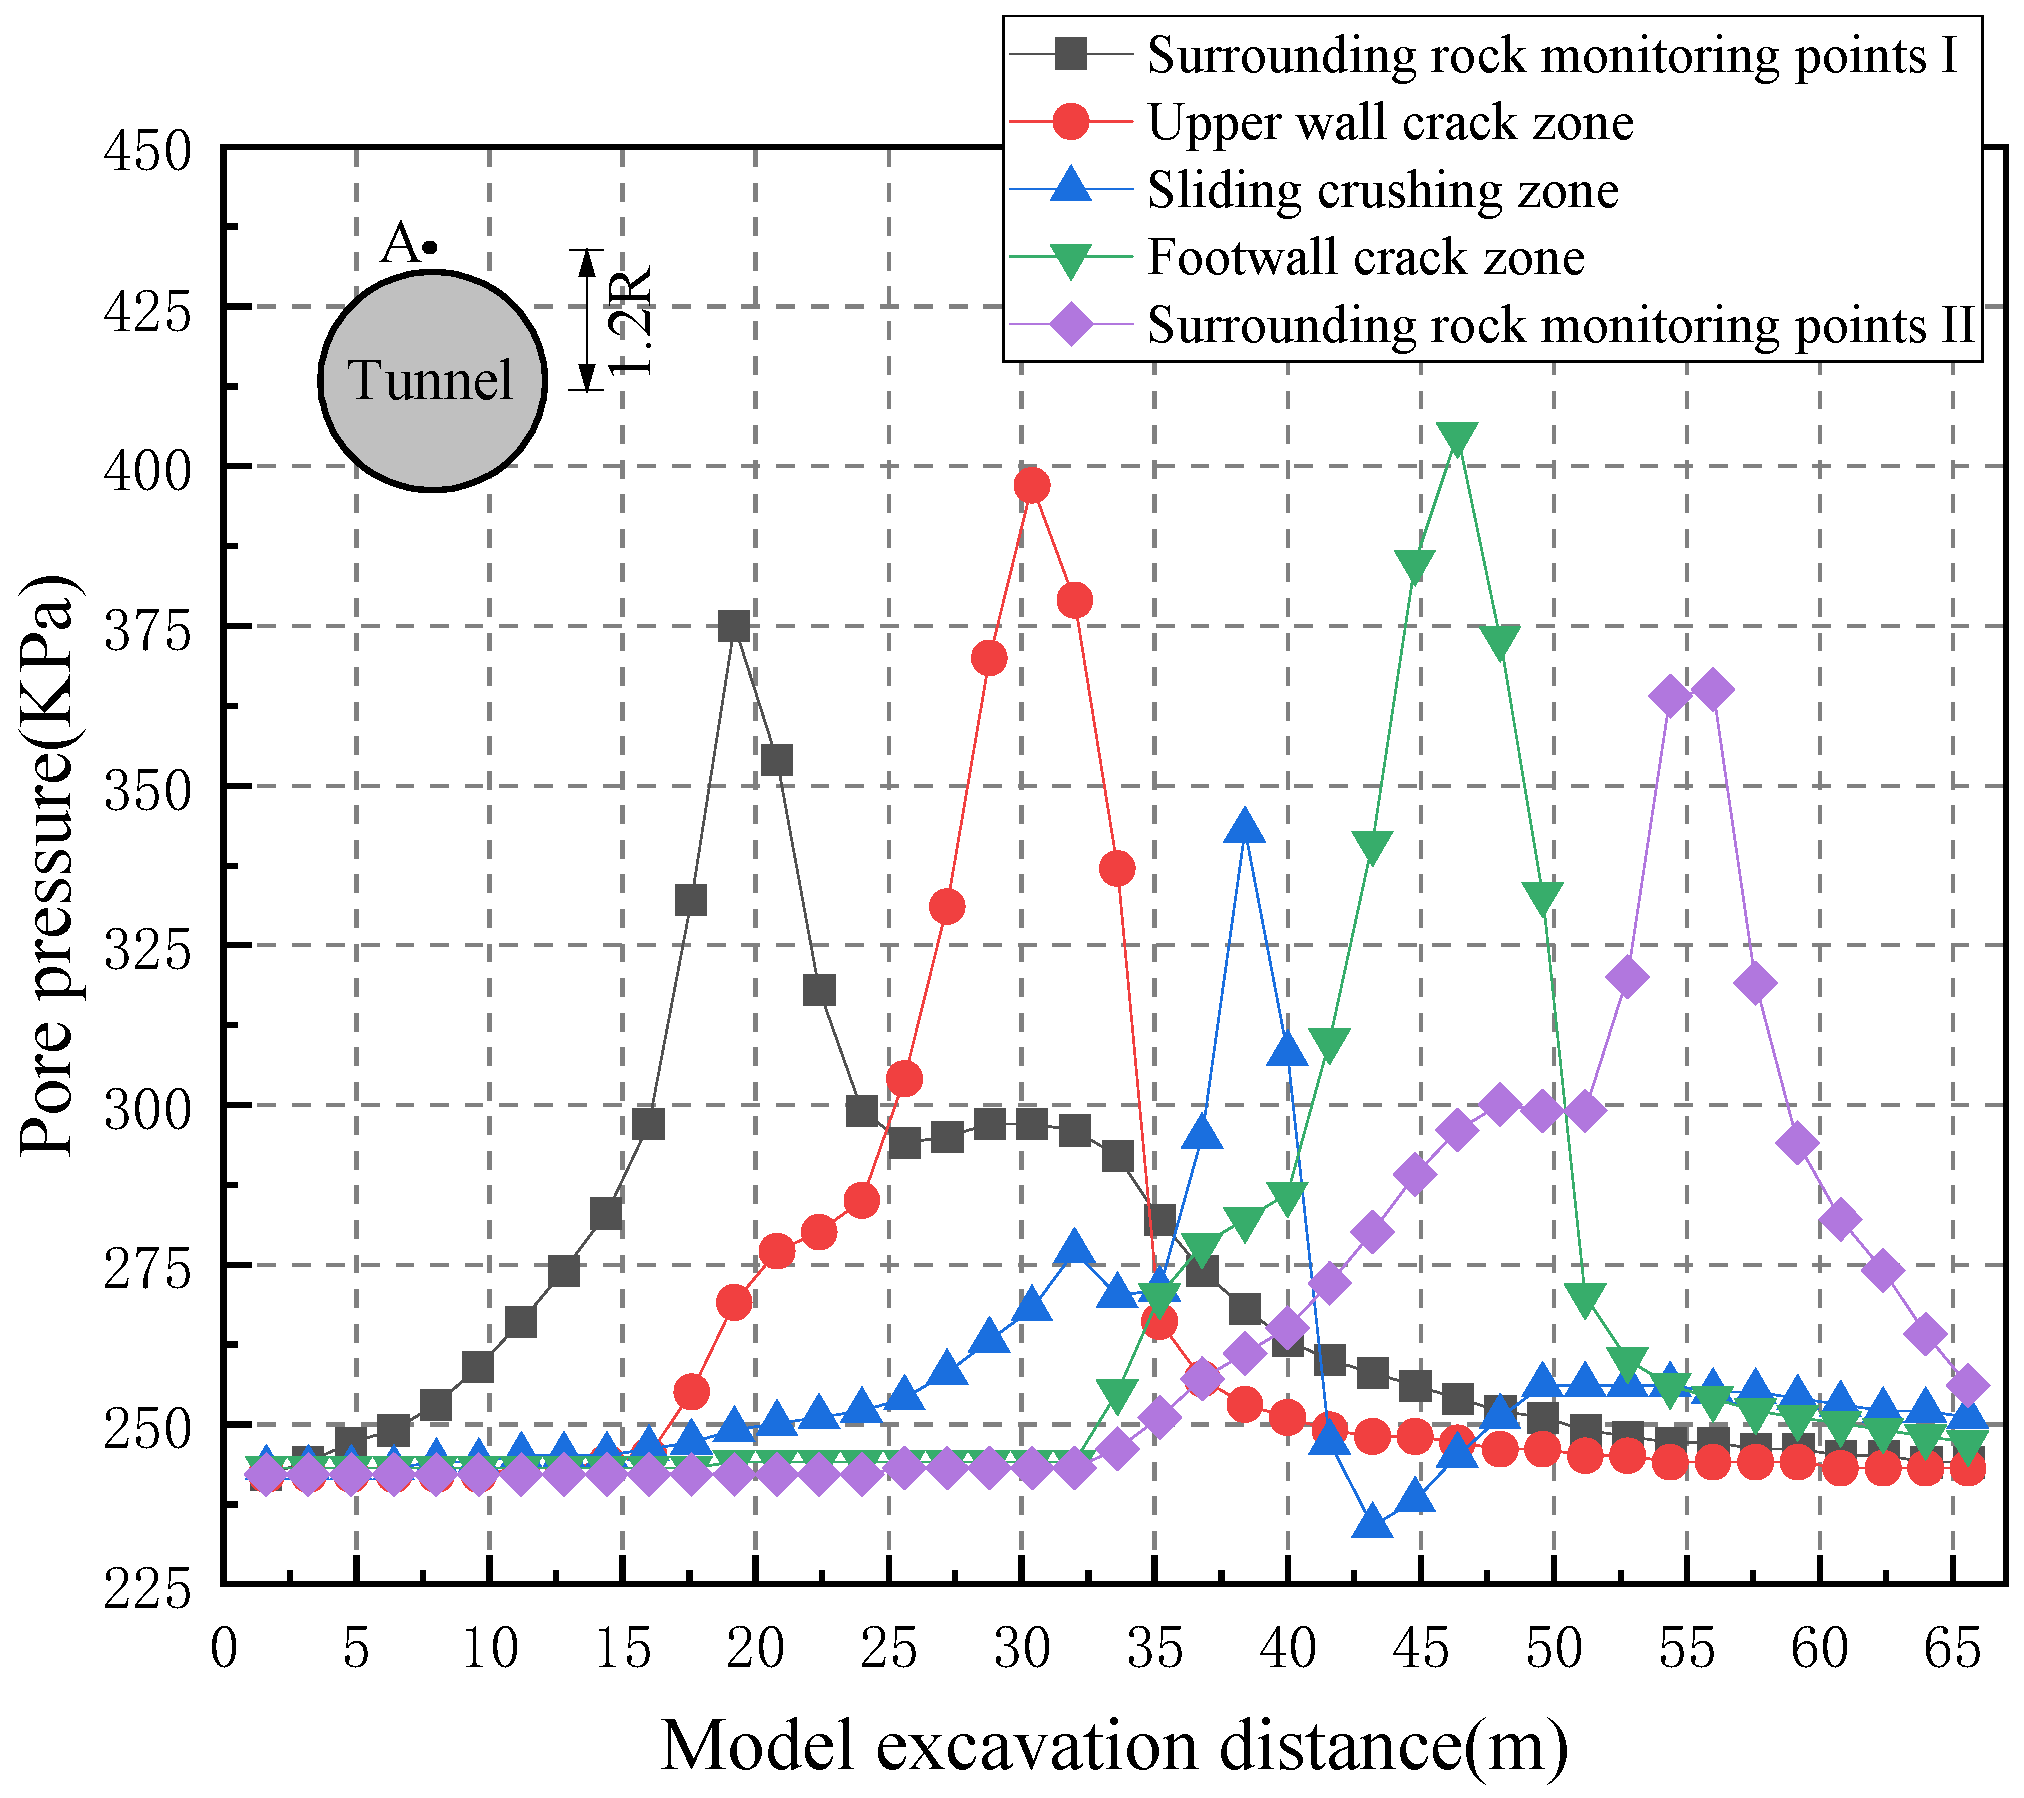
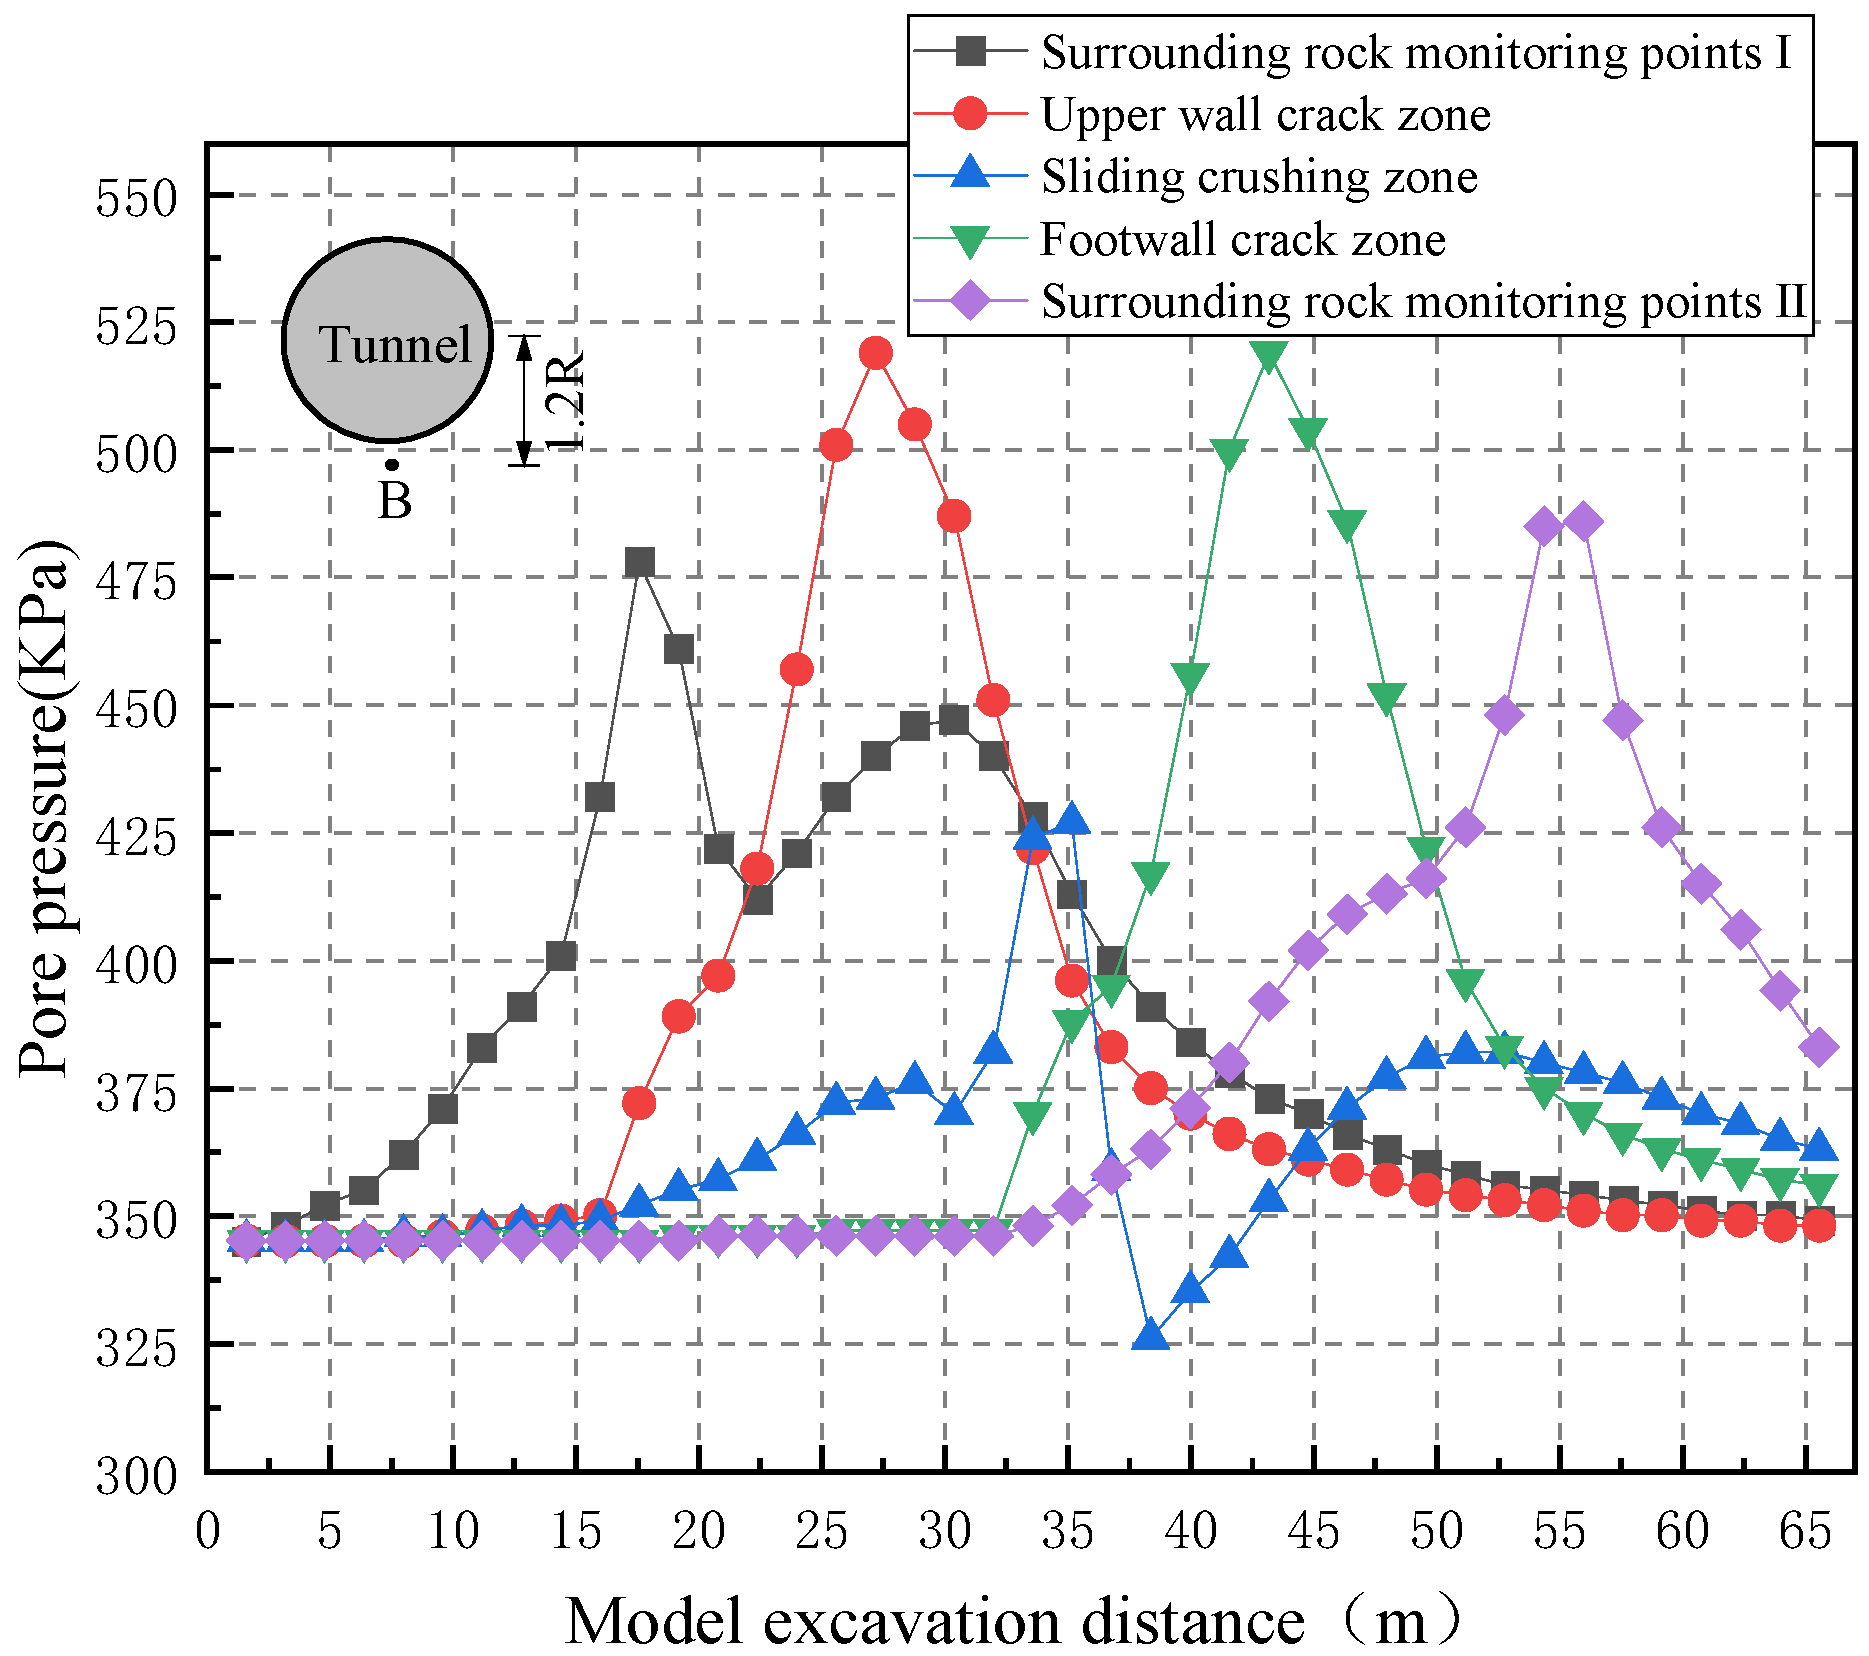
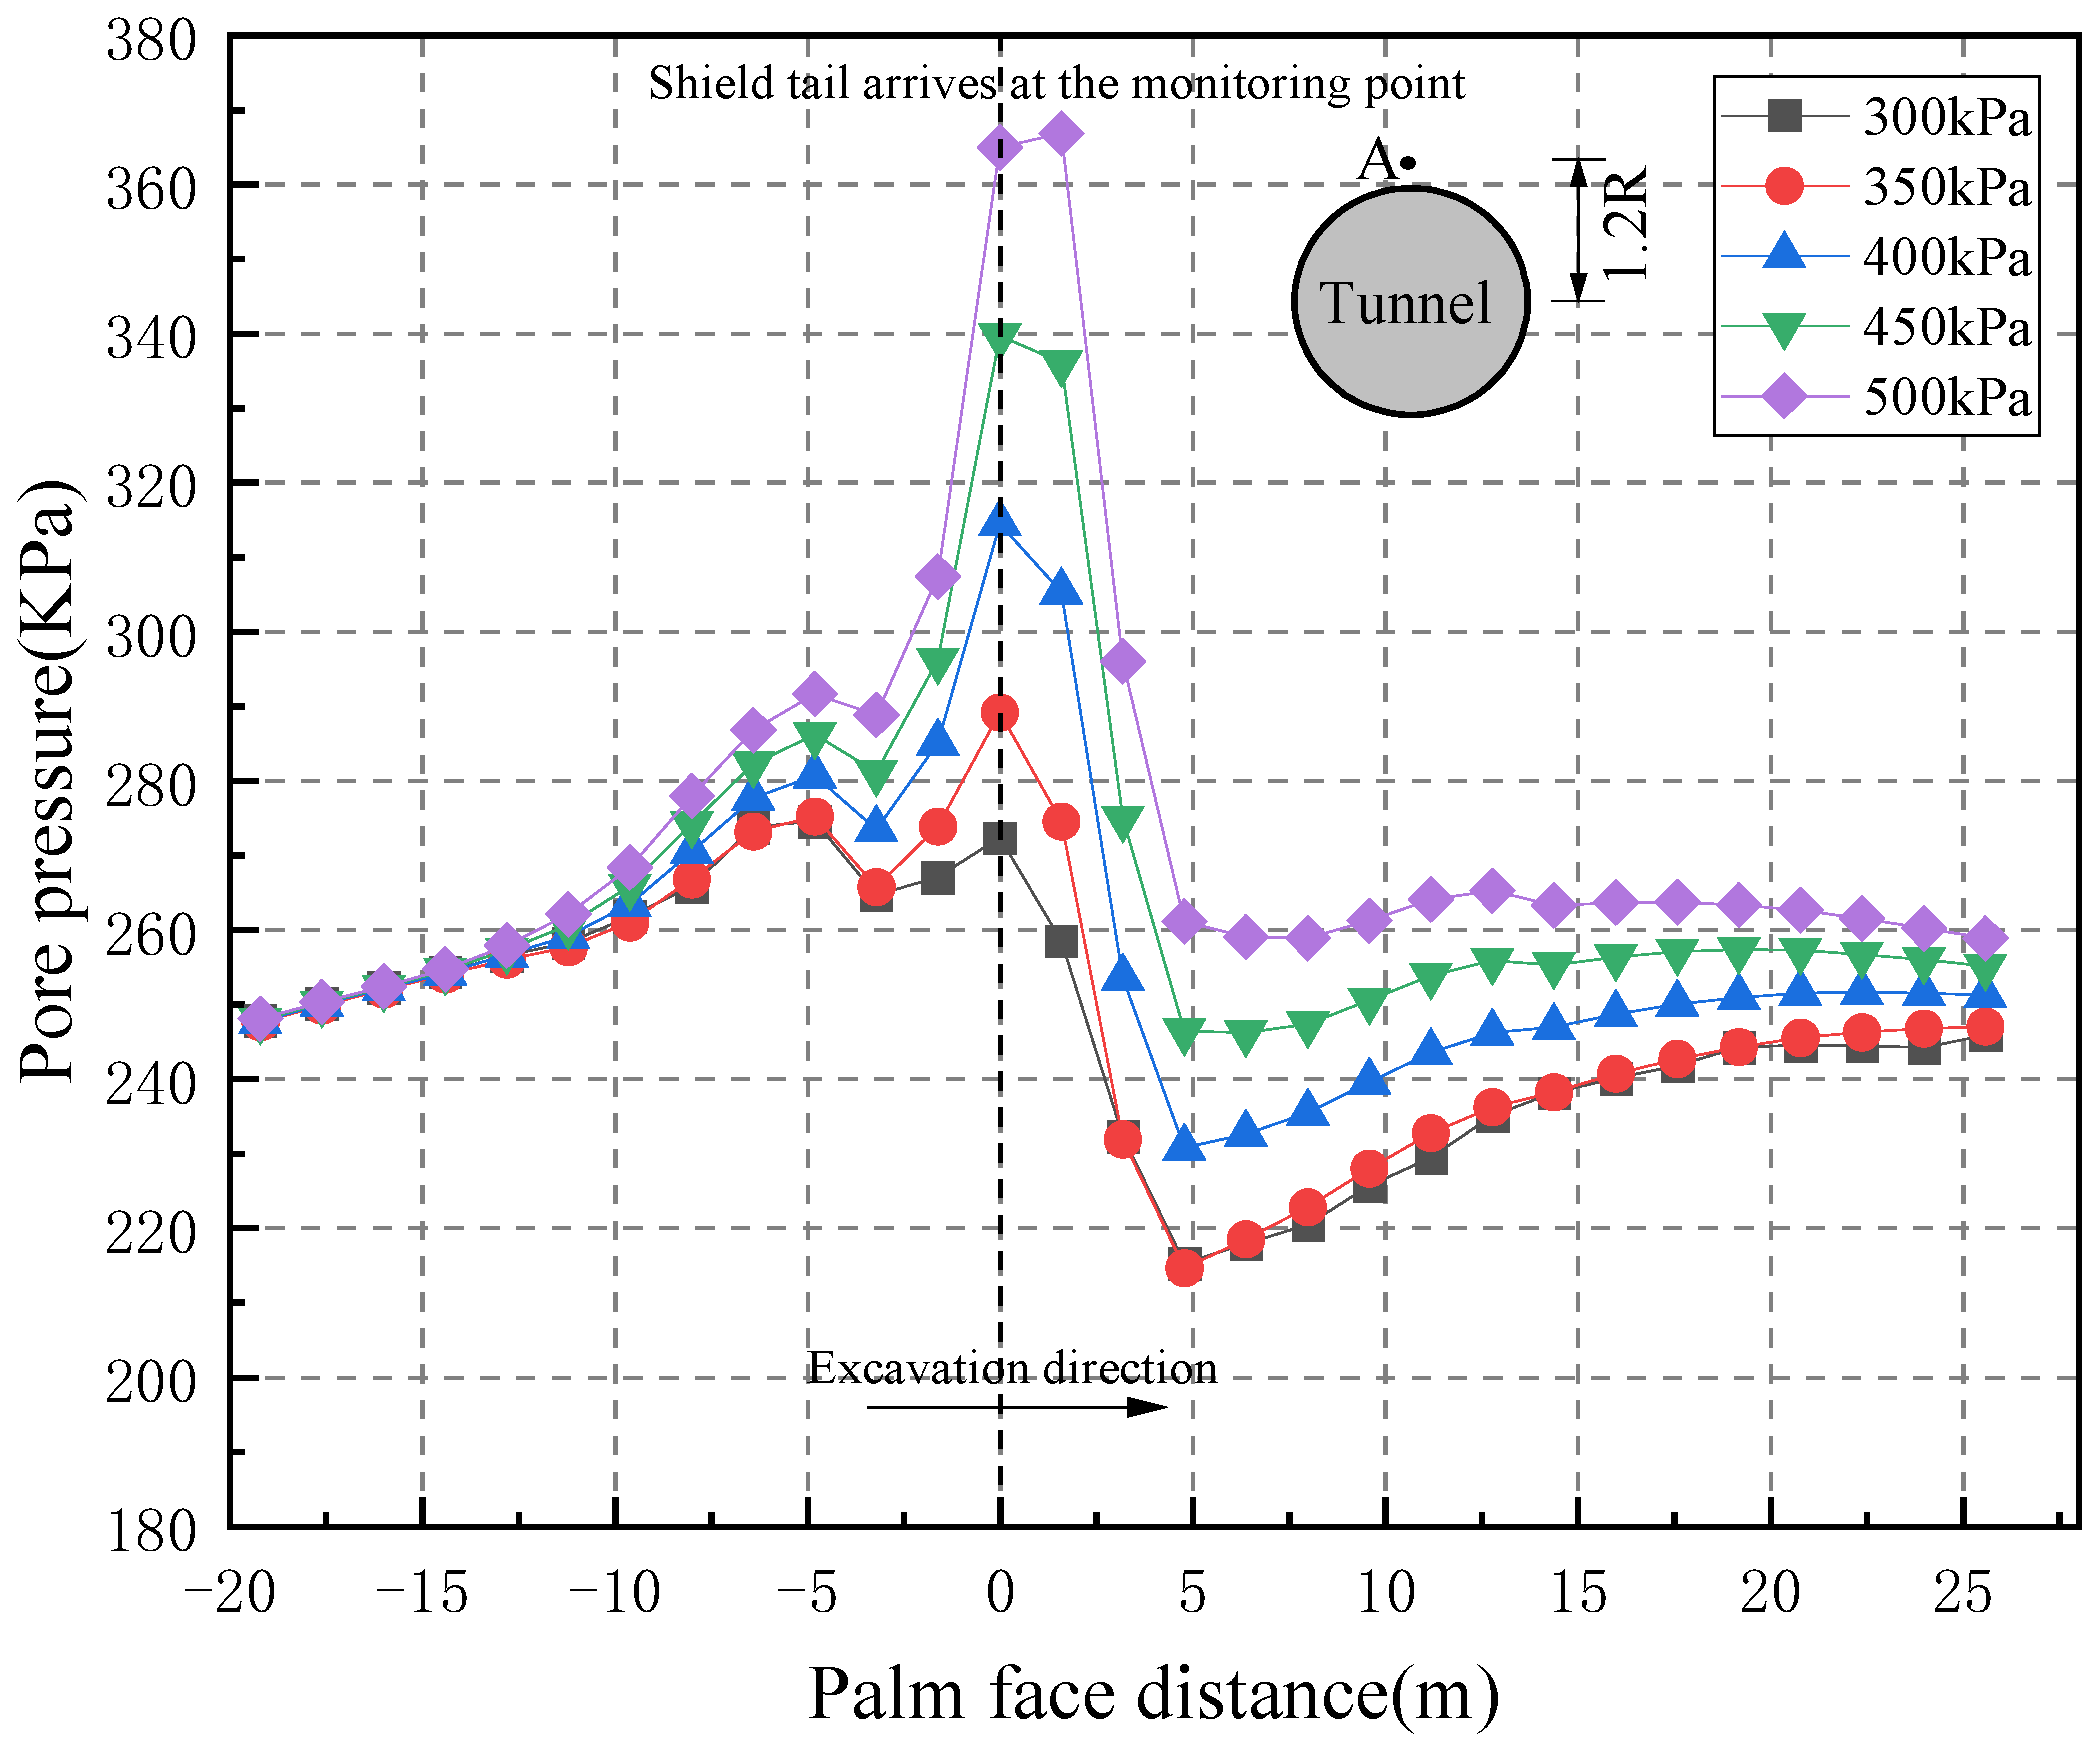
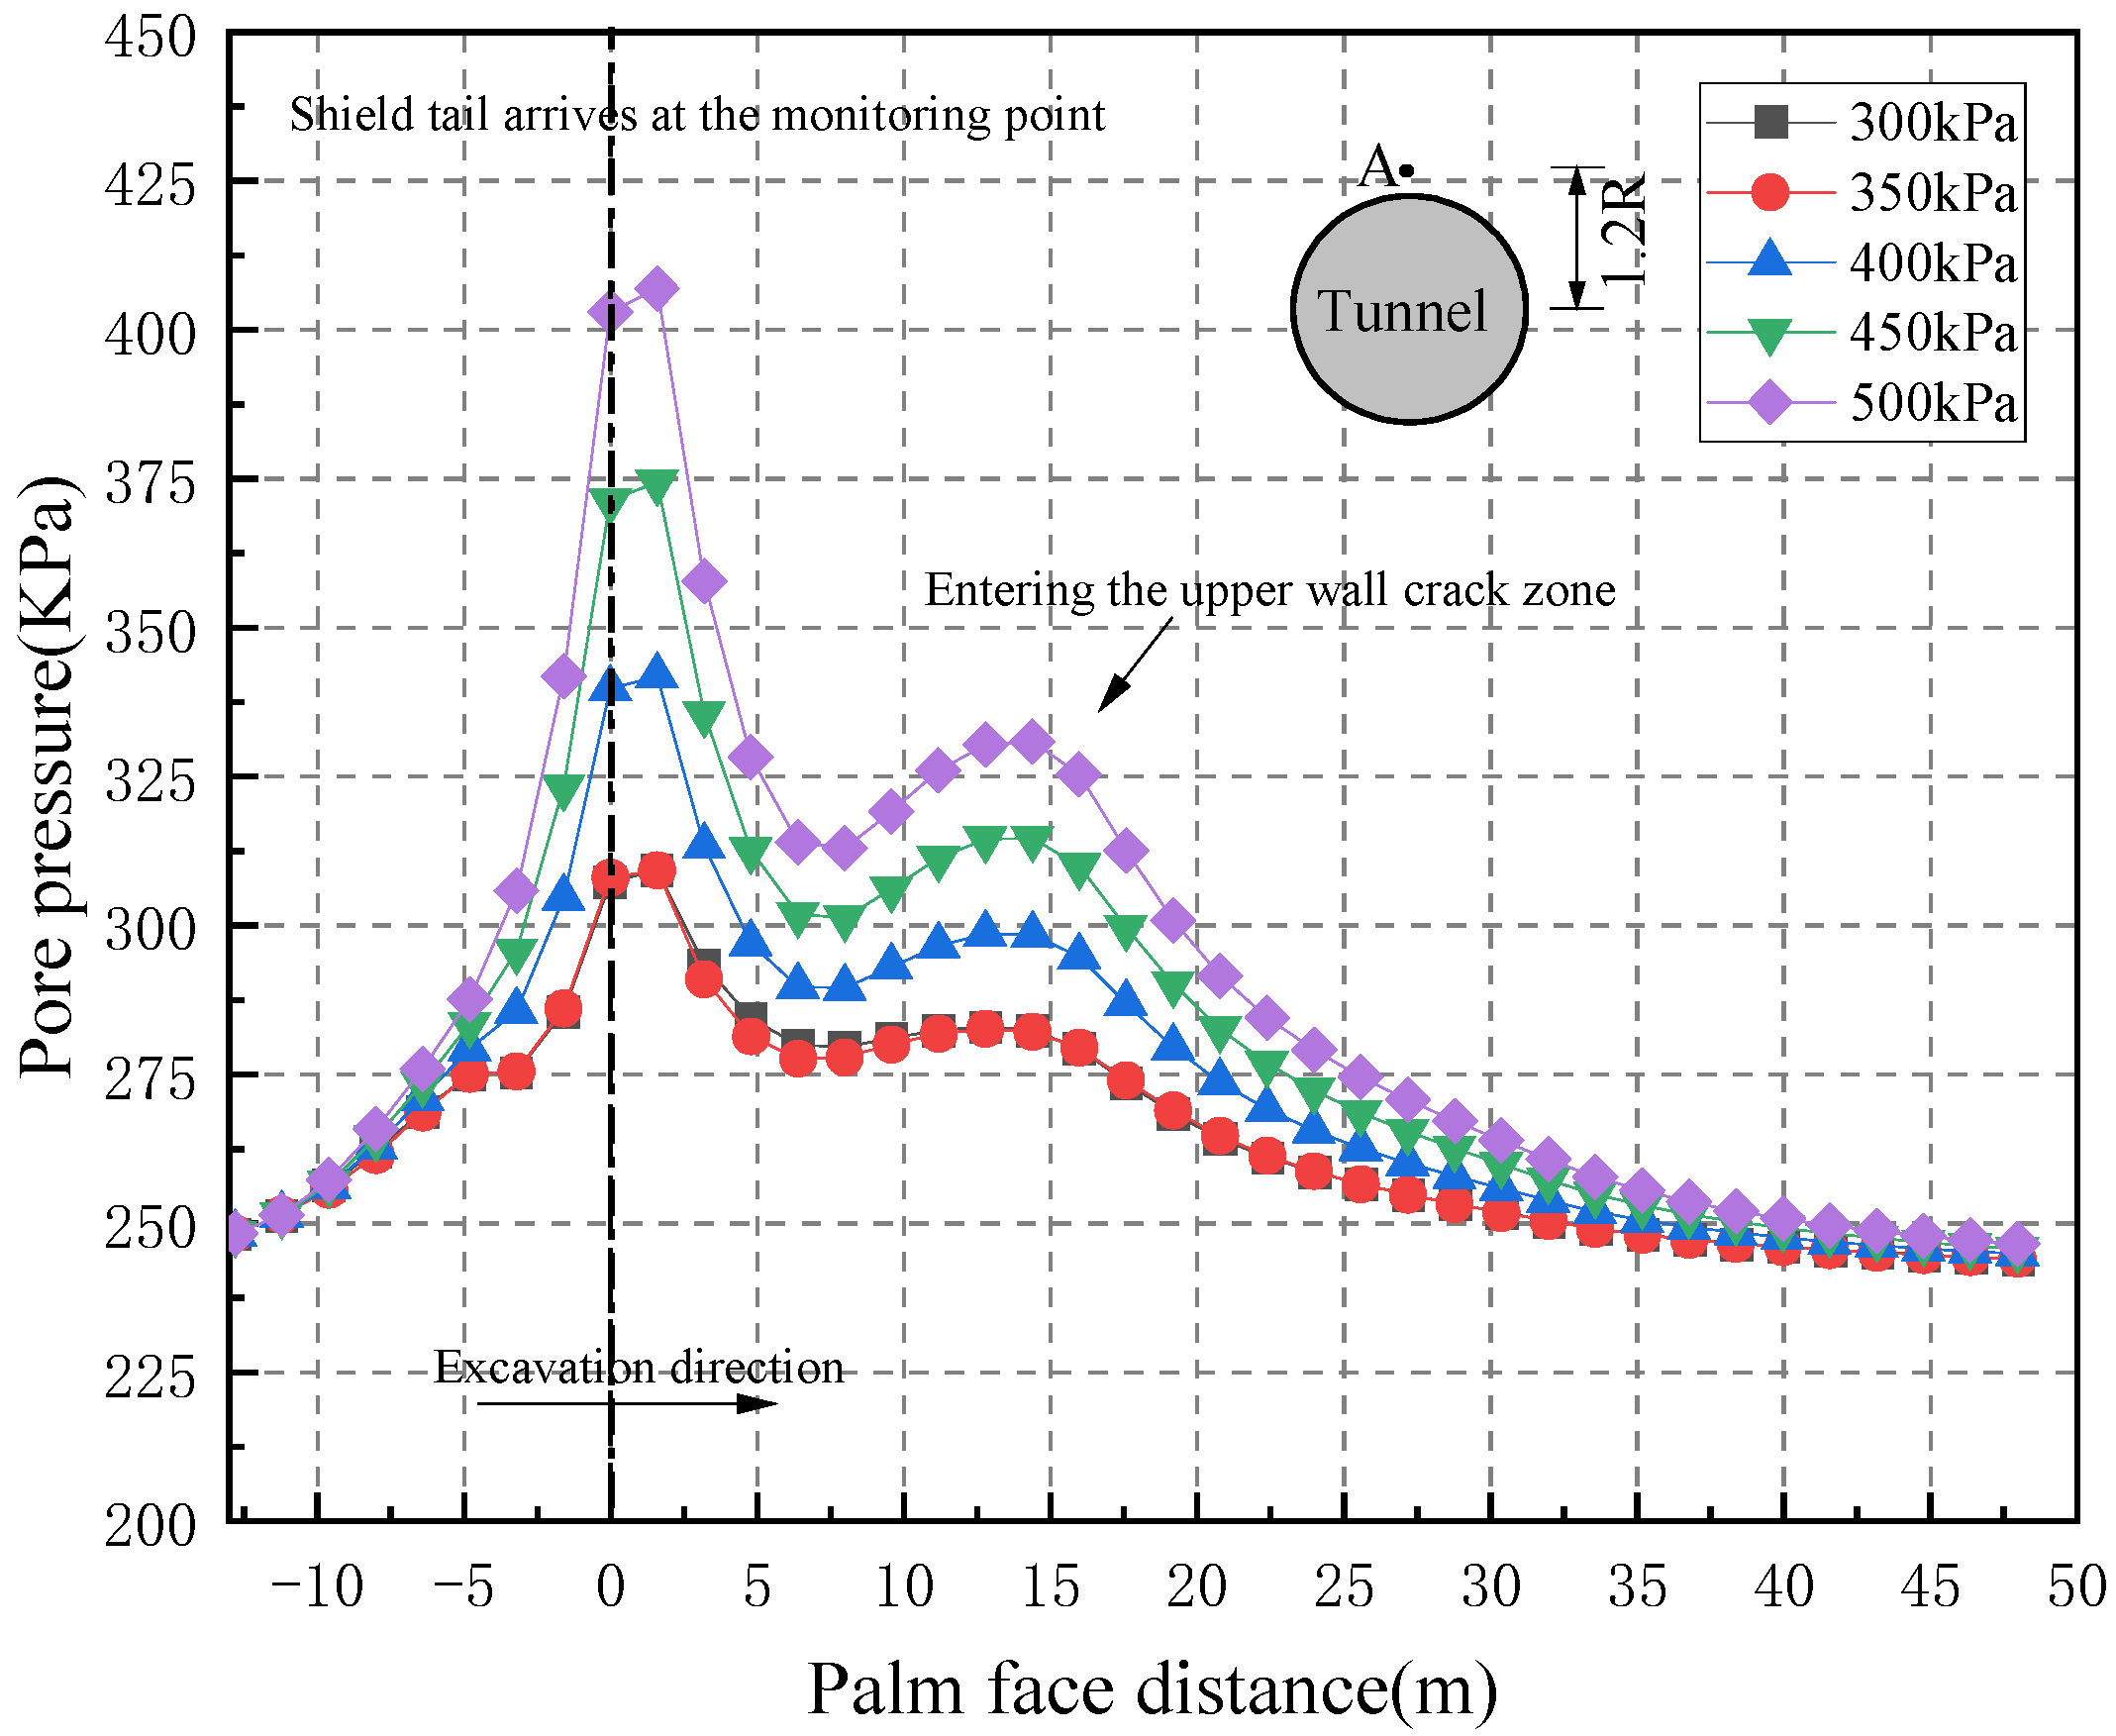
3.2. Analysis of Changes in Pore Water Pressure

The cloud map of changes in pore pressure during excavation is shown in Figure 15. And the hole pressure cloud diagram after excavation completion is shown in Figure 16.
Figure 17 and Figure 18 show the variation curves of pore pressure at the monitoring points around the tunnel as the shield machine advances. As the shield machine approaches the monitoring point, there is a significant change in the monitoring point. Due to the mud support pressure on the face of the tunnel, the pore pressure value increases before the shield machine reaches the monitoring point. When the shield tail is synchronously grouted, the pore pressure at the monitoring point reaches its maximum, and the characteristics of pore pressure change vary significantly in different strata. The crack zone area has a large permeability coefficient, and the seepage pressure effect of grouting is more direct when the shield tunneling machine passes through the crack zone. However, the permeability of ordinary surrounding rock and rock and soil in the fractured zone is relatively small, and the influence of seepage pressure is relatively weak. It can be seen that at the same horizontal position, the maximum pore pressure in the induced fracture zone is 523 kPa, while the peak values at the monitoring points of ordinary surrounding rock and fracture zone are 478 kPa and 431 kPa, respectively. It is worth noting that when the shield machine leaves or enters the crack zone structure, it can have a certain permeability effect on the pore pressure of ordinary surrounding rock.

4. Analysis of Synchronous Grouting Parameters

According to existing research, the main influencing factors of synchronous grouting construction in shield tunneling include synchronous grouting pressure, grouting volume, etc. The focus is on considering the impact of synchronous grouting influencing factors on the stress, deformation, and pore water pressure changes of rock and soil in the fractured zone during the construction process.
In practical engineering, the synchronous grouting pressure at the tail of the shield is continuously adjusted based on monitoring data, geological changes, and control indicators. In the slurry shield tunneling project that crosses the Shiziyang Water Transmission Tunnel, the mud pressure at the top of the excavation surface is between 3.5 Bar and 4.5 Bar, and the selected mud pressure at the excavation surface is 400 kPa. The model is analyzed based on synchronous grouting pressures of 350 kPa, 400 kPa, 450 kPa, and 500 kPa, while the other parameters remain unchanged; the grouting filling coefficients were set at 100%, 110%, 120% m, 130%, and 140% for analysis, while the other parameters remained unchanged; selected water cover depths of 25 m, 30 m, 35 m, and 40 m for analysis.

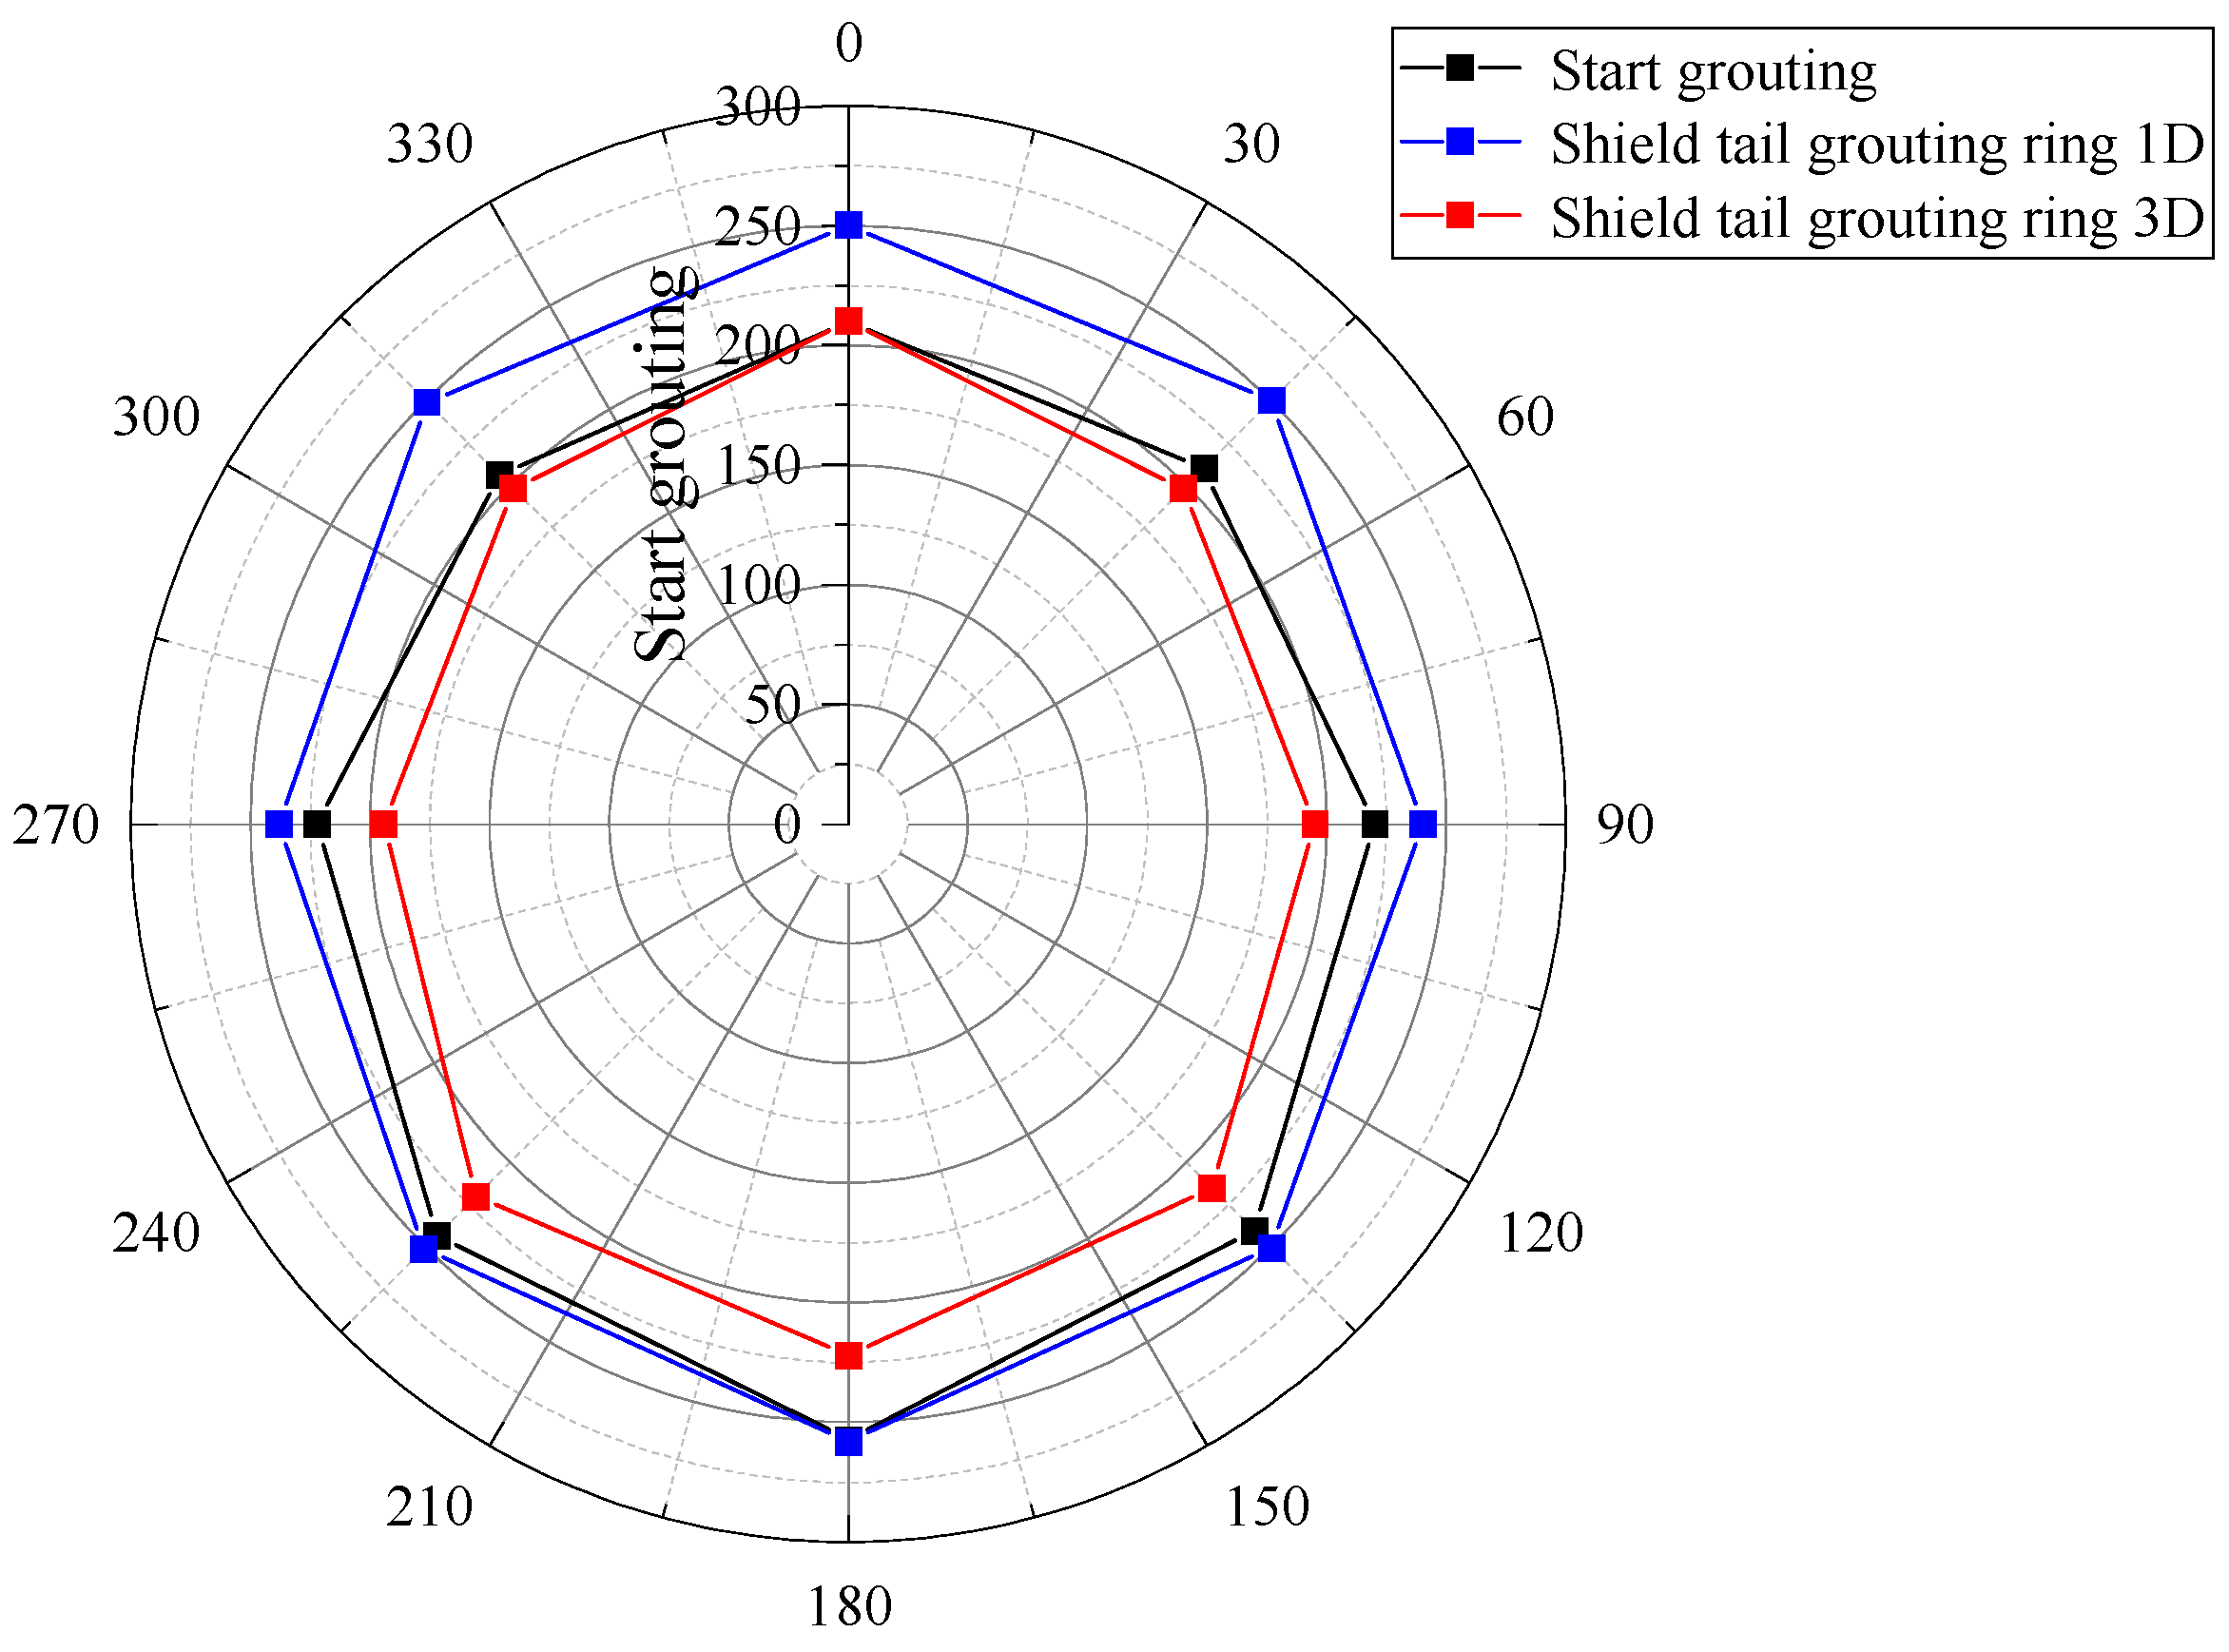
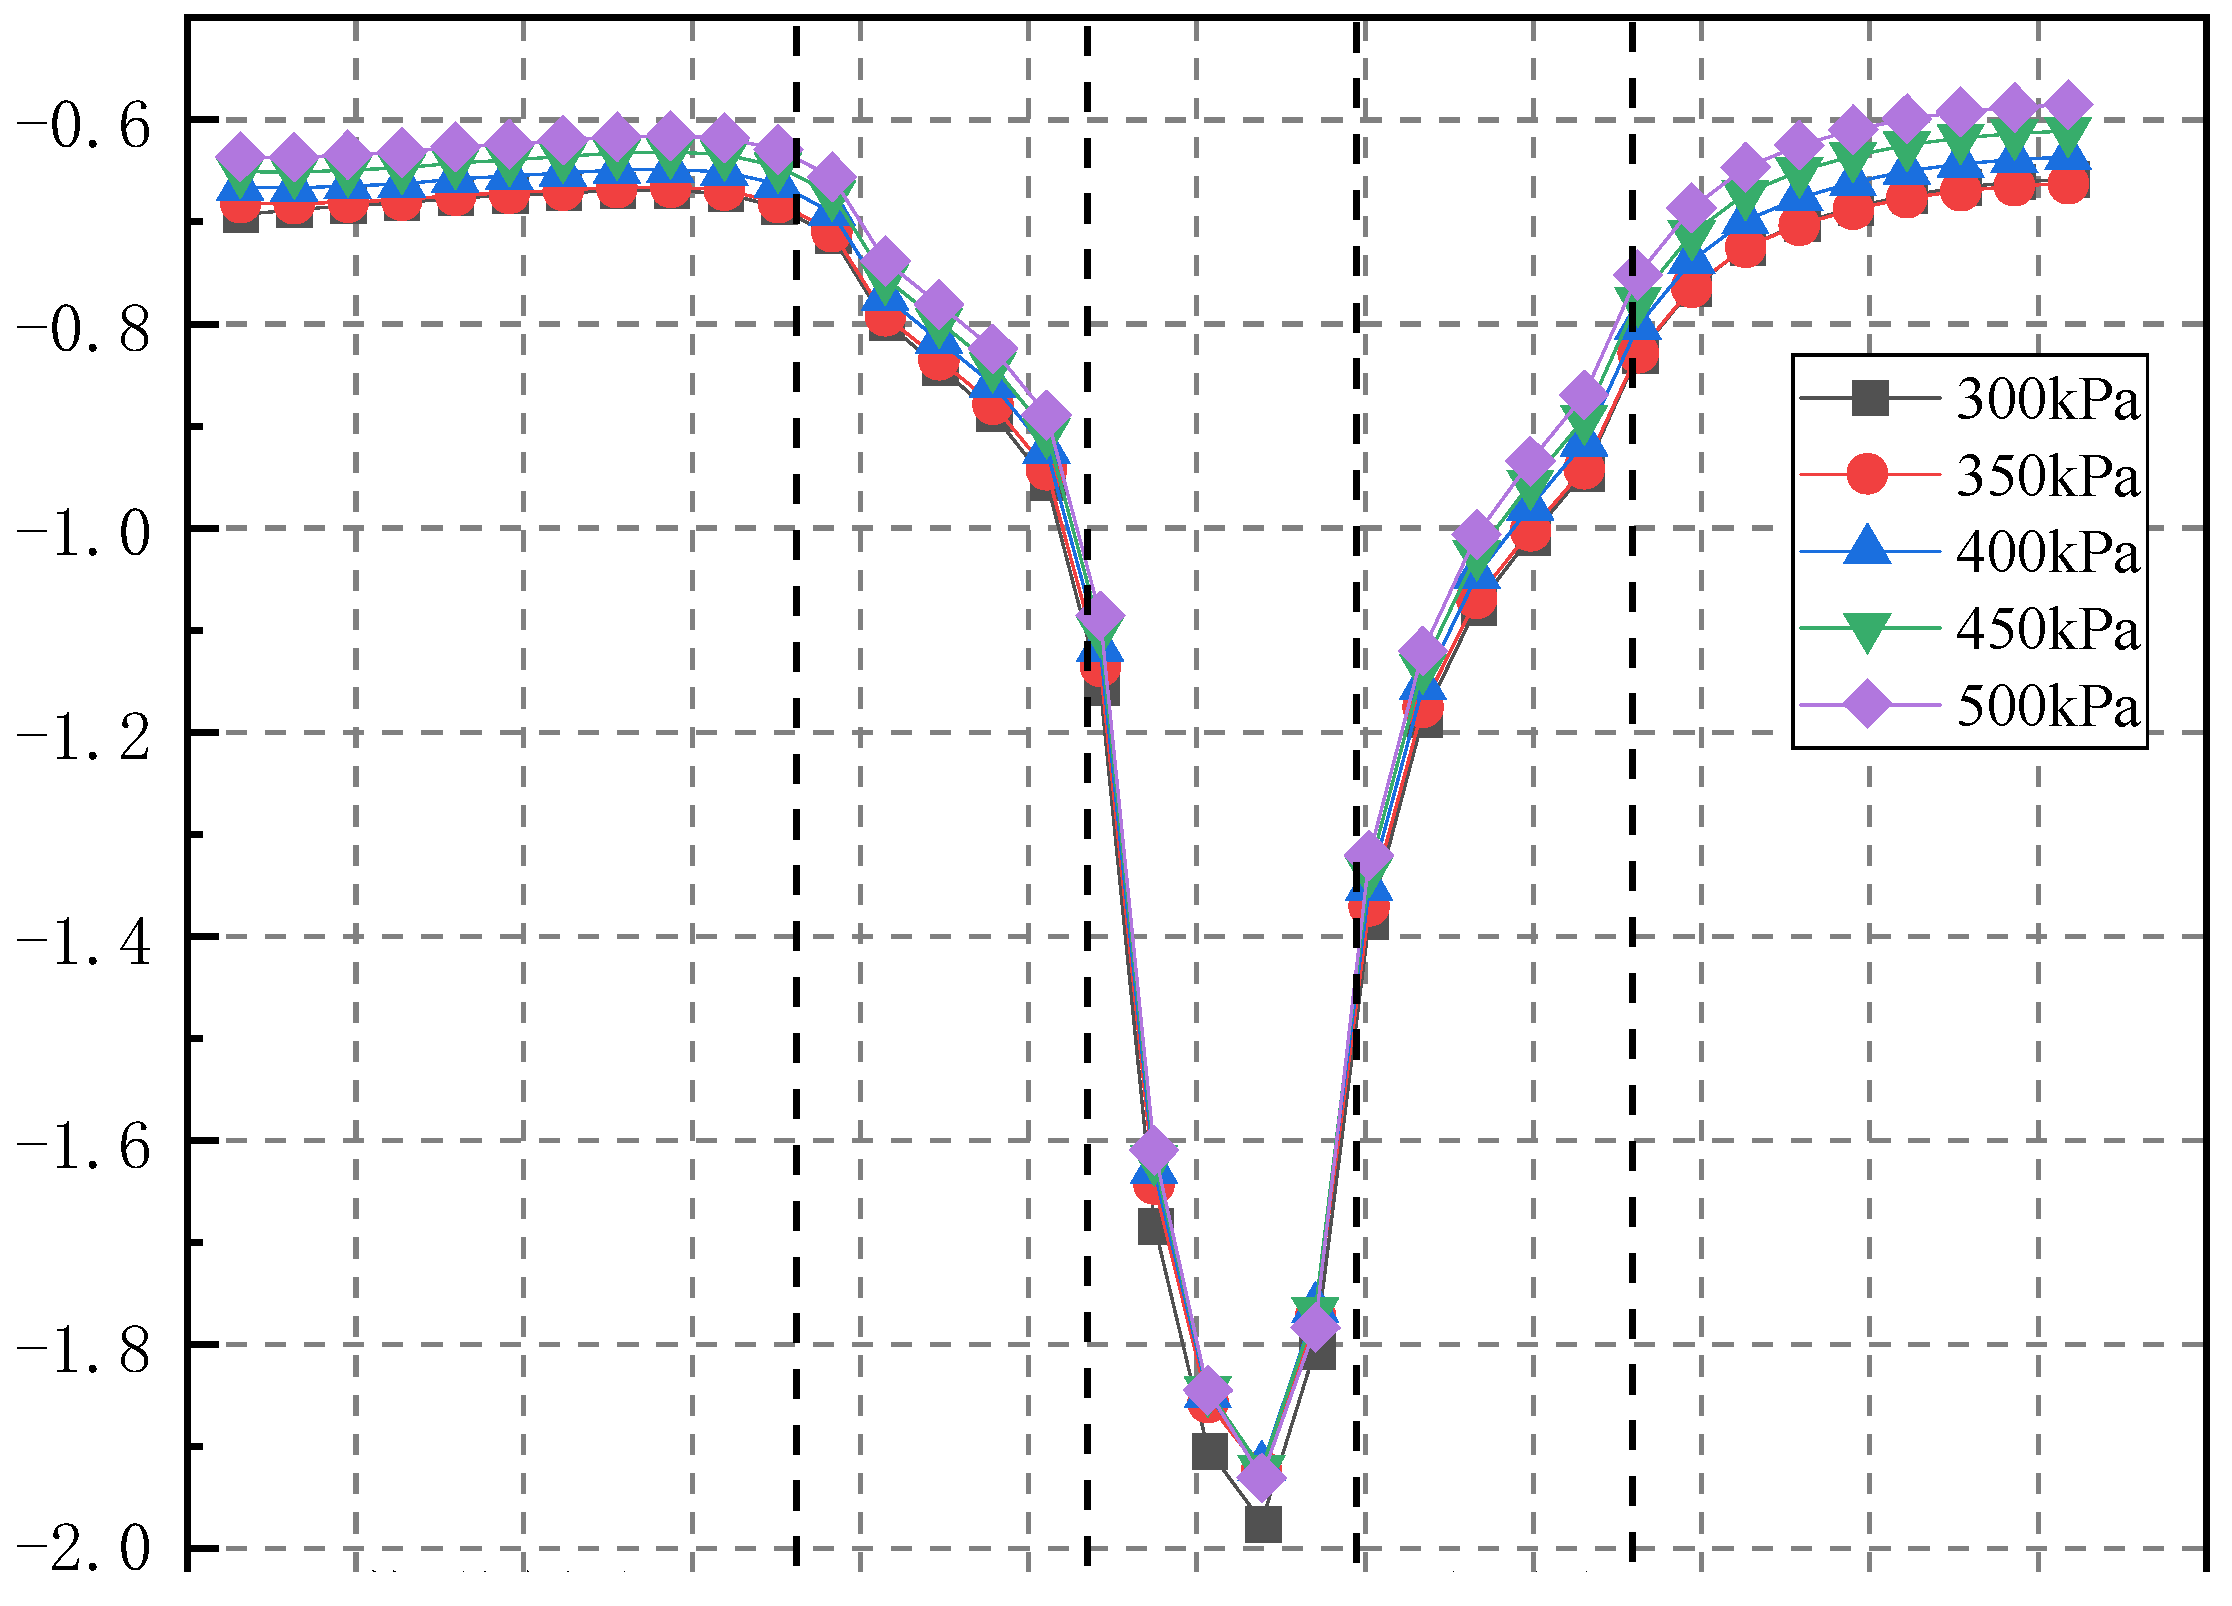
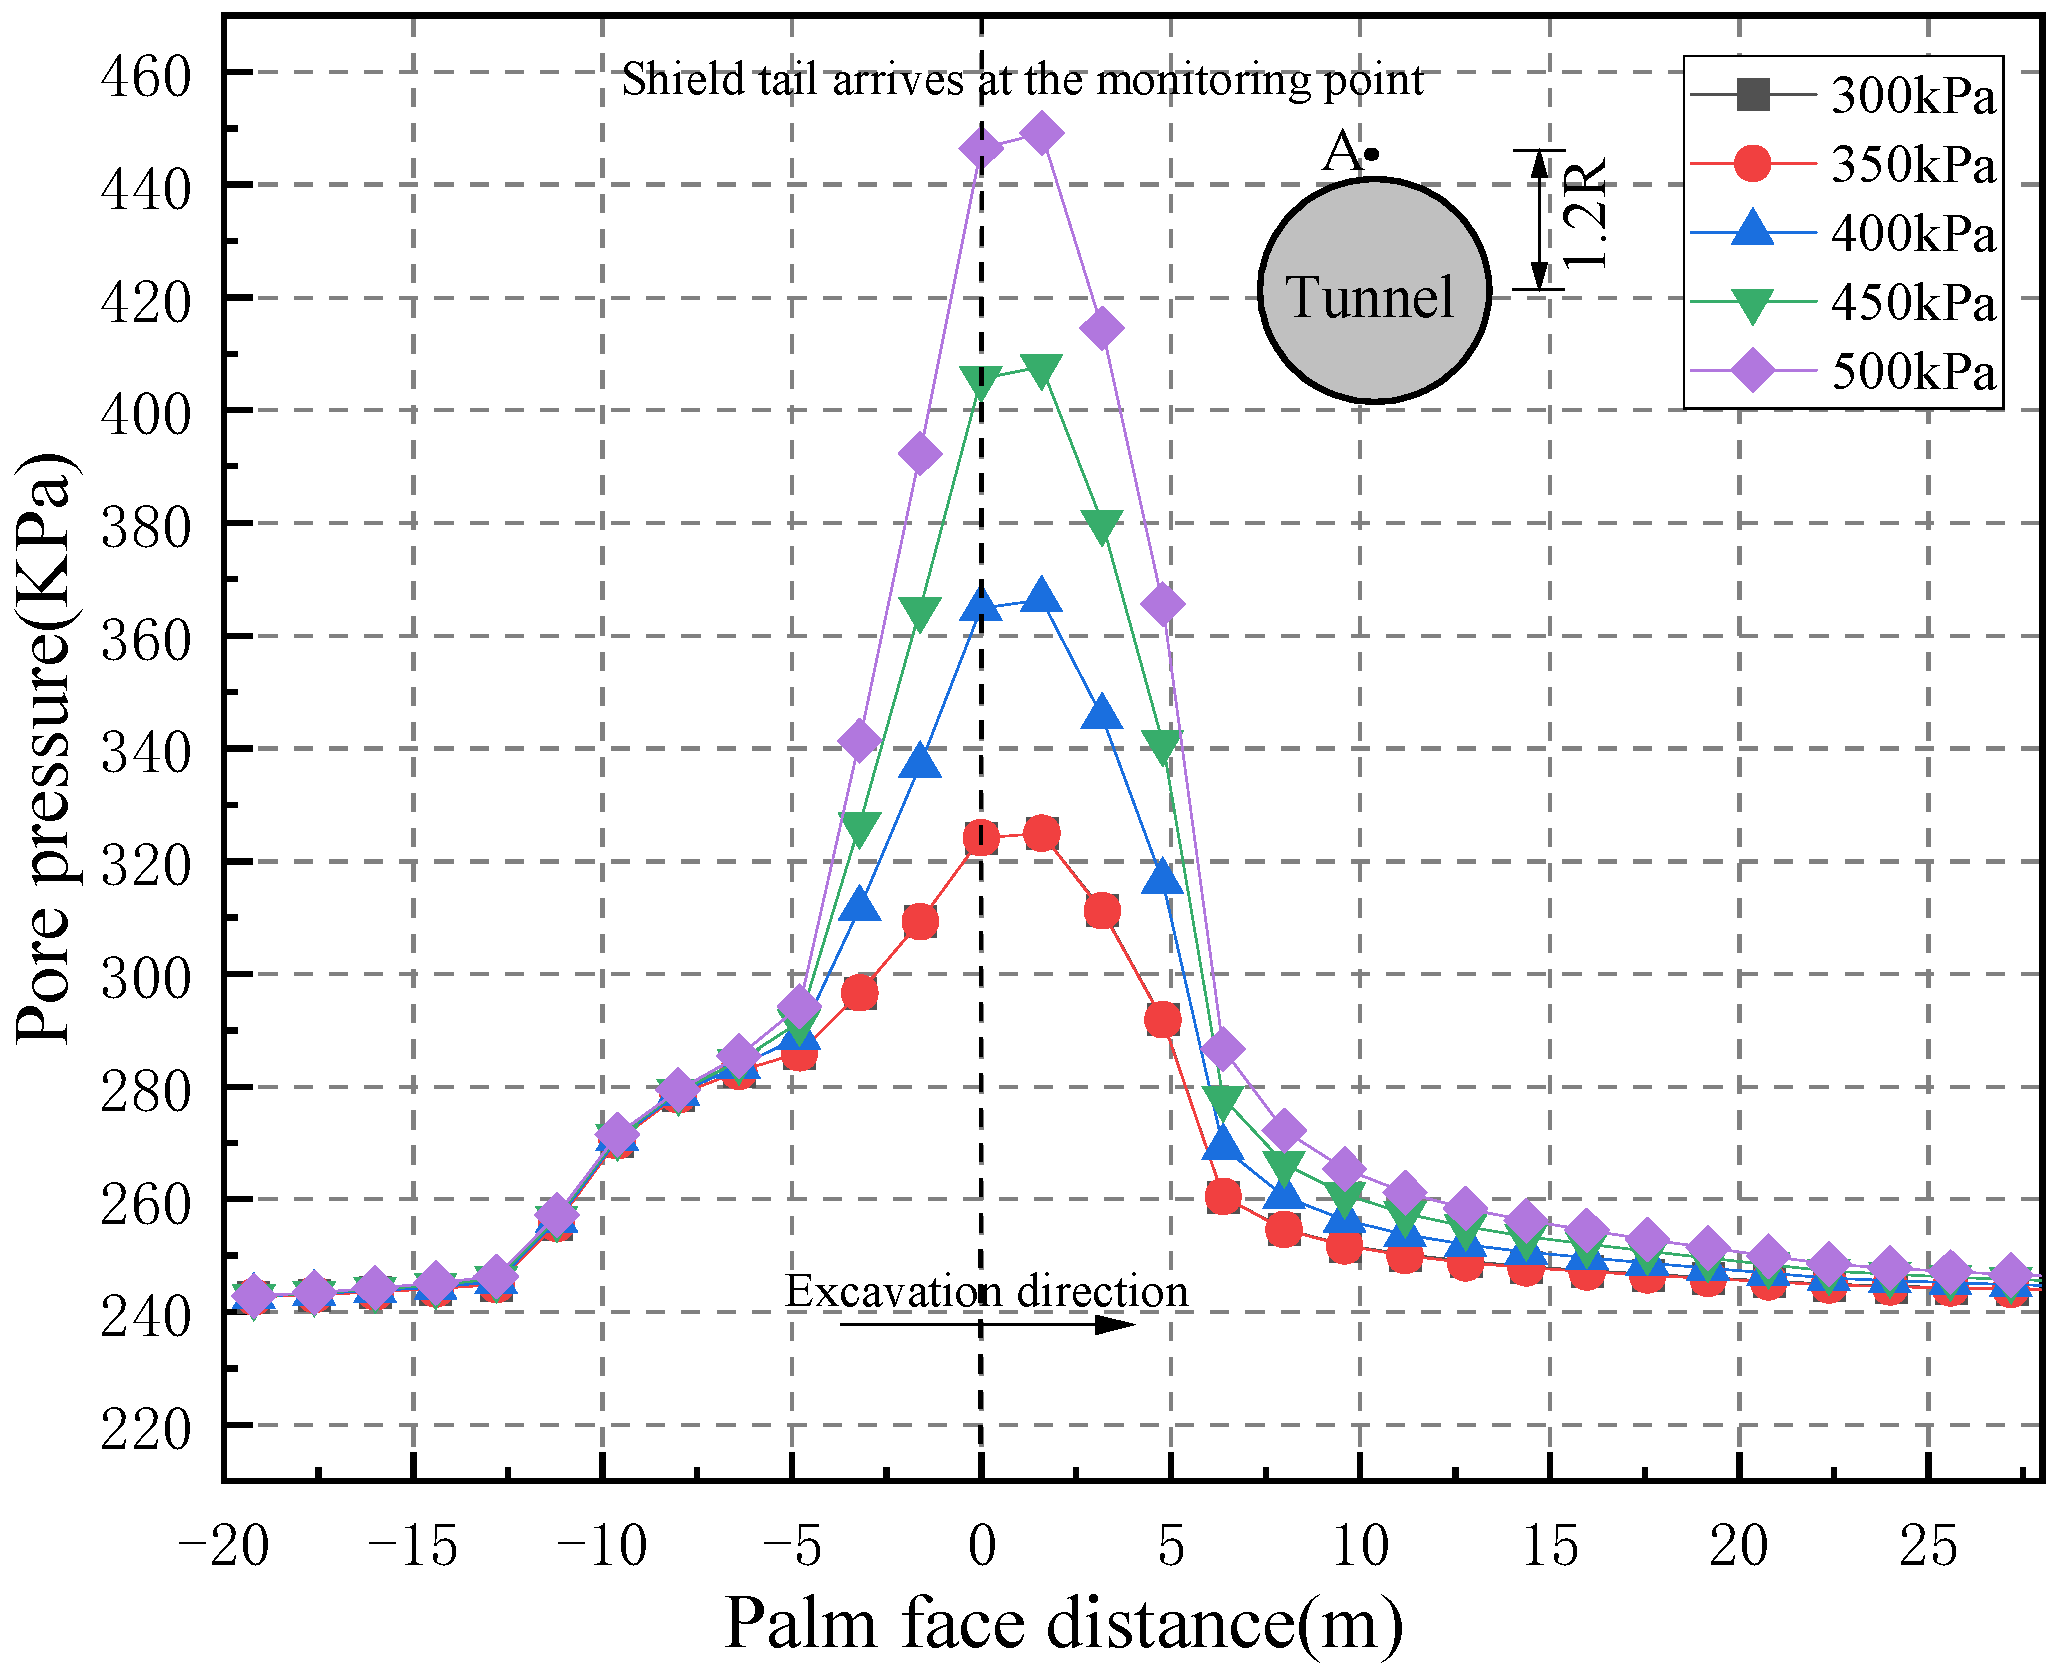
4.1. Grouting Pressure

During the shield tunneling process, the grouting pressure at the shield tail acts on the surface of the rock and soil, causing settlement disturbance to the fault fracture zone. As the shield tunneling advances, the grouting pressure gradually dissipates and the grouting layer hardens, causing settlement to occur again in the rock and soil. Therefore, different grouting pressures are selected for parameter analysis in the model.
As shown in Figure 19, the vertical settlement curve of the rock mass at 0.2 R along the top of the tunnel axis under different grouting pressures after shield tunneling is shown. Overall, there is a significant difference in soil and rock settlement between the original rock and the fault fracture zone, with the maximum settlement in the fracture zone area being three times that of the original rock. At the same time, there are certain differences in the settlement deformation between the upper and lower wall fracture zones within the fault fracture zone structure, and the settlement of the rock and soil in the lower wall fracture zone is relatively large.
The maximum settlement variation of monitoring points under different grouting pressures is shown in Figure 20. When the grouting pressure increases from 300 kPa to 400 kPa, the maximum settlement decreases from 1.976 mm to 1.923 mm; when the grouting pressure increases from 400 kPa to 500 kPa, the ability to control settlement deformation decreases to a certain extent. This is due to insufficient grouting pressure and the release of stress in the rock and soil, resulting in a larger settlement amount; however, excessive grouting pressure causes plastic deformation of the rock and soil mass. When the grouting pressure disappears, the slurry does not form strength, and further deformation occurs with the release of stress in the rock and soil mass. Therefore, in practical engineering, it is necessary to ensure that the grouting pressure is controlled within a reasonable range. If the grouting pressure is too small or too large, it will affect the settlement and deformation of the formation.
As shown in Figure 21, Figure 22 and Figure 23, the variation curves of pore water pressure at three monitoring points in ordinary surrounding rock, upper wall induced crack zone, and fracture zone under five different grouting pressure conditions during shield tunneling are shown. The results show that synchronous grouting pressure has a strong impact on the pore water pressure of surrounding rock and soil. When the grouting pressure is low (such as 300 kPa, 350 kPa), the change in pore water pressure is close, and as the grouting pressure increases (400 kPa~500 kPa), The pore pressure of the surrounding rock also increases correspondingly, and at this time, the pore pressure is proportional to the grouting pressure.

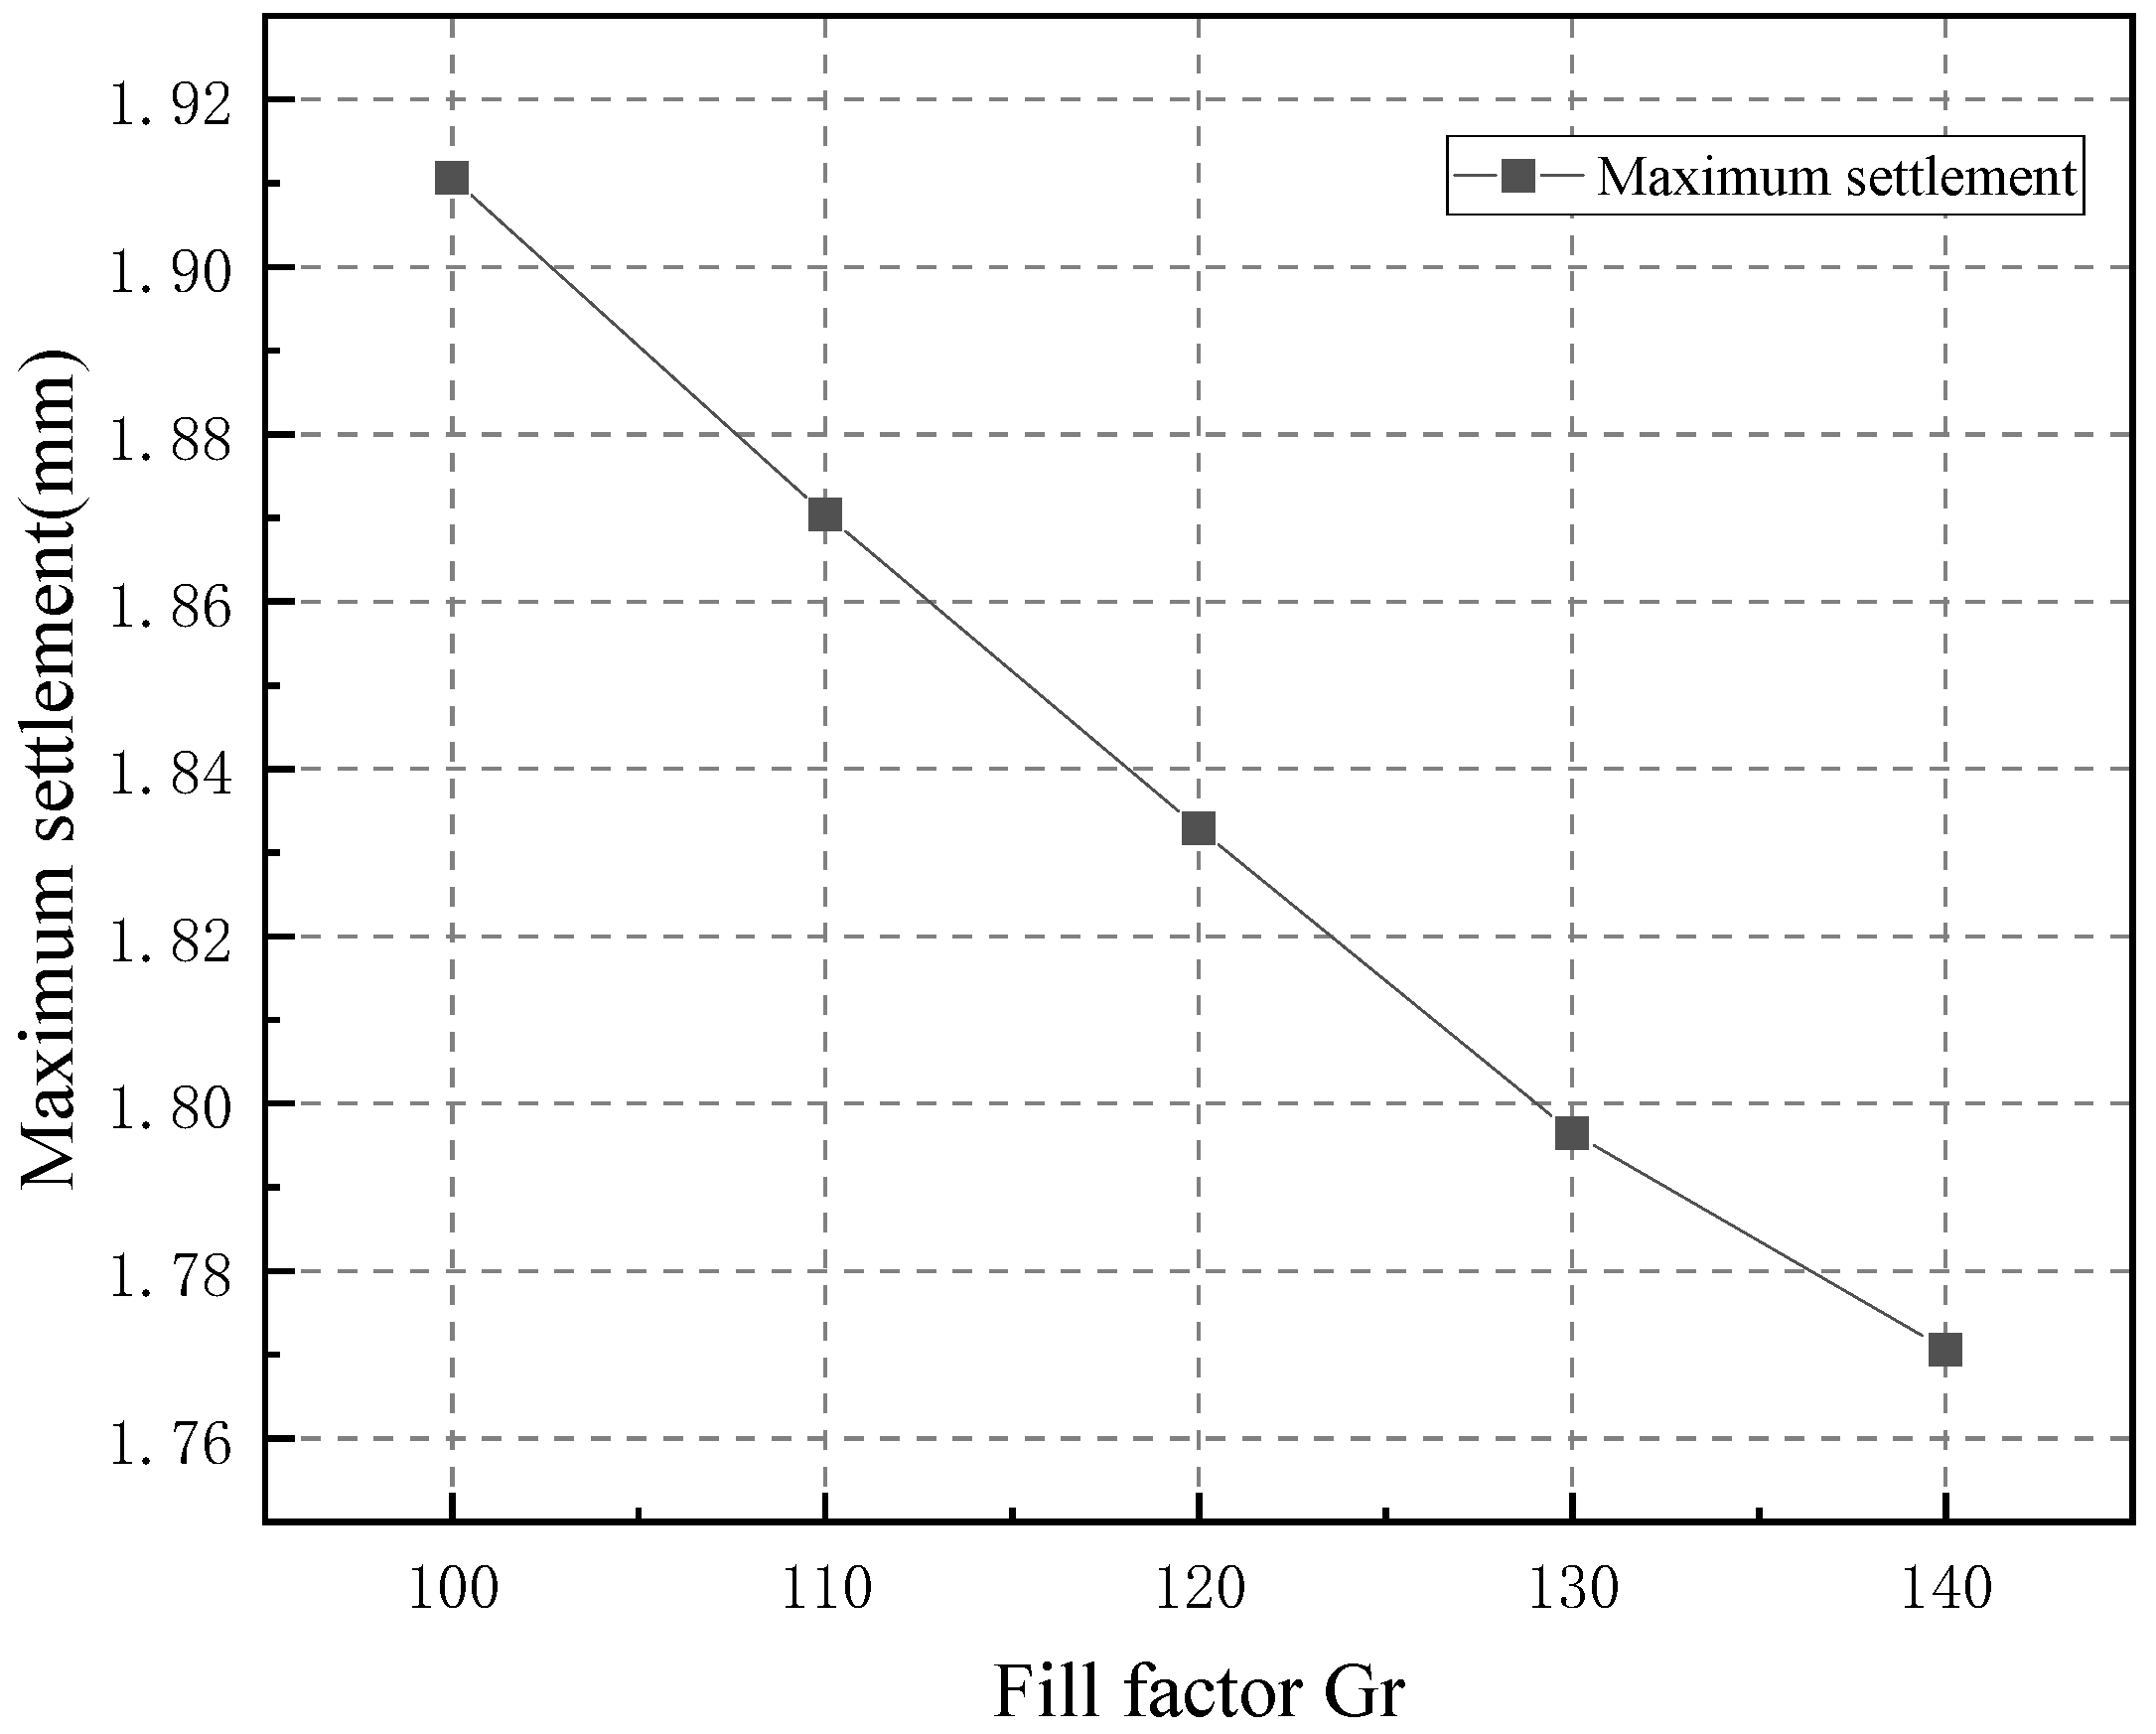
4.2. Grouting Volume

As the shield tunneling advances, grouting fills the gap at the tail of the shield. Considering the compaction and permeability laws of the slurry, the grouting filling coefficient Gr is used to represent the grouting amount. The grouting filling coefficient can evaluate the fullness of the grouting. By determining the ratio of the grouting amount to the volume of the gap at the tail of the shield, the grouting filling coefficient is reflected.
Conduct parameter analysis on different grouting filling coefficients to study the displacement and deformation laws of surrounding rock. Figure 24 shows the settlement variation curve along the tunnel under different grouting conditions. It can be seen that there is a certain difference in the impact of grouting on the ordinary surrounding rock section and the fault fracture zone. The settlement variation in the ordinary surrounding rock area is very small, while the settlement in the sliding fracture zone has a certain impact. The difference in grouting filling coefficient Gr can reduce the maximum settlement of the rock and soil to a certain extent, but the effect of Gr is still weak at 100–140%. Due to the higher strength of the rock and soil in the fractured zone compared to the grouting layer, the larger surrounding rock stress causes the grouting layer to deform, and the grouting layer is not enough to resist the settlement of the rock and soil, so the soil still undergoes vertical settlement deformation. And the maximum settlement variation under different grouting quantities is shown in Figure 25.

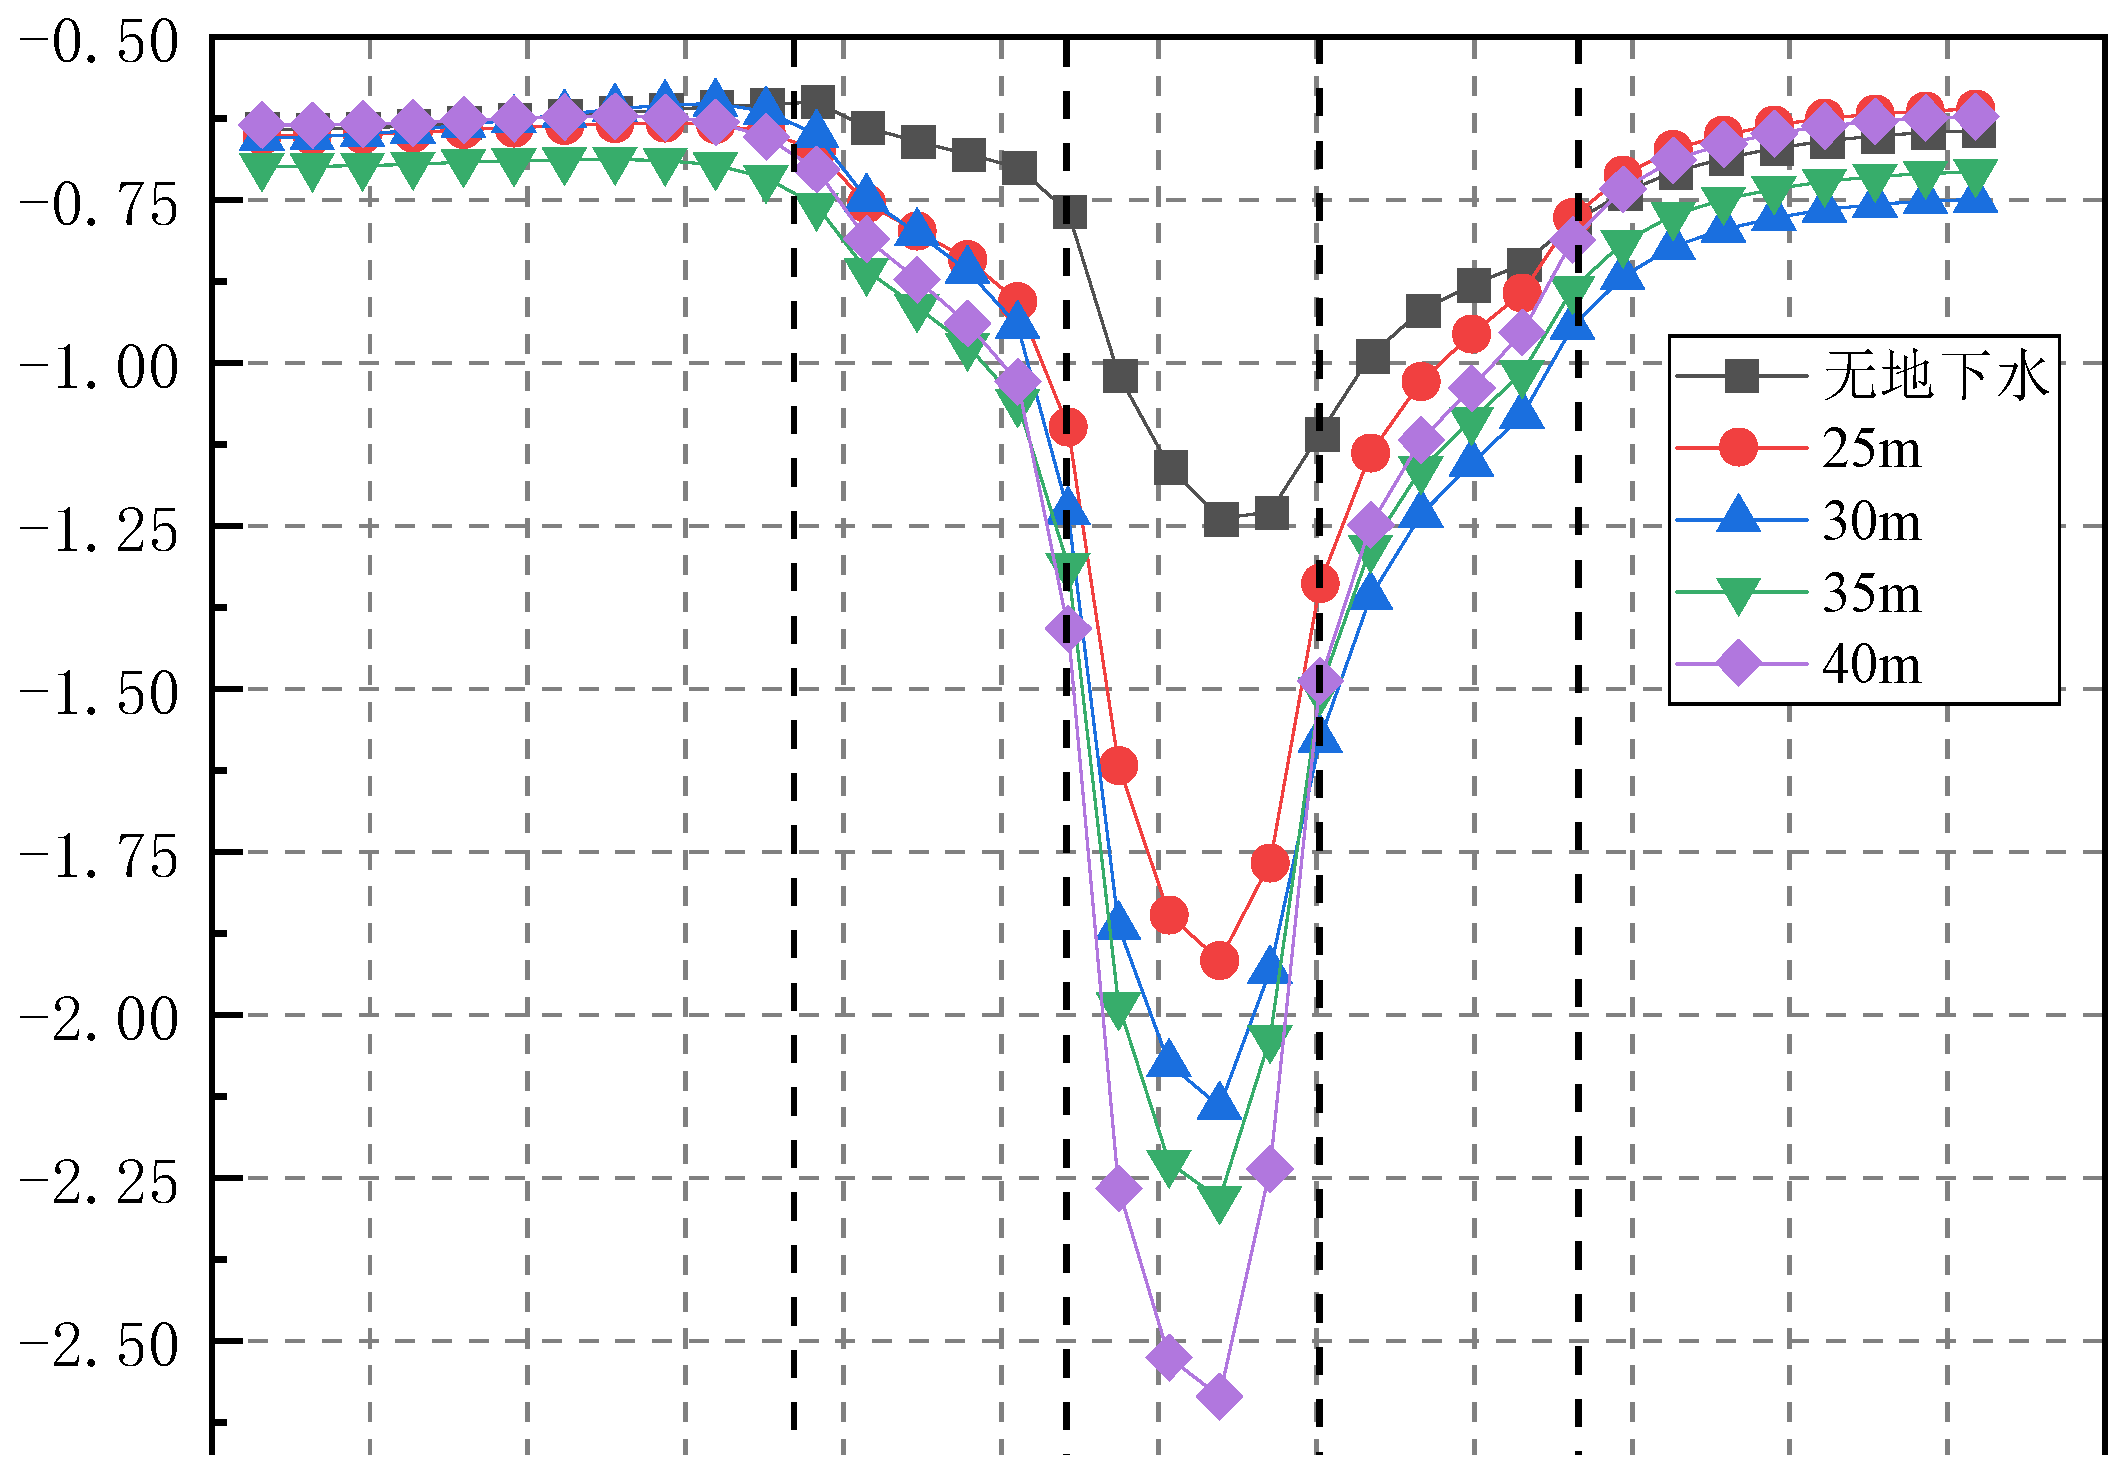
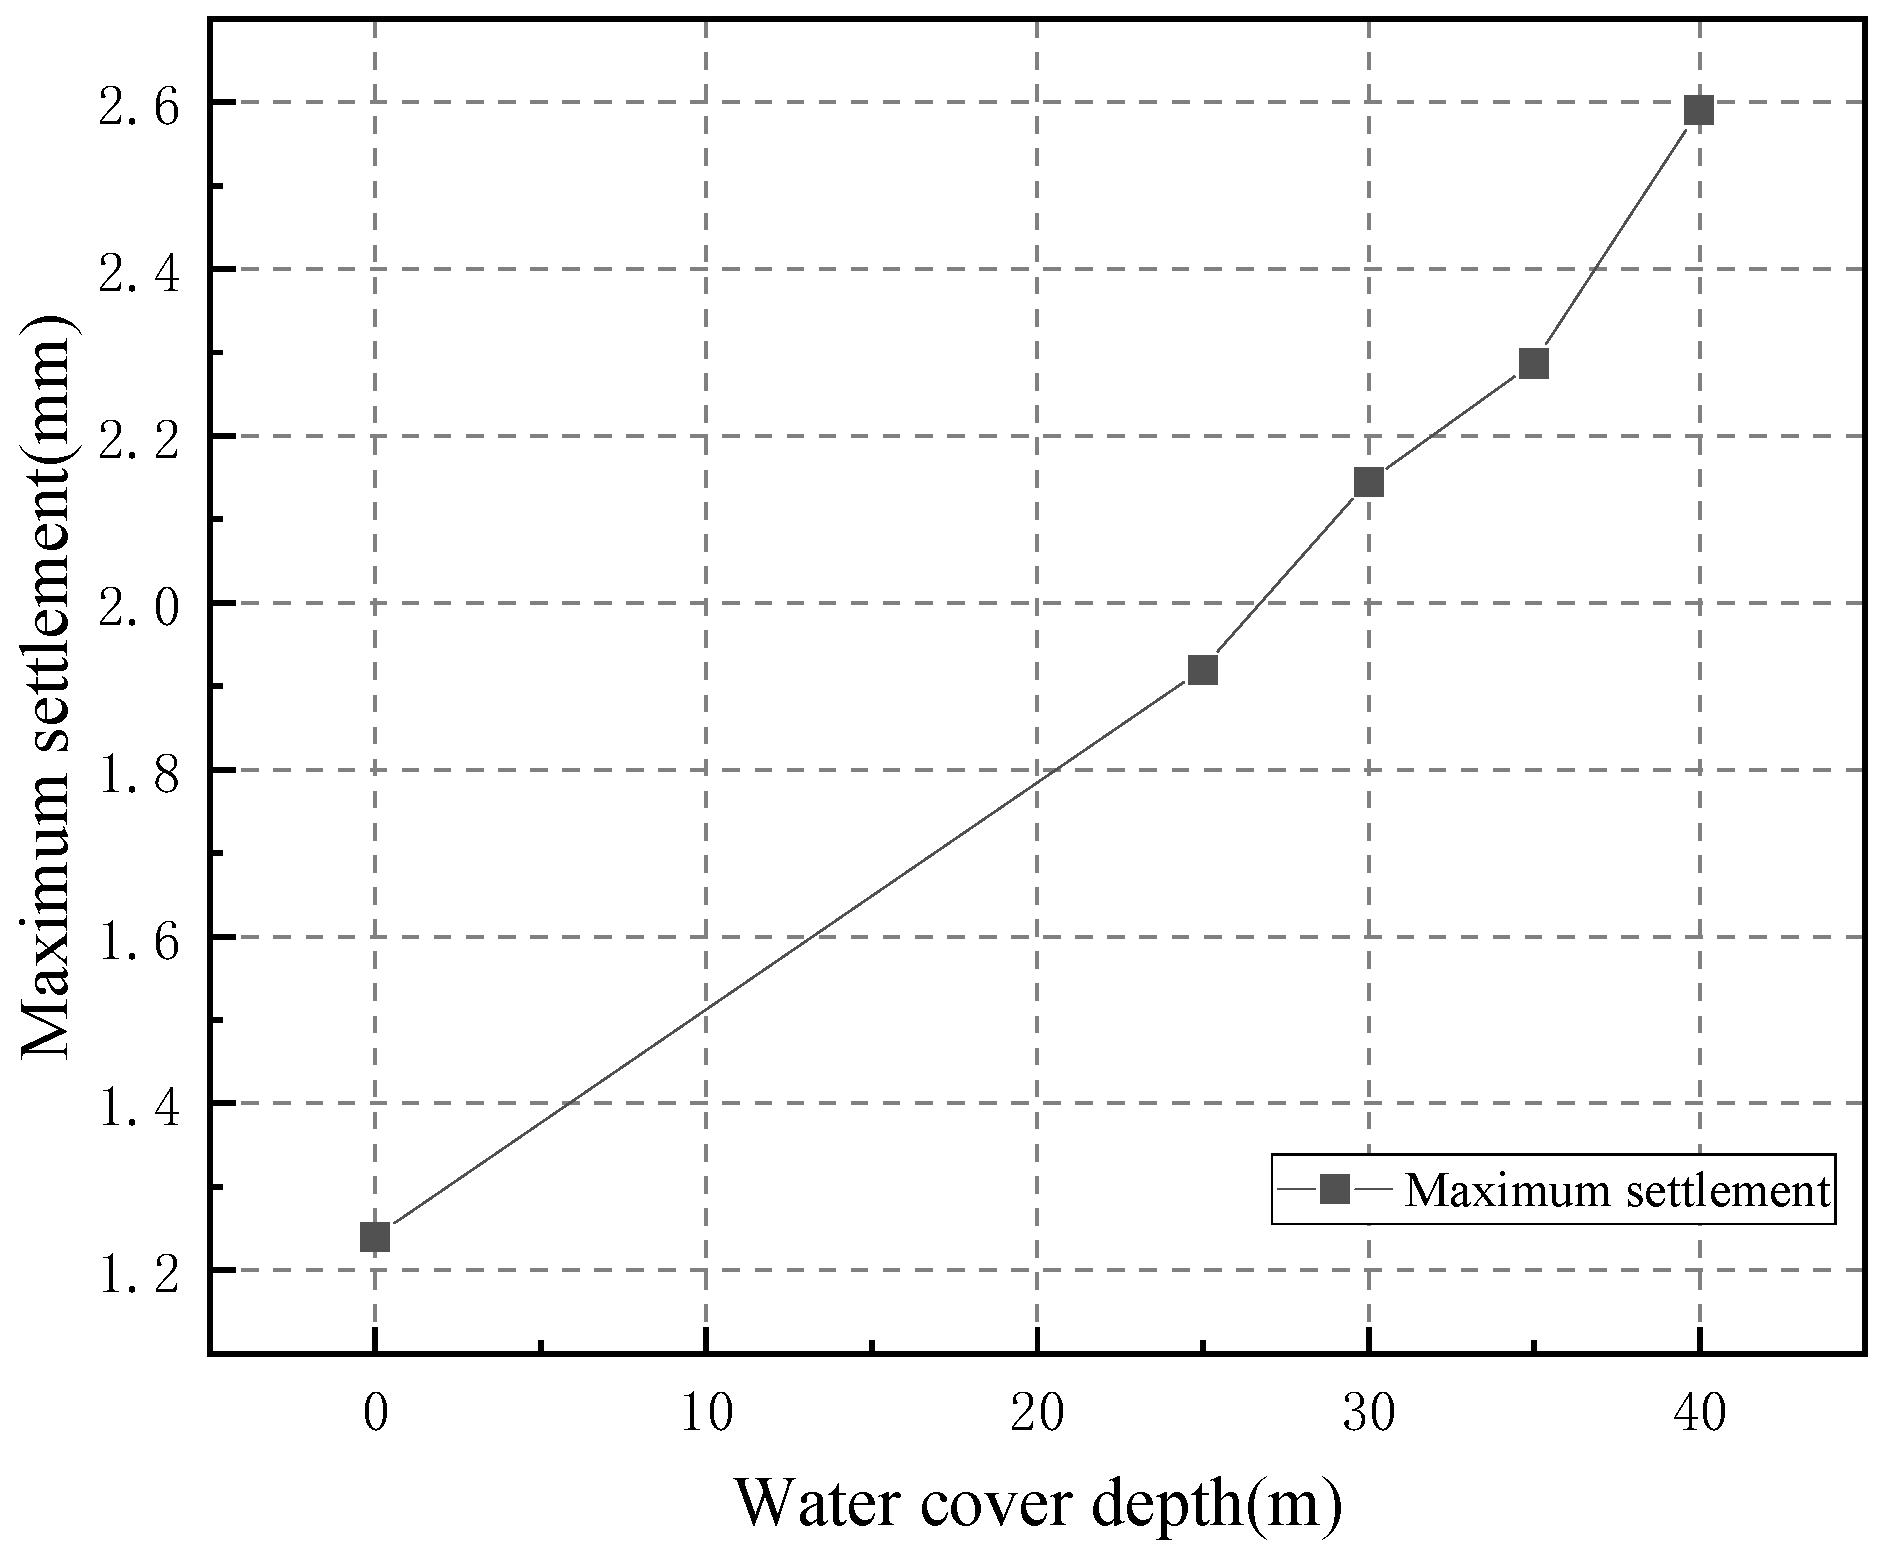
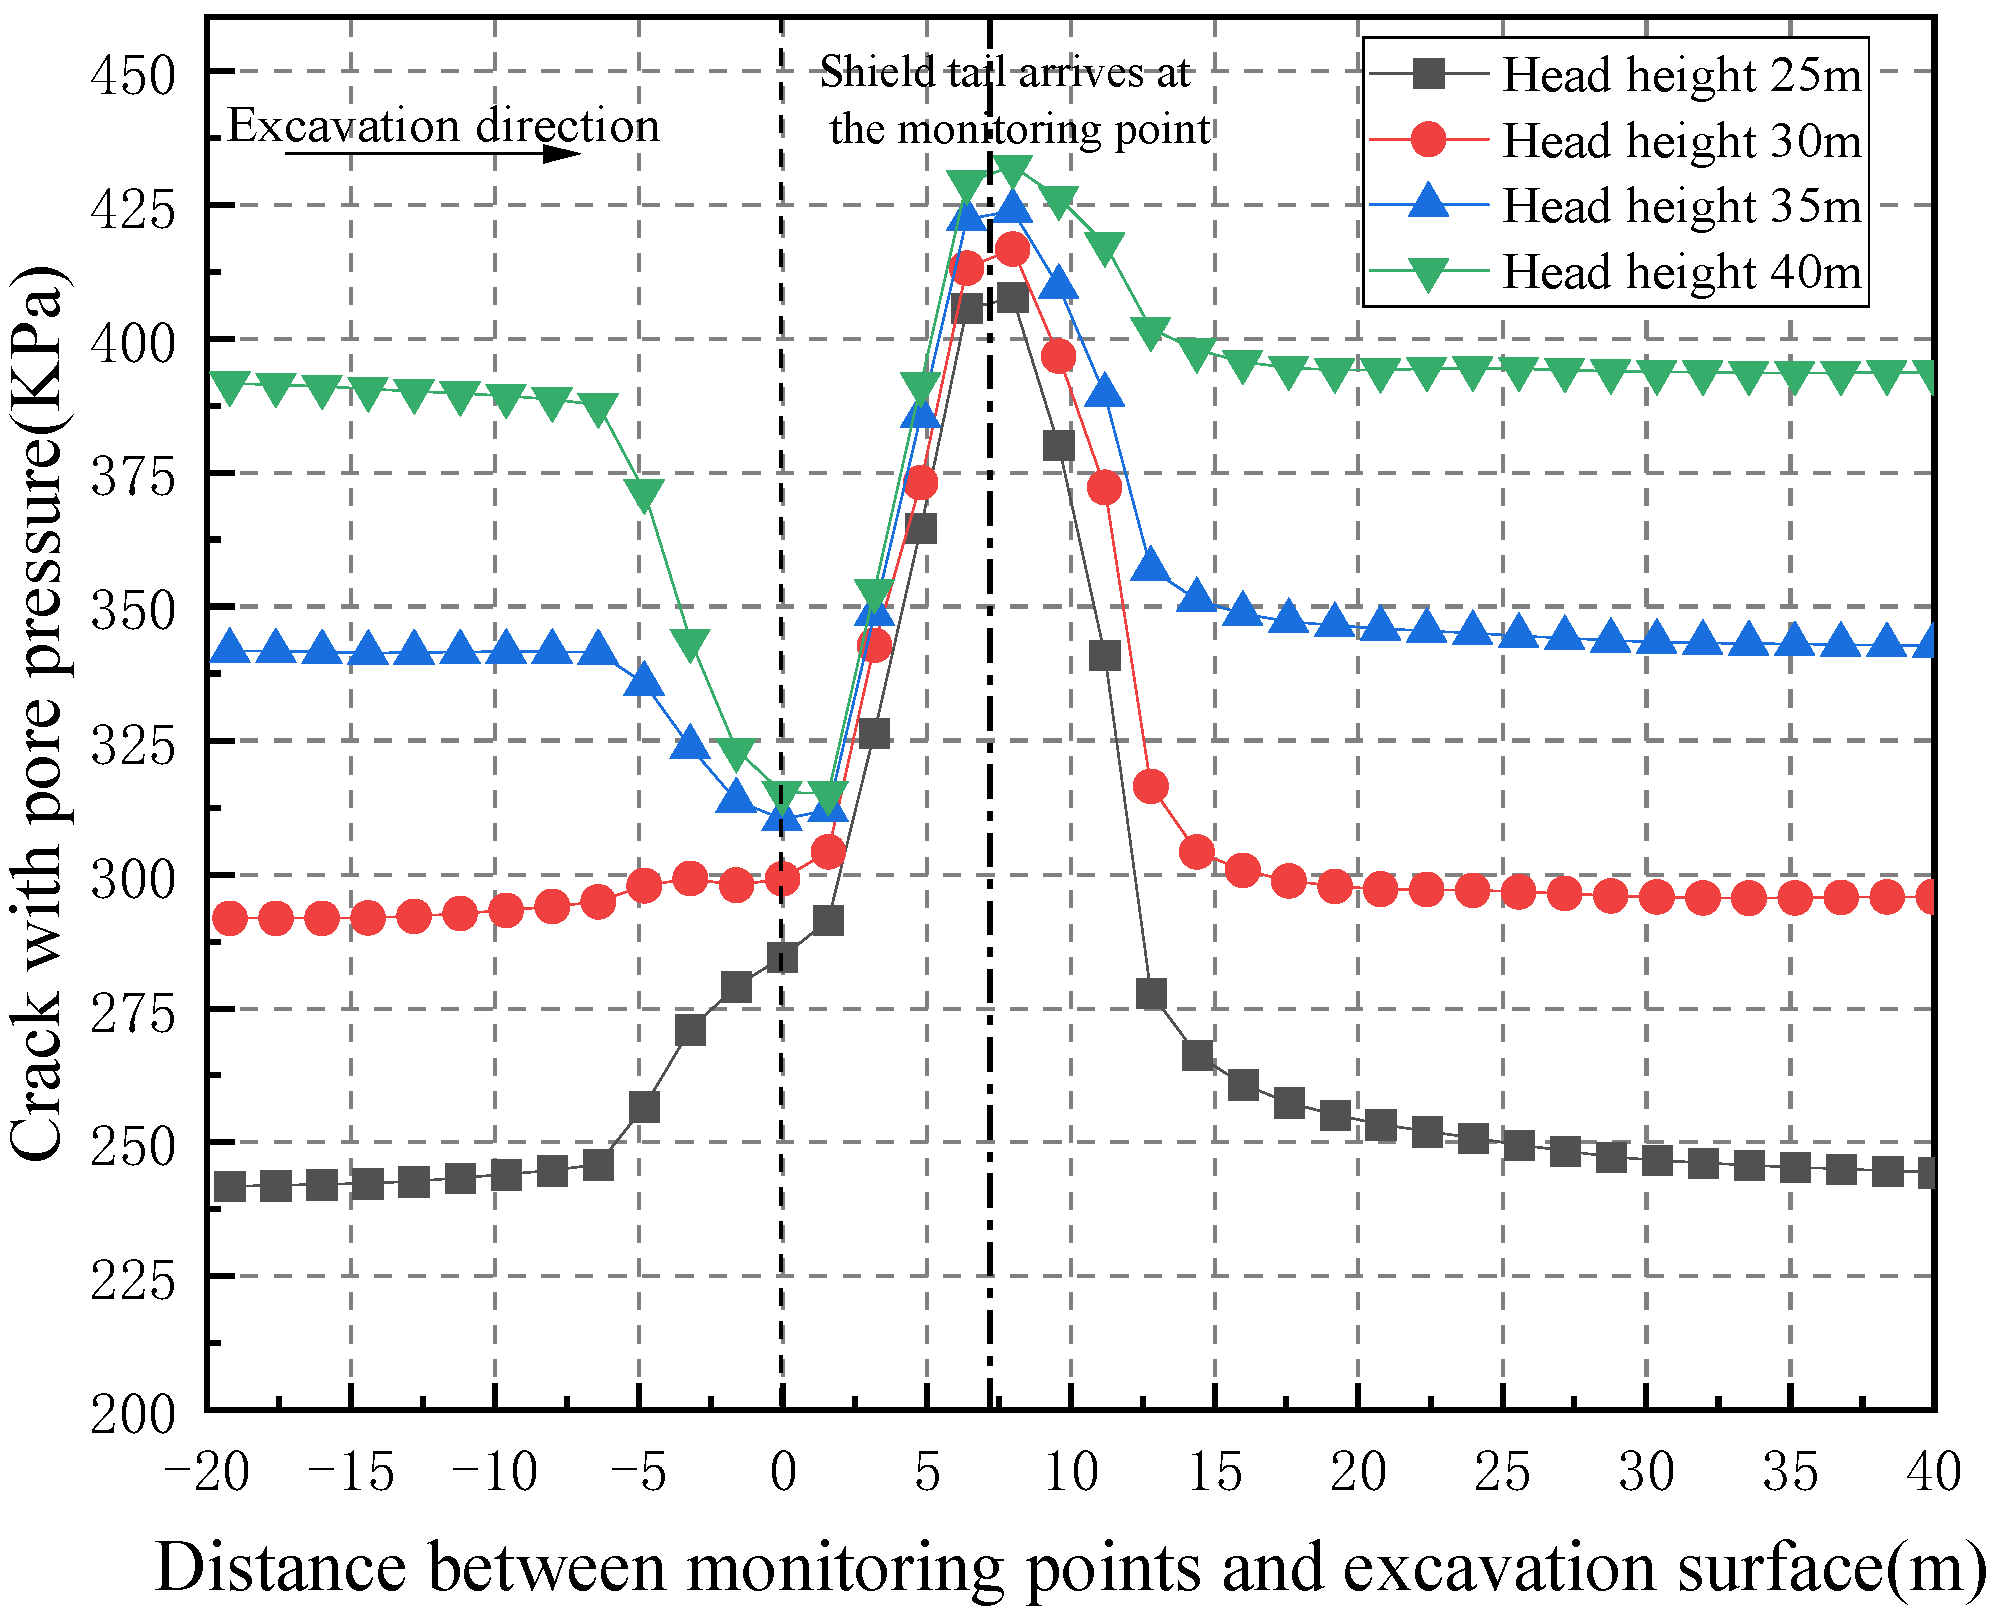
4.3. Water Cover Height

In order to further study the impact of synchronous grouting on the rock and soil mass in fault fracture zones under high burial depth and high water pressure conditions, parameter analysis was conducted on the overlying water conditions. The grouting pressure is 450 kPa, and the grouting filling coefficient is 100%. With the grouting parameters unchanged, different water head heights of 25 m, 30 m, 35 m, 40 m and no groundwater on the tunnel top surface are selected for analysis.
Figure 26 shows the settlement variation curve of tunnels with different water cover depths. It can be seen that the influence of water depth factors on the fault fracture zone area and the original rock area is significantly different. The settlement effect in the original rock area is relatively small, while in the fault fracture zone area, as the water pressure condition increases, the settlement amount has a significant impact. When there is no groundwater, the settlement of rock and soil is significantly lower than when there is water pressure. Therefore, in the formation of fault fracture zones, if the overlying water pressure is too high, it may lead to excessive settlement exceeding the warning. The Chinese meaning of the black legend in the figure is ‘no groundwater’.
Select monitoring points in ordinary surrounding rock and fault fracture zones to analyze the pore pressure caused by synchronous grouting during shield tunneling. Study the variation of pore pressure under different water cover conditions with the same grouting parameters unchanged. As shown in Figure 27, Figure 28 and Figure 29, under different water head heights, the grouting pressure of 450 kPa has a significant impact on the variation of pore pressure.
When the cutter head of the shield tunneling machine is heading towards the monitoring point, the initial hole pressure value gradually approaches the mud pressure value of the face. When the shield tail reaches the monitoring section, under different water cover depths, the hole pressure value of the monitoring point rapidly increases due to the grouting pressure, and the synchronous grouting pressure value towards the shield tail is close, and the influence becomes more obvious when the water cover depth is low, which is shown in Figure 30.
Therefore, synchronous grouting during shield tunneling is the main reason for the changes in pore pressure of surrounding rock and soil, and the setting of grouting pressure needs to be further matched with the depth of overlying water to reduce disturbance to the formation structure. When grouting in the induced crack zone area, the influence of pore pressure is higher than that of ordinary surrounding rock and fractured zone, but the influence range is limited. After the shield tail leaves the monitoring point for 7 m, the pore pressure basically returns to the initial pore pressure.

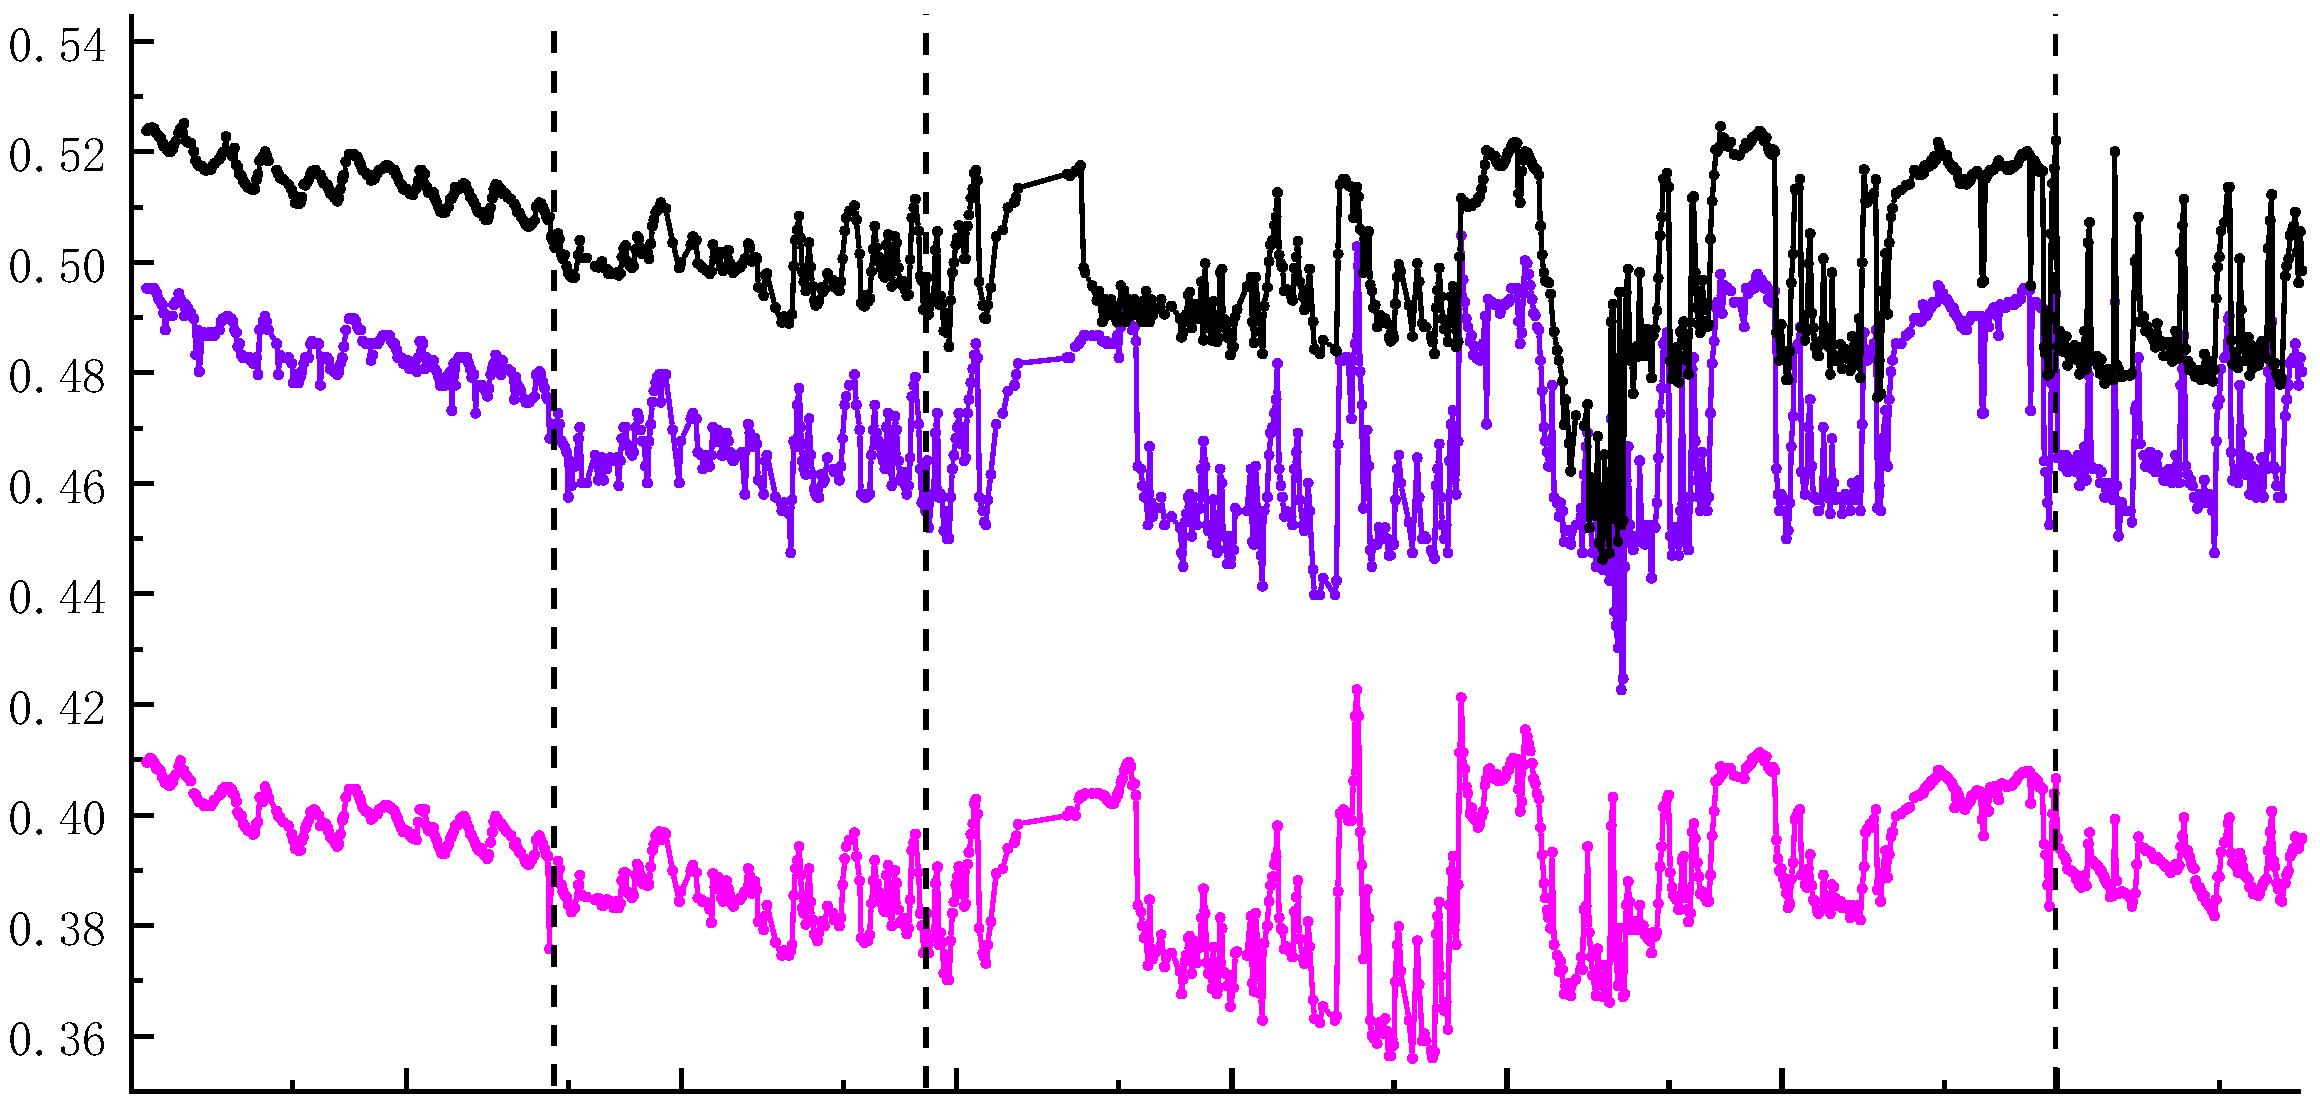
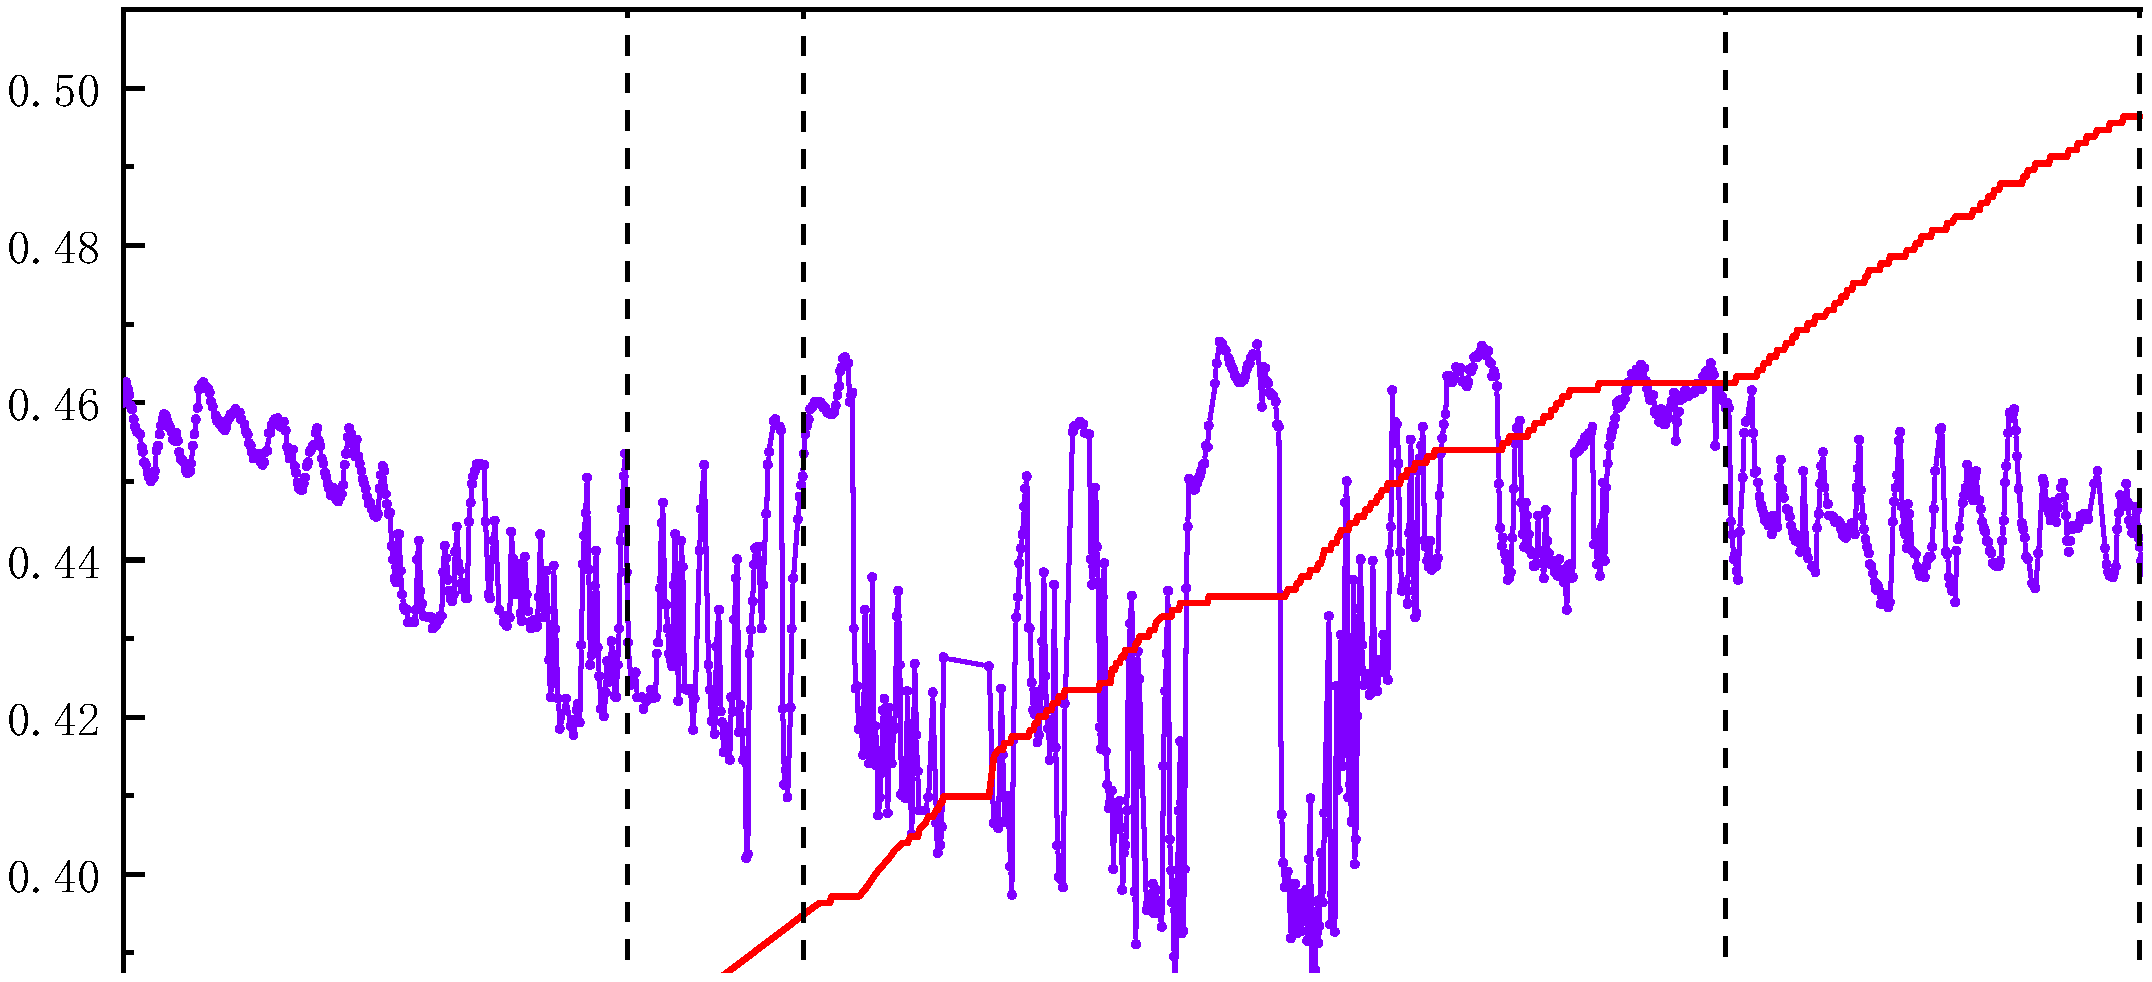
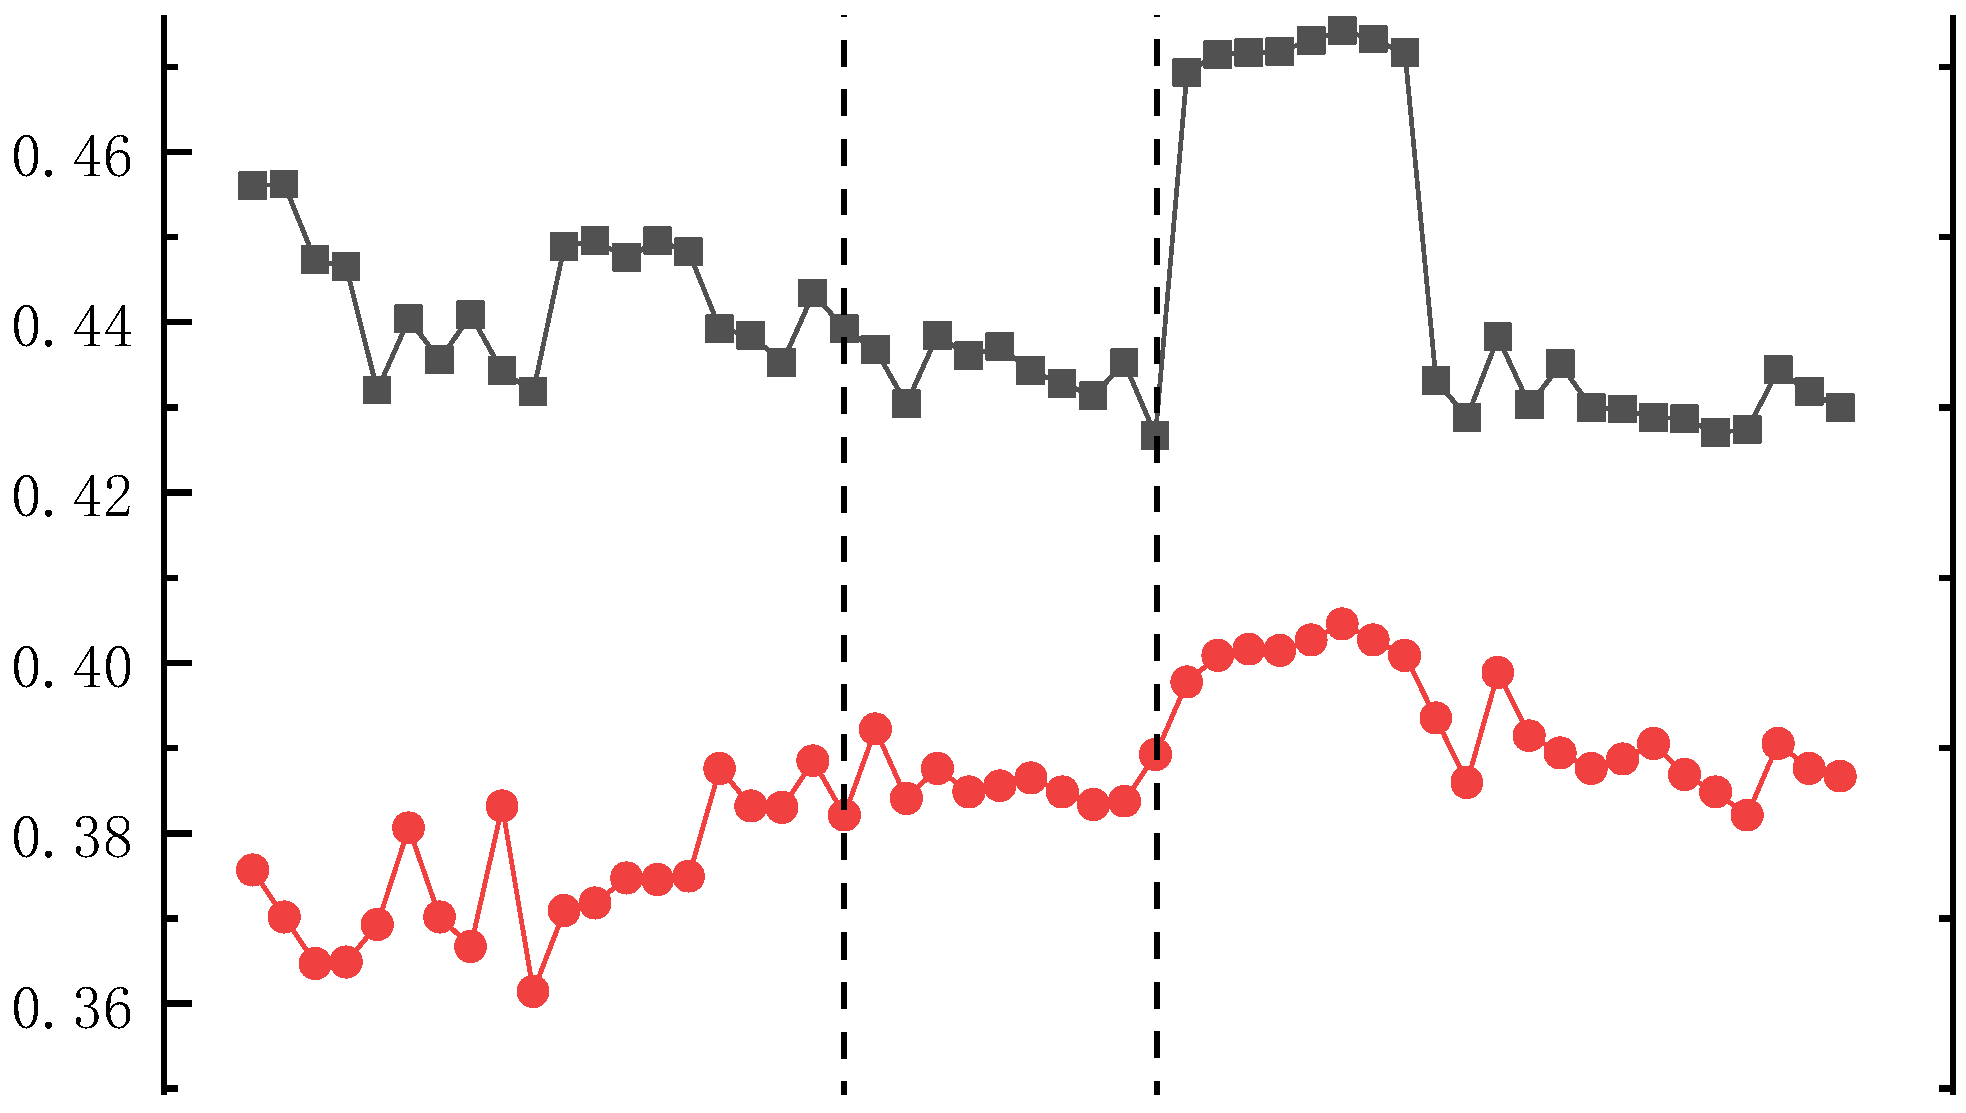
5. On Site Monitoring of Soil and Water Pressure

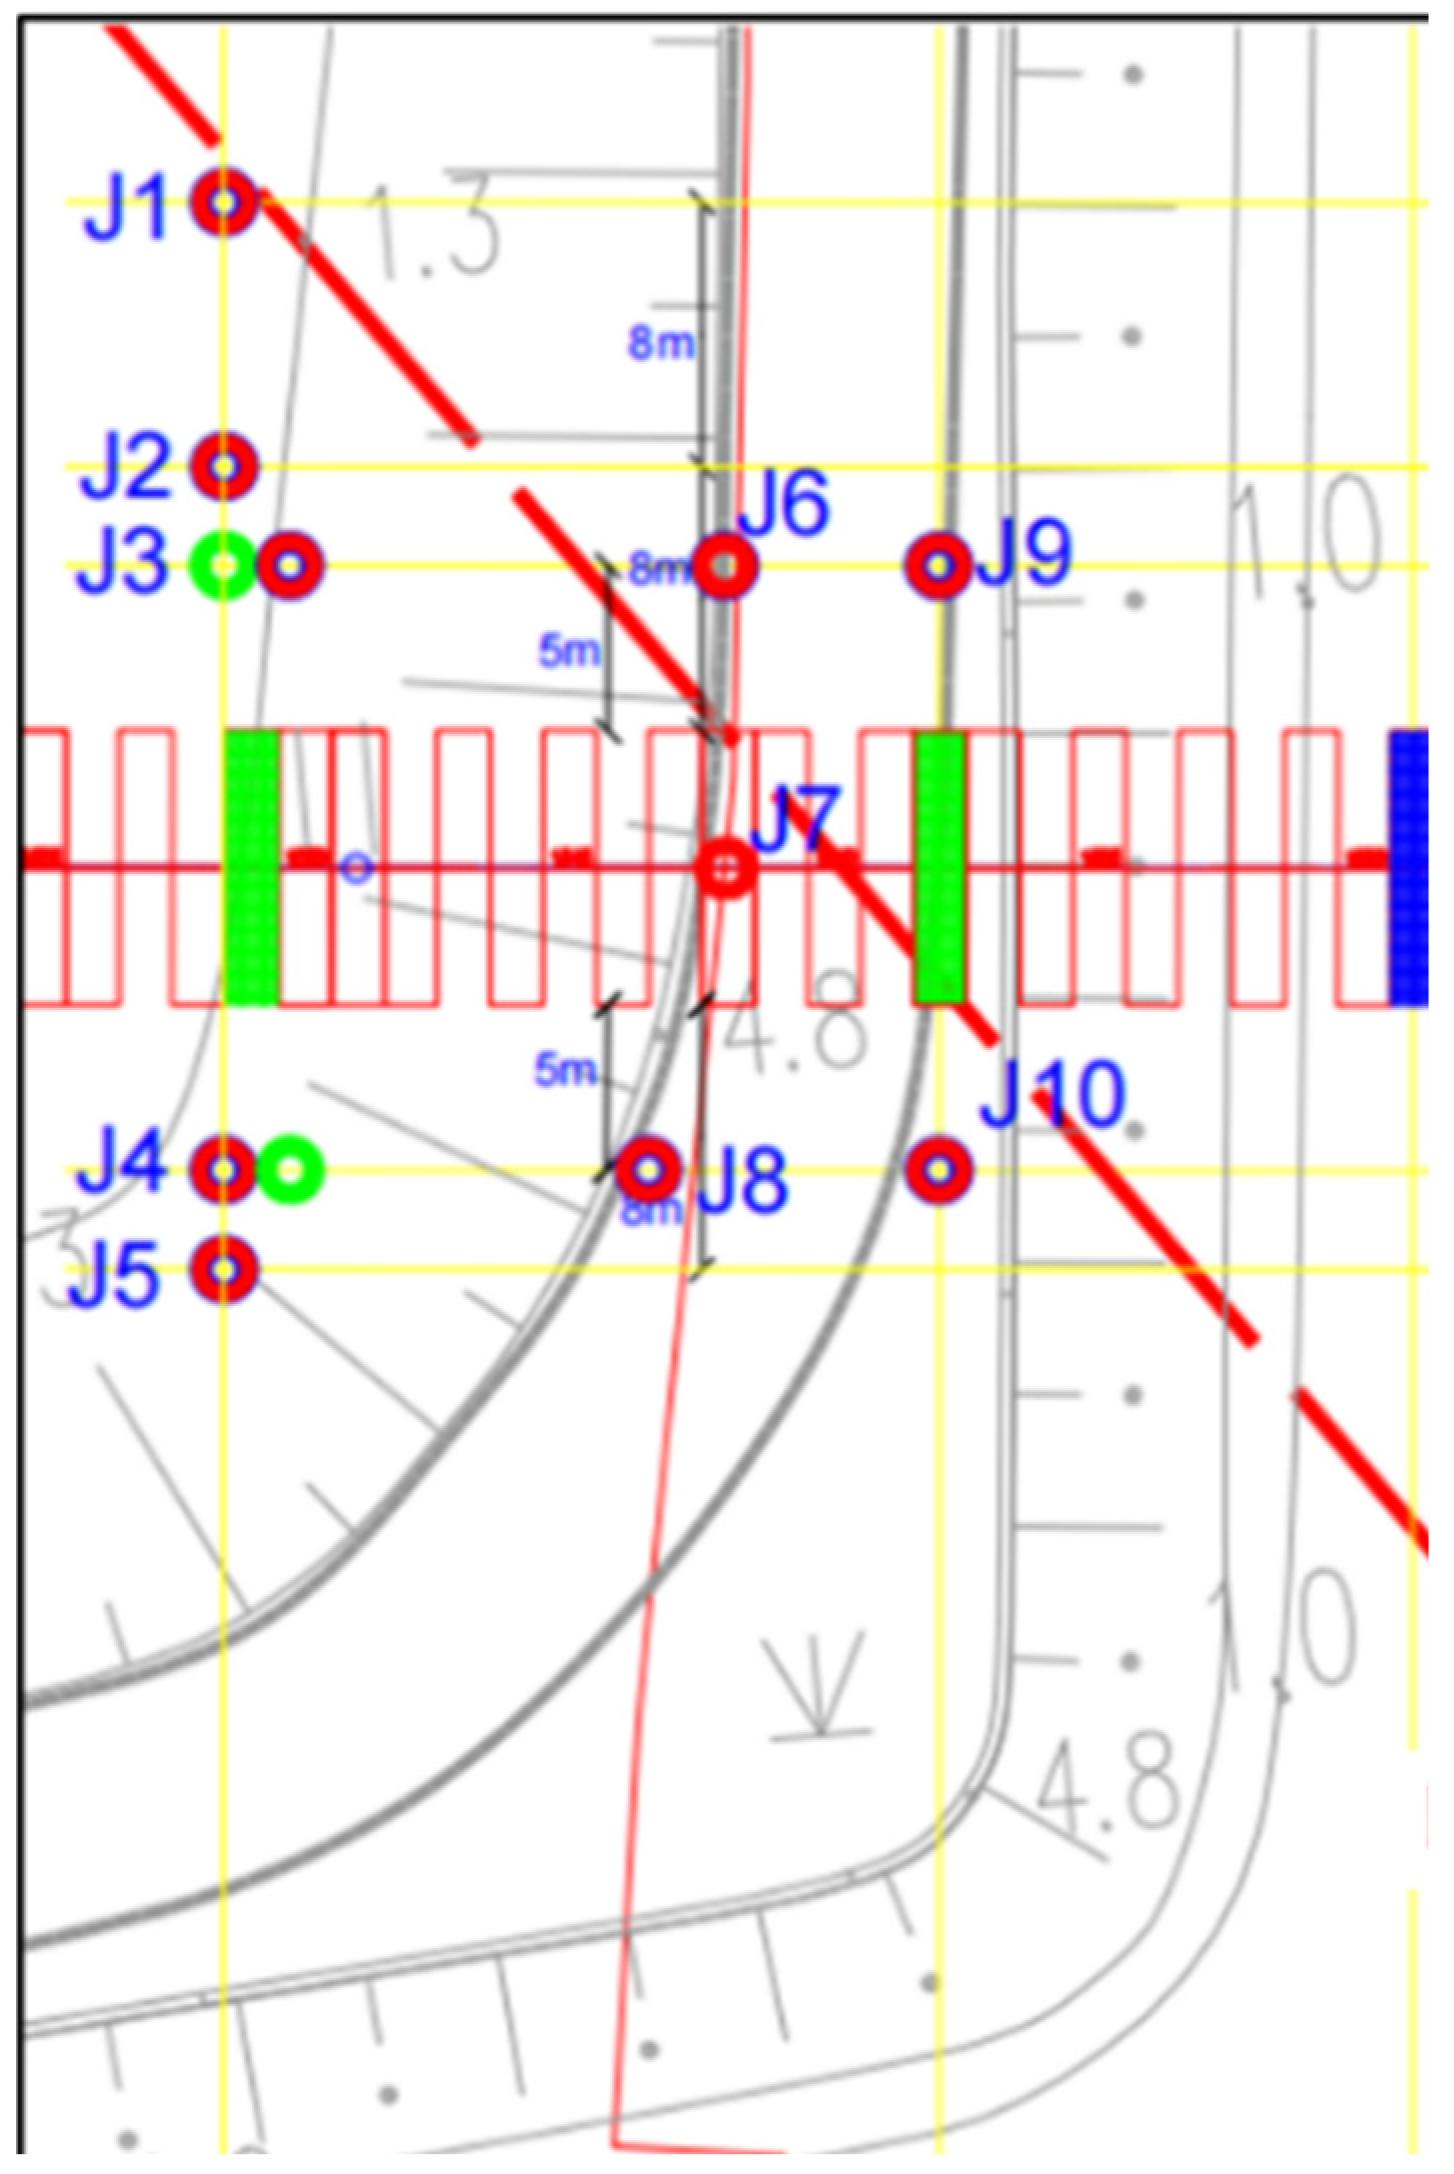
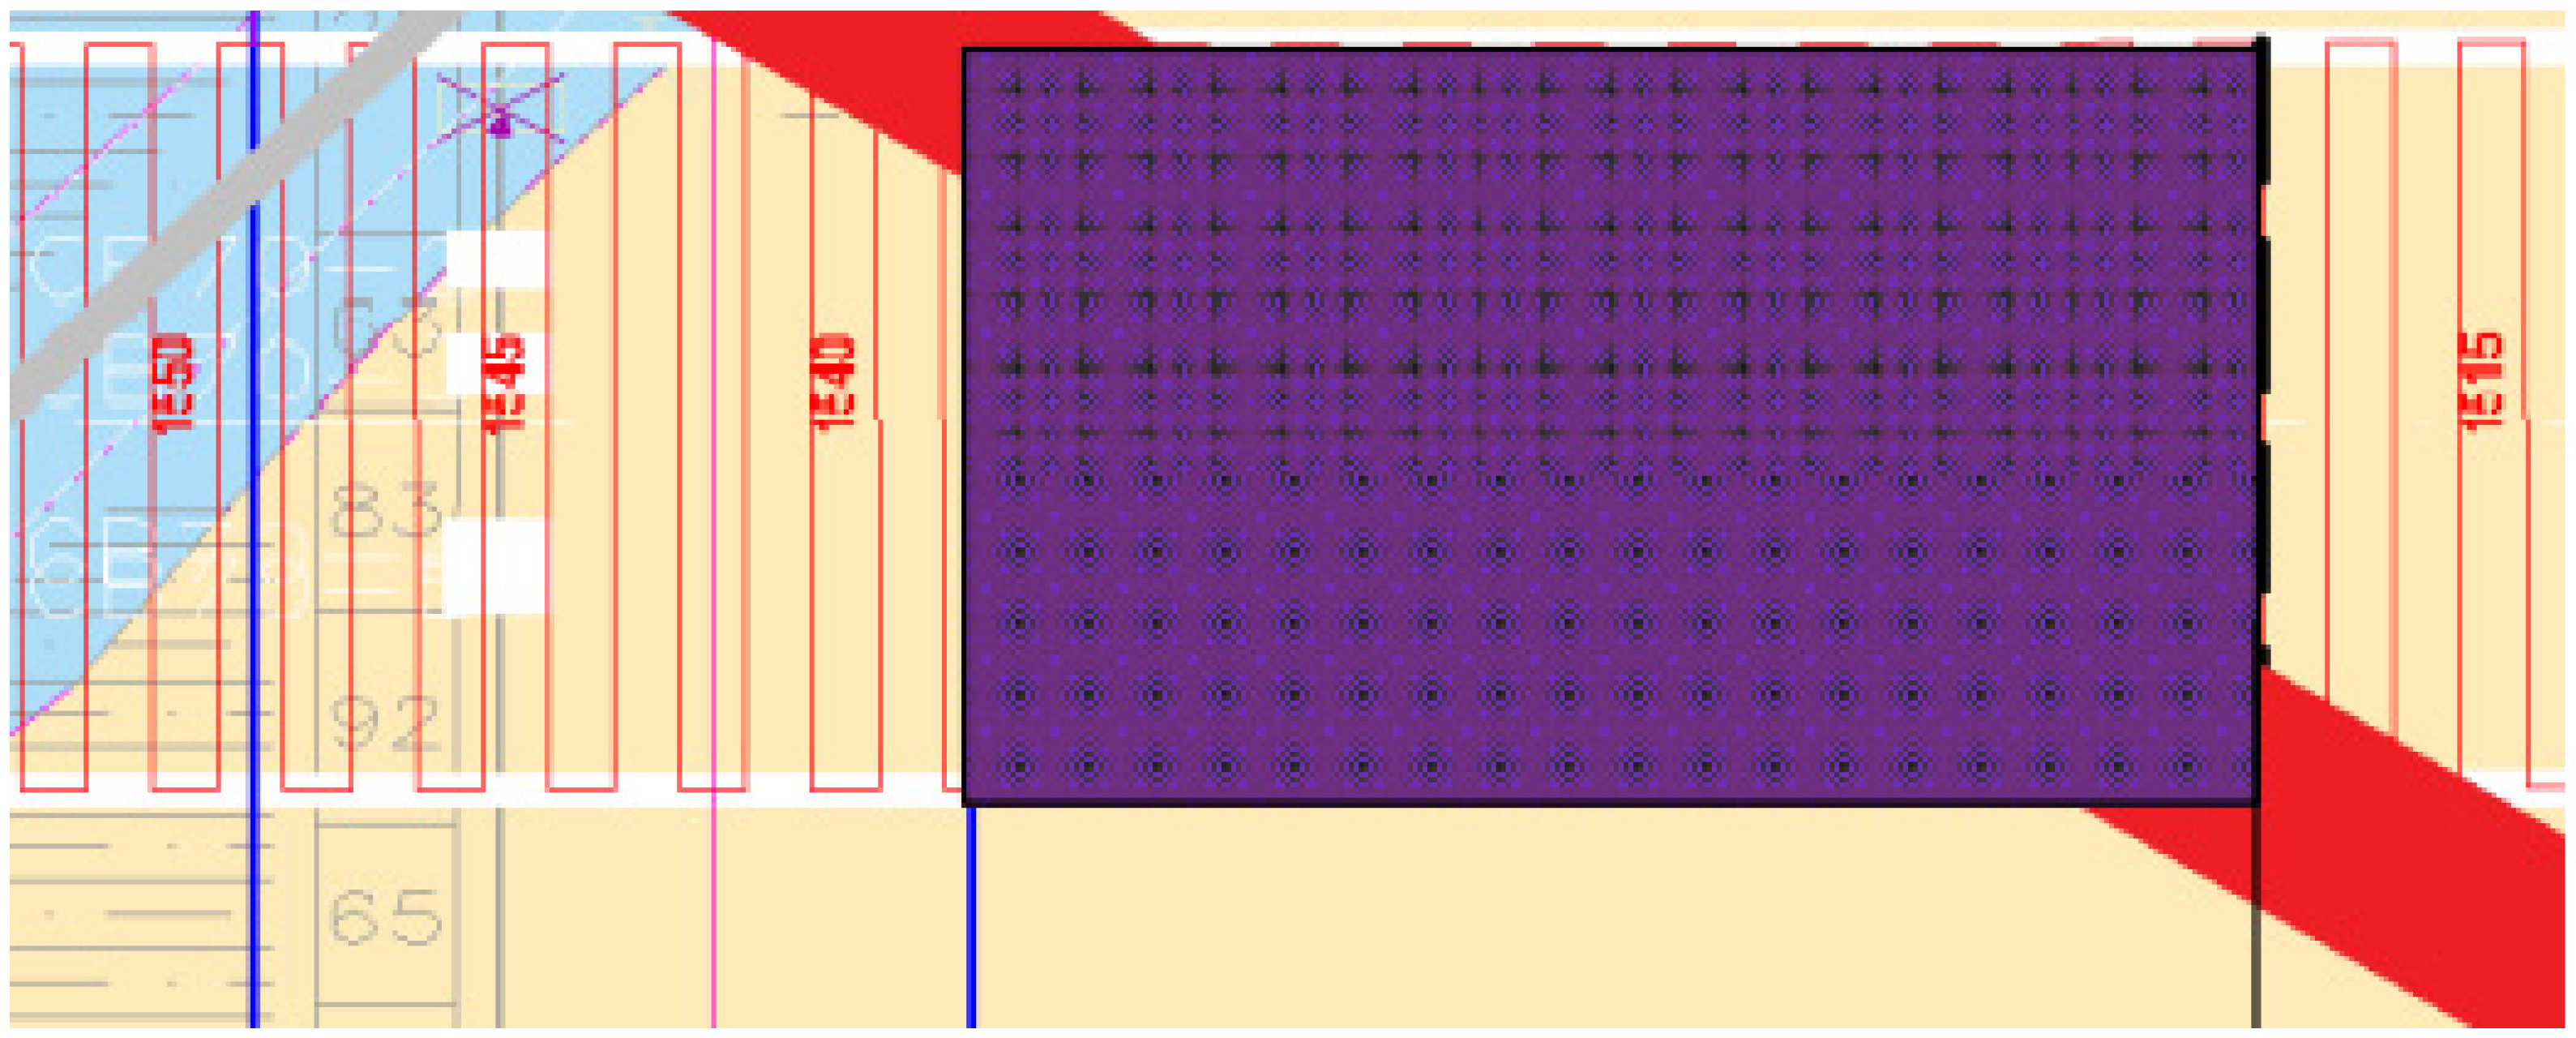
5.1. Monitoring Layout

As shown in Figure 31, this on-site monitoring test is located in the excavation section of B3 section from Well 7 to Well 6. During the shield tunneling process of the Shiziyang Water Transfer Tunnel, the entire process of on-site monitoring was carried out at the F113 fault (GS14 + 650~GS14 + 700) location. The main content includes monitoring of the horizontal diameter convergence and internal surface strain of the pipe segment, monitoring of the stress and strain of the steel bars inside the pipe segment, monitoring of the horizontal displacement of deep rock and soil, and monitoring of pore water pressure and soil pressure. The focus of this article is on the stress field and seepage field changes of the rock and soil in the fault fracture zone caused by synchronous grouting, so there is no specific analysis of the segment data.
The fault fracture zone is located below the river embankment and is relatively close to Shiziyang. There is a coarse sand layer above it, which has strong water permeability. As shown in Figure 32, the bedrock is drilled vertically from the surface in the monitoring test area. The designed burial depth of the tunnel top is about 43.8 m, with an average drilling depth of about 56 m below 22 m for the bedrock. Before shield tunneling, sensors are buried and calibrated before the monitoring process. During monitoring, reference readings are selected and continuously accumulated. The total amount and increment are calculated using the reference pressure for later testing results.
Based on the monitoring holes arranged, comparative analysis can be conducted on three monitoring sections, namely: the monitoring surface composed of J1–J2–J3–J4–J5 perpendicular to the direction of shield tunneling, the north monitoring surface parallel to the direction of shield tunneling in the J3–J6–J9 group layer, and the south monitoring surface parallel to the direction of shield tunneling composed of J4–J8–J10.

5.2. Analysis of Monitoring Results

The fault zones distributed on the shield tunneling section seriously affect the construction safety of the shield tunneling, so accurately determining the relative position relationship between the fault zones and the shield tunneling section is crucial for the safe construction of the shield tunneling. Based on the geological survey results of drilling and coring, the distribution of fault fracture zones is revealed, and the relative position relationship between the fault fracture zone and the shield tunneling face is determined.
The distribution of fault zones plotted based on the analysis results and the relationship between them and shield tunneling are shown in Figure 33 and Figure 34. The inclination angle of F113 fault is relatively small, and the estimated interval between the fault fracture zone and the shield tunneling section in the profile is 1519–1538, with the intersection of faults, strongly weathered rock layers, and weakly weathered rock layers.
The changes in soil pressure can reflect the effects of synchronous grouting during shield tunneling. Selecting data from some drilling monitoring points, the changes in soil pressure during shield tunneling through fault fracture zones are analyzed, as shown in Figure 35 and Figure 36. In Figure 35, the black, purple, and pink lines represent the soil pressure at the bottom, middle, and top, respectively. In Figure 36, the purple and red lines represent the soil pressure and ring number, respectively.
Based on the monitoring data of J3 borehole soil pressure sensor, the trend of soil pressure changes at the top, middle, and bottom is obtained. From Figure 35, it can be seen that the variation pattern of soil pressure at the bottom, middle, and top is basically consistent. As the shield tunneling progresses, the surrounding rock and soil pressure is gradually reduced due to disturbance. When the shield tunneling machine is near the monitoring point, it has a significant impact on the rock and soil stress, with drastic changes. However, as the shield tunneling moves away, the impact on soil pressure gradually decreases.
It can be seen that as shield tunneling progresses, the soil pressure varies in stages at different times and distances. Based on this division method, the impact area of shield tunneling through faults can be roughly divided into the main impact area, secondary impact area, and non-impact area. In the main affected area, the fluctuation of soil pressure is severe; however, there are secondary impact zones before and after the main impact zone, with significant fluctuations in soil pressure and a relatively small range of impact zones.
The J9 borehole is close to the fault zone, and the central sensor is located on the right side of the shield, indicating a representative change in soil pressure. As shown in Figure 36, the variation of the soil pressure sensor in the middle of J9 during the entire process of shield tunneling through fault fracture zones is shown. The purple line represents the variation of soil pressure at the monitoring point with excavation time, and the red line represents the excavation ring number at that time.
According to the monitoring of soil pressure changes in the middle of J9 borehole, it can be concluded that when the shield tunneling passes through the fault fracture zone and enters the 1464 ring, the soil pressure begins to fluctuate significantly and enters the secondary affected area. Between rings 1485–1567, the pressure fluctuates violently and enters the main influence zone; when crossing between 1567 Ring Road and 1608 Ring Road, the curve fluctuation gradually decreases and enters the secondary impact zone; after passing through Ring 1608, entering the non-affected zone, the pressure fluctuation gradually stabilizes in the region.
It is worth noting that when the shield tunneling reaches 1532, 1554, 1564, and 1565 rings, the stopping time is relatively long, and the soil pressure is relatively high and stable. When the shield tunneling restarts, it causes a significant attenuation of the surrounding soil pressure, and repetitive pressure fluctuations will have a significant impact on the formation. It is recommended that the shield tunneling machine slowly and uniformly excavate when crossing the fault fracture zone, control the grouting pressure, and reduce the stopping of the ring.
In order to compare the impact of synchronous grouting on the fault fracture zone and normal strata, monitoring points J9 and J6 near the fault and J4 far from the fault were selected for analysis. The distance between the monitoring section and the changes in soil pressure of the shield tunneling are shown in Figure 37, Figure 38 and Figure 39. In Figure 37, Figure 38 and Figure 39, black, red, and blue represent the soil pressure at the bottom, middle, and top, respectively.
At J4 monitoring point, during the synchronous grouting process of shield tunneling, the soil pressure significantly increased, with a maximum variation of 0.04 MPa in the middle. After eight consecutive cycles, the stress value dropped to the pre grouting stress level. The overall pattern of soil pressure at monitoring points J6 and J9 during shield tunneling is relatively consistent: the stress reduction value at the bottom of the soil pressure is relatively small when the shield machine reaches the cross-section, while the soil pressure at the bottom of J9 is about 0.43~0.44 MPa. When the shield tail undergoes synchronous grouting, the stress value increases to a higher level and remains relatively high for a long time.
In addition, the topsoil pressure sensor is located in the crushing zone, and there is a certain difference in the changes in soil pressure compared to the middle and bottom. Within a certain range before the shield machine arrives, the topsoil pressure gradually increases. After the shield machine passes by, the soil pressure slowly increases in a far range. It can be seen that the synchronous grouting effect at the shield tail is relatively small. This may be due to the fact that the top monitoring point is located within the range of the top inclined fault gouge, and the shield tunneling with mud water balance increases the impact of the excavation surface on the originally small soil pressure fracture zone, resulting in a limited range of influence in the vertical direction of synchronous grouting.
The changes in pore water pressure can also better reflect the effects of synchronous grouting during shield tunneling. Similarly, data from the same part of drilling monitoring points were selected to analyze the changes in seepage pressure of shield tunneling through fault fracture zones, as shown in Figure 40. In Figure 40, black, red, and blue represent the soil pressure at the bottom, middle, and top, respectively.
Based on the monitoring data of the J3 borehole pore water pressure sensor, the variation trends of pore water pressure at the top, middle, and bottom are obtained. From Figure 40, it can be seen that the variation pattern of soil pressure at the bottom, middle, and top of shield tunneling is the same at the same time. As the shield tunneling progresses, the pore water pressure in the surrounding rock is gradually reduced due to disturbance. When the shield tunneling machine is closer to the monitoring point, the changes in pore pressure are severe, while as the shield tunneling machine moves away, the impact on soil pressure gradually decreases. Compared to Figure 35, the variation patterns of pore pressure and soil pressure are basically consistent.
As shown in Figure 41, the variation of the pore water pressure sensor in the middle of J9 during the entire process of shield tunneling through the fault fracture zone is the same as the previous text. The purple line represents the change of soil pressure at the monitoring point with excavation time, and the red line represents the excavation ring number at that time. In Figure 41, the purple and red lines represent the pore pressure and ring number, respectively.
According to the monitoring of pore water pressure changes in the central part of J9 borehole, it can be concluded that the variation pattern of pore water pressure is consistent with that of J9 soil pressure, and there are three influencing areas: the main influencing area, the secondary influencing area, and the non-influencing area. The shield tunneling enters the secondary impact zone, and the pore water pressure begins to fluctuate significantly; entering the main influence zone between rings 1485–1567, the pore water pressure fluctuates violently.
Similarly, J9 and J6 monitoring points close to the fault and J4 monitoring points farther away from the fault were selected for analysis. The distance between the monitoring section of the shield tunneling and the changes in pore water pressure are shown in Figure 42, Figure 43 and Figure 44. In Figure 42, Figure 43 and Figure 44, black, red, and blue represent the pore pressure at the bottom, middle, and top, respectively.
(1) Before the shield tunneling reaches the monitoring section, the pore water pressure slowly decreases and the change in pore pressure is relatively small. However, when the shield tail synchronous grouting reaches the monitoring section, the pore pressure significantly increases. At J4 monitoring point, the change in pore pressure is consistent with the change in soil pressure, and the increase in pore pressure continues for a period of time before falling back to the initial level; at monitoring points J6 and J9, the pore water pressure changes significantly upon the arrival of the shield machine and continues to increase. When the shield tail is synchronously grouted, the excess pore pressure reaches its maximum.
(2) From the figure, it can be seen that the main reason for the fluctuation of pore water pressure during synchronous grouting is that the change in top pore pressure is relatively small in the same measuring hole, indicating that the scope of influence of synchronous grouting during construction is limited and decreases with increasing distance.
(3) Compared to the changes in pore pressure of J4, the changes in excess pore pressure of J6 and J9 during shield tunneling are relatively small. The maximum excess pore water pressure from the excavation face to synchronous grouting is 18 kPa and 22 kPa, respectively, while the maximum excess pore water pressure of J4 is 30 kPa. This may be due to the fact that the J9 test hole is closer to the fault fracture zone, with the development of fractures around the fault, and the rapid dissipation of pore pressure caused by grouting pressure, resulting in low pore pressure during excavation monitoring.

6. Conclusions

(1) According to the on-site water and soil pressure monitoring results, synchronous grouting at the shield tail is the main cause of changes in soil and rock pressure in the fault fracture zone area, which is consistent with the numerical model analysis results. The trend of changes in soil pressure and pore water pressure during shield tunneling is basically consistent. According to the different positions of monitoring points at the distance of shield tunneling, it can be divided into main impact area, secondary impact area, and non-impact area. When the shield tunneling machine approaches, the water and soil pressure changes strongly. When the shield tail passes by, there is a maximum excess pore pressure value. When the shield tunneling machine moves away, the water and soil stress shows a downward trend. The impact of synchronous grouting decreases with the increase in excavation distance.
(2) The difference in the properties of surrounding rocks is the main reason for the variation of water and soil pressure. Due to differences in permeability, the variation pattern of pore pressure in the fault fracture zone is significantly different from that of the original rock. The pore pressure in the induced fracture zone area increases rapidly and has a wider impact range and can dissipate quickly after grouting is completed in a short period of time.
(3) According to the numerical model analysis results, after crossing the surrounding rock of the fault fracture zone, the maximum settlement of the rock and soil along the tunnel is concentrated in the fault fracture zone area, and the settlement of the lower wall fracture zone is relatively larger than that of the upper wall fracture zone.
(4) The analysis of grouting parameters shows that the grouting pressure has a strong impact on the variation of pore pressure, while the grouting pressure has a small impact on the final settlement deformation of rock and soil and needs to be maintained within a certain reasonable range; the amount of grouting has a certain effect on resisting the settlement of rock and soil. For areas with fault fracture zones, the amount of grouting should be appropriately supplemented; under high water pressure conditions, the impact on the deformation and settlement of the original rock is relatively small, while the impact on the settlement of fault fracture zones is greater.

Author Contributions

Y.Z. and Y.F. proposed the core ideas of the manuscript and made the final revisions to it; M.L. and N.L. wrote the original manuscript; S.W. organized and translated the current manuscript; C.G., X.Z., J.Z., Y.B., Q.L. and Z.Y. provided experimental data and graphs for the manuscript. All authors have read and agreed to the published version of the manuscript.

Funding

This research was funded by Guangdong Province Key Field R&D Program Project (Nos. 2022B0101070001, 2019B111108001), the National Natural Science Foundation of China (project Nos. 52078304, 51938008 and 52090084), Shenzhen Fundamental Research (No. 20220525163716003), Shenzhen Science and Technology Program (KQTD20200909113951005), and the Pearl River Delta Water Resources Allocation Project (CD88-GC022020-0038).

Data Availability Statement

The authors confirm that the data supporting the findings of this study are available within the article.

Conflicts of Interest

The authors declare no conflict of interest.

References

  1. Song, T.; Zhou, S.; Xu, R. The mechanism of synchronous grouting at the tail of shield tunnel and the determination of grouting parameters. J. Undergr. Space Eng. 2008, 4, 130–133. [Google Scholar]
  2. Ye, F.; Mao, J.; Ji, M.; Sun, C.; Chen, Z. Research status and development trend of grouting behind shield tunnel walls. Tunn. Constr. 2015, 35, 739–752. [Google Scholar]
  3. Zhang, N.; Shen, J.S.; Zhou, A.; Arulrajah, A. Tunneling induced geohazards in mylonitic rock faults with rich groundwater: A case study in Guangzhou. Tunn. Undergr. Space Technol. 2017, 74, 262–272. [Google Scholar] [CrossRef]
  4. Huang, L.; Ma, J.; Lei, M.; Liu, L.; Lin, Y.; Zhang, Z. Soil-water inrush induced shield tunnel lining damage and its stabilization: A case study. Tunn. Undergr. Space Technol. 2020, 97, 103290.1–103290.15. [Google Scholar] [CrossRef]
  5. Ye, F.; Zhu, H.; He, C. Analysis of the diffusion mode of grouting behind the shield tunnel wall and the pressure on the segment. Geotech. Mech. 2009, 30, 1307–1312. [Google Scholar]
  6. Bai, Y.; Dai, Z.; Zhang, S.; Peng, F. Research on the Pressure Diffusion Mode of Synchronous Grouting in Shield Tunnels. China Railw. Sci. 2011, 32, 38–45. [Google Scholar]
  7. Hu, C.; Guo, J.; Mei, Y.; Wang, Z.; Yuan, Y. The influencing factors and diffusion mechanism of synchronous grouting slurry pressure in shield tunneling. J. Xi’an Univ. Archit. Technol. (Nat. Sci. Ed.) 2020, 52, 617–625. [Google Scholar]
  8. Ye, F.; Guo, H.; Duan, Z.; Liang, X.; Wang, S.; Wang, B. Research on the disturbance dynamics of synchronous grouting construction in deep buried shield tunnels. J. Geotech. Eng. 2019, 41, 855–863. [Google Scholar]
  9. Zhang, W. Research on the Mechanism and Application of Grouting Reinforcement in the Fractured Zone of Water Rich Faults in Tunnel Engineering. Ph.D. Thesis, Shandong University, Jinan, China, 2014. [Google Scholar]
  10. Li, P. Research on Mechanical Behavior of Tunnel Construction in Fault Fractured Zone Sections. Master’s Thesis, Chang’an University, Xi’an, China, 2013. [Google Scholar]
  11. Jiang, K.; Liu, B.; Qin, K.; Zhou, T. Research on Optimization of Excavation Parameters for Slurry Shield Tunneling in Fault Fractured Zones. Transp. Sci. Eng. 2020, 36, 43–49. [Google Scholar]
  12. Zhao, K.; Janutolo, M.; Barla, G. 3D simulation of TBM excavation in brittle rock associated with fault zones: The Brenner Exploratory Tunnel case. Eng. Geol. 2014, 181, 93–111. [Google Scholar] [CrossRef]
  13. Wan, D.; Zhu, D.; Xia, Y. Numerical simulation study on the influence of grouting behind the shield tunnel wall on surface settlement. J. Hebei Univ. Technol. 2011, 40, 110–113. [Google Scholar]
  14. Yu, L. Study on the Changes in Seepage Field and Formation Deformation Caused by Synchronous Grouting at the Tail of a Large Diameter Shield Tunnel. Master’s Thesis, South China University of Technology, Guangzhou, China, 2018. [Google Scholar]
  15. Faulkner, D.R.; Lewis, A.C.; Rutter, E.H. On the internal structure and mechanics of large strike-slip fault zones: Field observations of the Carboneras fault in southeastern Spain. Tectonophysics 2003, 367, 235–251. [Google Scholar] [CrossRef]
  16. Bezuijen, A.; Talmon, A.M.; Kaalberg, F.J.; Plugge, R. Field measurements of grout pressures during tunnelling of the sophia rail tunnel. J. Jpn. Geotech. Soc. 2008, 44, 39–48. [Google Scholar] [CrossRef]
  17. Zhang, D.; Ran, L.; Yan, J. The influence of water leakage under grouting on tunnel and ground settlement. J. Tongji Univ. (Nat. Sci. Ed.) 2017, 45, 497–503. [Google Scholar]
  18. Yu, W. The Mechanism and Engineering Application of Splitting Grouting Diffusion in Tunnel Muddy Filling Fault Fracture Zone. Ph.D. Thesis, Changsha University of Technology, Changsha, China, 2015. [Google Scholar]
  19. Li, P. Research on the Mechanical Mechanism and Control Method of the Whole Process of Mud Fault Splitting Grouting. Ph.D. Thesis, Shandong University, Jinan, China, 2017. [Google Scholar]
  20. Zhang, S.; Dai, Z.; Bai, Y. Model experimental study on the pressure distribution law of synchronous grouting slurry in shield tunnel. China Railw. Sci. 2015, 36, 43–53. [Google Scholar]
  21. Xu, Y. Stability Analysis of Surrounding Rock in Fault Fractured Zone during Construction of Qingdao Metro. Master’s Thesis, Qingdao University of Technology, Qingdao, China, 2017. [Google Scholar]
Figure 1. Model size diagram.
Applsci 13 12972 g001
Figure 2. Schematic diagram of model components.
Applsci 13 12972 g002
Figure 3. Actual measurement results of synchronous grouting pipe segment grouting pressure.
Applsci 13 12972 g003
Figure 4. Model construction load.
Applsci 13 12972 g004
Figure 5. Segment.
Figure 5. Segment.
Applsci 13 12972 g005
Figure 6. Shield machine casing.
Applsci 13 12972 g006
Figure 7. Grouting layer.
Applsci 13 12972 g007
Figure 8. Stress field after equilibrium.
Applsci 13 12972 g008
Figure 9. Displacement field after equilibrium (amplified by 107 times).
Applsci 13 12972 g009
Figure 10. Schematic diagram of longitudinal section monitoring points of the model.
Applsci 13 12972 g010
Figure 11. Displacement field during excavation.
Applsci 13 12972 g011
Figure 12. Displacement field after excavation completion.
Applsci 13 12972 g012
Figure 13. Top monitoring point changes with settlement during excavation process.
Applsci 13 12972 g013
Figure 14. Bottom monitoring points change with settlement during excavation process.
Applsci 13 12972 g014
Figure 15. Cloud map of changes in pore pressure during excavation.
Applsci 13 12972 g015
Figure 16. Hole pressure cloud diagram after excavation completion.
Applsci 13 12972 g016
Figure 17. The top monitoring points vary with the pore pressure during the excavation process.
Applsci 13 12972 g017
Figure 18. The bottom monitoring points change with settlement during excavation process.
Applsci 13 12972 g018
Figure 19. The tunnel top settlement curve.
Applsci 13 12972 g019
Figure 20. Maximum settlement variation under different grouting pressures.
Applsci 13 12972 g020
Figure 21. The variation curve of pore pressure at ordinary surrounding rock monitoring points.
Applsci 13 12972 g021
Figure 22. Variation curve of pore pressure in the upper wall induced crack zone.
Applsci 13 12972 g022
Figure 23. The pore pressure variation curve of monitoring points in the fractured zone.
Applsci 13 12972 g023
Figure 24. Tunnel top settlement curve.
Applsci 13 12972 g024
Figure 25. Maximum settlement variation under different grouting quantities.
Applsci 13 12972 g025
Figure 26. Top settlement curve of tunnels along the line.
Applsci 13 12972 g026
Figure 27. Maximum settlement variation at different water cover depths.
Applsci 13 12972 g027
Figure 28. Variation curve of pore pressure at ordinary surrounding rock monitoring points.
Applsci 13 12972 g028
Figure 29. Pore pressure variation curve of monitoring points in crack zone.
Applsci 13 12972 g029
Figure 30. Pore pressure variation curve of monitoring points in the fractured zone.
Applsci 13 12972 g030
Figure 31. Longitudinal Section of J4–J8–J10 Boreholes in the Monitoring Test Area.
Applsci 13 12972 g031
Figure 32. Plan diagram of on-site drilling monitoring points.
Applsci 13 12972 g032
Figure 33. Pore pressure variation curve of monitoring points in the fractured zone.
Applsci 13 12972 g033
Figure 34. F113 fault distribution.
Applsci 13 12972 g034
Figure 35. Change in soil pressure of J3 hole.
Applsci 13 12972 g035
Figure 36. Change in soil pressure in the middle of J9 hole.
Applsci 13 12972 g036
Figure 37. Change in soil pressure at J4 monitoring point.
Applsci 13 12972 g037
Figure 38. Change in soil pressure at J6 monitoring point.
Applsci 13 12972 g038
Figure 39. Change in soil pressure at J9 monitoring point.
Applsci 13 12972 g039
Figure 40. Change in pore water pressure of J3.
Applsci 13 12972 g040
Figure 41. Change in pore water pressure in the middle of J9.
Applsci 13 12972 g041
Figure 42. Change in pore water pressure at J4 monitoring point.
Applsci 13 12972 g042
Figure 43. Change in pore water pressure at J6 monitoring point.
Applsci 13 12972 g043
Figure 44. Change in pore water pressure at J9 monitoring point.
Applsci 13 12972 g044
Table 1. Underpass situation of Chunfeng Tunnel.
LocationPile Bearing LayerRelativenessSpacing
Hongling InterchangeModerately weathered granitePassing through the middlePlane spacing of 4.3 m and 2.4 m
Hongling Ramp BridgeModerately weathered granitePassing through the middlePlane spacing of 6.6 m and 1.3 m
Bao’an InterchangeStrongly weathered fragmented rockVertically underpassVertical distance 3.7 m
Bujihe BridgeStrong~weathered fractured rockVertically underpassVertical distance 3.8~9.3 m
Chunfeng ViaductStrongly weathered tuffaceous sandstoneVertically underpassVertical distance 8.7~9.0 m
Table 2. Basic dimensions of tunnel model.
Cutter Disc Excavation DiameterOuter Diameter of Pipe SegmentInner Diameter of Pipe SegmentTail Gap of Shield
8.65 m8.3 m7.5 m0.35 m
Table 3. Rock and soil parameters.
Rock and Soil MassC (kPa)φ (°)γ (kN/m3)Elastic Modulus (MPa)Poisson’s RatioPermeability Coefficient (cm/s)
Ordinary surrounding rock1000402461400.241.1 × 10−6
Induced crack zone5003322.832000.276.4 × 10−5
Sliding crushing zone20025218000.351.3 × 10−7
Table 4. Material parameters.
TitleTimeThickness (mm)γ (kN/m3)Poisson’s RatioElastic Modulus (MPa)
TBM——175760.2200 × 103
Segment——400250.22880
Grout<24 h175240.344.8
24~48 h175240.344.8
>48 h175240.210.8
Disclaimer/Publisher’s Note: The statements, opinions and data contained in all publications are solely those of the individual author(s) and contributor(s) and not of MDPI and/or the editor(s). MDPI and/or the editor(s) disclaim responsibility for any injury to people or property resulting from any ideas, methods, instructions or products referred to in the content.

