Article

Cause Analysis and Accident Classification of Road Traffic Accidents Based on Complex Networks

The School of Building Environmental Engineering, Zhengzhou University of Light Industry, Zhengzhou 450001, China
*
Author to whom correspondence should be addressed.
Appl. Sci. 2023, 13(23), 12963; https://doi.org/10.3390/app132312963
Submission received: 16 September 2023 / Revised: 1 November 2023 / Accepted: 2 December 2023 / Published: 4 December 2023
(This article belongs to the Special Issue Traffic Safety Measures and Assessment)

Abstract

:
The number of motor vehicles on the road is constantly increasing, leading to a rise in the number of traffic accidents. Accurately identifying the factors contributing to these accidents is a crucial topic in the field of traffic accident research. Most current research focuses on analyzing the causes of traffic accidents rather than investigating the underlying factors. This study creates a complex network for road traffic accident cause analysis using the topology method for complex networks. The network metrics are analyzed using the network parameters to obtain reduced dimensionality feature factors, and four machine learning techniques are applied to accurately classify the accidents’ severity based on the analysis results. The study divides real traffic accident data into three main categories based on the factors that influences them: time, environment, and traffic management. The results show that traffic management factors have the most significant impact on road accidents. The study also finds that Extreme Gradient Boosting (XGBoost) outperforms Logistic Regression (LR), Random Forest (RF) and Decision Tree (DT) in accurately categorizing the severity of traffic accidents.

1. Introduction

The rapid growth of motorized traffic has led to a significant increase in traffic accidents, which are now a major threat to the quality of life and safety of people worldwide. According to statistics from the World Health Organization’s 2018 Global Status Report on Road Safety, approximately 1.35 million people die every year due to traffic accidents, making them the eighth leading cause of death globally. In addition, hundreds of thousands of people are left permanently disabled as a result of traffic accidents [1]. In many developing countries, road traffic accidents have become the leading cause of death among humans. As of 2021, there are more than 1.3 billion motor vehicles in the world, with every family typically having at least one motor vehicle [2]. Compared to other forms of traffic accidents, road traffic accidents have the highest impact on personal safety, property safety, and material safety. When there is a multi-vehicle or large vehicle accident, the entire road network will be brought to a standstill [3].
Therefore, it is crucial to identify the underlying factors contributing to road traffic accidents, and correctly assess the severity of injuries sustained in such incidents. By implementing the above measures, the factors affecting the occurrence of accidents can be accurately found. The safety and accessibility of roads can be improved, thereby greatly reducing the likelihood of road traffic accidents. At the same time, the severity of accident injuries will be reduced, and the prediction range of accident injury severity will be narrowed, thus improving the accuracy of accident collision prediction [4,5,6]. Governments, traffic management departments, and researchers have been exploring various solutions to address this pressing issue [7]. With the rapid advancement of contemporary technologies, data analysis, data mining, machine learning, deep learning, and other technologies have become powerful tools for analyzing accidents’ causative factors, gaining insight into potential laws, and correctly classifying accidents [8].
Traffic accidents are unpredictable and uncontrollable events that pose significant challenges for traffic management departments. The analysis of accidents’ causes often relies on expert judgment, which can be subjective and prone to errors. With the increasing complexity of traffic networks in the 21st century, the accident causal network has become more intricate, with higher interactive complexity, dynamic complexity, structural complexity, and nonlinearity [9]. To address these challenges, complex network theory provides a new perspective for analyzing the internal relations and topology of the network. Complex networks integrate the edges connected between nodes in the network, revealing the underlying relationships among different factors and facilitating the analysis of the interactions among multiple factors in traffic accidents [10]. By reducing the dimensionality of the original data, complex networks can effectively solve the problem of feature redundancy and dimension disaster caused by a large number of data features. Previous studies on traffic causation analyses based on complex networks mainly focused on node metrics, without conducting in-depth analysis of the downgraded features [11,12]. However, these features hold significant research value and can be utilized to improve road traffic safety and accident collision prediction.
The innovation of this article lies in that first, after analyzing the causes of accidents based on complex networks, the most influential accident factors were identified. At the same time, these factors were used as dimensionality reduced features. Finally, a machine learning-based traffic accident injury severity classification model was constructed using dimensionality reduced features. This paper combines complex network theory with machine methods to reveal a new approach that combines complex network principles with machine learning methods. Through relevant experiments, it has been proven that this method can solve the problem of high feature dimensionality leading to longer classification time for accident injury severity. At the same time, the method proposed in this article effectively utilizes the dimensionality reduction features after accident analysis, avoiding the problem of ineffective feature utilization. The use of complex networks for accident causation analysis avoids the shortcoming of subjectivity due to traditional expert judgement. This study aims to provide a more accurate and reliable method for analyzing traffic accidents’ causes and accurately dividing the severity of accident injuries. The effective application of accident analysis results helps to improve road traffic safety and reduce the number of accidents [13].

2. Related Work

Indeed, there have been numerous scholars who have employed various methods in the field of road traffic accident cause analysis [14]. These methods range from simple statistical analysis of historical accident data to more complex analysis using multi-dimensional variable rough set, grey correlation, and other techniques. While econometric theory has been used in some studies, it has limitations in terms of data completeness and is not widely used. The use of econometric models requires high-quality data, which may not always be available, and they can be sensitive to the choice of variables and the specification of the model. Therefore, the development of data statistics and analysis is limited. In recent years, there has been an increasing interest in using complex network theory or machine learning techniques for traffic accident cause analysis. However, the large amount of redundancy or high dimensionality of the data features cause excessive training time. These methods have been applied to various fields, including ocean-going ship accidents, tunnel stability, road traffic accidents, and three-wheeled motor vehicles. However, the combination of the two approaches has not been effectively explored.
In the field of ocean-going ship accidents, Yu et al. used complex network methods to analyze the causes of accidents and identified key factors, such as ship collision, which provided theoretical support for ship navigation safety supervision and risk prevention of marine transportation systems [15]. Factors affecting tunnel stability were sorted out by Wu et al. using TOPSIS, grey correlation analysis, and other analytical methods [16]. In road traffic accidents, machine learning techniques have been widely used to predict the severity of injury. Santos et al. compared over 25 different methods and found that Random Forest was the best method for predicting the severity of injury in road traffic accidents [17]. In the domain of three-wheeled motor vehicles, Ijaz et al. proposed the use of the Decision Jungle (DJ), Random Forest (RF), and Decision Tree (DT) techniques to investigate the gravity of injuries resulting from traffic accidents, and DJ demonstrated the highest level of accuracy among the three methodologies [18]. Based on complex network theory, Zhao et al. established a new model for analyzing the causes of public urban logistics accidents, and analyzed the accidents from a global perspective, identifying the main causes [19]. Guo et al. proposed the use of the Extreme Gradient Boost (XGBoost) method to analyze the influencing factors of pedestrian traffic accidents among the elderly and identified driver characteristics, elderly characteristics, and vehicle movement as the most important factors affecting the severity of accidents [20]. Hamim et al. used a combination of Accimaps and STAMP-CAST methods, while also utilizing PCM, to analyze collision investigations at railway intersections. The combination of these methods helps to provide a comprehensive set of safety recommendations [21].
In the study of road traffic accidents, the traditional single-factor, single-type micro-level causal analysis has been replaced by a more comprehensive and multi-faceted approach [22]. This new model takes into account multiple factors and levels of analysis, including the micro and macro levels, to provide a more accurate representation of the complex relationships among various factors that contribute to accidents. The traditional fault tree model, which is a chain structure, is limited in its inability to represent inter-factor correlations and the presence of subjective factors. However, the emergence of complex networks has addressed these drawbacks to some extent. In this paper, a complex network causation model is established from a multi-factor and multi-level perspective of accident occurrence. This model takes into account the internal node indicators and extracts the features of the most influential factors [23,24,25], providing a more comprehensive understanding of the causal relationship among factors. Additionally, a classification model of accident injury severity based on machine learning is constructed to enhance the safety and stability of road traffic passage. The findings offer an effective approach for the safety enhancement of transport networks.

3. Methodology

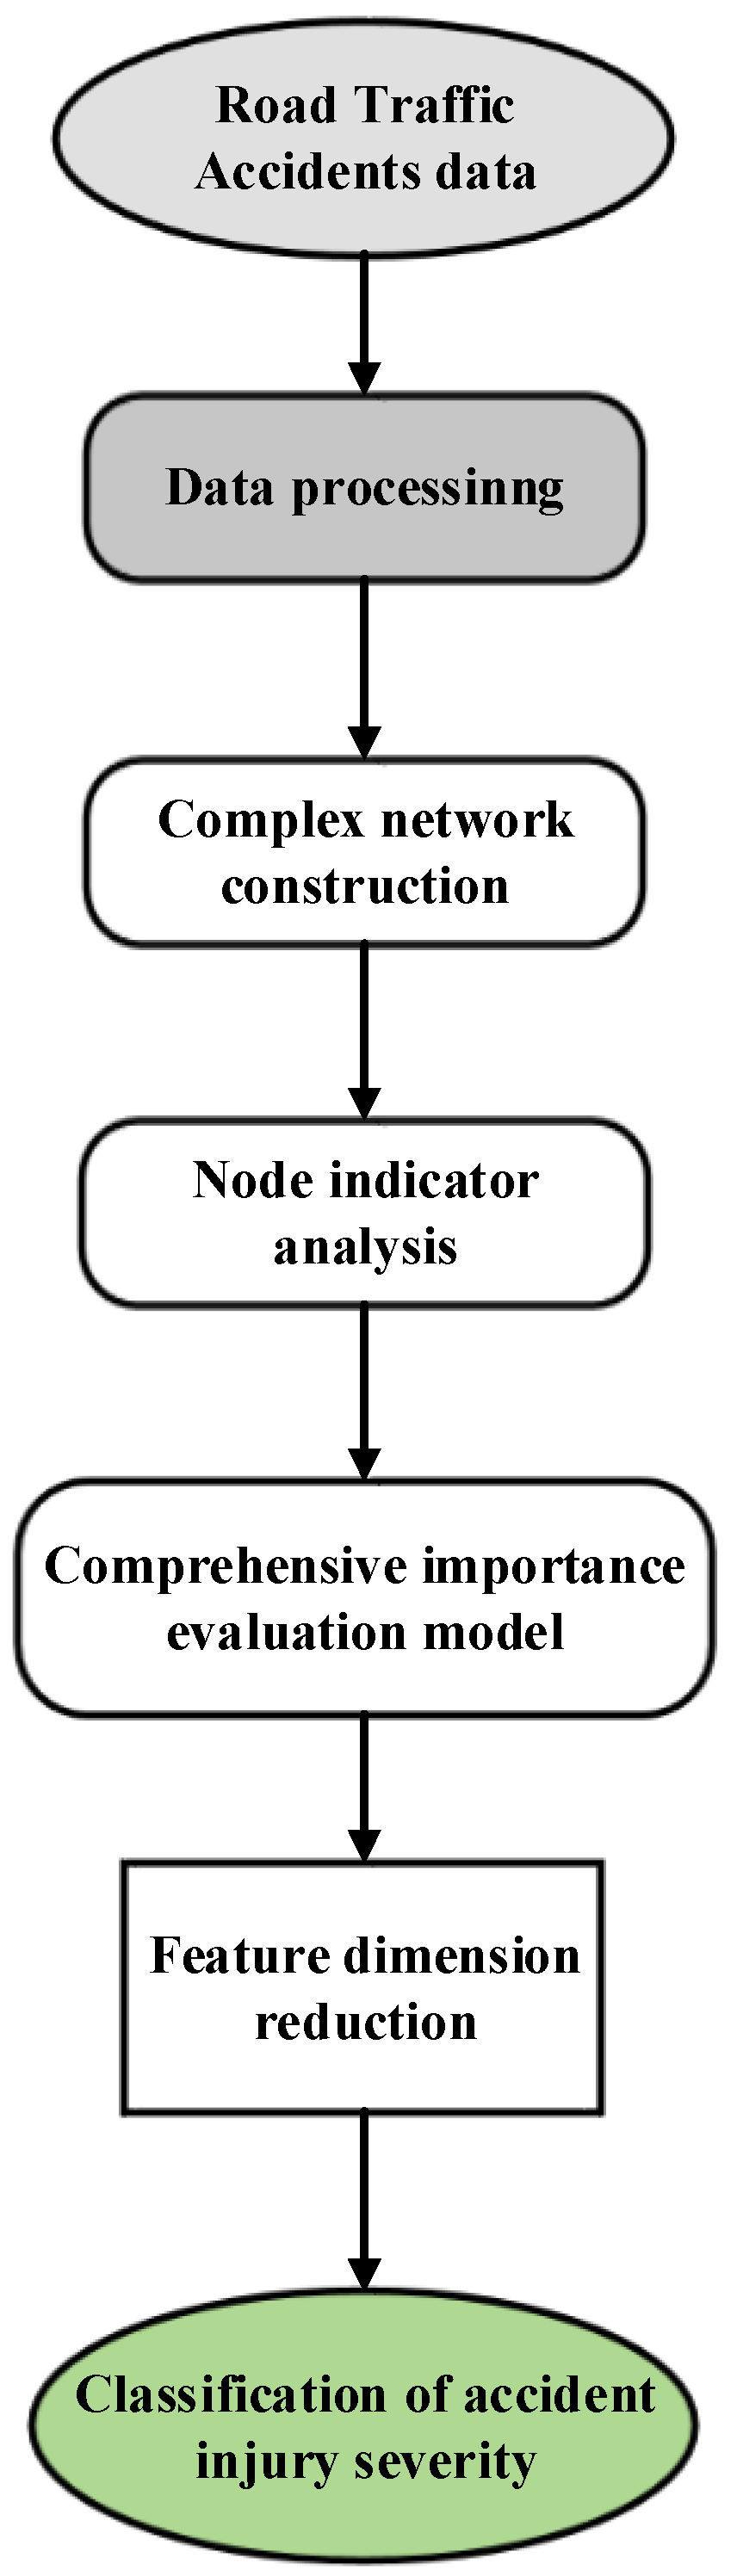
3.1. A Framework for Analyzing the Causes of Road Traffic Accidents and Classifying Accidents Based on Complex Networks

Complex networks offer a powerful approach for analyzing the causes of accidents [26]. By analyzing the structure and indicators of complex networks, the triggering factors of traffic accidents can be better understood and analyzed. Using complex network theory to analyze the correlations among various types of indicators, it is possible to reduce high-dimensional features to low-dimensional features while the importance of the feature variables remains the same. Machine learning algorithms learn the mapping relationships among various feature variables in a dataset to achieve classification [27]. The combination of complex networks and machine learning can effectively analyze the most influential factors of road traffic accidents and construct accident injury severity classification models. It provides a new idea for realizing the method of combining complex network theory and machine learning. The occurrence of accidents is inevitably linked to many factors, including time, environment, and traffic management factors [28,29]. The occurrence of accidents is inevitably linked to one or more factors; the use of complex network theory to extract the importance of accident factors is conducive to the analysis of the most influential factors, so as to build the classification model of the severity of injuries in road traffic accidents according to the most influential factors [30,31]. The framework for analyzing the causes of road traffic accidents and classifying accidents based on complex networks is shown in Figure 1.

3.2. The Construction of Complex Networks

In this method, the feature vectors of the original dataset are used as the nodes of the complex network, and the relationships among the feature vectors are used as the edges of the complex network to construct the complex network [32,33]. The construction process is shown as follows:
(1) According to the co-occurrence frequency between the feature vectors in the dataset, the co-occurrence matrix A 1 is constructed. The formula is shown as follows:
A 1 = m i j
where m i j denotes the number of nodes i and j appearing at the same time. i, j ∈ 0~N, N denotes the number of nodes in the network.
(2) According to the co-occurrence matrix A 1 , the adjacency matrix A 2 is constructed. The formula is shown as follows:
A 2 = n i j
where: n i j = 1 , T h e r e   i s   a   c o - o c c u r r e n c e   r e l a t i o n s h i p   b e t w e e n   n o d e   i   a n d   n o d e   j 0 , T h e r e   i s   n o   c o - o c c u r r e n c e   r e l a t i o n s h i p   b e t w e e n   n o d e   i   a n d   n o d e   j .
(3) According to A 1 and A 2 , the Jaccard index matrix A 3 is constructed. The Jaccard index is the co-occurrence rate between two nodes. The expression of the co-occurrence rate is shown as follows:
J ij = m ij m i + m j m ij
where J ij is the co-occurrence rate of node i and node j, which is the degree of correlation, ranging from 0 to 1. m i and m j are the occurrence frequency between nodes i and j. The above A 1 , A 2 , and A 3 are symmetric matrices.
The target matrix is entered into the Gephi platform and adjusted to form a complex network model using uniform layout. At the same time, the weights of nodes and edges are assigned accordingly.

3.3. Complex Network Evaluation Index

The node evaluation index in complex networks is a specific representation of the topological relationship between nodes and edges in the network. Accurate analysis of the evaluation index can provide a better understanding of the characteristics of the network and the interaction between nodes [34]. In this paper, seven characteristic parameters, namely, degree of node, network diameter, average path length, clustering coefficient, intermediary centrality, closeness centrality, and comprehensive importance evaluation were selected as node indexes of complex networks for analysis, which can be seen in Table 1.
(1) Degree of node D i , which represents the number of edges by which the node is connected to other nodes. The higher the degree of the node, the more significant the node is [35]. The calculation formula is shown as follows:
D i = j N e ij
where D i denotes the degree of a node and N denotes the number of nodes in the network, respectively. e ij is the number of edges between nodes i and j.
(2) Network diameter S, which represents the maximum distance between any two nodes in the network.
The calculation formula is shown as follows:
S =   max   i , j N ( d ij )
where d ij denotes the distance between nodes i and j, which is expressed as d ij = x i x j 2 + y i y j 2 .
(3) Average path length L, which indicates the average value of the distance between any two nodes in the network. The calculation formula is shown as follows:
L = i j d ij 1 2 N ( N 1 )
(4) Clustering coefficient C i . It indicates the probability that two nodes adjacent to node i in the network are also adjacent, reflecting the level of clustering of nodes in the network. The larger the clustering coefficient, the closer the connection between nodes is [36]. The calculation formula is shown as follows:
C i = 2 E ( i ) D i ( D i 1 )
where E ( i ) denotes the number of edges that actually exist between node i and adjacent nodes.
(5) Intermediary centrality B i . It refers to the shortest path number passing through the node, emphasizing the adjustment ability and transit function of the node between other nodes. Its normalized expression can be seen as follows:
B i = 2 s i t N l s , t ( i ) l s , t ( N 1 ) ( N 2 )
where l s , t is the number of shortest paths between nodes s and t, and l s , t ( i ) is the number of shortest paths passing through node i between nodes s and t. Nodes i, j, s, and t denote any node in a complex network, and denote four independent nodes.
(6) Closeness centrality M i , which represents the proximity of nodes in the network to other nodes [37]. The normalized expression is shown as follows:
M i = y d ( y , x ) N 1 1
where y d ( y , x ) is the sum of the distances from node i to all other nodes in the network.

3.4. Construction of a Comprehensive Importance Evaluation Model

The node index in complex networks can provide valuable insights into the relationships among nodes. However, evaluating the importance of node indicators from a single perspective has limitations. Therefore, a comprehensive importance evaluation model of complex networks was constructed to consider the importance of nodes from a global perspective. To achieve this, the four indexes of node degree, clustering coefficient, intermediary centrality, and closeness centrality were selected to construct a comprehensive importance evaluation model. The comprehensive importance is represented by the O value, which reflect the node’s overall influence, indicating its relative importance in the network. In other words, a node with a larger O value has a greater impact on the network’s function. The construction process of the model is shown as follows:
(1) When there are m nodes in the complex network and each node has n feature indexes, the feature index matrix Y is constructed as follows:
Y = y 11 y 1 n y m 1 y mn
where y mn denotes the n-th index of the m-th node.
(2) The values of the above characteristic indicators differ significantly; to ensure the reliability of the data and to mitigate the influence of these values on the results, the above characteristic index matrix Y is normalized. The normalized calculation formula is shown as follows:
Z mn = y mn y min y max y min
where Z mn is the element in the normalized matrix. y max and y min denote the largest and smallest element in Y, respectively.
The normalized matrix is represented by Z as follows:
Z = z ij = 1 m Z 11 Z 1 n Z m 1 Z mn
(3) Calculate the distance D i + and D i of each metric of the complex network from the positive and negative ideal solutions, respectively. The calculation formula is shown as follows:
D i + = n j = 1 z ij Z j + 2
D i = n j = 1 z ij Z j 2
where, Z j + = max Z 1 i , Z 2 i , Z 3 i , , Z mi ;   Z j = min Z 1 i , Z 2 i , Z 3 i , , Z mi . D i + denotes the distance between any index and Z j + , and D i denotes the distance between any index and Z j . z ij denotes the elements in the normalized matrix Z.
(4) Construct a comprehensive importance evaluation model for complex networks. O i denotes the comprehensive importance of node i. It can be expressed by the following expression:
O i = D i D i + + D i

3.5. Construction of an Accident Injury Severity Classification Model

To evaluate the comprehensive importance of nodes in a network, we first constructed a comprehensive importance evaluation model based on the four characteristic indicators. Afterwards, we screened out features with higher overall importance and removed unimportant features to reduce the dimensionality of data features. Finally, a classification model of accident injury severity was constructed based on the features after dimensionality reduction, and we evaluated the model’s performance using precision rate, recall rate, F1-score value and ROC (receiver operating characteristic curve) as evaluation indicators. At the same time, we conducted sensitivity testing on the classification model. Four models from the machine learning algorithm were selected to construct the traffic accident injury severity classification model. They are Extreme Gradient Boosting (XGBoost), Logistic Regression (LR), Random Forest (RF), and Decision Tree (DT). The use of machine learning algorithms can accurately classify the severity of traffic accident injuries, and after complex network dimensionality reduction, the training process will shorten the training time. The model construction process and evaluation index formula are shown as follows:
y i = F ( x i )
where F(x) represents different classification models. x i and y i denote the reduced dimensional inputs of different models and their corresponding classification results, respectively.
Precision:
P = TP TP + FP
where P represents the precision rate, which means the probability of actually positive samples in all predicted positive samples. TP and FP denote the number of positive and negative classes predicted to be positive classes, respectively.
Recall:
R = TP TP + FN
where R represents the recall rate, which is the probability predicted as a positive sample in the actual positive sample. FN denotes False Negative Class and indicates the number of positive classes predicted as negative classes.
F1-score:
F 1 = 2 ( P × R ) ( P + R )
where F1 represents the harmonic mean of precision and recall. P and R represent the precision and recall rate, respectively.
ROC uses FPR (specificity) as the abscissa and TPR (sensitivity) as the ordinate to evaluate the performance of the classification model. When the ROC curves of multiple models are in the same plane, the closer the ROC curve to the upper left corner, the better the performance of the model. The AUC value represents the area of the graph surrounded by the abscissa and ordinate below the ROC curve, ranging from 0 to 1. The closer the AUC value is to 1, the better the performance of the model.

4. Case Studies

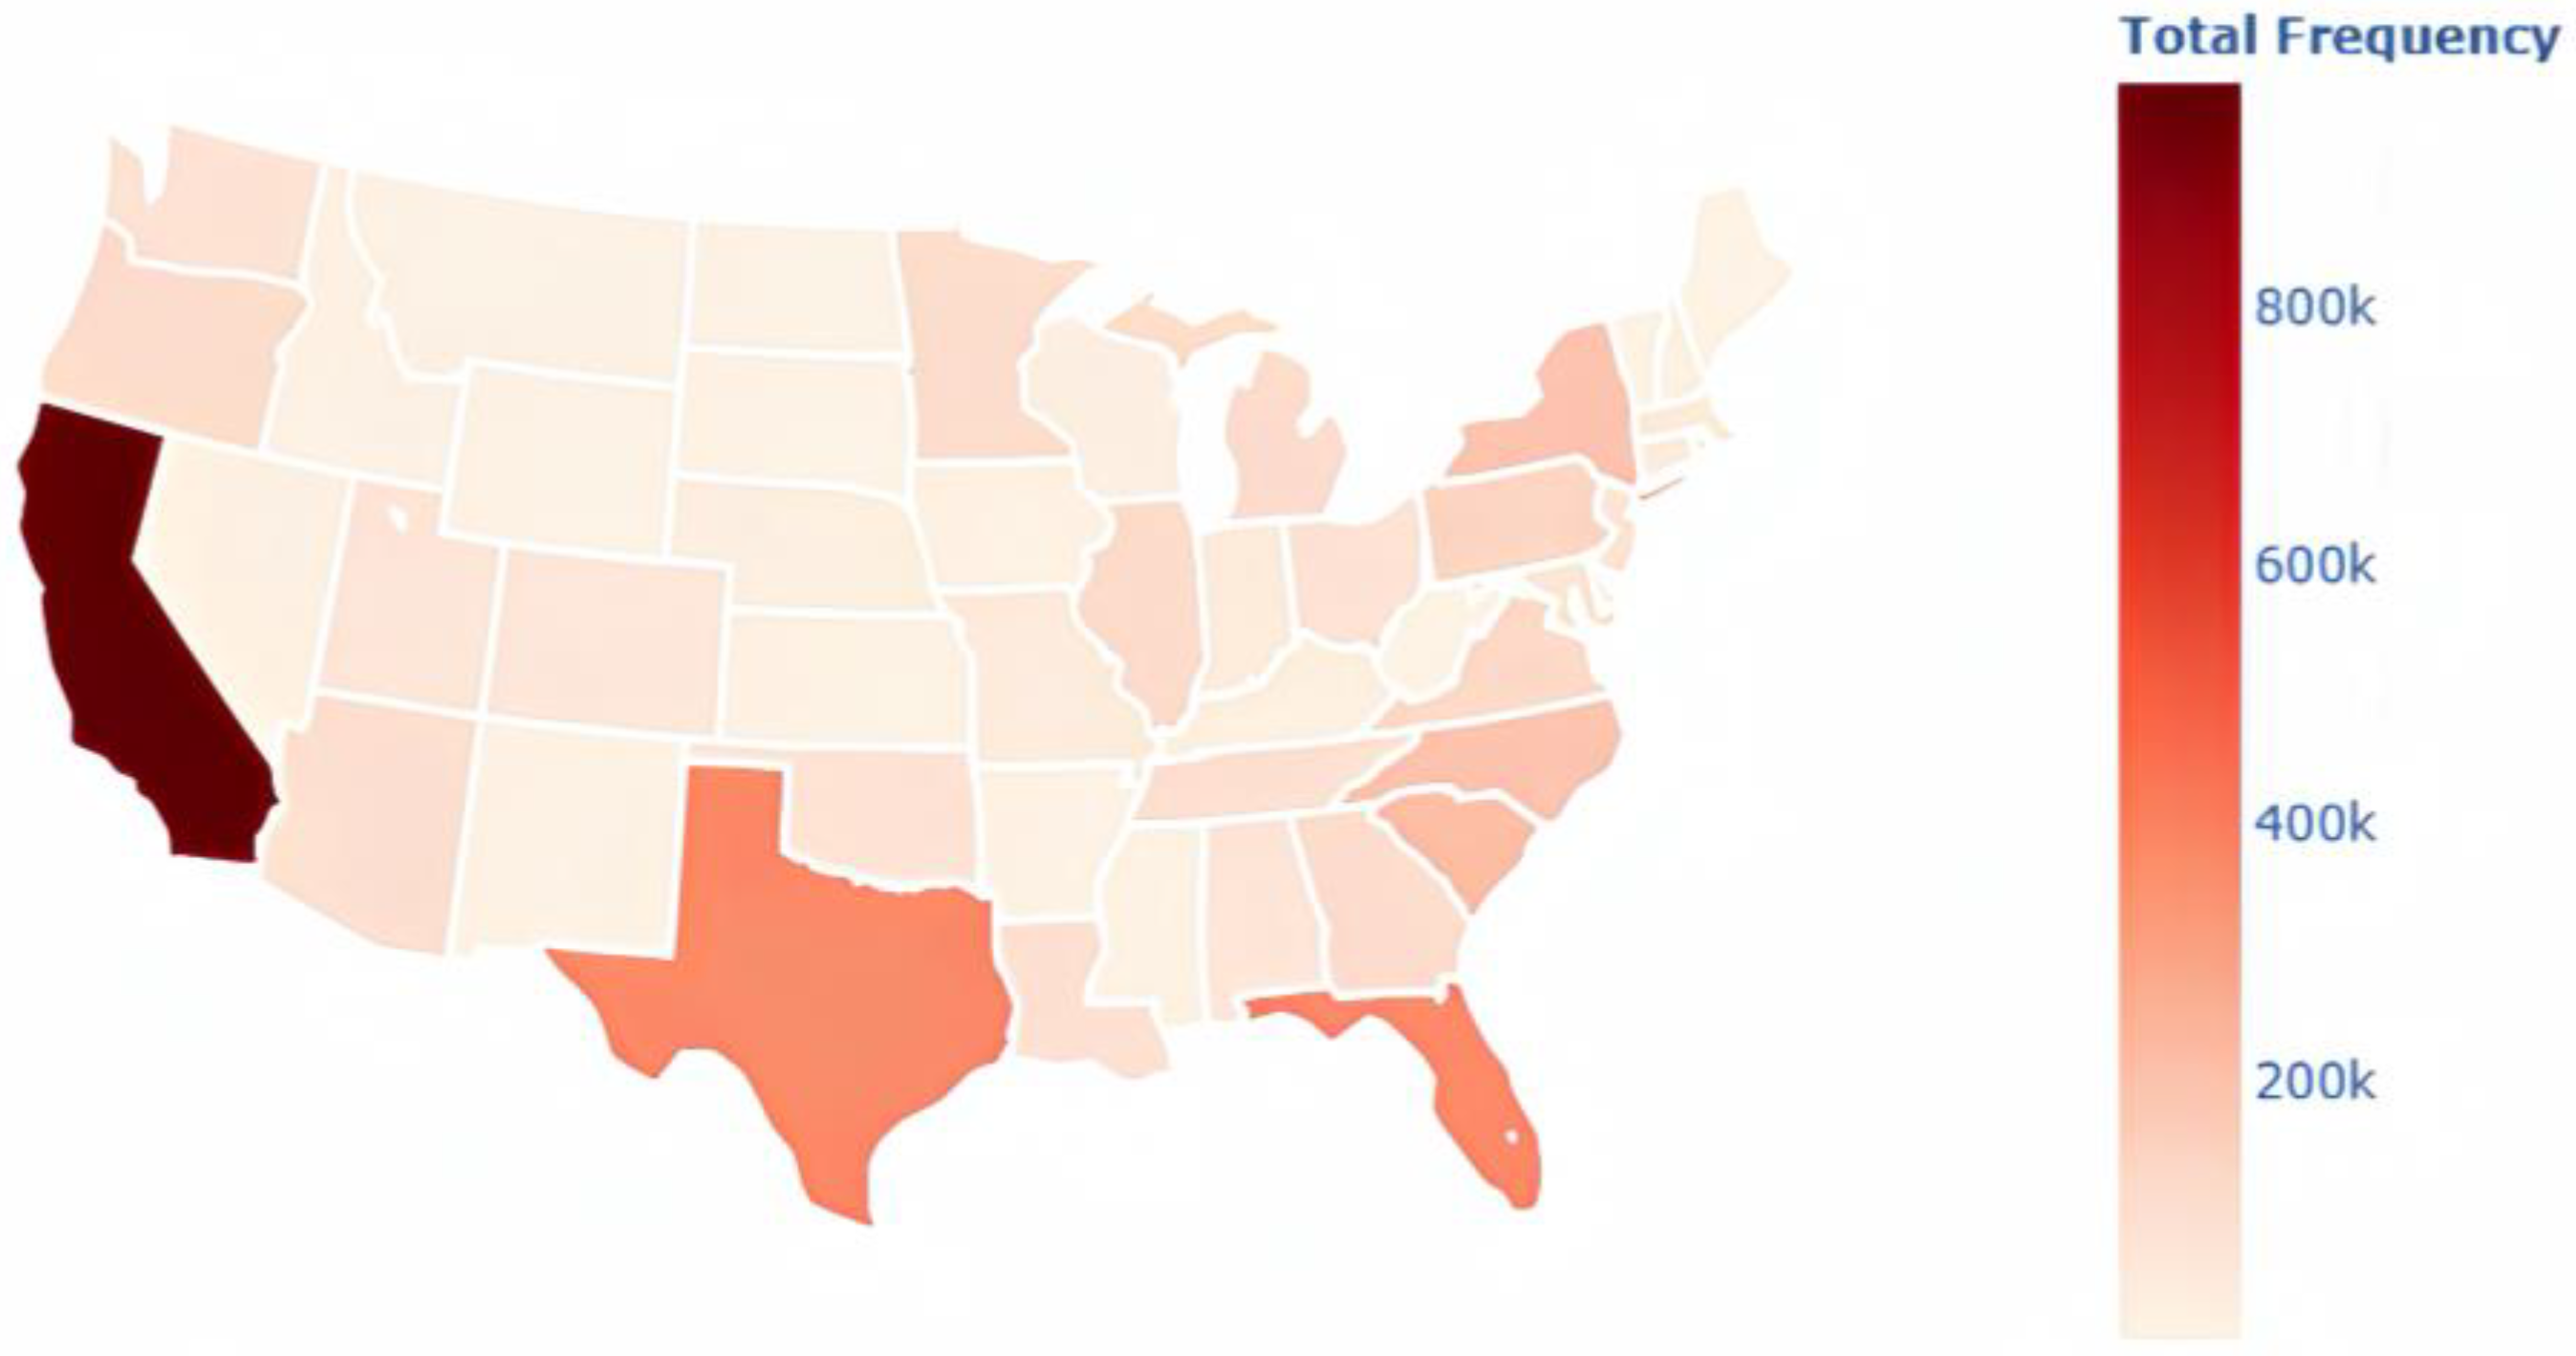
4.1. Data Preparation and Analysis

The case data used in this paper are derived from the National Traffic Accidents Data Set, which covers 49 states in the United States from 2016 to 2023 and uses several APIs that provide streaming traffic accident data. Figure 2 shows the current data distribution over all the states. These APIs broadcast traffic data collected by a variety of entities, including U.S. and state departments of transportation, law enforcement agencies, traffic cameras, and traffic sensors on the roadway network [38,39].
From Figure 2, it can be seen that the higher frequency of accidents is located on the west coast, and in the south and southeast of the United States, such as California, Texas, and Florida, while the regions with lower frequency of accidents are located in the central and eastern regions of the United States, such as Wyoming, South Dakota, and North Dakota. After deleting null values and outliers, a total of 1,014,682 valid accident data were obtained. We combined the same influences and similar influences. Finally, 47 influencing factors of road traffic accidents were selected, as shown in Table 2. The 47 influencing factors were grouped into three categories, namely, time factors, environmental factors, and traffic management factors. These factors included the time of day, day of the week, and season in which the accidents occurred, the range of road lengths affected by the accidents, the relative location of the road where the accidents occurred, the ambient temperature, humidity, and visibility at the time of the accidents, and the weather at the time of the accidents, road conditions in the vicinity of the accidents, for example the presence conditions of intersections, speed humps, speed signs, railways, road safety measures, stations, and stop signs.
The current accident dataset was classified for injury severity based on the U.S. road traffic accident injury severity classification standard KABCO. Among them, K represents dead, A represents incapacitating injury, B represents non-incapacitating injury, C represents possible injury, and O represents no injury [40]. Based on the data used in this paper, deaths are categorized as Major accidents; incapacitating injuries and non-incapacitating injuries are categorized as Serious accidents; and possible injuries and no injuries are categorized as Ordinary accidents. The severity of injuries as shown in Table 3.

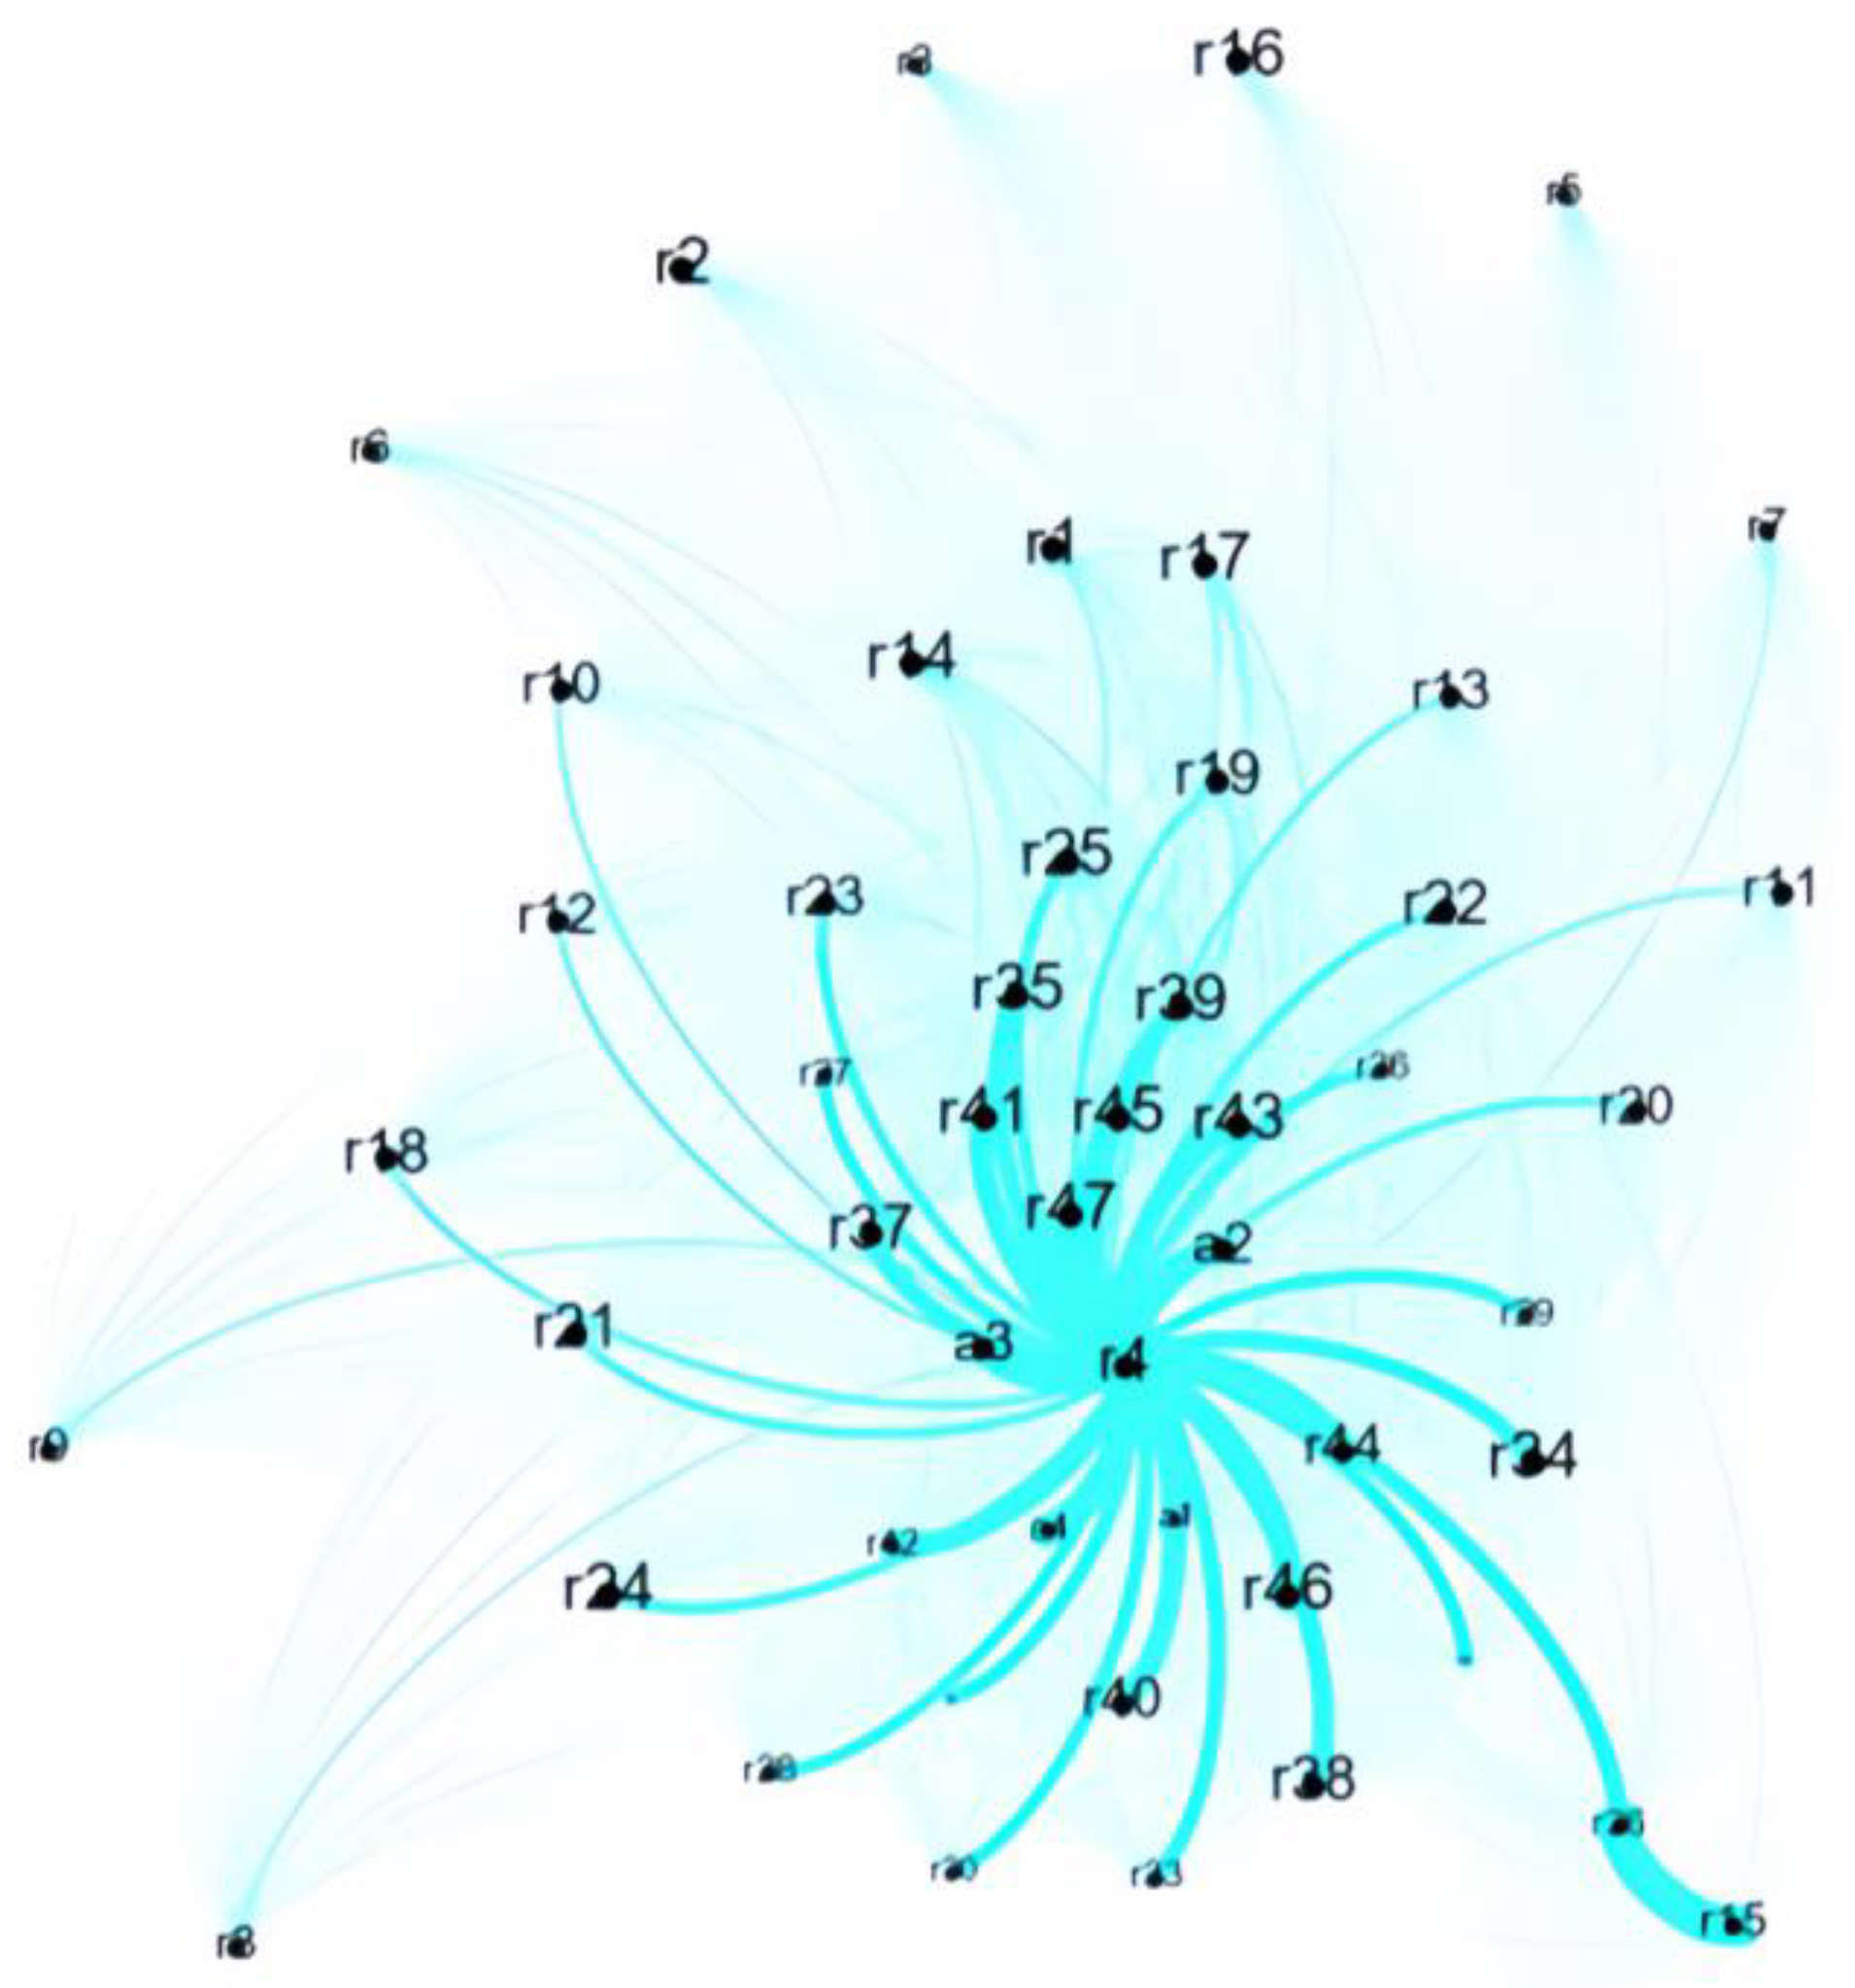
4.2. The Construction of a Road Traffic Accident Cause Analysis Network

Taking the accidents’ influencing factors and the severity of injury as nodes in the network, the relationships among influencing factors and the relationship between influencing factors and injury severity are regarded as the edge of the network. The steps are shown as follows:
(1) The co-occurrence matrix A 1 is constructed as follows:
A 1 = r 1 r 2 r 3 a 2 a 3 r 1 0 0 128,441 233,527 2324 r 2 0 0 47,639 96,820 1462 r 3 128,441 47,639 0 52,903 614 a 2 233,527 96,820 52,903 0 0 a 3 2324 1462 614 0 0
where r 1 ~ r 47 represents the influencing factors of the accidents. a 1 ~ a 3 represent the severity of injury in the accidents.
(2) According to the co-occurrence matrix A 1 , the adjacency matrix A 2 is constructed as follows [41]. If there is a co-occurrence relationship between influencing factors and between influencing factors and injury severity, it is marked as 1, and if there is no co-occurrence relationship, it is marked as 0.
A 2 = r 1 r 2 r 3 a 2 a 3 r 1 0 0 1 1 1 r 2 0 0 1 1 1 r 3 1 1 0 1 1 a 2 1 1 1 0 0 a 3 1 1 1 0 0
(3) A Jaccard index matrix is constructed by A 1 and A 2 to describe the degree of correlation between nodes. The higher the co-occurrence rate, the higher the degree of association between the two nodes [42]. The Jaccard index matrix A 3 is shown below.
A 3 = r 1 r 2 r 3 a 2 a 3 r 1 0.000 0.000 0.164 0.280 0.003 r 2 0.000 0.000 0.118 0.190 0.005 r 3 0.164 0.118 0.000 0.117 0.003 a 2 0.280 0.190 0.117 0.000 0.000 a 3 0.003 0.005 0.003 0.000 0.000
The complex network model for analyzing the causes of road traffic accidents is shown in Figure 3. The size of each node represents the relative weight. The larger the node, the more significant the factor it represents, while the thicker the edge, the stronger the connection between the two nodes. In this study, we simplify the complex network to an undirected network, focusing on the relationship between the nodes rather than the directions of causality [43].

4.3. The Evaluation Index of the Road Traffic Accident Cause Analysis Network

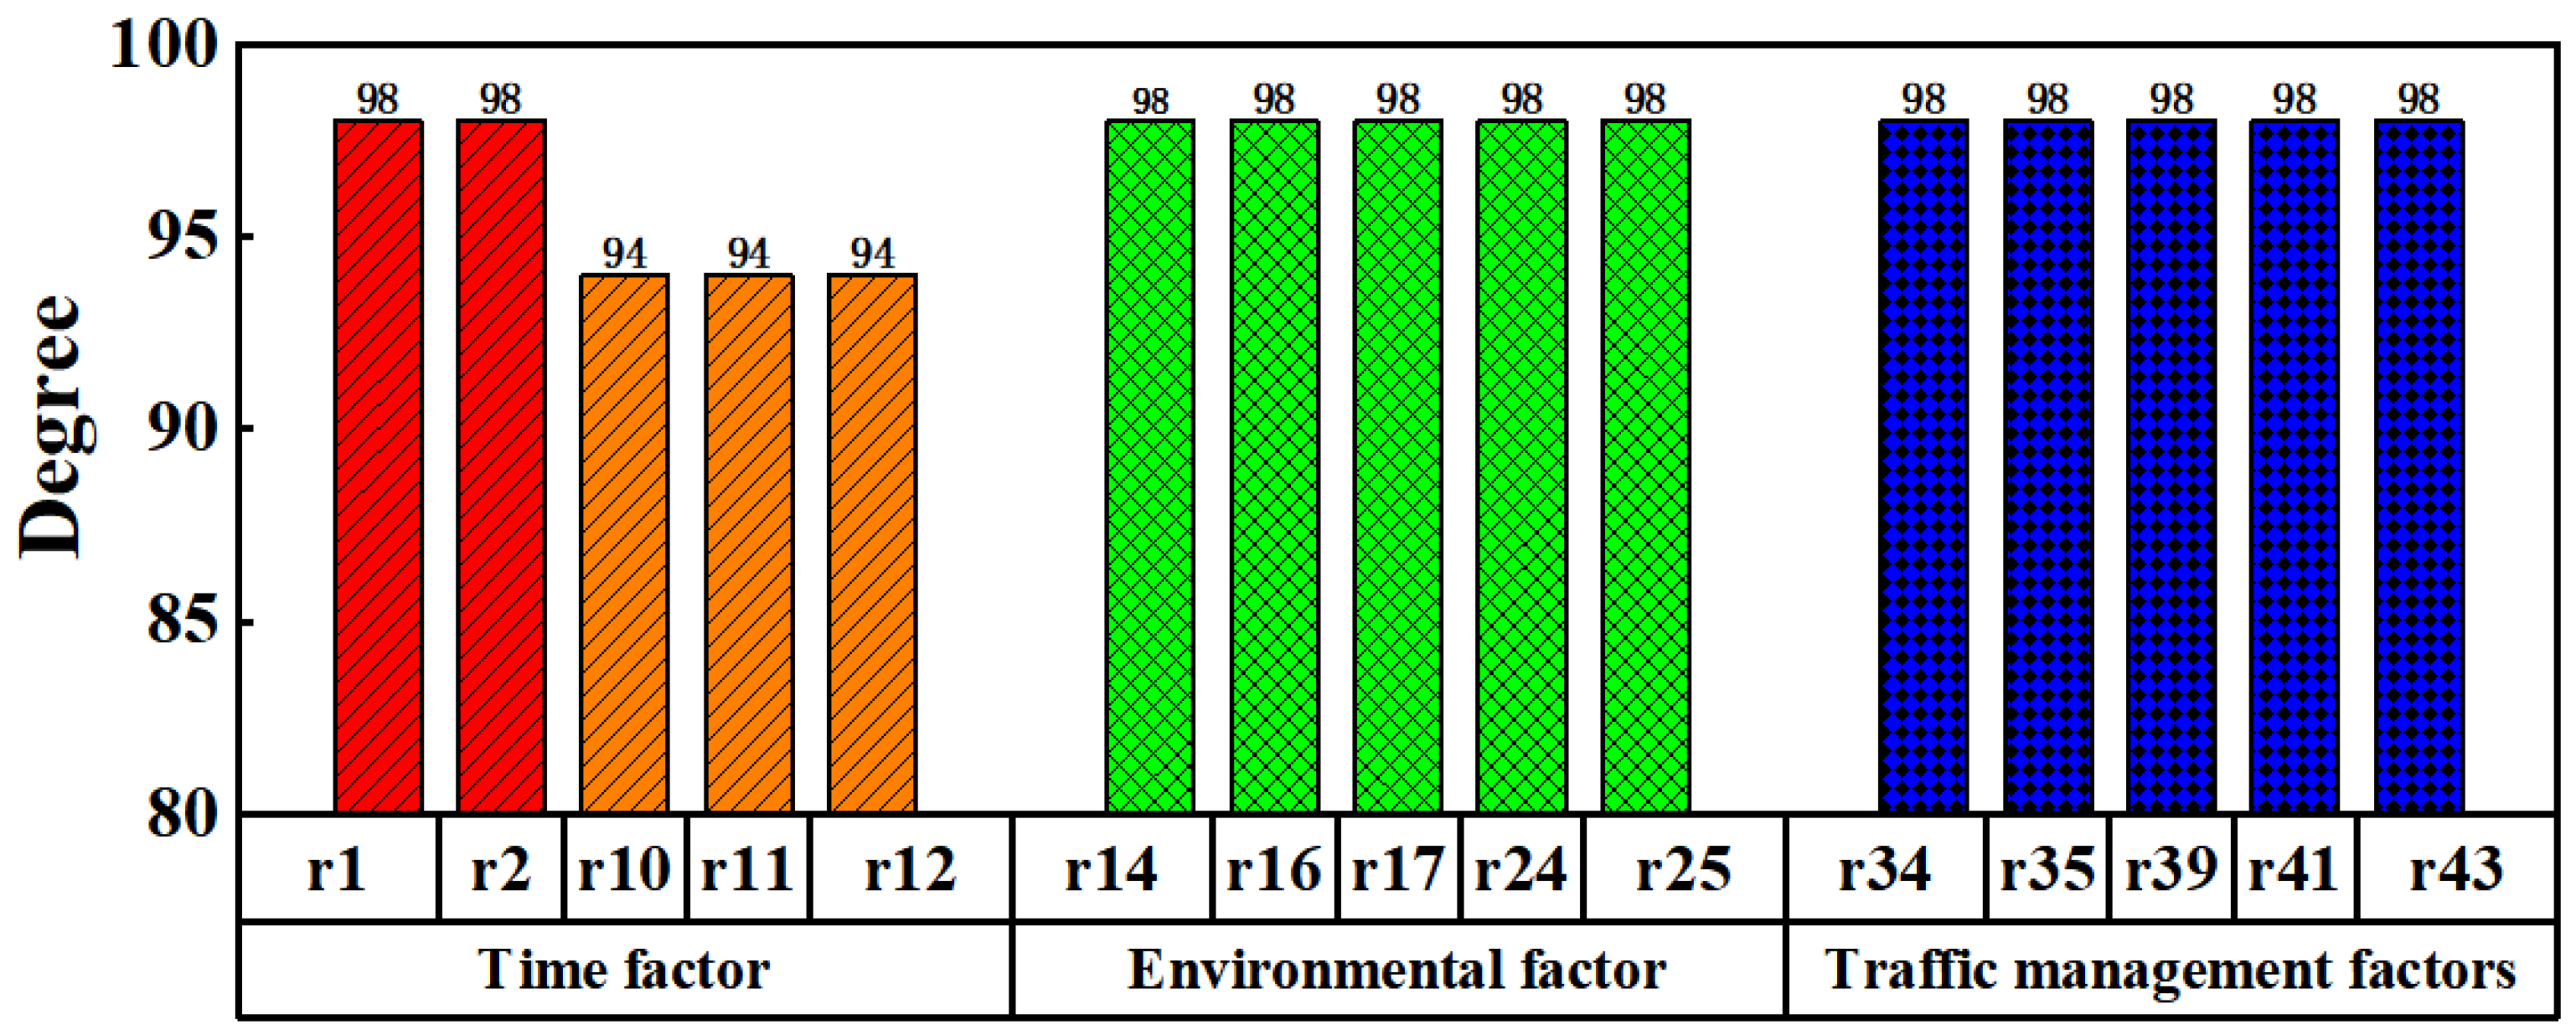
4.3.1. The Degree of Node of Network

To investigate the influence of different factors, the top five highest degrees of node values in each factor stratum were selected, as shown in Figure 4.
As demonstrated in Figure 4, the degrees of the nodes of daytime, nighttime, and seasonal factors are predominant among the time factors. In terms of environmental factors, the shorter length of road impacted by the accidents, the relative accident location, and the visibility are significant. Finally, the presence of intersections, speed reduction signs, railways, and safety measures in the vicinity of the accidents are relatively significant among the traffic management factors.

4.3.2. Network Diameter and Average Path Length

The diameter of the road traffic accident cause analysis network is 2, indicating that the shortest distance between any two points in the network is 2. The average path length of 1.07686 means that nodes can interact with each other in an average of 1 step. It indicates that the connectivity paths between individual nodes in this network are short. Therefore, the key is to improve road traffic safety to quickly cut off the connected path in the network, or to stop the next node from acting before one node acts.

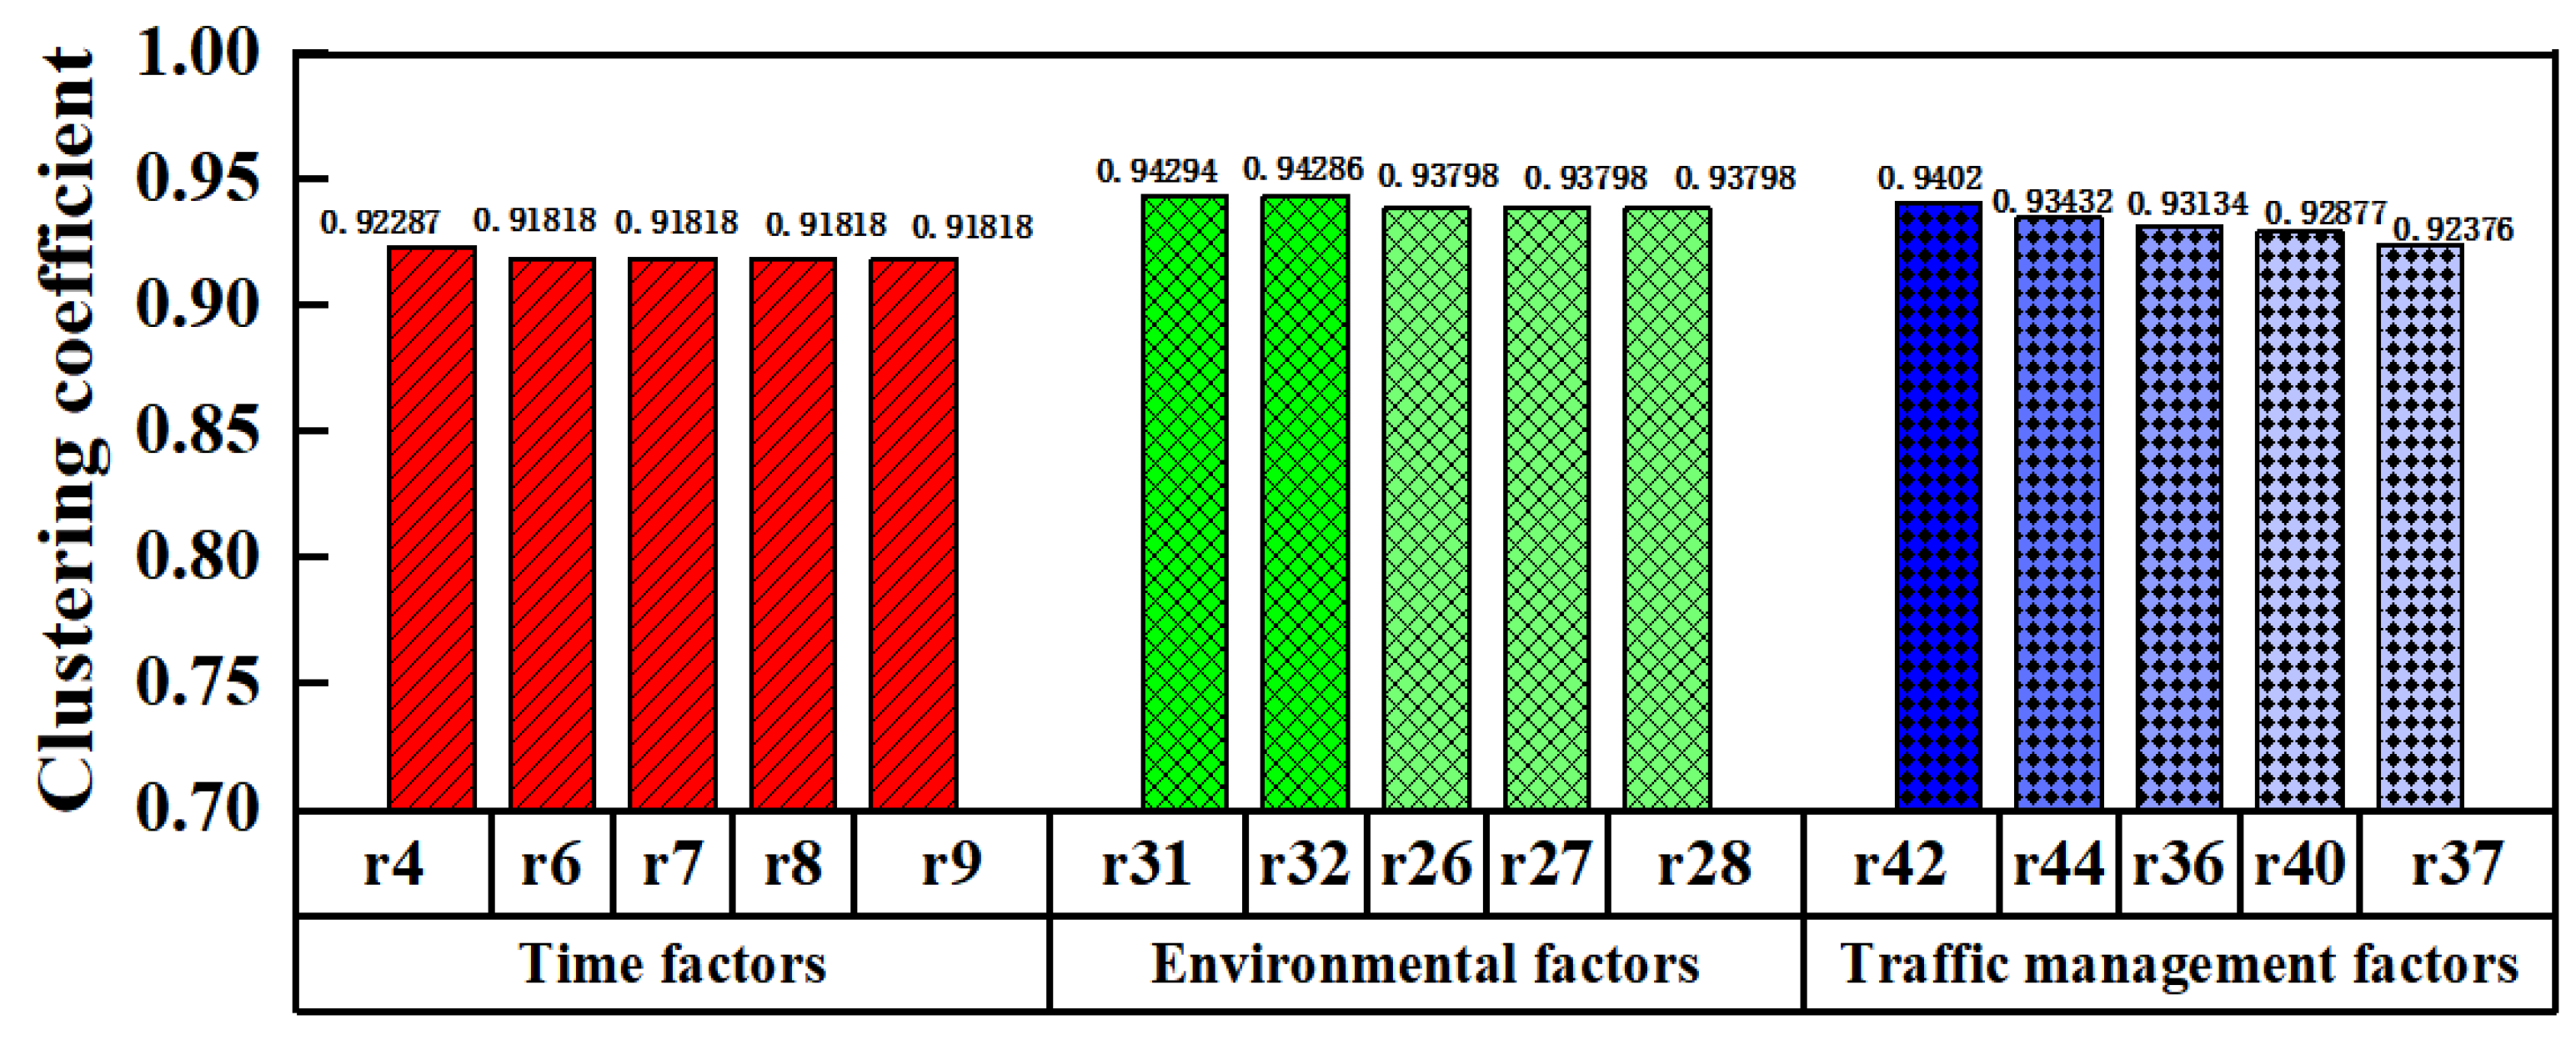
4.3.3. The Clustering Coefficient of the Network

After calculating the clustering coefficient of each node, the average clustering coefficient of the road traffic accident causation network is 0.92. The larger the clustering coefficient, the closer the connection between nodes is. The top five nodes with the highest clustering coefficients based on the influence of factor layer are shown in Figure 5.
From the perspective of the time factor, the clustering coefficient on Tuesday, Thursday, Friday, Saturday, and Sunday is higher. In terms of environmental factors, the clustering coefficient is higher for severe weather such as sandstorms and hailstone, as well as clear sky and cloudy and foggy sky. In terms of traffic management factors, the presence of road safety measures, stations, and speed bumps was highly correlated with other accident factors.

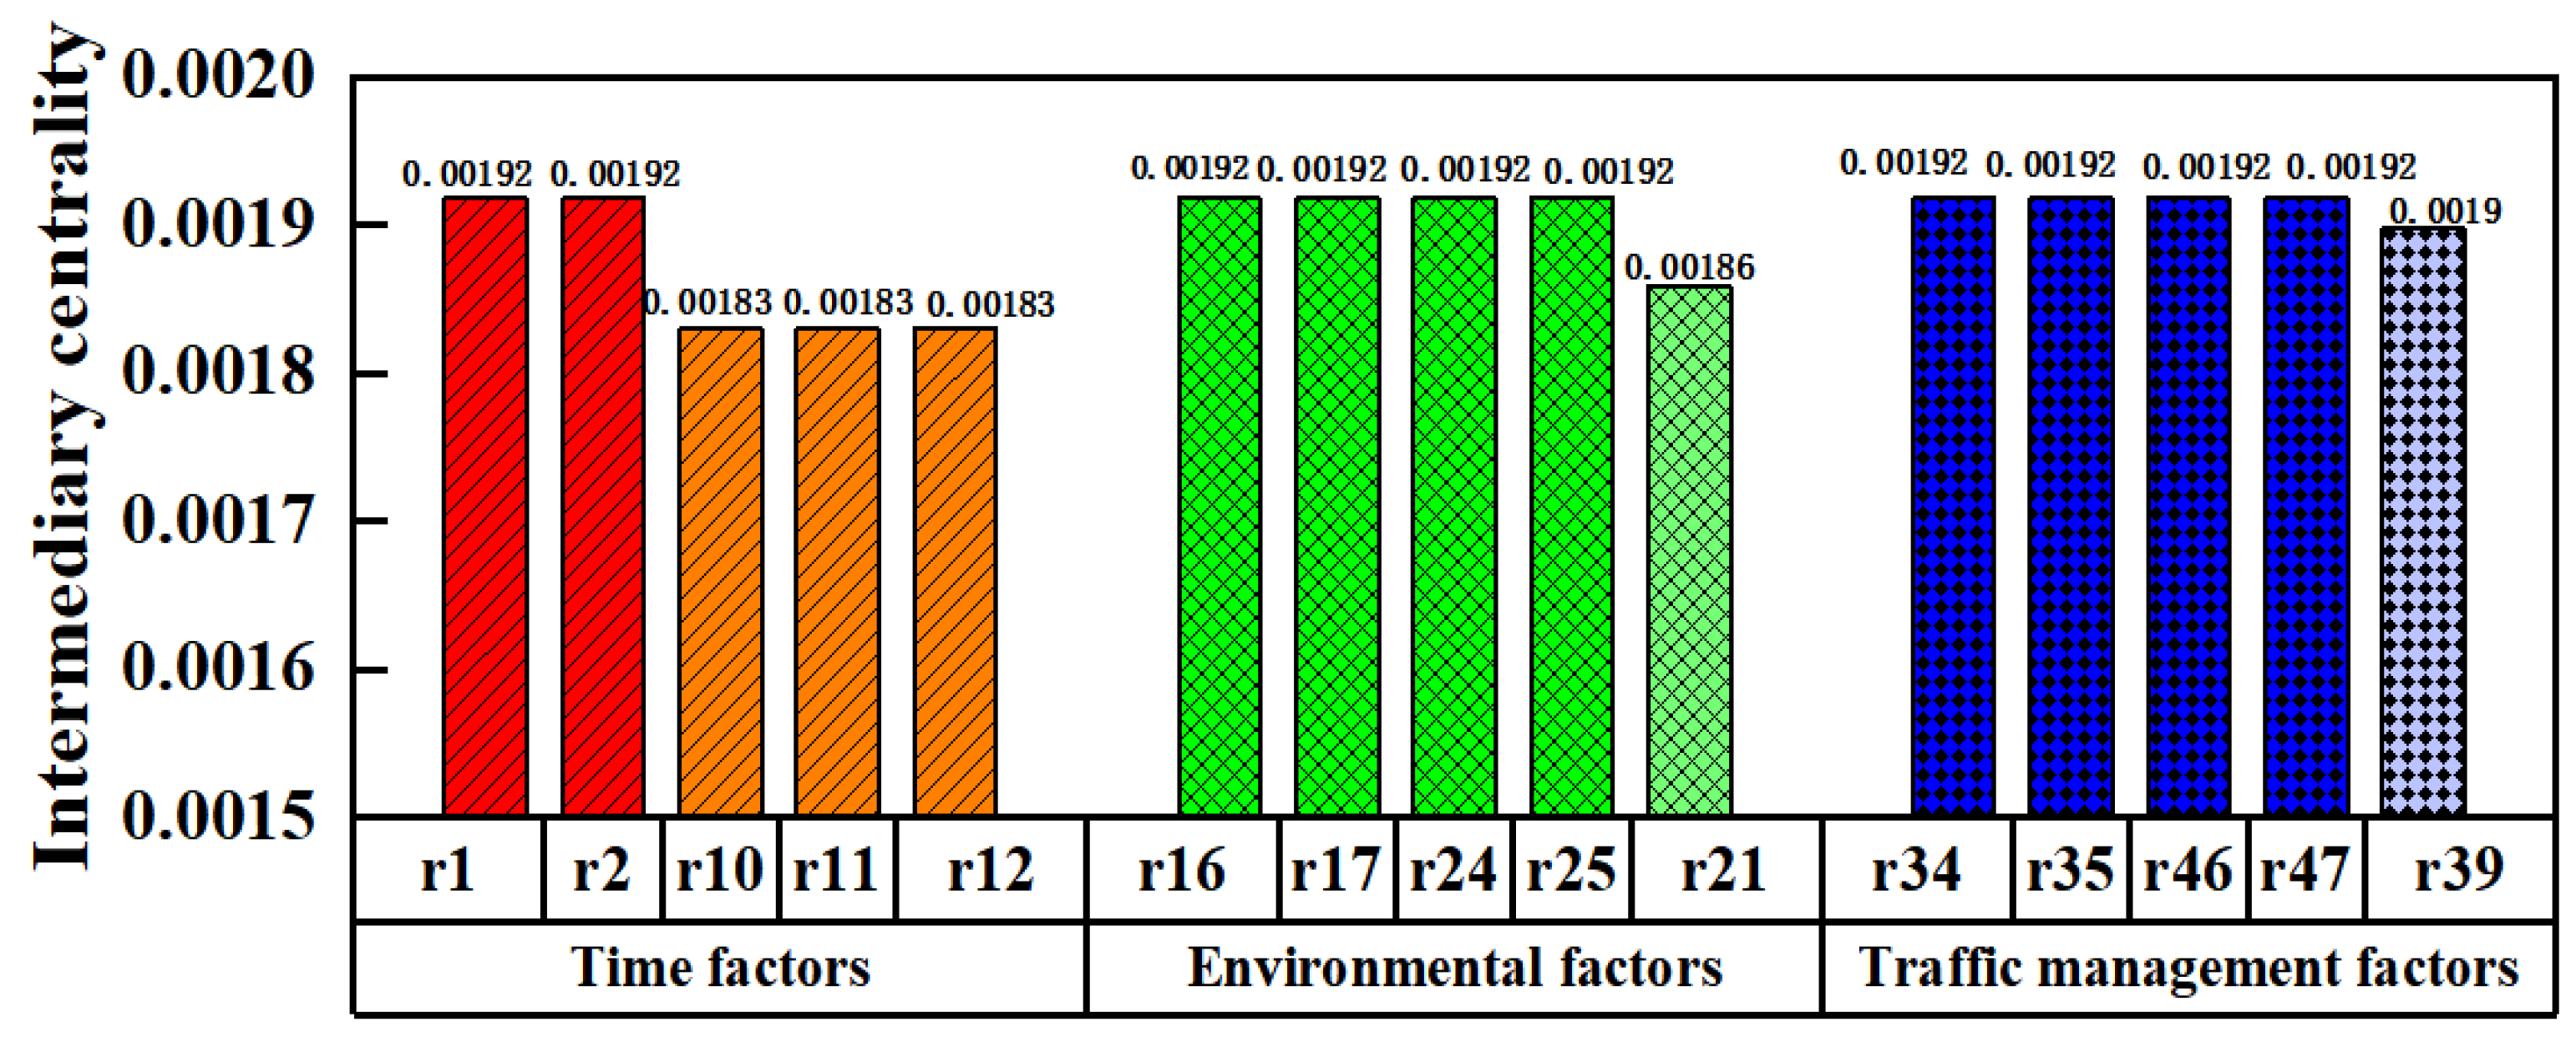
4.3.4. The Intermediary Centrality of the Network

The intermediary centrality of a complex network represents the adjustment ability and transit role of the node between other nodes. The top five highest node intermediary centrality in each factor stratum were selected as shown in Figure 6.
From Figure 6, it appears that the day, night, and season hold a high level of intermediary centrality in terms of time factors. With respect to environmental factors, the intermediary centrality of environmental humidity and visibility during accidents is high. Among traffic management factors, intersections, stop signs, and no deceleration signs have a high degree of intermediary centrality.

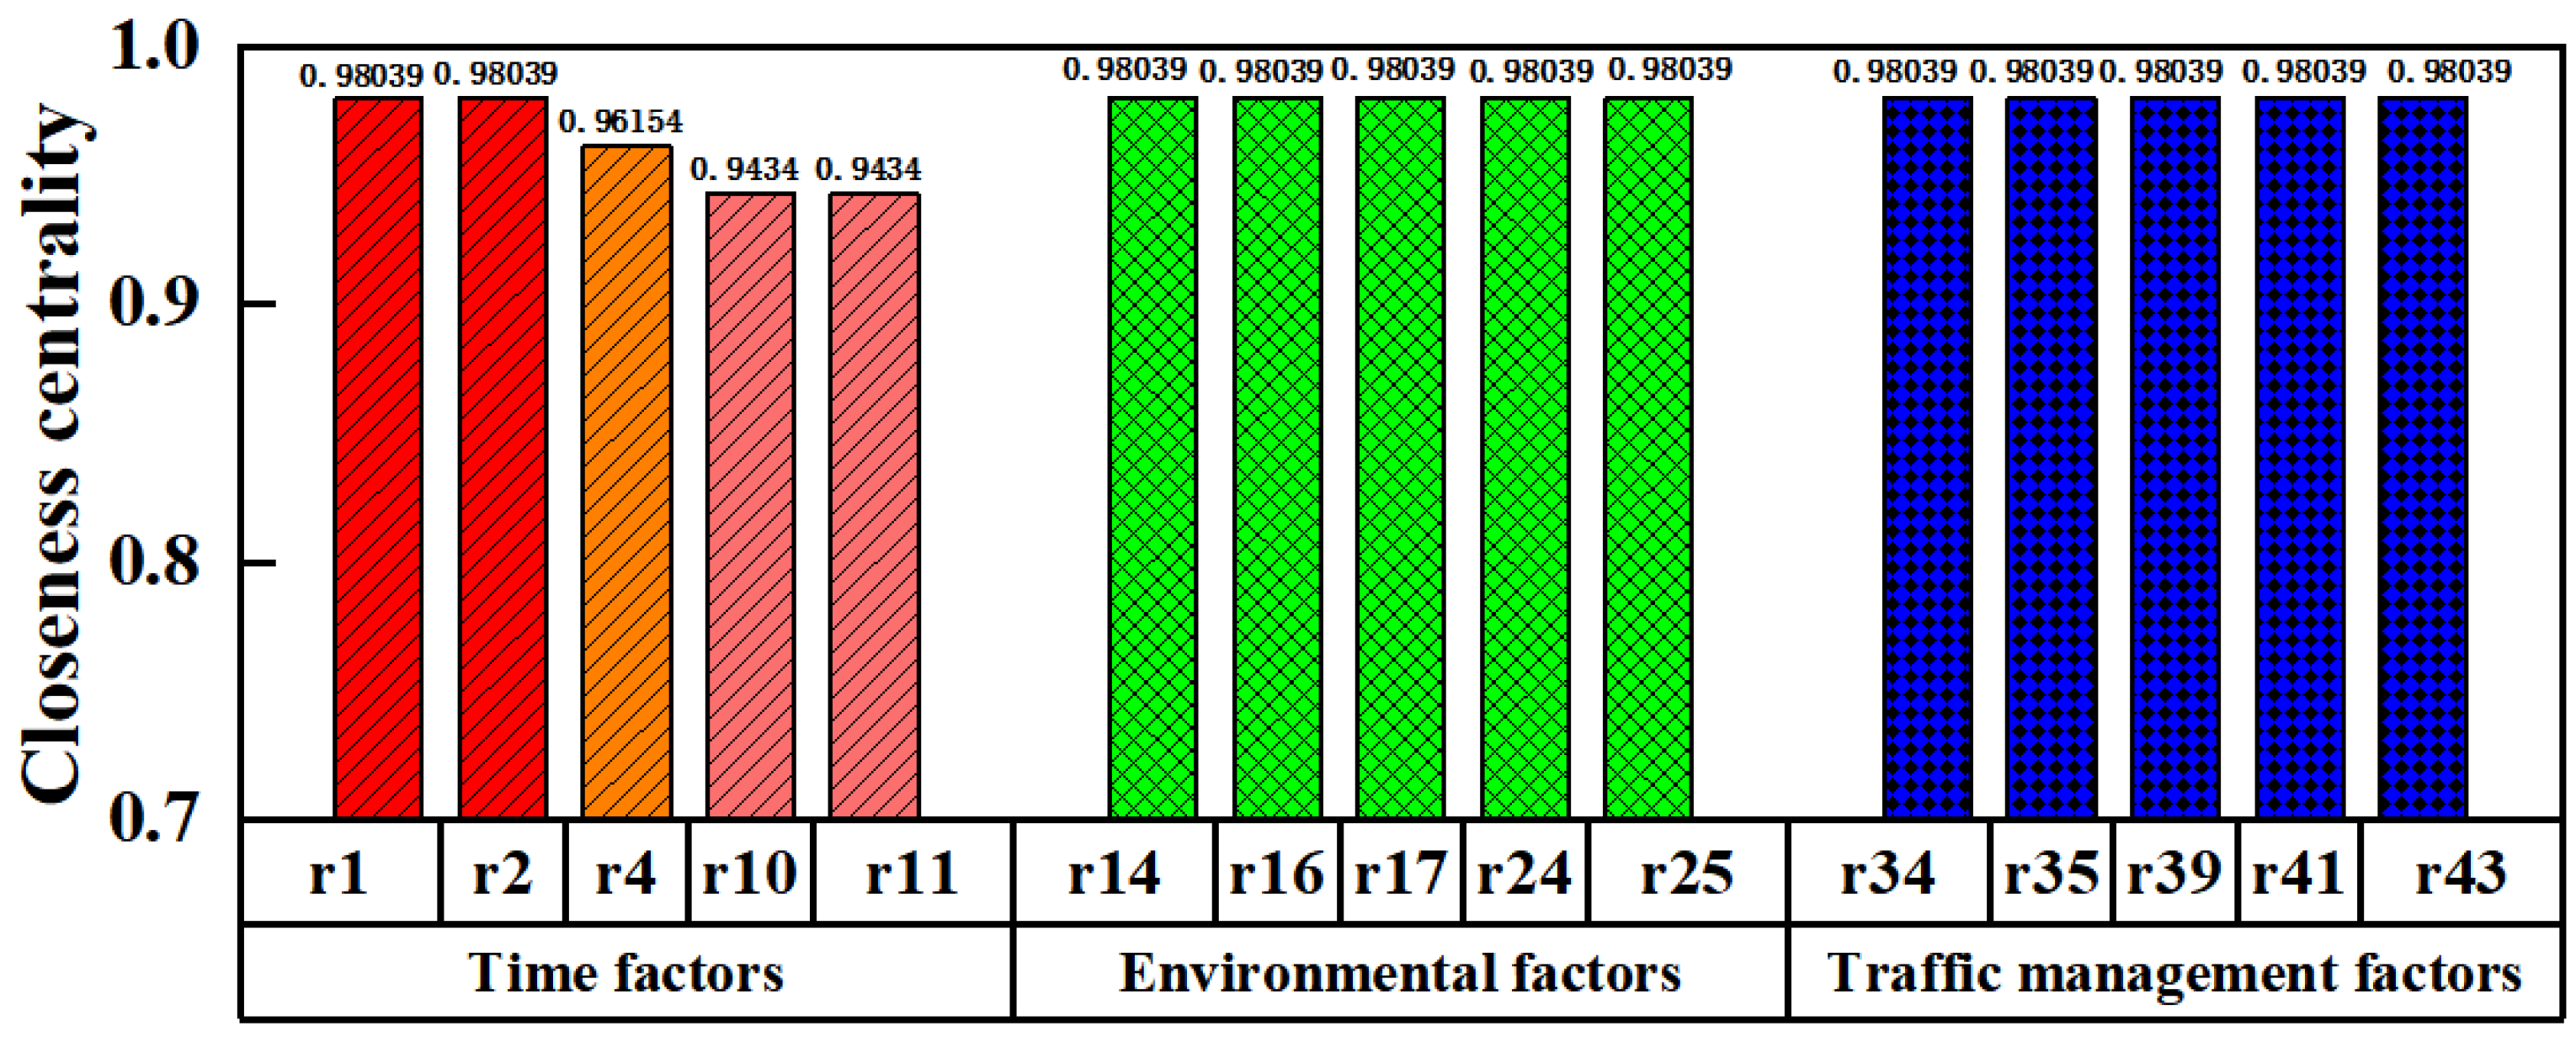
4.3.5. The Closeness Centrality of the Network

Figure 7 illustrates the distribution of the top five highest closeness centrality in each influence factor layer. The closeness centrality indicates the importance of nodes in a network and its effect on network structure and information dissemination [44].
From Figure 7, it can be seen that in terms of time factors, the closeness centrality of day and night, Tuesday, spring, and summer is relatively high. Among environmental factors, the range of roads affected by accidents, the relative location of accidents, and the visibility have a high closeness centrality. At the level of traffic management, the presence or absence of intersections, deceleration signs, railways, and safety measures have a high closeness centrality.

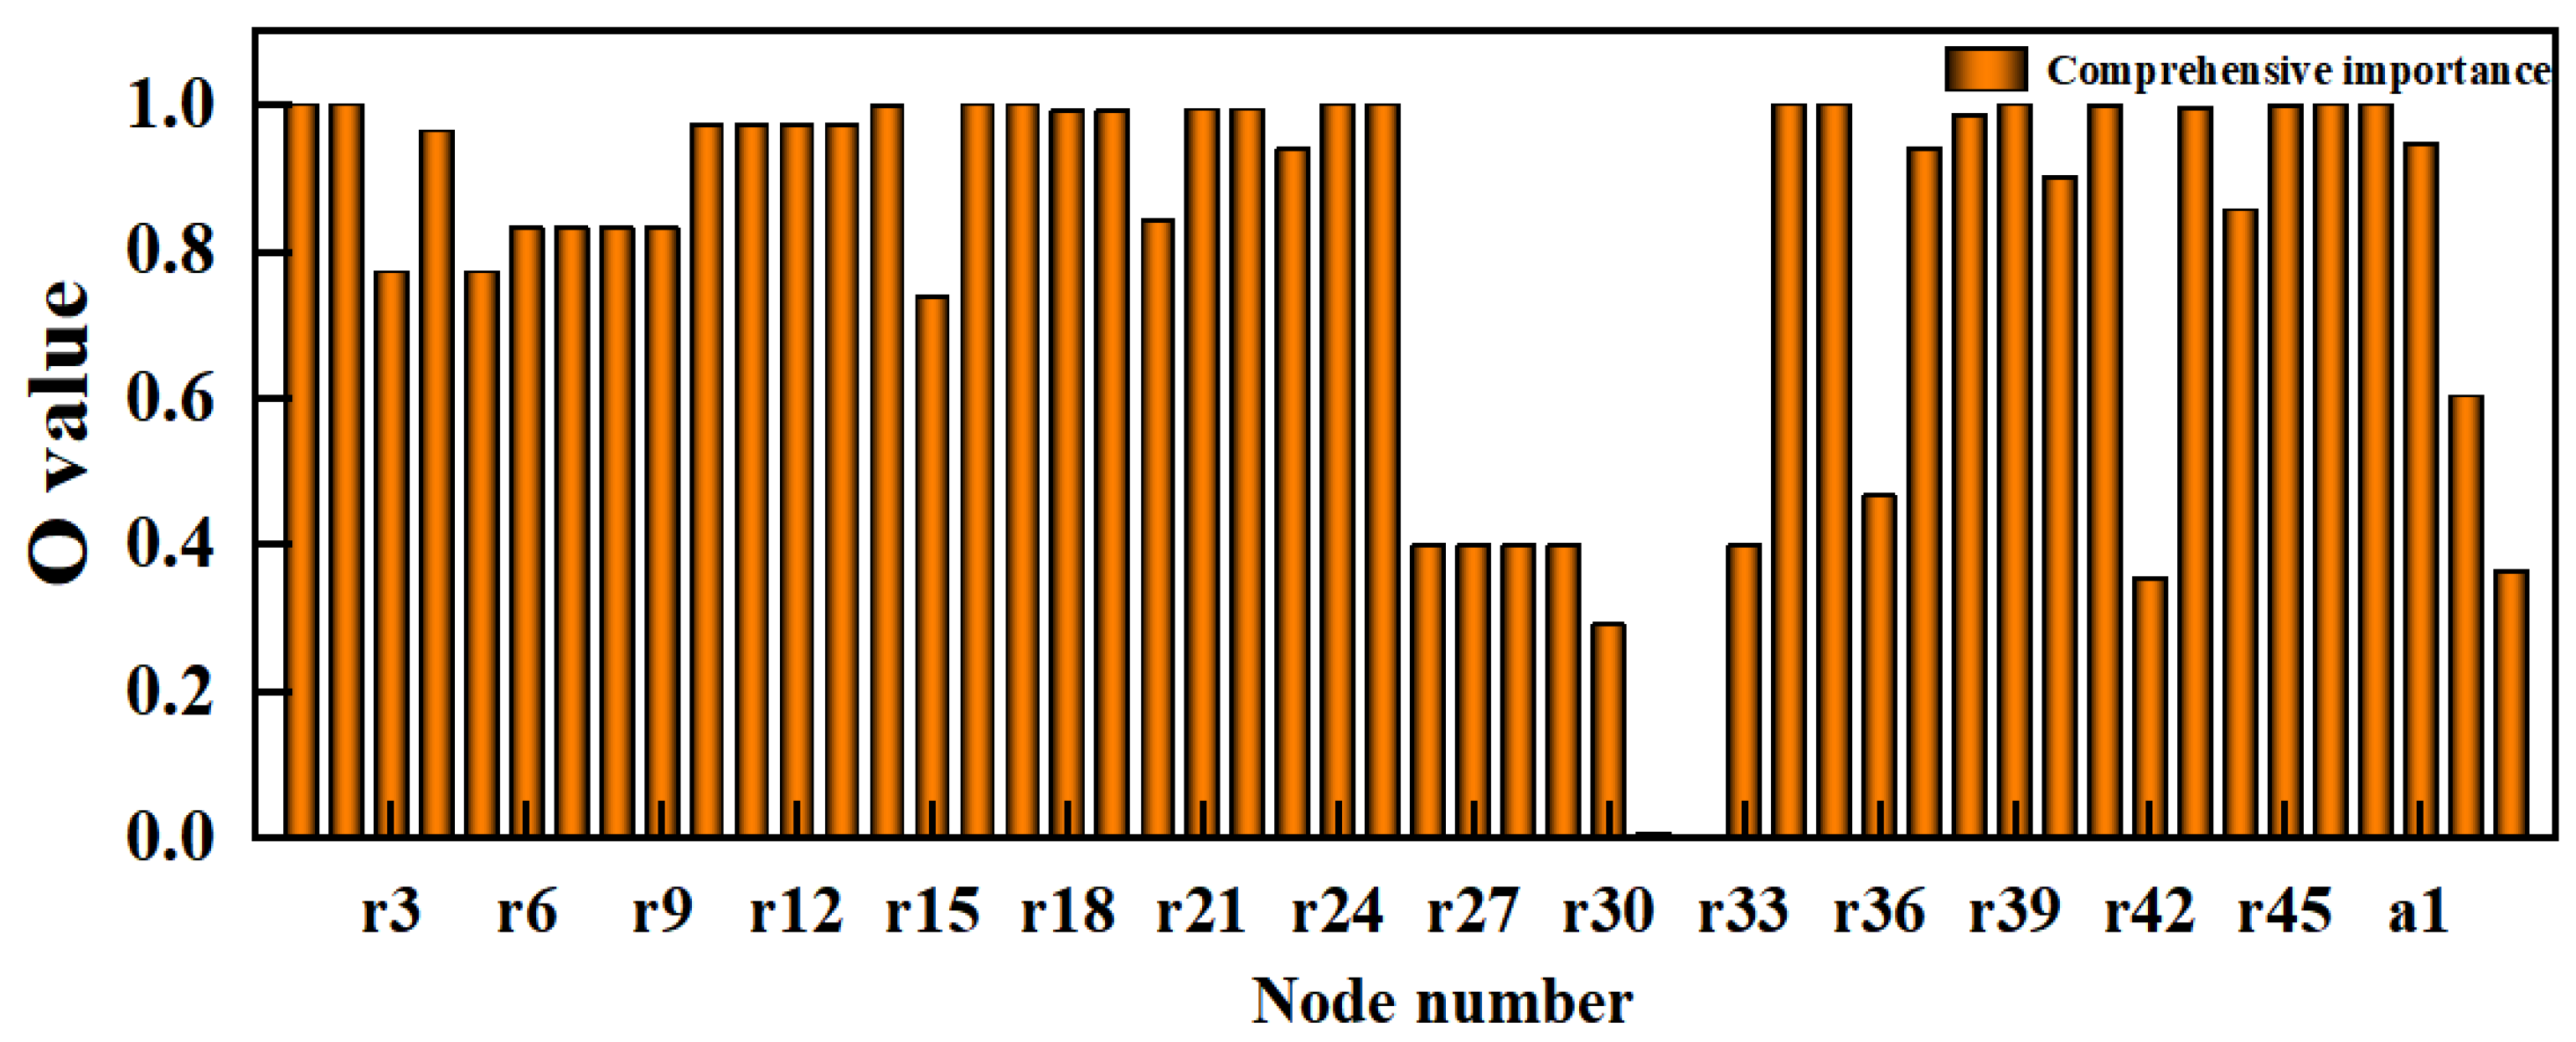
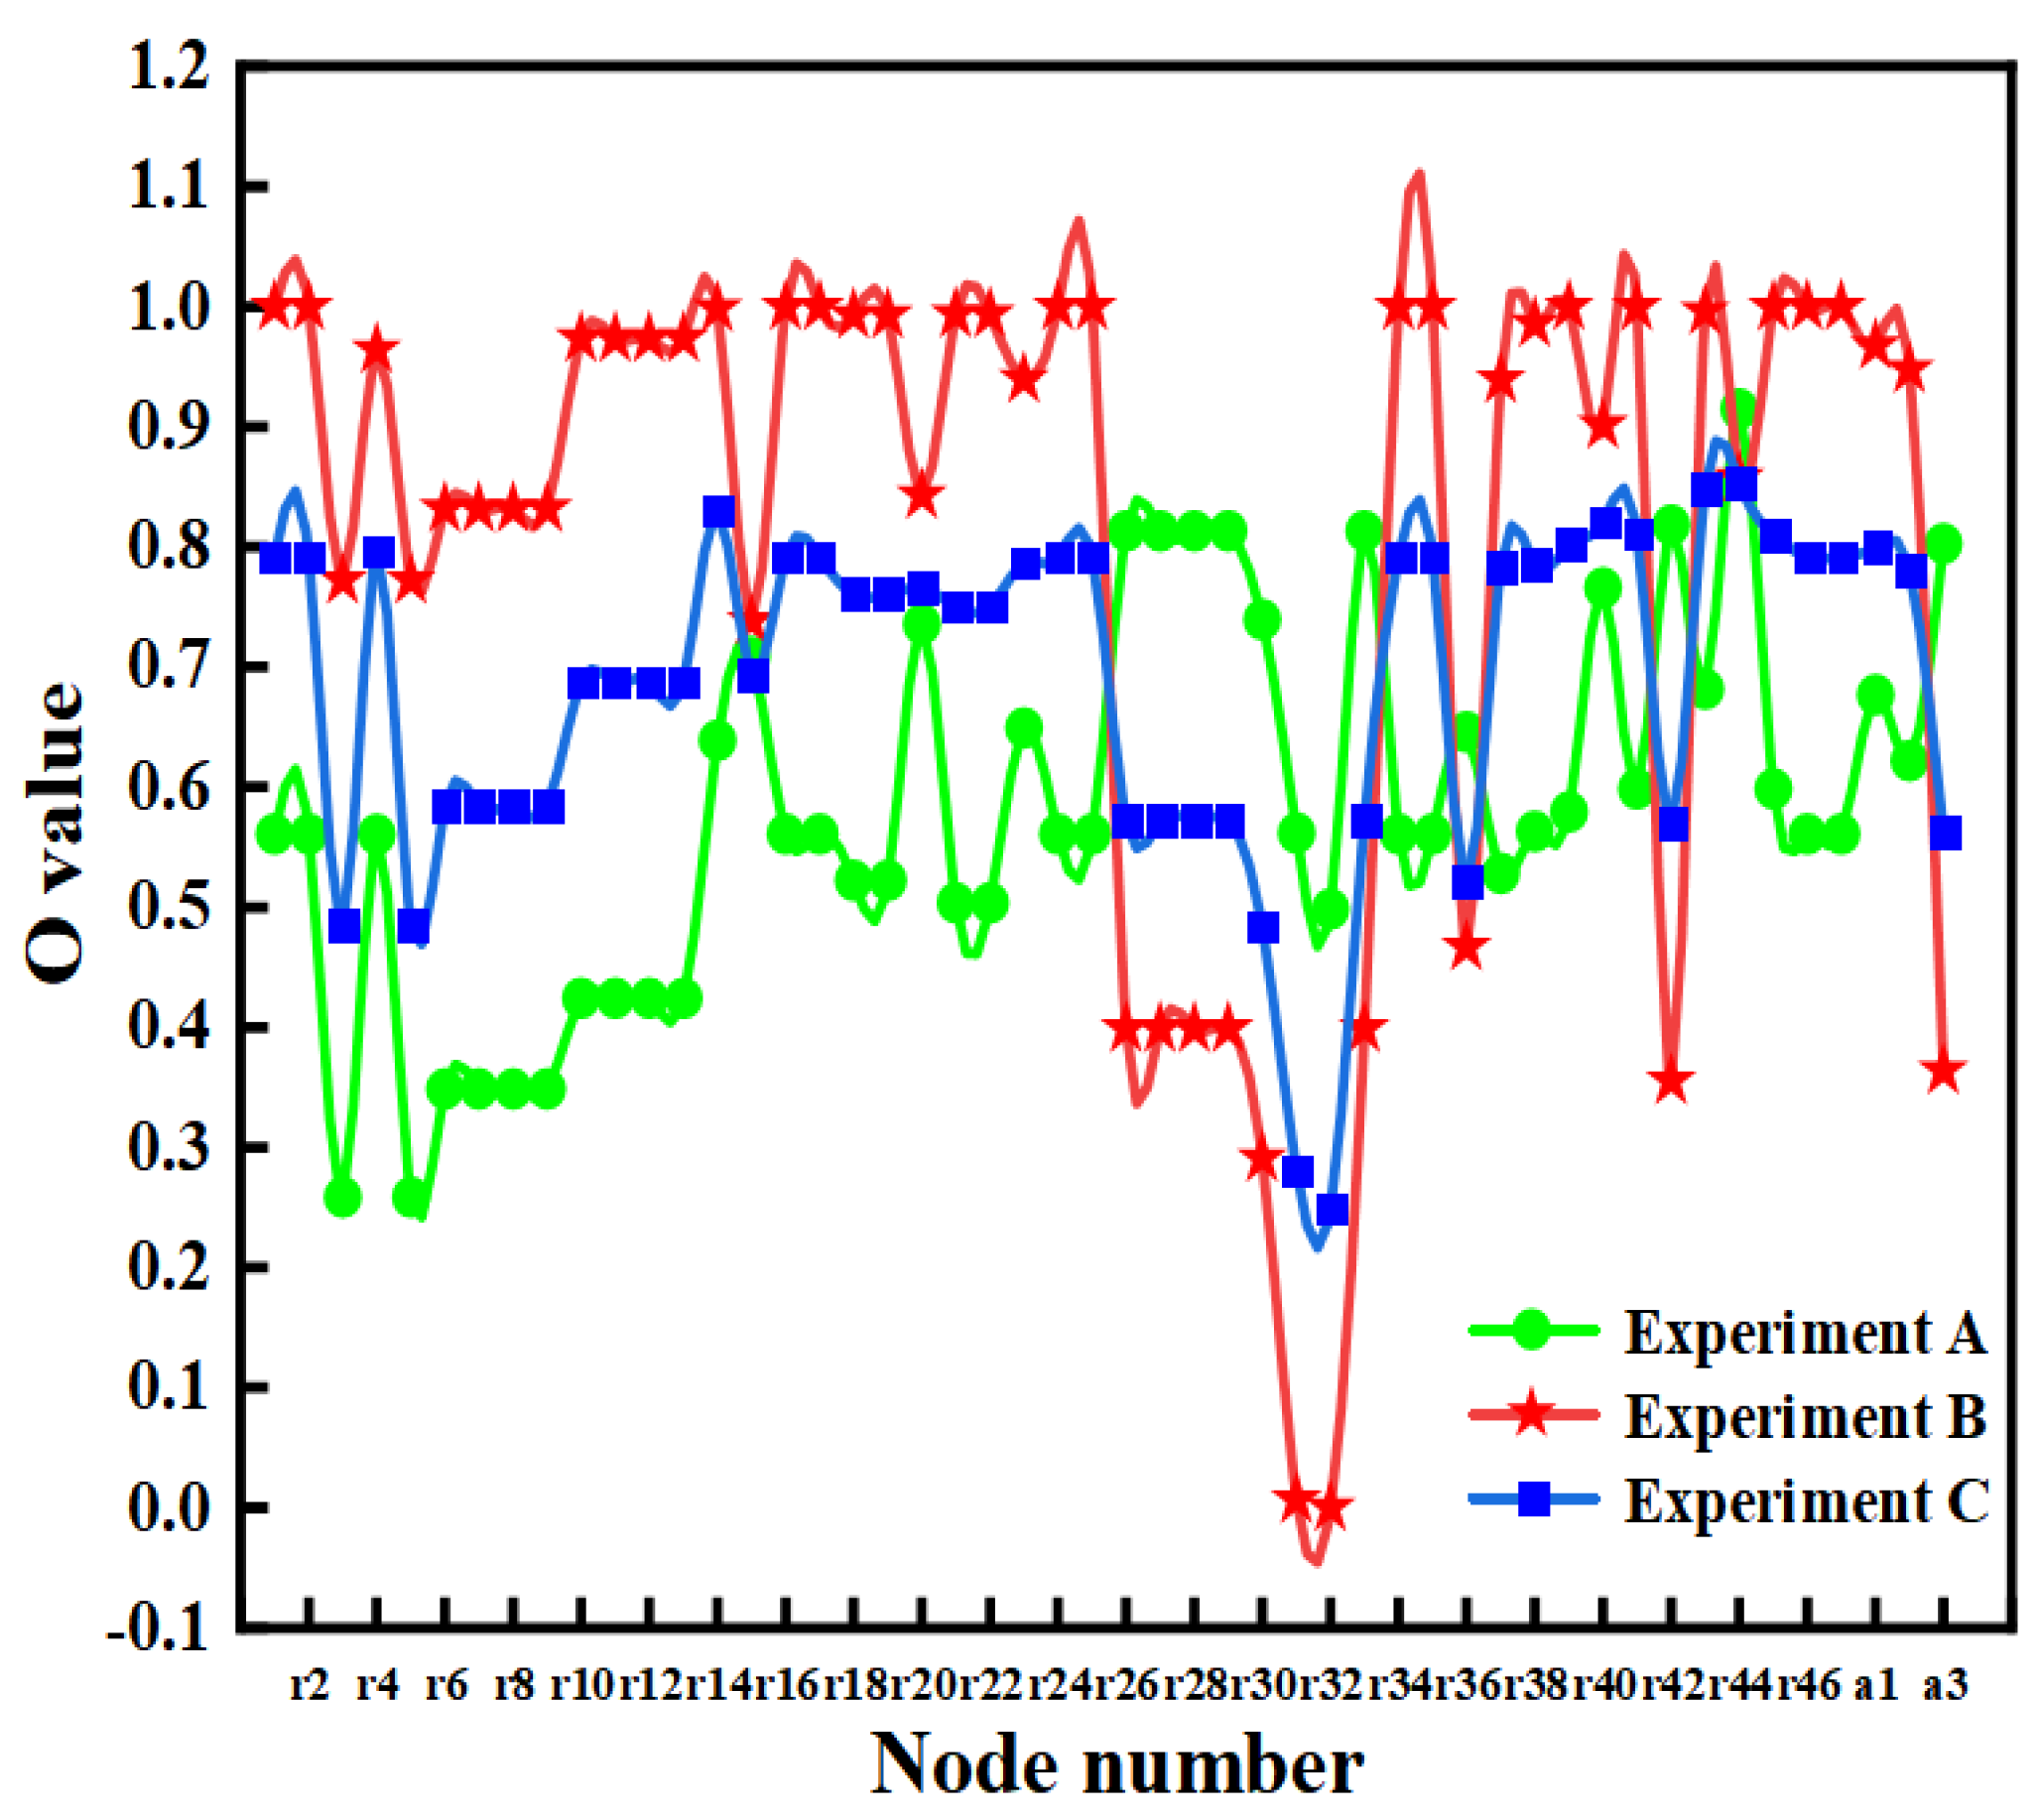
4.4. Comprehensive Importance Analysis of the Road Traffic Accident Cause Analysis Network

4.4.1. Construction of a Comprehensive Important Evaluation Model

The comprehensive importance evaluation model can measure the importance of nodes in complex networks from a global perspective. The construction process of the model is shown as follows:
(1) When there are 50 nodes in the complex network of road traffic accident cause analysis, and each node has three features. The feature index matrix Y is constructed as follows:
Y = 98 0.002 0.980 98 0.002 0.980 88 0.002 0.893 94 0.002 0.943 85 0.001 0.877
(2) Normalize the above feature index matrix Y. The normalized matrix is shown as follows:
Z = z ij = 1 m Z 11 Z 12 Z 13 Z 21 Z 22 Z 23 Z 31 Z 32 Z 33 Z m 1   1 Z m 1   2 Z m 1   3 Z m 1 Z m 2 Z m 3 = 0.020 0.020 0.020 0.020 0.020 0.020 0.012 0.015 0.011 0.017 0.015 0.016 0.010 0.006 0.009
(3) Calculate the distance D i + and D i between each index of the complex network and positive ideal solution and negative ideal solution. The calculation formula is shown in Equations (13) and (14) above.
(4) Construct a comprehensive importance evaluation model for complex networks. The calculation formula is shown in Equation (15) above. O i represents the comprehensive importance of node i. The comprehensive importance of each node is shown in Figure 8.

4.4.2. Comparative Experiment of the Comprehensive Importance Evaluation Model

Different node evaluation indicator inputs will result in different evaluation models. To explore the optimal performance of the model, we input various evaluation indicators for comparative experiments. The experiment comprised three groups. In Experiment A, we included the degree and clustering coefficient of nodes in the model to obtain comprehensive importance. In Experiment B, the model incorporated degree of node, intermediary centrality, and closeness centrality. Similarly, in Experiment C, the model took node degree, clustering coefficient, intermediate centrality and tight centrality as inputs. The results of the three experiments are compared in Figure 9.
It can be seen from the Figure 9 that the peaks of Experiment A and Experiment C are lower than the peaks of Experiment B, and the troughs are higher than the troughs of Experiment B. It can show that Experiment B can highlight the overall characteristics of the comprehensive importance model of complex network synthesis compared with Experiment A and Experiment C. Experiment B has a higher degree of completion. When the degree of nodes, intermediate centrality, and closeness centrality are used as inputs for the comprehensive importance evaluation model, the model exhibits better performance. Therefore, Experiment B is taken as the analysis object of comprehensive important evaluation model.
From Figure 8 and Figure 9 we can see that 80% of the comprehensive importance of each influencing factor in Experiment B is between 0.5–1. It can be seen that most factors are closely related to the occurrence of accidents. When the comprehensive importance O value is 1, it shows that this factor must relate to the occurrence of the accidents.

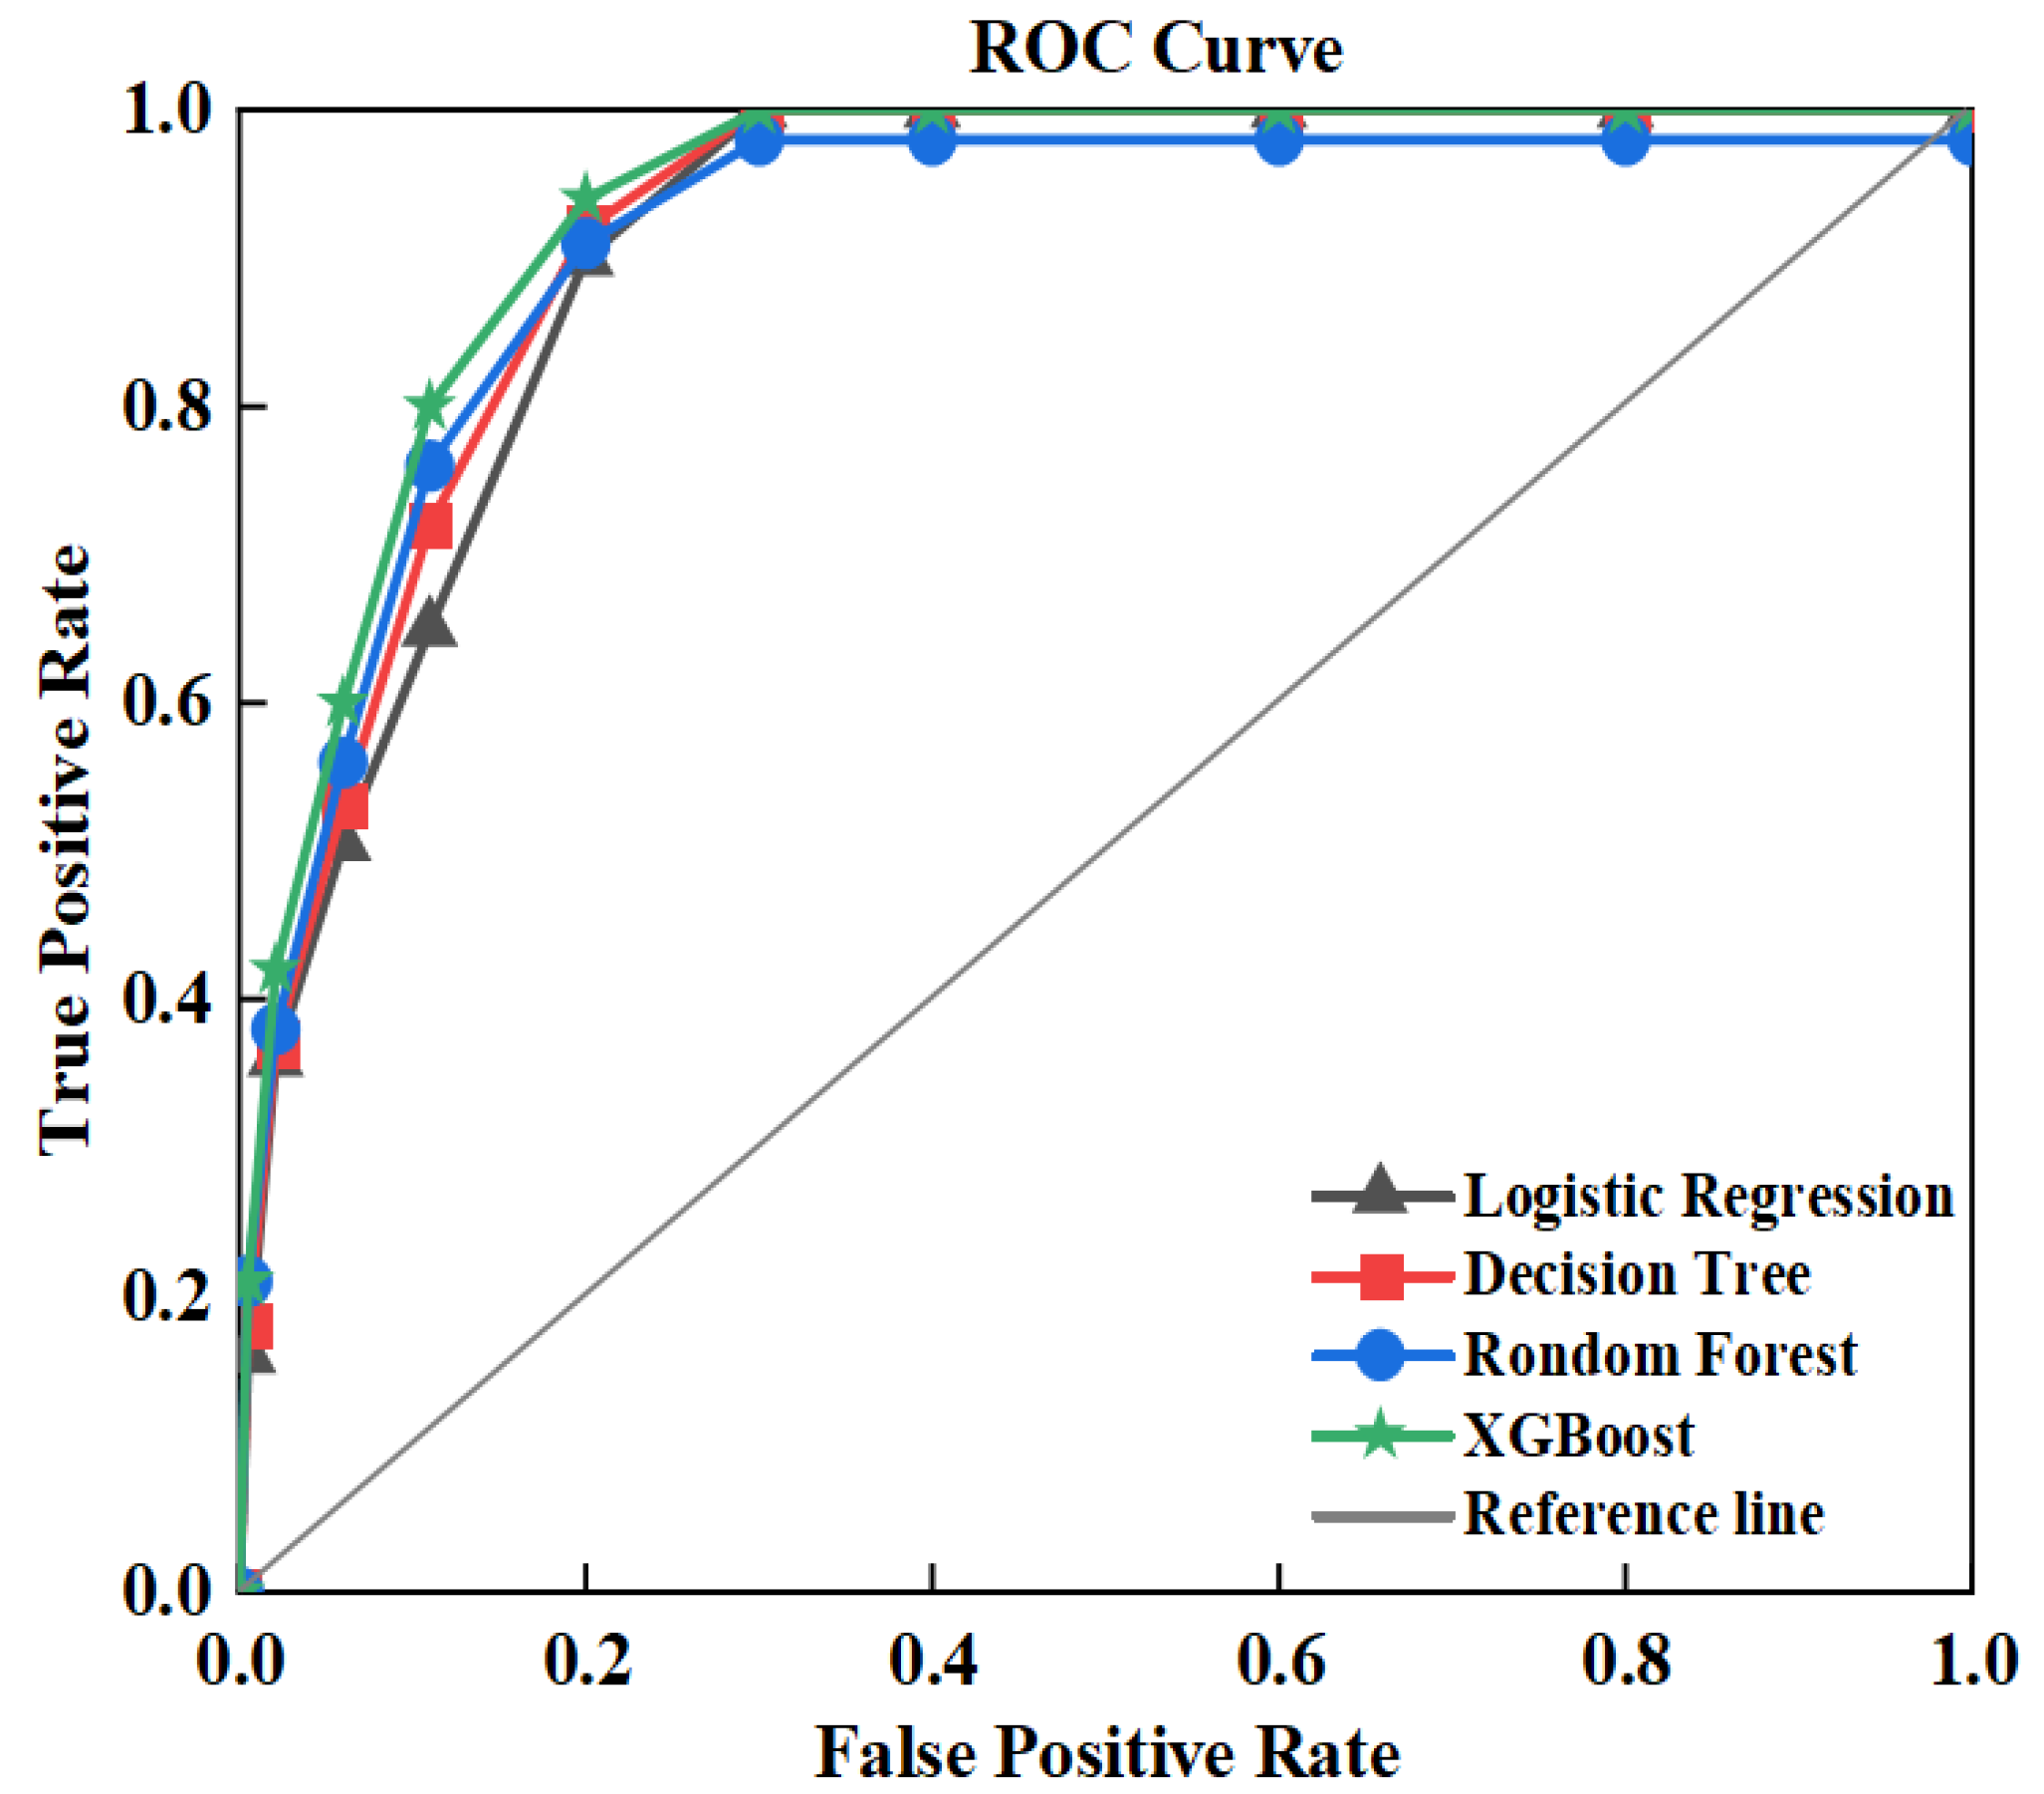
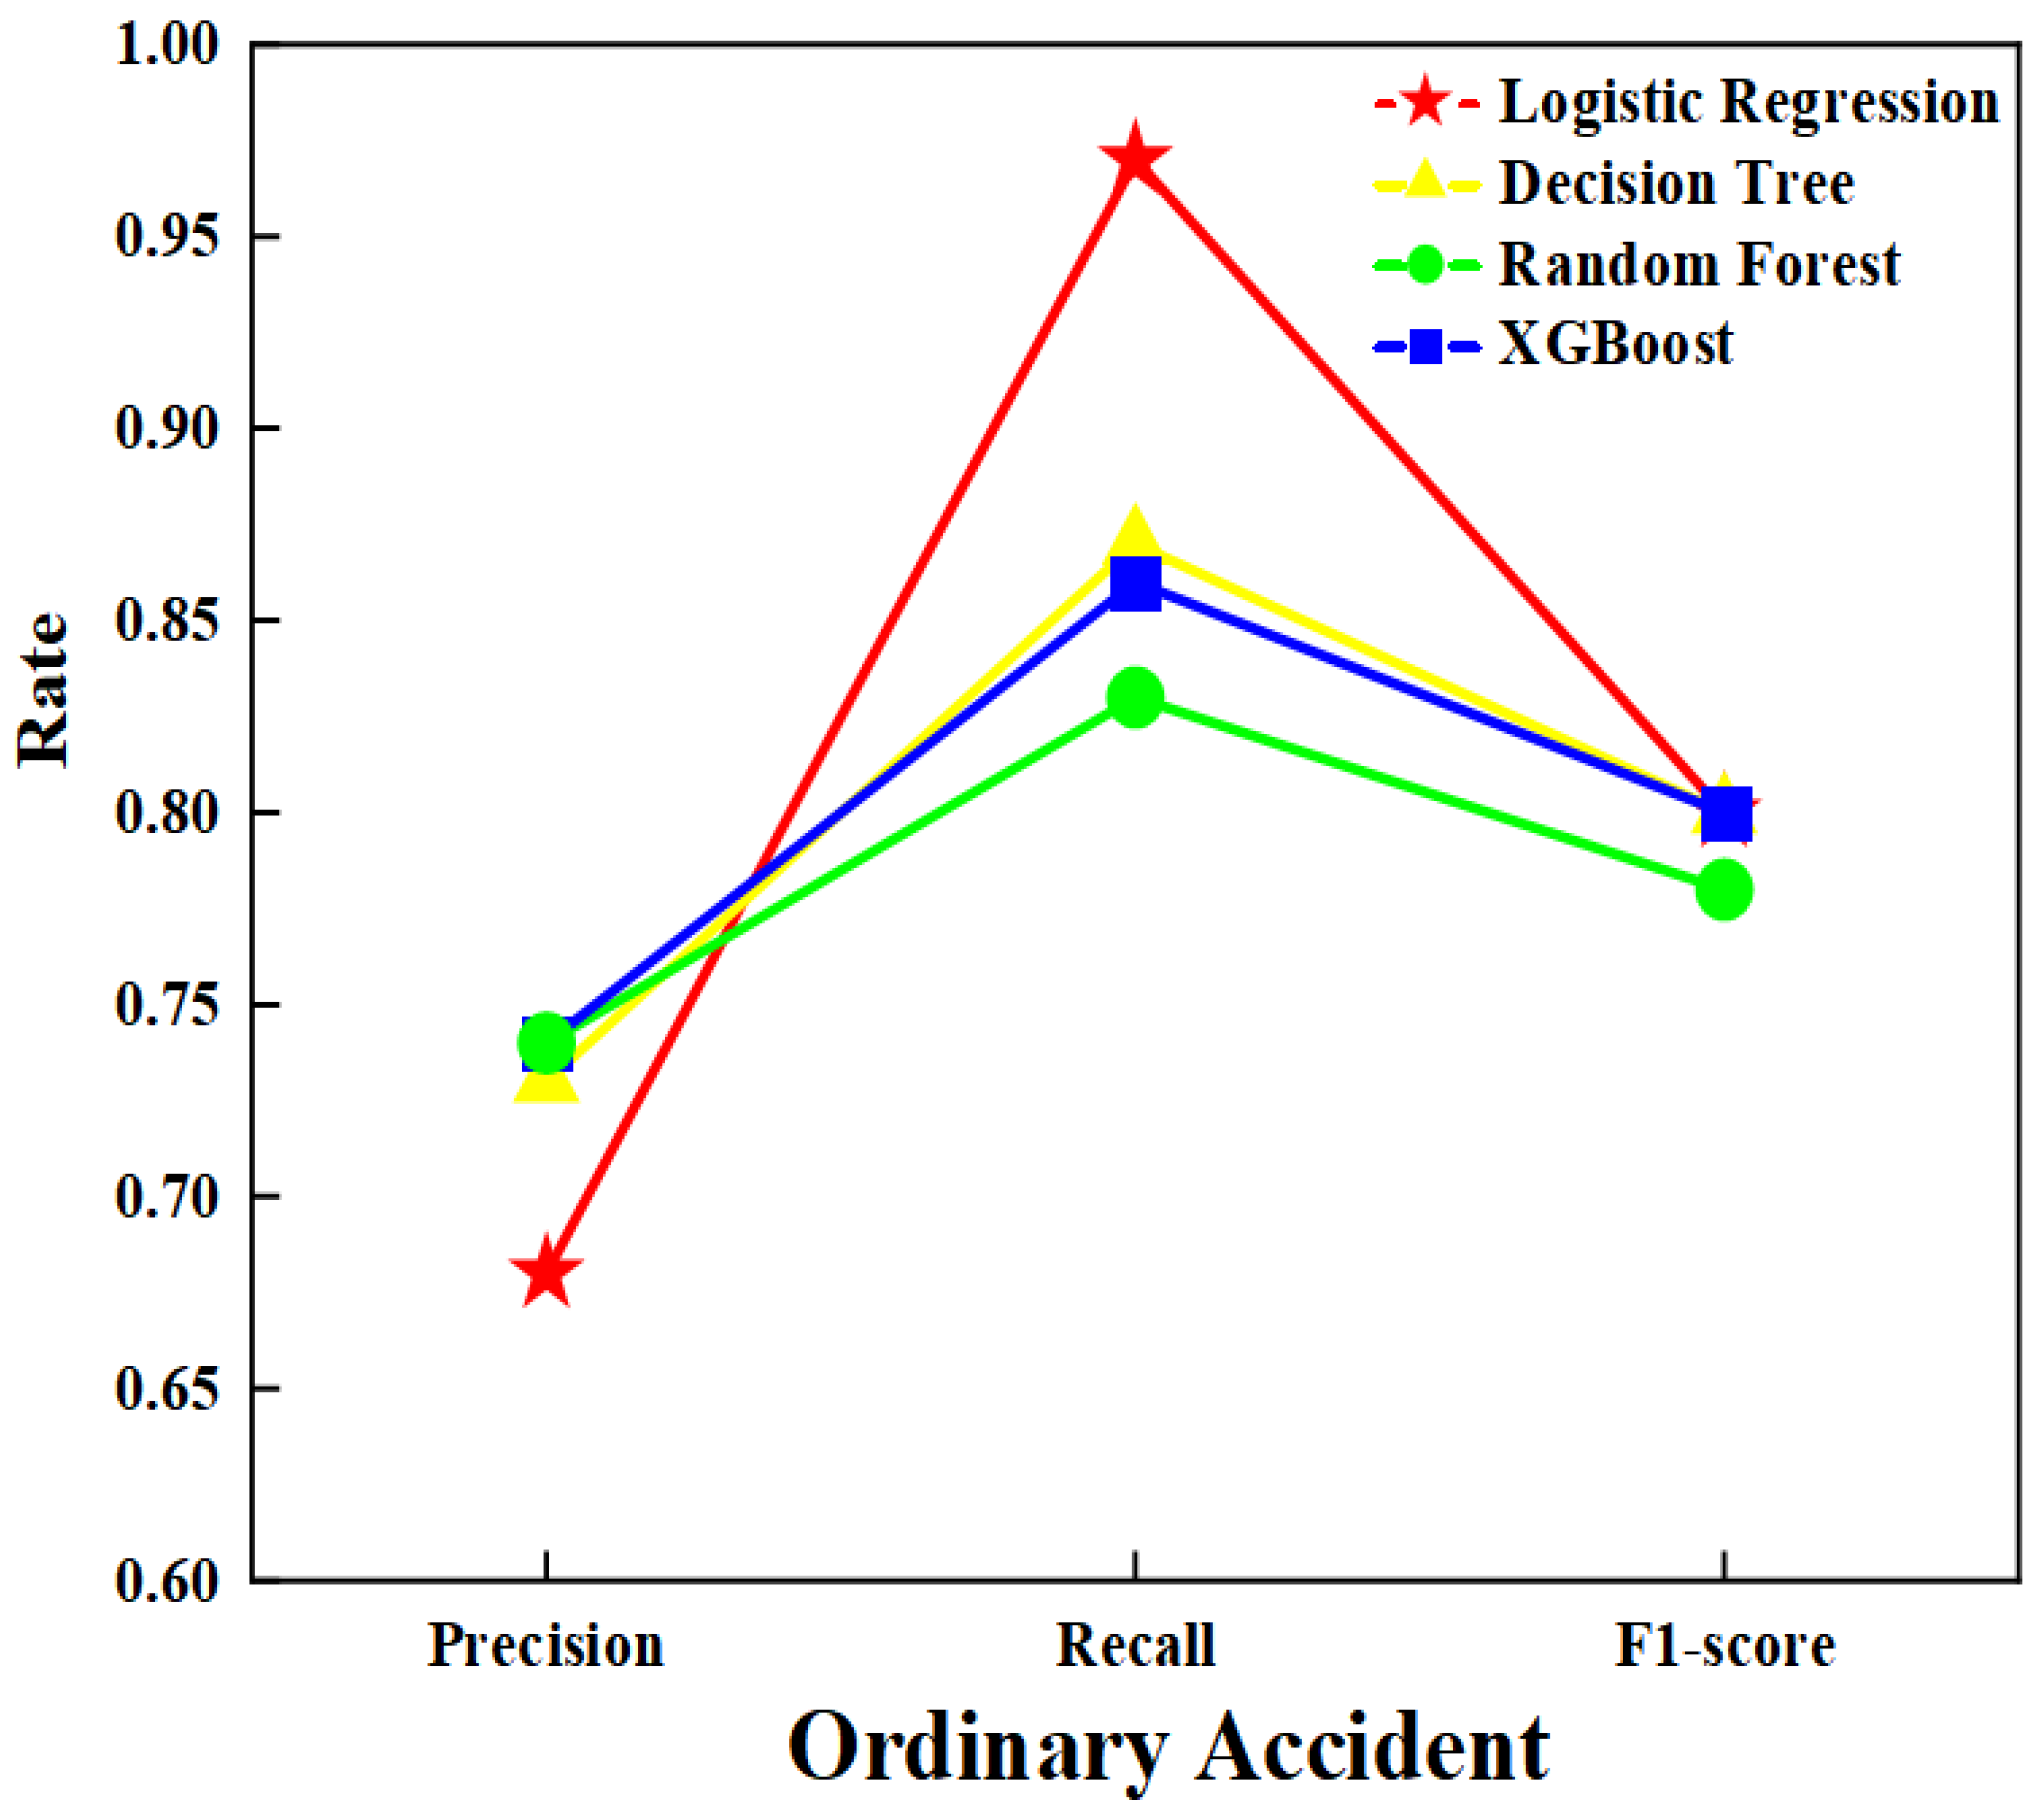
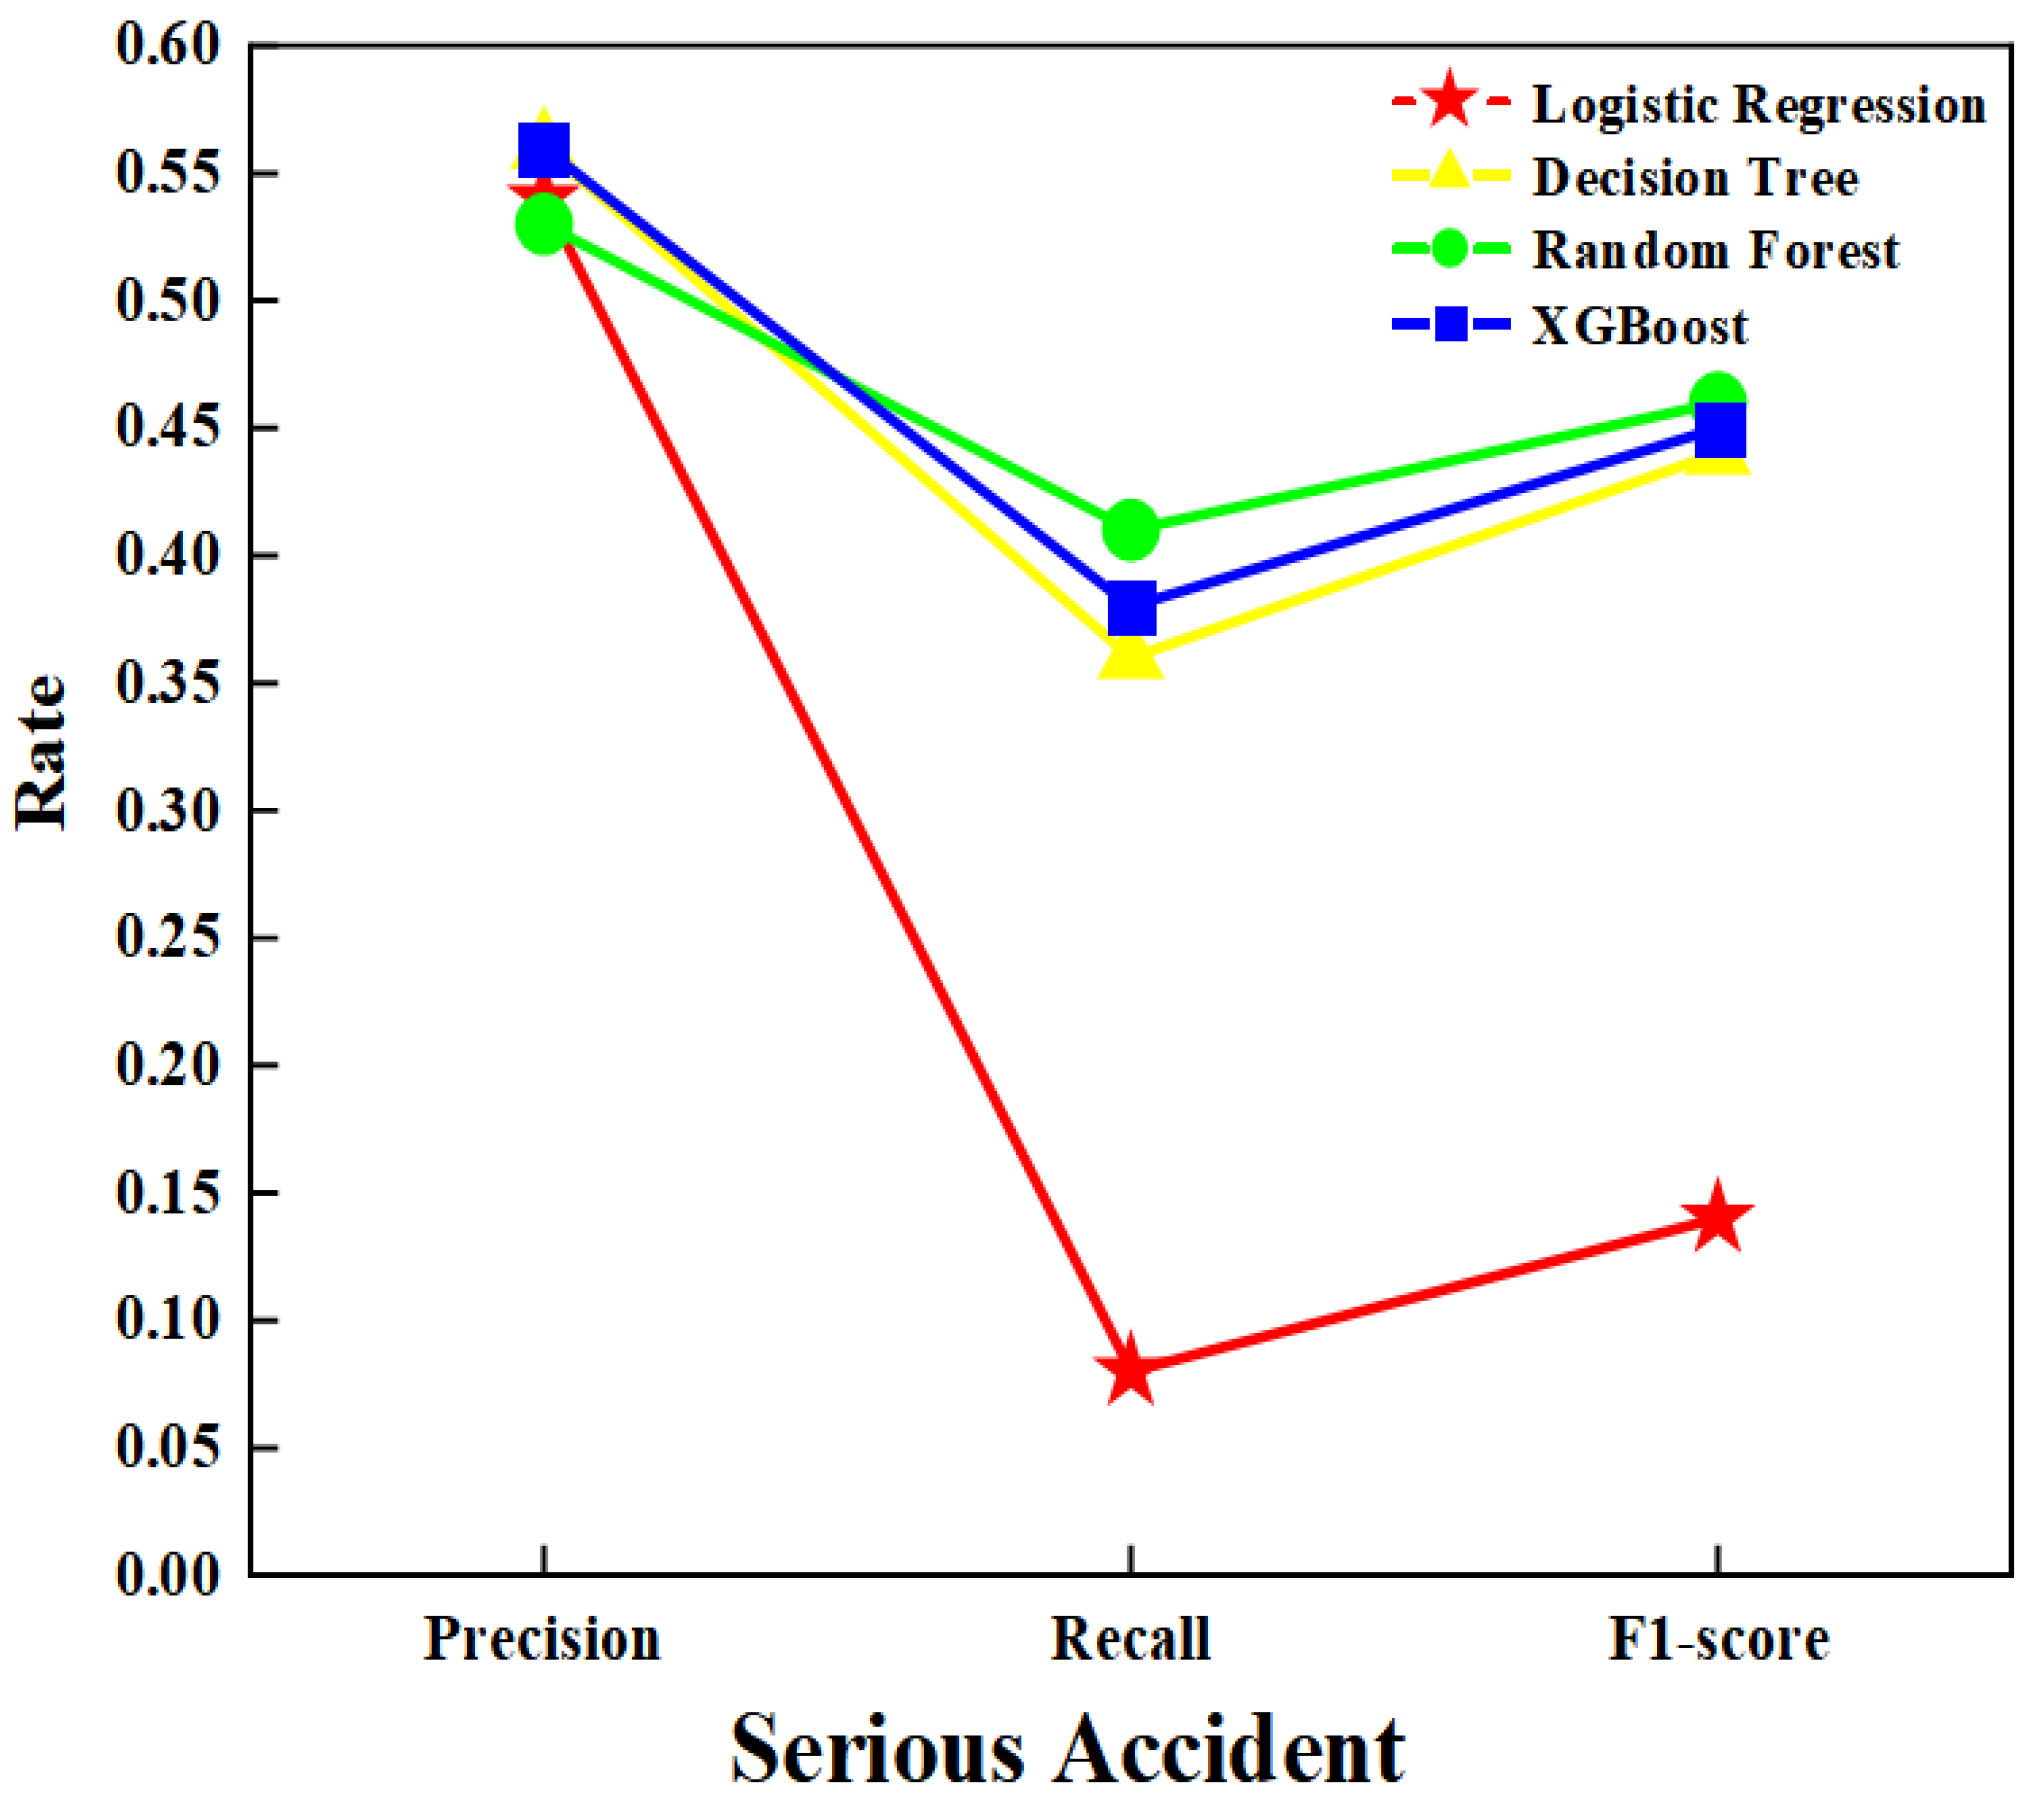
4.5. Construction of an Injury Severity Classification Model for Road Traffic Accidents

The aforementioned accident impact characteristics, obtained through complex network analysis, address the issue of feature redundancy and the overwhelming number of data features. The reduced features have significant research implications for accident injury severity classification. Consequently, the dimension-reduced features were utilized as input to build a model for classifying damage severity. According to Figure 8 and Figure 9, the time of the accidents was selected as day or night, also selected were the relative position of the accidents, the temperature and humidity of the environment, the visibility, the length of the road range affected by the accidents, the existence of speed bumps, the existence of railways, the existence of stations, the existence of safety measures, and the existence of traffic signs. A total of 11 characteristics were used to construct the classification model of the severity of the accident injury by using the method of machine learning [45]. The machine learning methods selected include Logistic Regression (LR), Random Forest (RF), Decision Tree (DT), and Extreme Gradient Boosting (XGBoost). The models were constructed and the performance of the models was compared.

4.5.1. Data Normalization Processing

Due to the presence of numerical data and Boolean data in the original data, it was necessary to convert Boolean data into numerical data before constructing a classification model. Factors such as the accident occurring in daytime, the presence of road facilities, and the accident occurring on the left side of the road were all marked as 1. Factors such as the accident occurring at night, the absence of road facilities, and the accident occurring on the right side of the road were all marked as 0.

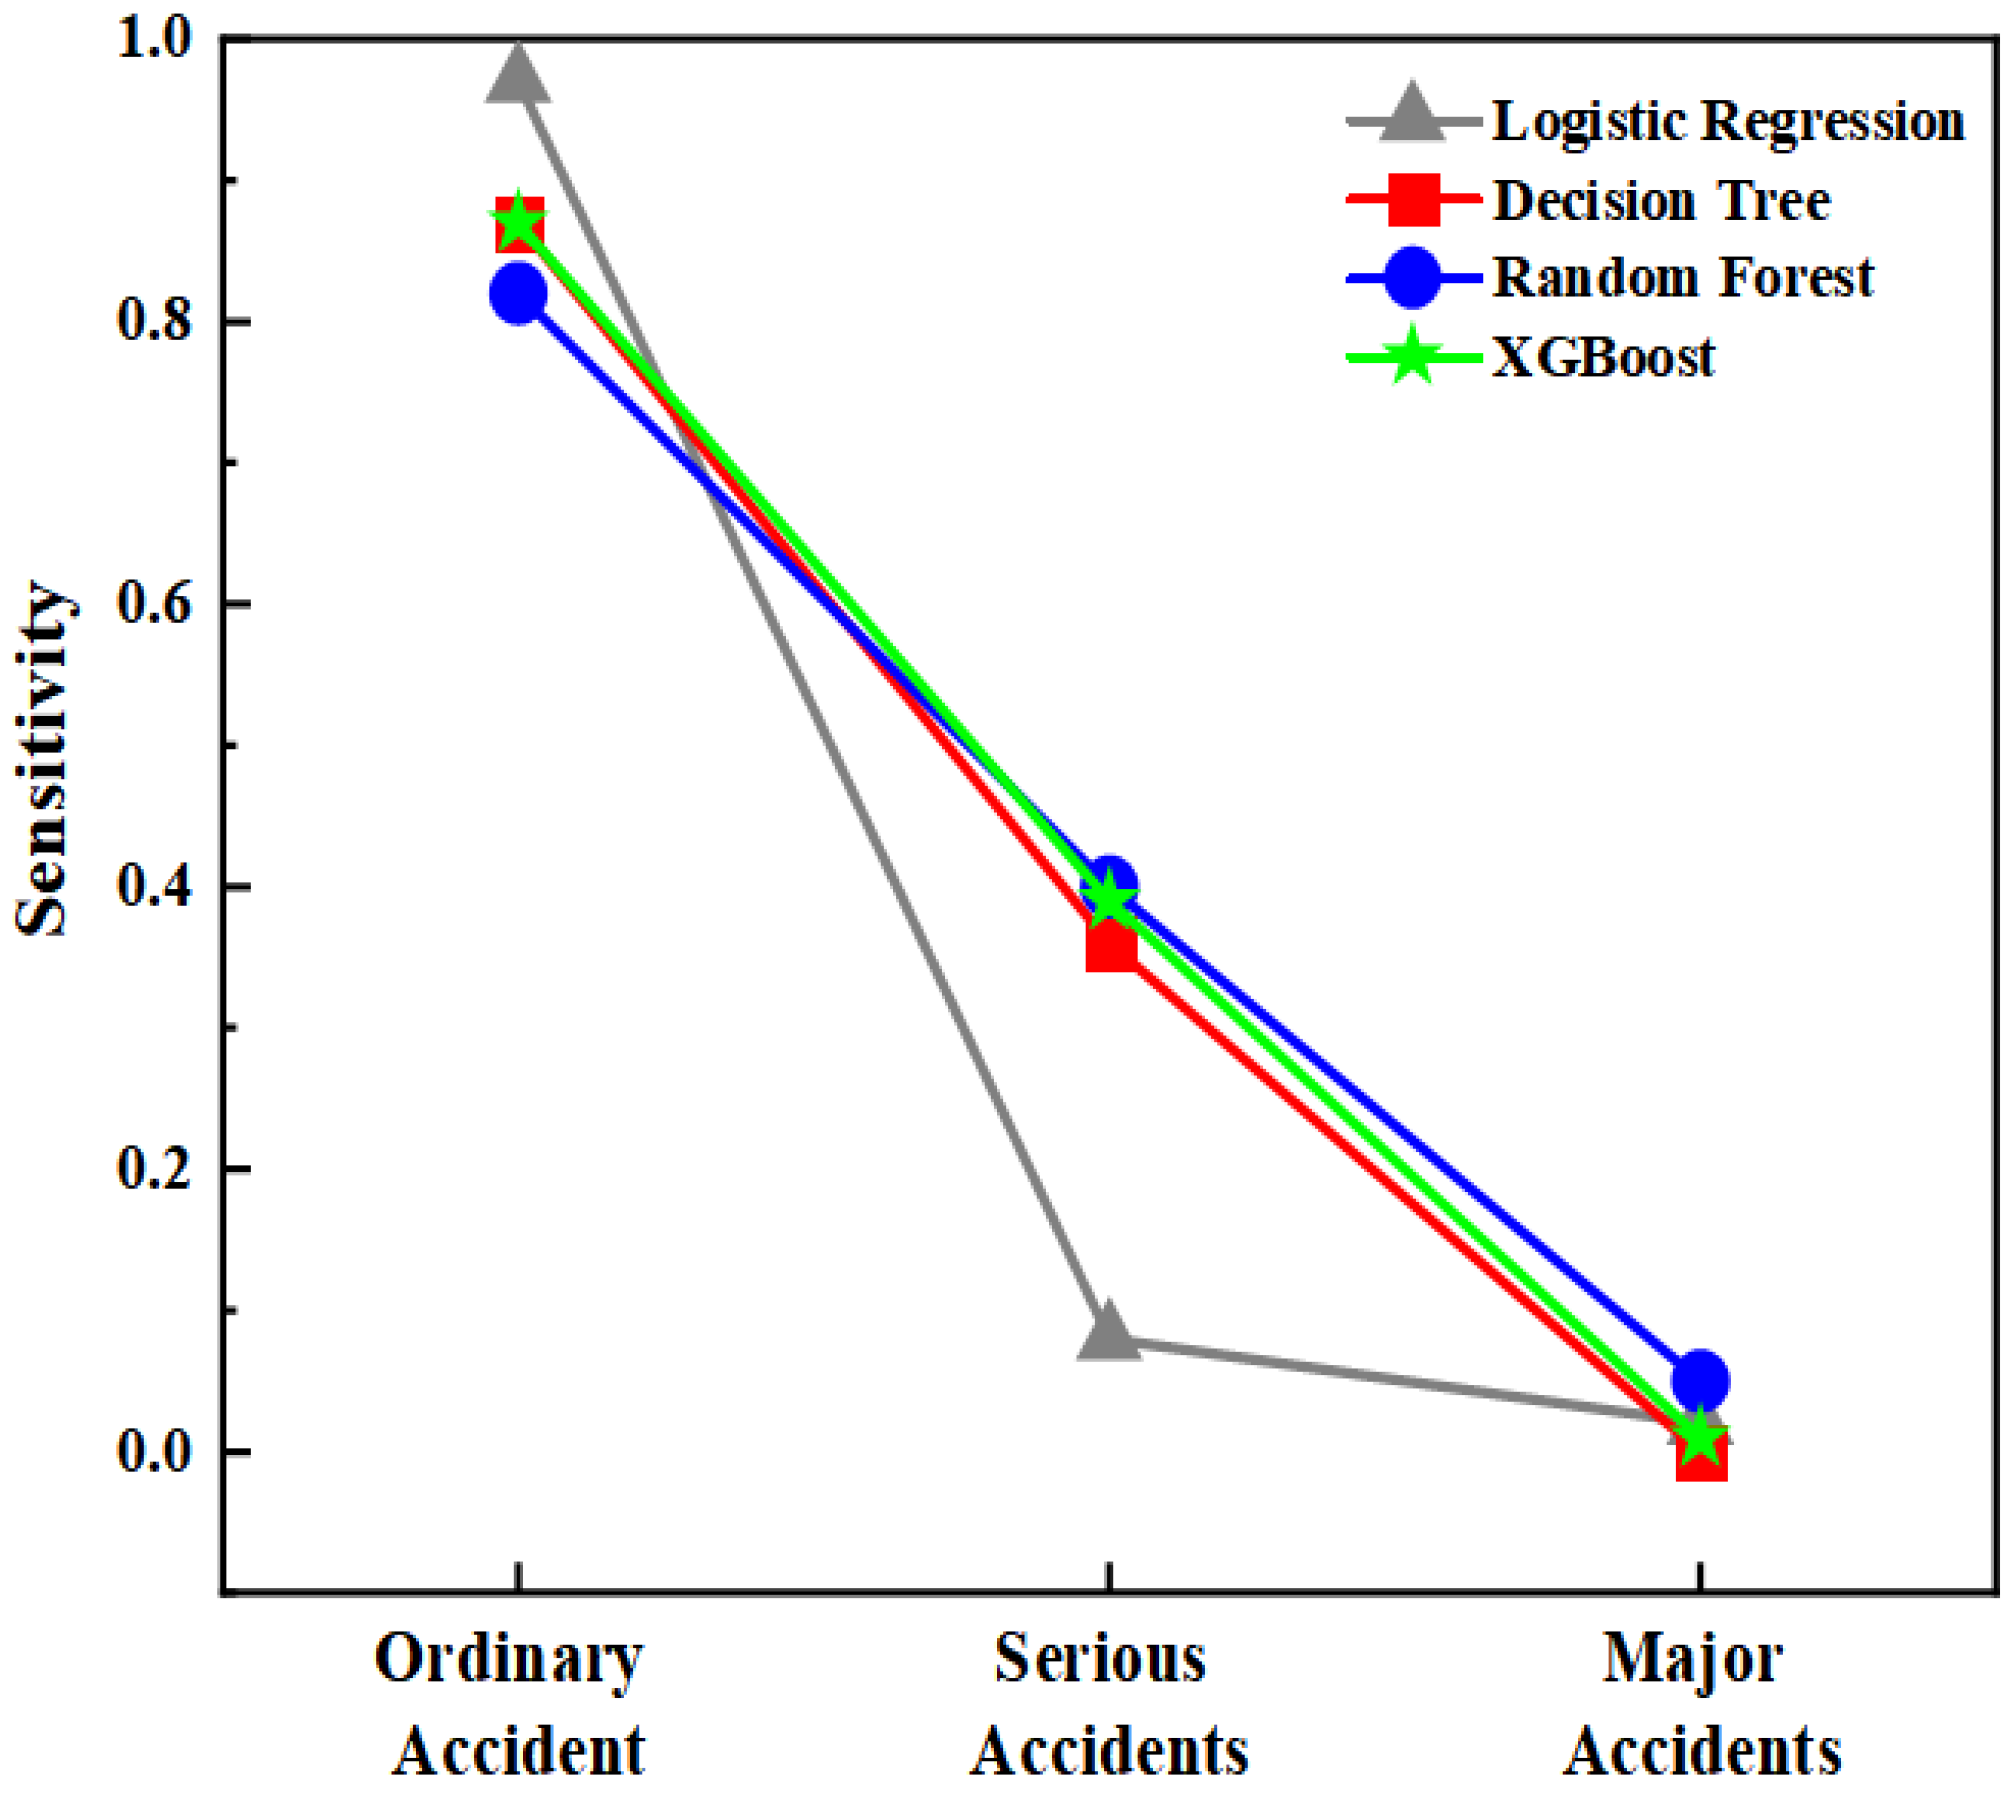
4.5.2. Model Construction and Analysis

The machine learning methods used included Logistic Regression (LR), Random Forest (RF), Decision Tree (DT), and Extreme Gradient Boosting (XGBoost). The specific configuration of the machine learning model is shown in Table 4. The dataset was divided into a 75% training set and a 25% test set. A classification model of road traffic accident injury severity was constructed, and the ROC curves of the four methods were compared, as shown in Figure 10.
As shown in Figure 10, it can be seen that the Extreme Gradient Boosting (XGBoost) curve is closer to the upper left corner than the other three model curves. It means that Extreme Gradient Boosting (XGBoost) has a larger AUC value, and its performance is also better than the other three methods. Therefore, the performance of Extreme Gradient Boosting (XGBoost) is superior to that of the other three models.
The different indicators of the four models in different accident injury severities are shown in Figure 11, Figure 12 and Figure 13 and Table 5. The sensitivity test is shown in Figure 14 below.
From the above Figure 11, Figure 12 and Figure 13, we can see that the precision rate, recall rate, and F1-score value of the four models are larger in Ordinary accidents and Serious accidents. The reason is that the number of Ordinary accidents and Serious accidents in the original data accounts for a large proportion. It can be seen that when considering the safety triggering factors, it is possible to focus on the influencing factors of both Ordinary and Serious accidents.
From the sensitivity test in Figure 14, it can be seen that all four models can effectively and correctly classify accidents in Ordinary accidents. In Serious accidents, the classification performance of Extreme Gradient Boosting (XGBoost) and Random Forest (RF) is higher than that of Logistic Regression (LR) and Decision Tree (DT). In Major accidents, the classification performance of the four models for accidents is relatively low, due to the small amount of data for Major accidents and the insufficient learning depth of the models for various features.
From Table 5 it can also be found that the evaluation index values of the Logistic Regression (LR) model in different types of accidents are lower than those of the other three models, indicating that the classification performance of the Logistic Regression (LR) model is poorer than that of the other three models. The Decision Tree (DT) has a higher evaluation index value in Ordinary accident types, indicating that it is suitable for classifying Ordinary accidents, but not Serious and Major accidents. The evaluation index values of Random Forest (RF) in Serious and Major accidents are generally higher than those of the other three types of models, but the evaluation index values in Ordinary accidents are lower. Therefore, Random Forest (RF) is suitable for classifying Serious and Major accidents. Finally, Extreme Gradient Boosting (XGBoost) has a good performance in the evaluation metrics in all three types of accident. Based on the above situation, the performance of the Extreme Gradient Boosting (XGBoost) model is better than the other three types of models, and it can have a good classification effect for the severity of injuries in road traffic accidents.

5. Conclusions

In this paper, data on road traffic accidents in various states of the United States in recent years were selected to construct an accident causation analysis model based on complex networks. Each feature indicator in the model was extracted and analyzed, and an accident classification model was constructed based on the features after dimensionality reduction. The following conclusions were drawn:
(1) The complex network model for road traffic accident causation analysis belongs to the scale-free network structure. In the network the nodes are clustered to a higher degree, while the degree of distribution of the nodes is not uniform, and the clustering phenomenon is more obvious. The nodes are more closely connected and have a faster propagation speed; it is easier to connect with other nodes through one node.
(2) Through the extraction and analysis of node indicators in the network, traffic management factors are the main influencing factors of road traffic accidents. Key factors influencing the occurrence of accidents include no intersections on the road, no deceleration signs, no railways, and no safety measures. At the same time, a comprehensive importance evaluation model of complex networks for accident causation analysis was constructed. It was found that having more input indexes in the model did not necessarily make its performance better. When the node degree, intermediary centrality, and closeness centrality were used as the input of the model, the performance of the model was better.
(3) Four different machine learning classification models were constructed using feature covariates after dimensionality reduction by the complex network method as inputs. By comparing the precision rate, recall rate, F1-score value, and sensitivity test of the models, it was found that the performance of Extreme Gradient Boosting (XGBoost) was better than the other three models.
(4) Other categories of influencing factors could be included in subsequent studies, such as driver characteristics, vehicle characteristics, and traffic flow, which can increase the intrinsic characteristics of the complex network and the training dimension of the model, and can better demonstrate the specific environment in which accidents occur. At the same time, other classes of machine learning or deep learning methods can also be applied. Innovating on the original and analyzing the few most influential features is a way to reduce the cost of model training while improving model performance.

Author Contributions

Conceptualization, Y.W.; methodology, Y.W. and H.Z.; validation, X.C. and X.G.; investigation, H.Z.; writing and editing, Y.W. and H.Z. All authors have read and agreed to the published version of the manuscript.

Funding

This paper was supported by the Doctoral Program of Zhengzhou University of Light Industry (2021BSJJ047).

Institutional Review Board Statement

Not applicable.

Informed Consent Statement

Not applicable.

Data Availability Statement

The datasets we use are all open public data benchmarks, and the relevant addresses are: https://www.kaggle.com/datasets/sobhanmoosavi/us-accidents.

Conflicts of Interest

The authors declare no conflict of interest.

References

  1. World Health Organization. World Health Organization Global Status Report on Road Safety 2018; World Health Organization: Geneva, Switzerland, 2018.
  2. Soni, A.; Dharmacharya, D.; Pal, A.; Srivastava, V.K.; Shaw, R.N.; Ghosh, A. Design of a machine learning-based self-driving car. In Machine Learning for Robotics Applications; Springer: Berlin, Germany, 2021; pp. 139–151. [Google Scholar]
  3. Lee, J.; Huang, H.; Wang, J.; Quddus, M. Road safety under the environment of intelligent connected vehicles. Accid. Anal. Prev. 2022, 170, 106645. [Google Scholar] [CrossRef]
  4. Zou, X.; Vu, H.L.; Huang, H. Fifty years of accidents analysis & prevention: A bibliometric and scientometric overview. Accid. Anal. Prev. 2020, 144, 105568. [Google Scholar] [PubMed]
  5. Chen, H.; Zhang, L.; Ran, L. Vulnerability modeling and assessment in urban transit systems considering disaster chains: A weighted complex network approach. Int. J. Disaster Risk Reduct. 2021, 54, 102033. [Google Scholar] [CrossRef]
  6. Zhang, M.; Huang, T.; Guo, Z.; He, Z. Complex-network-based traffic network analysis and dynamics: A comprehensive review. Phys. A Stat. Mech. Appl. 2022, 607, 128063. [Google Scholar] [CrossRef]
  7. Zhang, W.; Xue, N.; Zhang, J.; Zhang, X. Identification of critical causal factors and paths of tower-crane accidents in China through system thinking and complex networks. J. Constr. Eng. Manag. 2021, 147, 04021174. [Google Scholar] [CrossRef]
  8. Qiu, Z.; Liu, Q.; Li, X.; Zhang, J.; Zhang, Y. Construction and analysis of a coal mine accidents causation network based on text mining. Process Saf. Environ. Prot. 2021, 153, 320–328. [Google Scholar] [CrossRef]
  9. Kopsidas, A.; Kepaptsoglou, K. Identification of critical stations in a Metro System: A substitute complex network analysis. Phys. A Stat. Mech. Appl. 2022, 596, 127123. [Google Scholar] [CrossRef]
  10. Wang, W.; Wang, Y.; Wang, G.; Li, M.; Jia, L. Identification of the critical accidents causative factors in the urban rail transit system by complex network theory. Phys. A Stat. Mech. Appl. 2023, 610, 128404. [Google Scholar] [CrossRef]
  11. Sui, Z.; Wen, Y.; Huang, Y.; Zhou, C.; Du, L.; Piera, M.A. Node importance evaluation in marine traffic situation complex network for intelligent maritime supervision. Ocean Eng. 2022, 247, 110742. [Google Scholar] [CrossRef]
  12. Sheikh, M.S.; Regan, A. A complex network analysis approach for estimation and detection of traffic incidents based on independent component analysis. Phys. A Stat. Mech. Appl. 2022, 586, 126504. [Google Scholar] [CrossRef]
  13. Li, M.; Liu, R.-R.; Lü, L.; Hu, M.-B.; Xu, S.; Zhang, Y.-C. Percolation on complex networks: Theory and application. Phys. Rep. 2021, 907, 1–68. [Google Scholar] [CrossRef]
  14. Suo, Q.; Wang, L.; Yao, T.; Wang, Z. Promoting metro operation safety by exploring metro operation accidents network. J. Syst. Sci. Inf. 2021, 9, 455–468. [Google Scholar] [CrossRef]
  15. Yu, X.; Liu, K.; Montewka, J.; Yu, Q. Causal Analysis of Ship Accidents in China Coastal Waters Based on Complex Network Theory. In Proceedings of the 2021 6th International Conference on Transportation Information and Safety (ICTIS), Wuhan, China, 22–24 October 2021; pp. 1425–1431. [Google Scholar]
  16. Wu, B.; Lu, M.; Huang, W.; Lan, Y.; Wu, Y.; Huang, Z. A case study on the construction optimization decision scheme of urban subway tunnel based on the TOPSIS method. KSCE J. Civ. Eng. 2020, 24, 3488–3500. [Google Scholar] [CrossRef]
  17. Santos, K.; Dias, J.P.; Amado, C. A literature review of machine learning algorithms for crash injury severity prediction. J. Saf. Res. 2022, 80, 254–269. [Google Scholar] [CrossRef]
  18. Ijaz, M.; Zahid, M.; Jamal, A. A comparative study of machine learning classifiers for injury severity prediction of crashes involving three-wheeled motorized rickshaw. Accid. Anal. Prev. 2021, 154, 106094. [Google Scholar] [CrossRef] [PubMed]
  19. Zhao, M.; Wei, Z.; Ji, S. Analyzing the causation of public accidents caused by urban logistics based on complex network. In Proceedings of the 2020 2nd International Conference on Machine Learning, Big Data and Business Intelligence (MLBDBI), Taiyuan, China, 23–25 October 2020; pp. 50–55. [Google Scholar]
  20. Guo, M.; Yuan, Z.; Janson, B.; Peng, Y.; Yang, Y.; Wang, W. Older pedestrian traffic crashes severity analysis based on an emerging machine learning XGBoost. Sustainability 2021, 13, 926. [Google Scholar] [CrossRef]
  21. Hamim, O.F.; Hasanat-E-Rabbi, S.; Debnath, M.; Hoque, S.; McIlroy, R.C.; Plant, K.L.; Stanton, N.A. Taking a mixed-methods approach to collision investigation: AcciMap, STAMP-CAST and PCM. Appl. Ergon. 2022, 100, 103650. [Google Scholar] [CrossRef]
  22. Habibzadeh, M.; Ameri, M.; Ziari, H.; Kamboozia, N.; Haghighi, S.M.S. Presentation of Machine Learning Approaches for Predicting the Severity of Accidents to Propose the Safety Solutions on Rural Roads. J. Adv. Transp. 2022, 2022, 4857013. [Google Scholar] [CrossRef]
  23. Zhang, G.; Feng, W.; Lei, Y. Human factor analysis (HFA) based on a complex network and its application in gas explosion accidents. Int. J. Environ. Res. Public Health 2022, 19, 8400. [Google Scholar] [CrossRef]
  24. Guo, S.; Zhou, X.; Tang, B.; Gong, P. Exploring the behavioral risk chains of accidents using complex network theory in the construction industry. Phys. A Stat. Mech. Appl. 2020, 560, 125012. [Google Scholar] [CrossRef]
  25. Chen, Y.; Deng, Y. Traffic accidents risk factor identification based on complex network. In IOP Conference Series: Earth and Environmental Science; IOP Publishing: Beijing, China, 2021; Volume 719, p. 032074. [Google Scholar]
  26. Li, K.; Pan, Y. An effective method for identifying the key factors of railway accidents based on the network model. Int. J. Mod. Phys. B 2020, 34, 2050192. [Google Scholar] [CrossRef]
  27. Zhen, Z.; Zhang, Y.; Hu, M. Propagation Laws of Reclamation Risk in Tailings Ponds Using Complex Network Theory. Metals 2021, 11, 1789. [Google Scholar] [CrossRef]
  28. Liu, Y.; Wan, C.; Yu, Q.; Liu, G. Risk Evolution Analysis of Maritime Traffic Accidents in Coastal Areas of China. In Proceedings of the 2023 7th International Conference on Transportation Information and Safety (ICTIS), Xi’an, China, 4–6 August 2023; pp. 665–671. [Google Scholar]
  29. Zhao, H.; Cheng, H.; Mao, T.; He, C. Research on traffic accidents prediction model based on convolutional neural networks in VANET. In Proceedings of the 2019 2nd International Conference on Artificial Intelligence and Big Data (ICAIBD), Chengdu, China, 25–28 May 2019; pp. 79–84. [Google Scholar]
  30. Hu, S.; Li, Z.; Xi, Y.; Gu, X.; Zhang, X. Path analysis of causal factors influencing marine traffic accidents via structural equation numerical modeling. J. Mar. Sci. Eng. 2019, 7, 96. [Google Scholar] [CrossRef]
  31. Lin, L.; Wang, Q.; Sadek, A.W. Data mining and complex network algorithms for traffic accidents analysis. Transp. Res. Rec. 2014, 2460, 128–136. [Google Scholar] [CrossRef]
  32. Sun, W.; Zhang, X.; Yuan, M.; Zhang, Z. Complex Network Analysis of China National Standards for New Energy Vehicles. Sustainability 2023, 15, 1155. [Google Scholar] [CrossRef]
  33. Li, Q.; Zhang, Z.; Peng, F. Causality-network-based critical hazard identification for railway accidents prevention: Complex network-based model development and comparison. Entropy 2021, 23, 864. [Google Scholar] [CrossRef]
  34. Yang, J.F.; Wang, P.C.; Liu, X.Y.; Bian, M.C.; Chen, L.C.; Lv, S.Y.; Tao, J.F.; Suo, G.Y.; Xuan, S.Q.; Li, R.; et al. Analysis on causes of chemical industry accidents from 2015 to 2020 in Chinese mainland: A complex network theory approach. J. Loss Prev. Process Ind. 2023, 83, 105061. [Google Scholar] [CrossRef]
  35. Duan, P.; Zhou, J. Cascading vulnerability analysis of unsafe behaviors of construction workers from the perspective of network modeling. Eng. Constr. Archit. Manag. 2023, 30, 1037–1060. [Google Scholar] [CrossRef]
  36. Li, M.; Wang, Y.; Jia, L.; Cui, Y. Risk propagation analysis of urban rail transit based on network model. Alex. Eng. J. 2020, 59, 1319–1331. [Google Scholar] [CrossRef]
  37. Lu, D.; Yang, S. A survey of the analysis of complex systems based on complex network theory and deep learning. Int. J. Perform. Eng. 2022, 18, 241. [Google Scholar]
  38. Moosavi, S.; Samavatian, M.H.; Parthasarathy, S.; Ramnath, R. A countrywide traffic accidents dataset. arXiv 2019, arXiv:1906.05409. [Google Scholar]
  39. Moosavi, S.; Samavatian, M.H.; Parthasarathy, S.; Teodorescu, R.; Ramnath, R. Accidents risk prediction based on heterogeneous sparse data: New dataset and insights. In Proceedings of the 27th ACM SIGSPATIAL International Conference on Advances in Geographic Information Systems, Chicago, IL, USA, 5–8 November 2019; pp. 33–42. [Google Scholar]
  40. Wang, J.S. KABCO-to-MAIS Translators-2022 Update; NHTSA: Fort Worth, TX, USA, 2023.
  41. Liu, Z.; Zhou, J.; Reniers, G. Association analysis of accidents factors in petrochemical storage tank farms. J. Loss Prev. Process Ind. 2023, 84, 105124. [Google Scholar] [CrossRef]
  42. Mi, X.; Shao, C.; Dong, C.; Zhuge, C.; Zheng, Y. A framework for intersection traffic safety screening with the implementation of complex network theory. J. Adv. Transp. 2020, 2020, 8824447. [Google Scholar] [CrossRef]
  43. Zhou, C.; Kong, T.; Jiang, S.; Chen, S.; Zhou, Y.; Ding, L. Quantifying the evolution of settlement risk for surrounding environments in underground construction via complex network analysis. Tunn. Undergr. Space Technol. 2020, 103, 103490. [Google Scholar] [CrossRef]
  44. Feng, J.R.; Zhao, M.; Yu, G.; Zhang, J.; Lu, S. Dynamic risk analysis of accidents chain and system protection strategy based on complex network and node structure importance. Reliab. Eng. Syst. Saf. 2023, 238, 109413. [Google Scholar] [CrossRef]
  45. Jamal, A.; Zahid, M.; Rahman, M.T.; Al-Ahmadi, H.M.; Almoshaogeh, M.; Farooq, D.; Ahmad, M. Injury severity prediction of traffic crashes with ensemble machine learning techniques: A comparative study. Int. J. Inj. Control. Saf. Promot. 2021, 28, 408–427. [Google Scholar] [CrossRef]
Figure 1. Framework for analyzing the causes of road traffic accidents and classifying accidents based on complex networks.
Applsci 13 12963 g001
Figure 2. Frequency distribution of accidents by state.
Applsci 13 12963 g002
Figure 3. Complex network model for causal analysis of road traffic accidents.
Applsci 13 12963 g003
Figure 4. Dividing the top five nodes with the highest degree of node according to the influencing factors.
Applsci 13 12963 g004
Figure 5. Dividing the first five nodes with the highest clustering coefficient according to the influencing factors.
Applsci 13 12963 g005
Figure 6. Dividing the first five nodes with the highest intermediary centrality according to the influencing factors.
Applsci 13 12963 g006
Figure 7. Dividing the first five nodes with the highest closeness centrality according to the influencing factors.
Applsci 13 12963 g007
Figure 8. The comprehensive importance of nodes.
Applsci 13 12963 g008
Figure 9. Comparison of the comprehensive importance evaluation models of three complex networks for road traffic accident causation analysis.
Applsci 13 12963 g009
Figure 10. ROC curves of the four models.
Applsci 13 12963 g010
Figure 11. Comparison of indicators of the four models in Ordinary accident conditions.
Applsci 13 12963 g011
Figure 12. Comparison of indicators of the four models in Serious accident conditions.
Applsci 13 12963 g012
Figure 13. Comparison of indicators of the four models in Major accident conditions.
Applsci 13 12963 g013
Figure 14. Sensitivity test of the four models in different types of accidents.
Applsci 13 12963 g014
Table 1. Node evaluation index of complex networks.
Network Evaluation IndexSpecific Description
Degree of node (D)Indicates the number of edges by which a node connects to other nodes.
Network diameter (S)Represents the maximum distance between any two nodes.
Average path length (L)Represents the average length of the shortest path between all node pairs.
Clustering coefficient (C)Indicates the degree of aggregation of the node in the network
Intermediary centrality (B)Indicates the adjustment ability and transfer function of the node between other nodes.
Closeness centrality (M)Indicates the proximity of the node to other nodes
Comprehensive importance evaluation (O)Indicates the comprehensive importance of nodes from a global perspective
Table 2. Road traffic accident influencing factors set.
Factor CategoriesNumberingInfluencing Factors
Time factor r 1 The accidents happened at daytime
r 2 The accidents happened at night
r 3 The accidents happened on Monday
r 4 The accidents happened on Tuesday
r 5 The accidents happened on Wednesday
r 6 The accidents happened on Thursday
r 7 The accidents happened on Friday
r 8 The accidents happened on Saturday
r 9 The accidents happened on Sunday
r 10 The accidents happened in spring
r 11 The accidents happened in summer
r 12 The accidents happened in autumn
r 13 The accidents happened in winter
Environmental factor r 14 The length of the road affected by the accidents was shorter
r 15 The length of the road affected by the accidents was longer
r 16 The accidents occurred on the left side of the road
r 17 The accidents occurred on the right side of the road
r 18 The environmental temperature during the accidents was low temperature
r 19 The environmental temperature during the accidents was moderate temperature
r 20 The environmental temperature during the accidents was high temperature
r 21 The environmental humidity during the accidents was dry
r 22 The environmental humidity during the accidents was humid
r 23 The environmental humidity during the accidents was wetter
r 24 The visibility of the display during the accidents was generally clear
r 25 The visibility of the display during the accidents was relatively clear
r 26 clear sky
r 27 cloudy
r 28 foggy sky
r 29 rainy day
r 30 snowy day
r 31 sandstorm
r 32 hailstone
r 33 Other weather
Traffic
management factors
r 34 There was an intersection near the accidents
r 35 There was no intersection near the accidents
r 36 There was a reducer belt near the accidents
r 37 There was no reducer belt near the accidents
r 38 There was a deceleration sign near the accidents
r 39 There was no deceleration sign near the accidents
r 40 There was a railway near the accidents
r 41 There was no railway near the accidents
r 42 There was a road safety measure near the accidents
r 43 There was no road safety measure near the accidents
r 44 There was a station near the accidents
r 45 There was no station near the accidents
r 46 There was a stop sign near the accidents.
r 47 There was no stop sign near the accidents
Table 3. Traffic accident injury severity type set.
NumberingSeverity of Injuries
a 1 Ordinary accidents
a 2 Serious accidents
a 3 Major accidents
Table 4. Specific configuration of machine learning models.
ModelSpecific ConfigurationModelSpecific Configuration
Logistic
Regression (LR)
Regularization typeL2Random Forest (RF)Number of trees100
Regularization intensity1Node splitting rulesGini
Maximum number of iterations100Minimum number of samples for leaf nodes1
Iteration termination error range0.001Minimum number of samples contained in internal nodes2
OptimizerIbfgs
Decision Tree (DT)Maximum depth8Extreme Gradient Boosting (XGBoost)Evaluating indicatorMlogloss
Minimum number of samples for leaf nodes1Learning rate0.3
Minimum number of samples contained in internal nodes2Maximum depth6
Node splitting rulesInformation entropySampling ratio1
Table 5. Evaluation indexes of different machine learning methods on different accident categories.
Method ModelEvaluating IndicatorOrdinary AccidentsSerious AccidentsMajor Accidents
Logistic
Regression (LR)
Precision0.680.540.13
Recall0.970.080.02
F1-score0.800.140.04
Decision
Tree (DT)
Precision0.730.560.12
Recall0.870.360.00
F1-score0.800.440.00
Random
Forest (RF)
Precision0.740.530.19
Recall0.830.410.05
F1-score0.780.460.07
Extreme Gradient Boosting (XGBoost)Precision0.740.560.25
Recall0.860.380.01
F1-score0.800.450.02
Disclaimer/Publisher’s Note: The statements, opinions and data contained in all publications are solely those of the individual author(s) and contributor(s) and not of MDPI and/or the editor(s). MDPI and/or the editor(s) disclaim responsibility for any injury to people or property resulting from any ideas, methods, instructions or products referred to in the content.

