1. Introduction
In recent years, the concept of Industry 4.0 (I4.0) has become increasingly popular in the business world, with this term referring to the fourth industrial revolution, a period of increasing digitalisation and automation that is increasingly revolutionising manufacturing industries. In essence, I4.0 is closely associated with the connection of digital systems to physical objects and equipment, giving rise to what are known as smart factories, thus making it possible to harness data and innovative technologies to significantly improve efficiency and operations in companies and organisations along supply chains [
1].
With the rise of the internet of things (IoT), a significant amount of data has been generated, and the ability to make full use of large databases is vital for any organisation. Alongside the IoT, the concept of big data has emerged, due to the large amount of data that companies must deal with in the context of their activity [
2].
Automation is playing an increasingly important role in modern manufacturing industries, providing an increasingly viable way for an industrial production company to maintain market competitiveness, and it should be noted that a key element in the implementation of automated systems in various areas of activity has always been the need for highly efficient product- and asset-tracking processes capable of increasing productivity for companies, including the physical tracking of goods within industrial facilities and the monitoring of their life cycles and the updating and management of their status [
3].
In recent decades, because of strong technological development, as well as the need to meet consumer expectations, there has been an exponential increase in the quantity and complexity associated with vehicle electrical systems and wiring, thus influencing the need to respond to these product challenges with greater complexity and the integration of new technologies by many companies operating in the context of various sectors along the automotive supply chain. Companies involved in the design and production of test and control media and equipment for all these electrical systems and wiring harnesses for automobiles are included in this scenario [
1].
Recent advances in IoT technologies such as radio-frequency identification technology already allow production management systems with real-time traceability, which are very visible and effective in terms of planning, execution, and control of the shop floor in smart factories. However, the amount of data to be collected via such technology has increased sharply, resulting in challenges in the realisation of analytical decision-making processes in the context of manufacturing industries [
2].
In turn, determining methodologies for extracting valuable information from production data to help identify problems and bottlenecks in production through the application of I4.0 technologies will be a key element in decision-making for achieving optimal operations. However, it can happen that various pieces of data, within the entire set of data to be managed in an organisation’s activity, are missing, incorrect, incomplete, or duplicated, depending on the type of system selected for traceability purposes [
4].
Some of the most recent technologies that apply the IoT to the automatic identification and collection of production data and to aid logistics and organisational decisions on the shop floor, including the technology mentioned above, are revolutionising supply chain management and production processes, above all by complementing or entirely replacing less advanced traceability methods, such as barcode technology, as the main system for locating and controlling objects and goods in an industrial environment [
5]. With asset management being a crucial aspect of any production operation and activity, without proper management of equipment and materials the production process under consideration can be undesirably interrupted, leading to delays and costly downtime [
6].
It should also be noted that, in addition to the recent drive towards mass customisation through the digitisation of products, production systems, and supply chains, as well as the significant contribution that automatic identification technologies play in these systems, there is an urgent need to assess the barriers to the successful adoption of more advanced technologies associated with the IoT [
7].
The main aim of this work is to analyse and assess a prototype tracking system designed for a specific section of the shop floor in a company specialising in the design and production of automotive wiring test and control equipment. This specific section is responsible for packaging products into boxes, considering various conditions for grouping items, using different types of boxes, and accommodating specific customer requirements.
The innovation introduced in this study involves the application of radio-frequency identification (RFID) technology as an alternative to the existing barcode system. The goal is to demonstrate the promising potential of the new RFID-based tracking system. This demonstration is achieved through intensive practical experimentation conducted directly on the shop floor. The intended impact of this research extends beyond the specific case study of this company. It aims to showcase how the practical application of the proposed tracking system can benefit not only this company but also other production industries with similar operational characteristics. The results and conclusions drawn from this study can be highly relevant and applicable across a broader range of production sectors that align with the study’s subject matter. Thus, this introduction highlights the application and the objectives of the case study. Also, there is an attempt to contribute to the research and development process for the system explored during the research, developing some parts to turn it into a viable option to be adopted even by small companies.
This article is organised into six sections. In
Section 1, the introduction is presented and the subject under study is outlined, as well as the respective framework, the main objectives of the study, the research methodology used, and the organisation of the document. In
Section 2, the state of the art of traceability systems, including the technology used and some applications of RFID are provided. In
Section 3, materials, both hardware and software and methods, as well as a brief presentation and characterisation of the company of the case study, are described.
Section 4 discusses the results obtained during the RFID test simulations carried out for the prototype fixed RFID reading system. Its performance and added value are also assessed.
Section 5 discusses the current technological status of the company, in terms of traceability, describes the implementation model used, and, furthermore, provides a quantitative and qualitative analysis of the results obtained with the implementation of a traceability system supported by the automatic identification and data capture (AIDC) technology applied in the study.
Section 6 concludes the paper and provides guidelines for future work.
2. State of the Art
This work uses deductive methods, supported by exploratory research, centred on a quantitative and qualitative approach, offering a mixed perspective. The literature review aims to identify traceability tools currently available on the market, and which best adapt to the needs of industrial companies, to identify the implementation models and feasibility analysis of these types of projects, and then draw conclusions. As for the type of research method used, already existing theories were used to serve as a basis for elaboration.
In turn, the review of the state of the art was prepared by searching scientific and research publications available in scientific databases such as IEEE Xplore, Scopus, Science Direct, and Web of Science. In addition, some documents published by organisations directly linked to traceability systems, books available online, and relevant institutional websites were also used.
The ability to track an asset from the start of a production process to the end on the shop floor is the definition of “traceability” in the context of this study. This step entails locating a specific product to support quality assurance, management, and the search for any irregularities in the procedures that are part of its manufacturing flow [
6].
The definition of traceability can take two different approaches, namely, at the level of [
5]:
Tracking: the process of following a product from the point of raw material consumption to the site of consumption, and the ability to localise or trace the course of a particular object downstream, i.e., through successive observations;
Tracing: the capacity to determine an object’s upstream origin, features, or history; it is typified by the ability to confirm a product’s historical status using its references and historical records.
Therefore, there are two different kinds of traceability applicable in this context: supply chain and internal. The former is limited to operations conducted inside the company’s boundaries and does not need to share external product information with other supply chain participants. The latter, however, tracks a product’s life cycle, where information and resources must be shared among the many supply chain phases of the product [
8].
Since this kind of system is fundamentally structured based on a combination of these two areas of work, inventory and information systems are the most crucial components of industrial traceability systems. Information might be the most significant aspect of an industrial manager’s performance since it guides their judgements about products to stock, market demand, production levels at the plant, and client demands. Here, traceability systems are crucial since they make the gathering of this kind of data easier [
3].
To maximise earnings for businesses and effectively adapt to market demands, traceability is necessary. Its objectives are to perform factory control over a specific product, document the different phases involved in its production cycle, ensure improved quality, increase supply chain visibility, and ultimately increase safety by lowering the rate at which products disappear, become misplaced, or are lost [
6].
While employing traceability systems has many benefits, some obstacles must be overcome when putting this kind of application into practice. High levels of sophistication in a traceability system might result in lost productivity because of the inclination for the business to adapt to the technology itself and the possibility of wasting time on things that do not add value to the firm. The implementation of a traceability system is also conditioned by initial investment and resistance to change. Regarding the former, automatic identification and data capture (AIDC) technologies, which necessitate hardware investment and personnel training, now enable most traceability systems. Regarding resistance to change, it is always a difficult business problem to encourage employees and occasionally upper management to adopt new perspectives. Apart from the above-mentioned obstacles, another problem is the intricacy of ensuring that the system is interoperable with other existing systems inside the company [
5].
Automatic identification technologies are necessary for a quality traceability system. These technologies are especially significant for traceability in the industrial setting, and they have grown in a way that has allowed for the automation of traceability processes over time, which has decreased the expenses related to data acquisition [
7]. There are several support technologies available at the moment, and the technology to be used must match the amount of data needed for its intended use. However, it should be noted that data management and transmission, along with the development of the most relevant solutions for each situation, are essential components of traceability systems [
9].
The acronym AIDC covers all technologies that allow the identification of objects and people through automatic data capture, i.e., the direct input of data into a micro-processor-controlled device, and many of these tools do not require human involvement. As already mentioned, the alternative to automatic data collection is manual data collection. This usually requires a worker to record the information on paper and then enter it into a computer using a keyboard. This situation has several drawbacks, not only regarding the data collection operation but also regarding data entry, the most notable of which are the following problems [
5]:
There is an average error rate when typing on a keyboard that reaches one error for every three hundred characters to be entered;
Manual methods are intrinsically more time-consuming than automated methods, but when manual practices are used, there is a time lag between carrying out the activities and entering them into the respective software, i.e., the information is not available in real-time;
Labour costs are associated with the time spent by workers on this type of action.
However, when the operation is aided by such automatic recognition technologies, these disadvantages almost completely disappear. Generally speaking, all automatic identification systems consist of three primary parts [
7]:
Data encoder—the component responsible for creating codes (a code corresponds to a set of symbols or signs that usually represent alphanumeric characters), so that when coding is carried out, the characters are translated into a code, readable by the respective complementary machines of the tracking system, which takes the form of a label attached to the objects to be identified;
Reader—a device used to read the encoded data;
Data decoder—a component that transforms the data read by the reader into digital data, so that the information contained in the code returns to its initial phase, i.e., it is presented in alphanumeric characters.
Barcodes and RFID are the most widely utilised AIDC technologies in industrial manufacturing. Their most frequent operational uses include receiving and shipping commodities, storing completed goods, keeping an eye on the production process, and performing assembly and quality control operations, among other things. Operators are needed in the application of a number of these technologies to collect data, usually by operating the identification equipment. For this reason, rather than being entirely automatic—that is, when no worker or employee needs to be involved in the process—these techniques that require human intervention are referred to as semi-automatic or partially automatic [
3].
On the one hand, barcode technology essentially consists of reading by optical readers, by emitting laser rays into the respective codes, with these rays being absorbed by the black bars or reflected by the white spaces (when they fall on the given barcode), where the sequence of bars, some narrower and others wider, represents the information contained in that code. This can be read, in turn, using a reflection effect from the “laser” emissions to the reader, which contains a photocell capable of converting the light into an electric current, obtaining an analogue signal that gives rise to a binary code, thus allowing the representation and transmission of information [
5].
There are different barcode schemes, so the main differences are the type of characters (only numbers or alphanumeric characters), the amount of data, the length of the bars, and the representation of the information in terms of structure (which can be linear or two-dimensional). Furthermore, the choice of the type of code to be used in a given context is directly related to the needs of its application [
10].
The constant evolution of technology and the growing need for companies and organisations to ensure that all data are included in the respective information flow, both externally (supply chain) and internally (organisation), to operate efficiently and consequently gain a competitive advantage in the market, presents barriers to the use of barcodes since the storage of information can become quite limited. Another barrier to applying this technology is the fact that barcode labels become damaged and unreadable. Humidity, dust, and high temperatures are generally characteristics of an industrial environment; these negatively affect the readability of the label [
11].
Other disadvantages that can affect the profitability of the operation include the fact that there can be no obstacle between the reader and the barcode, which can lead to the impossibility of performing multiple readings, i.e., the reading must be performed label by label. There is also the disadvantage of a much slower reading speed compared to RFID technology [
12]. Additionally, the barcode is no longer a technology for high-tech organisations, but an easy-to-use tool that can help any company that wants to use it simply. The cost of scanning devices and the amount of software required have decreased significantly [
13]. Despite its limitations, barcode technology is easy to apply, which is demonstrated by its widespread use worldwide over many years, as well as its low acquisition and integration costs. These factors can, therefore, be decisive when deciding which automatic identification and data capture support technology to implement [
14].
On the other hand, RFID is a technology that allows communication, identification, and data collection without any physical contact, but through radio-frequency waves. In the context under study, this technology can fulfil important functions with high profitability and operational flexibility, meaning that it can identify and collect data and location information in real time without any human intervention [
15]. It can be used in various processes along the supply chain, with different impacts at each stage, and it should be noted that some of the most valuable applications in the context of supply circuits are as follows [
6]:
Simplifying the monitoring of industrial production flows and stock management, since RFID helps to better localise products, updates in real time, and automates operations, thus increasing confidence in decision-making related to supplies;
In the logistics process, this technology can make it possible to increase efficiency by speeding up the delivery of products or raw materials, automating the operations of receiving and dispatching goods, thus eliminating operations that do not generate value for the organisation, saving time for employees to focus on activities that add relevance to the business;
Concerning the end customer, RFID can provide visibility and product information at any point in the supply chain automatically and assertively, thus improving the reliability of the information flow.
An RFID system is essentially made up of one or more readers and tags. The first readers are responsible for reading the tags within their reading radius, so both components are systems for sending and receiving information and can be classified as “transceivers” [
16].
The type of reader in question, in addition to its main function of detecting RFID tags and communicating with them in its interrogation zone, checks that it has a region, or diameter, where such communication can be established between the reader and the tag. It is also responsible for activating, powering up (if necessary), and structuring the communication sequence with the tag to establish the data transfer operation. The RFID tag is the simplest component of the system, which can take on various shapes and sizes. Its purpose is to identify the item or object on which it is placed using its unique ID. It consists of an integrated circuit and an antenna, which are physically connected to its chip. The integrated circuit is the essential component of the tag, as it is responsible for transmitting information when it is activated [
17].
RFID tags can be categorised according to their power and communication capacity. On the one hand, a passive type of tag has no built-in power, using its incident radio wave as a modulated backscatter signal (a technique commonly used in RFID systems in which incompatible loads are used to reflect the incident radio-frequency signal back with amplitude and/or phase modulation) and needs to be within range of an antenna to be operational. On the other hand, an active-type tag has built-in power that can transmit signals and provide a higher degree of localisation accuracy, but it requires power sources and is, therefore, more expensive to install and maintain [
18].
For product traceability, it may in many cases only be necessary to know when a product or asset has entered and left specific areas (in the context of industrial production processes), something that can be achieved using passive RFID tags on products and a reader antenna in those areas that require monitoring [
19].
In turn, when using RFID tags, it is important to consider which tags to use and where on the products they are placed, since certain materials (particularly metal and liquids) can cause interference. This can be avoided by using the most appropriate tags for each case. You can then consider the following distinction (in terms of the activation mode required) between the two types of labels [
18]:
In passive tags, the antenna energises and activates data transmission;
On active labels, the antenna only activates data transmission.
Returning to the RFID reader devices, this component is the most complex because it is responsible not only for reading the information transmitted by the tags but also for communicating with external agents, i.e., transmitting the data received to the respective servers [
20]. In turn, some of the obstacles to the adoption of this technology include the following aspects: the phenomenon of electromagnetic interference, in the sense that automatic identification and data collection through RFID, for its success, also depends on the type of objects in which the tags are inserted, where objects with metallic or liquid content may absorb the radio-frequency energy emitted by the reader, causing shorter transmission ranges or even the product not being identified; and, in terms of sustainability, the non-recycling and non-reuse of the tags may be a condition to be taken into consideration, so that if the tags are integrated into the object to be identified, it may not be possible to use them again, and the non-reuse of electronic waste (which includes these tags) may constitute a serious environmental risk [
21]. In addition, the fact that the technology under study uses different operating frequencies in different parts of the world could make interconnection and compatibility between equipment significantly more difficult [
22].
In this context, the received signal strength indicator (RSSI) is a measure of the power received from the return signal of an RFID tag when interrogated by a reader. The RSSI is an important but often misunderstood property of a radio-frequency identification system [
22].
Concerning a set of other parameters associated with the RFID reading and identification process and the performance statistics of this traceability system, which are also relevant in this context, there is a parameter
which briefly specifies the number of RFID tags to be present in the reading field of the signal pick-up antenna to be considered in the RFID reader and, in turn, which of these tags should be detected in the process [
23]. In this sense, the value of
is communicated to the tags by the RFID reader, where in turn each of these tags selects a random communication slot from
for its response. For the tracking and inventory process to be carried out as quickly and efficiently as possible, as many of the
communication slots as possible must be occupied by the RFID tags, but without multiple occupations of these slots, which would lead to collisions in the context of data transmission between the interconnected RFID components in the AIDC system [
24]. In turn, if the reader detects that the value assigned to
is too large (where hardly any communication windows are occupied) or too small (where unwanted collisions occur), it should be automatically adjusted and loaded onto the tags (with a range of values for
from 0 to 15, by definition). Since this type of adjustment can be time-consuming and possibly inconvenient in terms of tracking activity, the reader with this configuration parameter must be properly configured and informed of the approximate number of RFID tags expected to go through the antenna-field-reading process. In this way, setting the right value for the number of communication windows right from the start of the traceability process proves to be the ideal scenario [
25].
As for another parameter corresponding to the session, tags have an electronic product code (EPC), a standard created to facilitate the unique identification of products and objects worldwide, based on RFID technology (and aimed at improving efficiency and visibility in the context of the production chain), of the EPCGlobal Class 1 Gen 2 type. In the context of the radio-frequency reading system, they support four different sessions, considering that in each session a respective inventory flag can be assigned to an RFID tag to indicate whether that tag has already been detected by the reader as part of an asset-tracking and inventory process. These inventory-level flags have different properties depending on each session, something that allows for the recognition of a long persistence time interval associated with each of these sessions [
26].
The data captured by RFID has several characteristics that fit into the concept of big data, which is increasingly prevalent in the panorama of information and data in large quantities that industries must consider and manage today. On the one hand, the volume of data generated will become enormous as production activities are carried out in the context of a smart factory with RFID integration, commonly reaching hundreds of RFID data points. On the other hand, RFID data in its presentation through the EPC code is often very abstract information, when considering the use of a hexadecimal format (numbering system with 16 symbols or possible digit values from 0 to 9, followed by six alphabetic characters, assuming only letters from A through F). This presentation of product data information, which is intended to be subsequently interpreted in the most optimal way possible for decision-making in production, makes the response information in the format not ideal for the needs and objectives of management activity at the industrial level. In addition, RFID data are almost always interconnected with other production-related information, including technical drawings, production orders, and purchase orders, which are difficult to process using other types of approaches that are not adapted to managing data in massive quantities [
27].
For making a direct comparison of some of the characteristics that have the greatest impact on decision-making when implementing the information traceability methodology within an industrial company (such as the one that constitutes the case study in which the internship was carried out, in an industrial shop floor environment), the following considerations are made. The estimated cost of implementing or designing any project is an important variable for any company when making decisions. RFID technology involves high costs compared to barcode technology. In an industrial context, the purchase price of all the hardware needed to implement an RFID-based system can reach several thousand euros, making it imperative to carry out an economic balance and cost/benefit analysis to assess the real applicability of the technology [
28]. In this sense, there are production indicators and process performance measures that can be of great help in making decisions regarding the implementation of projects that directly influence operations at the company level, so it is possible to highlight the following common metric that is relevant [
29]: production performance. This assesses the speed of production, i.e., the ratio between the time dedicated solely to production and the total time worked, which is the sum of all activity times, and may include, in addition to the duration of production, downtime due to maintenance, faults, recording information and transport movements, among others. Even human labour time and the energy required for manual data processing are seen as resources that can be incorrectly used by the industrial company to be considered, since there are techniques that make it possible to automate this type of operation, aiming at all costs to fully or partially identify and reduce this waste as much as possible, although it is not possible to eliminate it.
For its part, RFID, regardless of the monetary costs involved, is the most attractive technology to adopt due to its extensive capabilities for fully automatic traceability. However, according to the above description, it is essential to carry out a more in-depth analysis of the specific traceability needs that exist according to the real case study (because although the barcode does not offer as many advantages when compared to RFID, it may be sufficient in the face of the requirements of its intended purpose) [
28].
2.1. Industry 4.0 Solutions Network
The following is a very brief approach to an Industry 4.0 solutions network (I4.0SN), considering the existence of a set of sequential phases, which, following a theoretical and conceptual case study, was proposed in order to respond to a challenge in an industrial context and on the shop floor of a company that produces test equipment for the wiring industry (a type of company that fits into the industrial reality under study) [
1].
To this end, to come up with a credible solution that could be implemented in a real-world context, a series of pieces of information inherent to the company that are highly relevant to the study were collected beforehand [
1]:
The existence of a production process characterised by high setup times and a high number of activities that depend on a worker’s decision-making;
The presence of such a company in a highly sought-after market in terms of personalisation, where constant technological innovation and the search for competitive advantage become key issues to be developed;
A scenario in which almost all products are associated with a specific order, and in which there is rarely a second order for a product with the same characteristics;
The existence of production orders that do not exceed five units per product, and orders associated with a single unit are common; a scenario in which the raw material used for production goes through several machining phases, in which several different industrial machines are used; and, the verification that each product results from the assembly of multiple specific parts, which in turn must be inserted into a given defined project, at the level of its production, since each project has a unique set of parts.
In this context, there was an effort by [
1] to guarantee the solution’s compatibility with a wide range of industrial realities, to create and structure a type of production system, with the integration of a set of I4.0 technologies flexible enough to meet the specific requirements of each client and achieve a reduction in various activity times at the level of the production process in various phases without compromising the flow of the respective production system to be considered (in an approach aimed at mass customisation). The I4.0SN, therefore, consists of a set of six main stages (identified by numbers from 1 to 6 in
Figure 1), with the possibility of integrating an additional stage of importance in certain cases (including a extra feature stage, numbered 5.1 in the figure), connected by the organisation’s network, in an IoT-based approach [
1], as can be seen in
Figure 1.
A worker’s identification at the workstation (stage 1) is the initial step in the network system. To begin working at a certain workstation, an employee needs to have their own special RFID card. This allows each workstation to have a unique RFID reader that is linked to a unique ID. Following the card’s reading, the company’s database automatically saves details about the time and workstation that a particular employee claims to be using [
1]. This approach can be very helpful in calculating the cost of a particular process phase, but it does not have a significant effect on the production process itself. Furthermore, by giving accurate information on the productivity of employees and workstations, these data may benefit the company’s human resources and logistical departments [
1].
For the project folder with integrated QR (quick response) code (stage 2) operation within the network system, all project-related data (such as drawings and built-in materials) that are kept in the company’s database must be associated with a QR code ID [
1].
These days, most shop floors save this kind of information in actual folders containing numerous worksheets. The current proposal eliminates the need for physical paper by reducing it to a single sheet containing the project’s identification and delivery date, along with a printed QR code that allows access to all remaining digitally available information. At this point, right after the reading device scans the QR code, the company’s network sends two crucial pieces of information: the QR code ID, which is connected to the details of a particular project, and the QR code reader’s ID, which is linked to a particular stage of the production process. This method removes the need for large volumes of paper, which is a significant benefit considering the growing worries about environmental issues, particularly in the automobile sector. It also serves as the foundation for an automated smart production system, to be described over the subsequent stages. Finding out the stage of the machining process the project is in at any given time is the goal of the informatic system of process phase identification (stage 3). This is made possible by the fact that each QR code reader has an ID linked to a specific stage of the production process; typically, this ID is all that is required to determine the stage of the process [
1]. Nevertheless, this method wastes resources and constricts the entire manufacturing process’s path at workstations—such as those equipped with CNC machines—where it is feasible to execute many production phases. For these workstations, an alternative method that makes use of counting software is used to identify the process phase. This software records the number of times a particular QR code has been read by a QR code reader connected to CNC-like workstations. It is activated each time a QR code is scanned by one of these readers. The procedure phase is then subtracted by considering the ID of the QR code reader and the number of readings that kind of reader has completed [
1]. Next, the primary goal of the informatic system of project information selection (stage 4) within the network system, which takes place concurrently with the previous one, is to use the relationship between the QR code ID and the project information—which was covered in the second section earlier—to obtain that information. When a QR code ID is successfully scanned, an IoT network command is generated that encodes the task of choosing the project details linked to the QR code ID from the company’s database. The data are then transferred once more via the network to all the parts participating in the tasks that call for it, specifically the CVS (computer vision system), the automated drawing opening, and the informatic system of production phase identification [
1].
Combining the outcomes of the third and fourth stages of the network system enables the drawing’s automatic opening (stage 5) operation. It is feasible to access and open the drawings needed at that workstation to work on the components engaged in that phase, by those drawings, given the identification of the present productive process’s phase and all the project’s information [
1].
An additional functionality for workstations with CNC machines is proposed (the 5.1 substage presented in
Figure 1). These machines require access to CAM (computer-aided manufacturing) programs, which are typically accessed manually by searching through numerous digital folders. The automatically opened drawings of the pieces in the proposed network system has a hyperlink that, when clicked, opens the CAM program and the auxiliary sheet (commonly utilised in these situations) [
1].
Once each item has been machined, after each phase, the computer vision system (stage 6) is the last step; it outlines the workflow that the network system promotes. Its primary goal is to verify the quality of each piece’s unique characteristics, including height, depth, number of holes, and length. To complete this assignment, the item is assessed using a computer vision system that examines each of the properties. If all the features fit the project’s specifications, which are input into the system’s software, a green light shows on the computer’s screen. The moment of approval indicates the completion of the machining process for that component, which is then registered and kept in the database of the business. On the contrary, a red light and a list of the problematic elements show up on the screen if the piece does not meet the project’s specifications [
1].
In turn, by properly integrating RFID technology with the QR code—a two-dimensional barcode that can be easily read by a digital device and stores information in the form of a series of pixels in a square grid (often used to locate product information in a supply chain)—the system automatically provides the codes that are needed at that specific workstation and at that specific time, avoiding information overload. The codes are then automatically displayed on a computer screen at that specific workstation, and the machining process for each part is carried out, according to the given information now contained therein. Finally, the parts are subjected to an automated quality control technique based on a CVS, which compares the characteristics of each part with their respective drawings, achieving the ability to identify any possible defects or faults, and to report them accordingly. Therefore, this flow of tasks takes place at every workstation in the machining process [
1].
2.2. Application of RFID Technology in Warehouse Logistics
The case study of the implementation of RFID technology within a logistics warehouse, according to [
30], is also a relevant case to be presented in this state-of-the-art context. Indeed, when rapid and precise control, tracking, and accounting of numerous movements of various objects are required, the technology in question, in fact at all stages of the movement of goods, makes it possible to optimise business processes, considering, for example, electronic control of access to and movement of assets and material flows on company premises, as well as the management of warehouses (especially large ones), among other cases.
In warehouse complexes, it becomes possible to facilitate the process of preparing, processing, and despatching orders, as well as increasing the accuracy of inventory control. The main aim of implementing RFID technology in a warehouse is to reduce costs through automatic data collection. The technology in question allows tag data to be read beyond the line of sight and through obstacles, and its advantages over barcode technology in the context of the study are as follows [
30]:
Ability to read labels without human participation, which reduces the number of errors caused by the human factor;
Possibility of adding and changing data in the tag’s memory, which prevents the loss of the object’s electronic passport;
It allows group operations to be carried out, thus reducing processing time;
It provides information on commercial events in real time, which makes it possible to apply the principles inherent in the just-in-time philosophy (a production system aimed at the total elimination of waste to achieve the best possible quality at the lowest possible cost and with the lowest possible consumption of resources).
Figure 2 shows the scheme for implementing RFID technology in an industrial warehouse, as well as a simple approach to the advantages of introducing it into the logistics process compared to barcodes, based on the information contained in study [
30].
According to the authors of the study, by integrating RFID technology it is possible to reduce the time spent on internal warehouse operations, such as accepting and registering the necessary documentation [
30].
Figure 3 shows the time savings in the context.
In addition, the introduction of RFID technology makes it possible to reduce the time it takes to process and despatch a bag or box. Thus, with the introduction of RFID technology in the supply chain, the efficiency of box processing, compared to using the barcode during goods acceptance, increased by 5.68 percent [
30].
It should be noted that, contrary to the advantages of applying RFID presented above, the following problems can arise when applying RFID technology in warehouses and an industrial production context [
30]:
The high cost of RFID tags;
Computer threats that can disrupt warehouse operations;
Potential hacking, when anyone who has received a product with a label can access the database;
Excessive demands from potential users.
It can, therefore, be concluded that the diffusion and introduction of RFID technology in warehouse logistics will make it possible to restore order in warehouses and carry out inventory control in real time, provided that the warehouse infrastructure is adapted to the new technologies, not forgetting the difficulties that may arise as a result of factors such as prices and the excessive demands of potential users [
30].
2.3. Application of RFID in a Simulated Production Line for an Industrial Context
A third experimental case study is the implementation and testing of RFID technologies in the context of a suitably simulated industrial production environment within a learning factory (as an educational unit within an engineering faculty at a university in Canada), to demonstrate the potential of digitising production processes from an I4.0 perspective and optimising the activities of companies and organisations in engineering and industry.
In this context, four different products were designed and manufactured in this learning factory, namely, a pneumatic linear actuator, an internet of things board (essentially the basic hardware and software components on which IoT applications can run and function), an electronic screwdriver, and a solenoid valve (an electromechanical control valve normally used to control the flow of a liquid or gas). The implementation of an RFID system within a production line for one or more of the products considered, to improve the traceability process, was the subject of research and analysis in the case study in question [
31].
The components that make up the solenoid valve are as follows: the valve body with inlet and outlet ports, a solenoid coil with housing, a plunger, and a spring. In this context of characterising the product in question, the valve body is manufactured using a metal powder laser sintering process (carried out by additive manufacturing) and then finished using a CNC machine tool. The piston, on the other hand, is produced using additive manufacturing on a metal 3D printer or cut using a CNC machine. In addition, the solenoid coil housing is manufactured using a plastic 3D printer or an injection moulding process. Indeed, this flexibility of the learning factory in question to demonstrate the production of a product using multiple manufacturing technologies can demonstrate the reality of flexible manufacturing processes in an appropriate way [
31].
Figure 4 shows an image of the inside of the learning factory (which is relevant to the present study because the internal environment visualised in the factory in question largely resembles the internal industrial environment of the company where the case study was carried out, particularly along various sections of the shop floor). The case study was developed at Dinefer S.A., a company specialising in cable test equipment production.
Continuing with the content of interest about the application of RFID and digitisation of the production process in the case study, each of the above-mentioned production stations along the manufacturing line has access to RFID and QR code or barcode technologies. Thus, each component produced can be associated with an RFID tag, a QR code, or a barcode (or both), and, in turn, the information related to the completion of the processes associated with the respective workstation in question can be developed in two ways, namely [
31]:
By properly tracking the system, keeping the product’s RFID tag unchanged, and storing the data related to the process in the respective production execution system;
By changing the data stored on the label when the manufactured components leave the production plant.
Both approaches provide adequate information on the stage of the production process that has been completed for the respective components in question. Therefore, since the system installed in the learning factory can implement both methods considered, the relevant approach to analyse (and the one that was applied in the experimental study) corresponds to that of the traceability system [
31].
Following the production flow under study, the solenoid valve components need to be assembled. In this sense, a respective production scheduling order (a vital process that involves creating a proper timetable that defines a specific order of production activities) created through the aforementioned production execution system is then sent to a specific scheduling system (electronic Kanban, a type of information transmission system that ensures that each workstation produces only what is needed for the next workstation along the production flow) that includes a physical storage station and manages the inventory of components in the context. Considering the use of a type of box (electronic Kanban kits) intended for the transport of individual components that need to be manufactured, assembled, tested, or prepared for packaging, the following aspects are realised [
31]:
Each box of this type includes a physically applied RFID tag. Each manufactured component placed in the kit is identified via barcodes or QR codes printed on labels attached to each part or printed directly on the physical parts;
Each set (box) is moved from one production station to another, and when a set arrives at a given station it is registered—a process that consists of reading the RFID code of the given box through an RFID reader and storing the information about its arrival in the respective database of the production execution system considered;
Once all the physical components included in each box have been processed at the respective workstation, they are placed back in the box and the box is then checked out, according to a process that involves updating the production execution system database related to that box;
When all the production processes related to the components stored in one of these sets have been completed, the box can be reused for another set of components and the RFID tag is rewritten.
In turn, the integrated information technology/operational technology (IT/OT) infrastructure built at the learning factory makes it possible to overcome some of the challenges in adopting and implementing RFID technology, particularly concerning the risks of interference with other radio bands; the selection of tags and memory size limitations; the integration of RFID technologies into an industrial automation platform; and the use of microservices in favour of implementing RFID technologies [
31].
When implementing ultra high frequency (UHF)-operating RFID technologies in specific areas, it is necessary to consider the risks of interference with other technologies at the level of radio-frequency bands in an industrial environment. In turn, applications that use frequency bands that are susceptible to clear interference (in this context of operation in equivalent frequency ranges) can be interrupted or prevented from working properly by any ultra high frequency RFID (UHF-RFID) device, in fact corresponding to a type of strong RFID reader [
31].
The learning factory uses devices that utilise wireless radio-frequency technology along with 12 UHF-RFID readers. In turn, each of the readers in the factory under consideration had to be configured for the power and frequencies that facilitate successful integration with other technologies. For an optimised design, each reader was configured for a single frequency band to operate with a minimum separation of 2.0 MHz between any devices. In addition, the operating power was also optimised for read and write operations to avoid further interference. The tags were processed in 300 milliseconds and the data were available for immediate processing of the tag information. The learning factory can use different types of RFID tags and the corresponding readers for different operations and applications, with the operating parameters varying according to the different types of RFID devices being applied [
31].
To this end,
Table 1 shows the results of the read-range tests for these types of RFID and tag technology. Also,
Table 2 shows some tests carried out on RFID tags in the context of the industrial production environment and the various types of interference that may exist.
Proper selection of an RFID tag requires a good knowledge of the tag standard, the memory structure, and the information that can be written and read. Manufacturing processes that have utilised RFID technologies have used UHF-RFID readers along with second-generation tags, with most of these tags being passive and able to be written anywhere in the supply chain. All the memory banks, apart from the user memory, are used to edit the labels during the production process. In turn, the EPC code associated with these RFID tags provides the primary product labelling function, while the respective RFID standards allow translations between RFID codes and QR codes/barcodes, thus facilitating the ability to transfer location data to parts after a process has been completed. This flexibility in using RFID codes makes it easier to track a part during production and is possible for various types of industrial systems [
31].
In addition, each manufacturing station integrated into the factory has its control platform including a programmable logic controller and associated hardware (input/output modules, communication modules, and a human–machine interface module). In addition, the programmable logic control platform is used to monitor and control the operations taking place at the production station in question, to communicate with the RFID readers, and to access specific client software capable of transferring this information to a centralised server system using a database to trace the sequence of the production process, thus ensuring easy traceability of the components manufactured and paving the way for the integration of I4.0 into production systems [
31].
3. Materials and Methods
To introduce a more detailed understanding of the company and the workplace environment in which the experimental case study was applied, the first subsection is presented. Afterward, the actual materials and methods are presented and described.
3.1. Workplace Environment Description
The company selected for the practical work, named Dinefer—Engineering and Industrial Systems, S.A., founded in 1988 and based in Castelo Branco, Portugal, has its main activity in the design, production, and commercialisation of industrial test and control equipment and systems, mainly for the wiring industry, but also for industry in general.
As far as the company’s products are concerned, Dinefer supplies its customers not only with a range of standard equipment for which there is more regular market demand, such as test tables and electro-pneumatic modules, but also with a range of test equipment that is classified and labelled as special products. The latter range is characterised by much less regular or possibly unique requests and a high level of customisation, including products such as high-voltage (HV) test tables, vision modules for use in electric vehicles, test tables for sliding car doors, equipment for quality testing of junction boxes for electric car batteries, among others.
Figure 5 illustrates some of the company’s main products.
Dinefer is a medium-sized company, employing a total of one hundred workers at its headquarters and with a turnover of around ten million euros. Its industrial facilities cover an area of around 3000 square meters, and it is also a multinational corporation.
Regarding its production process, the following sequential phases are considered:
Commercial, in which the initial interaction with the customers takes place and requests are received, acting as the starting point for the entire subsequent workflow;
Industrial engineering, with the opening of works with the specifications and technical requirements for the development and manufacture of the product;
Drawing/project, with the design of the product, following the criteria previously defined by engineering;
CAM, with the generation of the necessary programs according to the drawings prepared;
Preparation, with the materialisation of the information necessary for the manufacture of the product;
Production of parts and components, using cutting, CNC machining, milling, and metalworking processes, among others;
Assembly of all the machined parts and warehouse components;
Electrification, with the combination of the mechanical for its proper electrical and pneumatic operation, verifying the electrification process of pneumatic modules, among other components and quasi-machines;
Quality control and functional tests of the products, verifying their operation by the pre-established requirements;
Shipping, preceded by the packaging process, with despatch to the customer.
The demands of its customers, combined with respect for the organisational values of its business, have contributed to improved efficiency and also to the company’s sustained growth, driven by cross-border sales, with the start of its internationalisation in 1996. As a supplier of industrial solutions tailored to the needs of each client, the company believes that, along with competitive prices, improving quality and reducing the time it takes to produce its products are key factors in increasing client satisfaction.
The company has even developed its own management software, named “SIGDIN”, which allows its customers to monitor production in real-time. Through the reserved area inherent in the management system in question, it is possible to access the following content: download of technical files; order history; the status of customer requests still in progress, during their production up to the final finished state; and more.
3.2. Materials
Regarding the set of material resources used in the work, both hardware and software elements were used, as will be seen below.
3.2.1. Hardware
As for the hardware and physical equipment used, the company’s fixed and portable computers were used, with access to all the software. A range of physical equipment was also made available, some of which was designed and produced in-house, concerning radio-frequency identification technology and its operationalisation in the context of work in a professional environment. These physical resources are described in the following sections.
On the one hand, the Brady FR22 device is the centrepiece of a new approach to fixed RFID reading systems with a modular design, allowing different use cases for different segments, depending on the modules or accessories that are connected to it [
32].
Figure 6 shows the structure of this RFID reader.
The drawing of the Brady FR22 reader with its dimensions as well as a set of technical specifications are shown in
Appendix A. This device has a built-in computer with the Linux operating system and connection to a high-definition multimedia interface display, which allows the installation and operation of third-party applications and makes the system much more scalable and controllable than conventional RFID readers. The system in question essentially provides fast and reliable on-board computing with support for customised embedded applications; extensive communication options that allow flexibility in system design and no need for external connectivity hardware; a new RFID engine operating in the UHF band and based on the latest technology corresponding to Brady NUR3-1W; the development of built-in web applications with a user interface, thus eliminating the need for an external laptop; and connection to external devices, sensors, triggers, among other components, as well as a complete set of application programming interfaces available to control the RFID reader in question [
32].
The Brady FR22 equipment needs external RFID antennas to work (to extend its capacity and field of detection of radio-frequency signals, so that the process of reading RFID assets and tags is carried out properly), so although it can work with any standard UHF-RFID antenna, it is suggested to use Brady Rain RFID antennas [
32].
Figure 7 shows the structure of these antennas, as well as a set of technical specifications relating to this type of equipment.
In
Appendix A, there is also the drawing of the RFID antenna and the orientation patterns of the radio-frequency signals in the transmission of this antenna to show which angles and positions in the region covered by the system’s reading will be most likely to identify the RFID data most effectively. Also noteworthy is the possibility of accessing and utilising a significant number of passive RFID tags (created to be read by devices suitable for the radio-frequency reading process) when operating the RFID reading hardware system under analysis [
32].
Continuing with the description of the physical materials used for the RFID system proposed for prototyping, to assess the correct functioning and capacity of the new traceability system under study, to be structured for application in the company’s packaging section, a gantry structure made of steel was created internally on the factory premises using various cutting, metal forming and other processes (as part of production on the factory floor). This is intended to support the RFID reader and the RFID antenna coupled to each other and, in turn, with the antenna coupled to an appropriate support. This will be the component that will be directly attached to the gantry, thus assuming a system in which products and assets with RFID tags can pass under this structure. This passage will probably be carried out using transport trolleys to place these products in boxes, simulating a simple logistics procedure in the context of industrial activity.
Figure 8 shows the complete structure of the gantry RFID reading system.
In this context, it should be noted that during the RFID system simulation tests, the position and orientation of the reader and antenna were changed, assessing the possible significant differences in the capacity and effectiveness of reading all the RFID tags. Different cases were considered, of the reader positioned on the top horizontal profile, on the diagonal profiles at the top of the gantry, on the vertical sides of the gantry (positioned more towards the centre, aligned with the top or closer to the base), and also considering different orientation angles in the same or opposite direction to the side of the gantry where the assets will be considered to pass under the system’s reading field first. Also, the 2D drawing sheet of the main gantry structure for the RFID system is shown in
Figure 9.
And, since it was also necessary to use two spacers to create the necessary distance between the structure of the aforementioned support and the connected RFID antenna (leaving enough space between the two components for the RFID reader to be present in the middle of them, attached to the antenna, using nuts and bolts to connect all these components), it was decided to also include the 2D drawing sheet of these spacers in
Appendix A.
Continuing with the description of the hardware used, there was the use of a set of RFID tags, in this case corresponding to UHF-RFID type tags. As the name suggests, the tags in question work with radio-frequency waves in the ultra high frequency range.
Figure 10 illustrates the structure of the type of labels mentioned, including an image of the roll of labels available for use during the case study.
The RFID tags used are already considered to be of superior quality compared to other types of tags on the market, and it is expected that the reading speed and efficiency of RFID communication to be achieved using them will be very positive, while still allowing for an adequate cost-effectiveness ratio (very much given the purpose and scale of their use to be considered for the entire RFID system to be planned for application in the company’s internal industrial production context). However, the model of tags used is not the absolute best currently available. Another type of RFID tag that could be trialled during the case study at the company is not only significantly more expensive in terms of the unit cost of each tag but also has important properties that are not found in the UHF-RFID B-423 type that was studied. These properties turn out to be more advantageous in certain respects (in terms of being specially adapted for application on metal and being able to be read effectively on surfaces of this type, without being affected by electromagnetic interference phenomena, a point to be emphasised below).
Alongside the main content explored and investigated in the practical work on the shop floor, it is considered that (if the RFID system is identified as an asset) the traceability system could make occasional use of these other, more expensive, tags (whose quantity purchased has also been reduced, with the company making a greater commitment to purchasing the main type of tags) in certain specific cases (helping the process and avoiding problem scenarios in the operation of the new system using RFID identification technology).
It should also be noted that another type of tag was also tried out early on in the practical work, a model that, compared to the others, would be the least advantageous and would not be suitable in terms of other characteristics (speed, range, electromagnetic interference), which was (as mentioned above) bought by the company in a few units for the sole purpose of testing and carrying out experiments in favour of implementing the final system.
The set of the company’s products (assets) used for testing and experimenting with the RFID reading system is shown below, by applying RFID tags to all these products, in
Figure 11. The tags were glued mainly and exclusively to the surfaces of the assets made of non-metallic materials (inserting them into the surfaces made of PVC plastic material). In addition, RFID tags were glued to small plastic bags with an asset inside in the case of two of the test elements. And, except for the aforementioned cases, a final label was applied directly to the metal (aluminium) surface of the respective product, in the total sample of assets to be tested, corresponding to a total of 15 sample pieces.
As part of the above reasoning, one of the 15 pieces under study was then purposely labelled with an RFID tag glued to a metal surface to ascertain the real influence of this factor. Through the experiments to be carried out in the final phase, the intention was also to assess the possible additional interference of the metal surfaces of the products (especially those whose constitution was denser in metal, aluminium, or brass) on the good reading and identification of other tags (on other assets in the sample) that would be “covered” by the metal (in some of the pieces still with some thickness), overlapping between them and the antenna.
In addition, other possible elements and sources that could affect the effective and correct identification and collection of information (from the EPC codes) on the test RFID tags were taken as initial hypotheses for the radio-frequency reading simulations.
Finally, from a perspective less related to the problem under study, the case study company products that were used for the tests were mostly electro-pneumatic modules. This is still the type of product that constitutes the company’s core business, with the highest sales volume.
The two assets that remained in plastic bags correspond to items in which it was not possible to insert RFID tags to identify them on a non-metallic surface. These two assets correspond to objects made of aluminium on their entire surface. It is assumed that, for the type of traceability process to be explored, RFID tags (as with printed barcodes, which are also attached to the items themselves) should be placed directly on the objects or products that they will uniquely identify, and that this is the appropriate way to go about it. However, the fact that these labels were affixed in the way indicated above (on the bags) gave rise to a feature that also turned out to be useful for test results that were relevant to evaluating how RFID reading works. Many products that are waiting (for quality approval, and subsequent identification by the packaging operator and organisation into order boxes to be sent on to the customer) in the packaging section are actually in bags, so checking that the new system is always able to read the labels on the plastic bags correctly for the identification of these two test assets (by running simulations of passing through the system’s reading field for a significant number of rounds) becomes crucial.
All the 15 test assets, duly labelled, in a single, larger image are shown in
Appendix A.
Figure 12 shows a representation of the various test assets placed inside cardboard boxes for the company’s product packaging, with different sizes, and with some being inside others in a specific way, considering the main phase of the experiment procedure that was carried out.
The purpose of this procedure was to simulate a common scenario of organising modules and other company products according to customer orders. This procedure is carried out in the packaging section, with careful attention on the part of the packaging operators to avoid as many errors as possible in the accounting of assets and, in parallel, in the grouping of products by orders and boxes for dispatch.
Figure 13 shows a view of the packaging section of the company where the case study was developed, where the experimental and test process was carried out, and the final data collected will be shown in the results. This figure also shows the trolley for transporting boxes of products that were later used to simulate the rounds of passing assets with RFID tags under the reading field of the gantry system. It also includes an image of the total of 7 boxes used for the experiments (by distributing the products among them, overlapping some of the smaller boxes with larger ones).
On the hardware side, an RFID tag printer (CL4NX Plus, SATO America, Charlotte, NC, USA) is considered, which is necessary for properly identifying each tag according to the code assigned to it and the level of information it must transmit when it is read by the traceability system under study. This type of printer has already been in the company’s possession since the start of the case study.
Figure 14 shows this industrial RFID label printer.
3.2.2. Software
Regarding all the software applied in the context of experimenting with the RFID system under study, a brief description of each of these components is given below. To this end, a set of tools supplied by the company Nordic ID, Nordic ID Group, Salo, Finland, belonging to the Brady business group, was used to configure, create, and test various functionalities in the context of the RFID system under study. It is worth noting that a demo version of the Nordic ID RFID software (version 1.4.9.0), accessible without restrictions on the company’s virtual platform, was used to carry out reading tests and if desired, the recoding of RFID tags, among other possible properties.
Figure 15 shows the initial window on the interface of this software, showing that the device under study, the Brady FR22 reader (Milwaukee, WI, USA), is successfully connected to the work computer provided by the company, which allows proper access to the company’s main wireless network. This digital platform provides statistics on reading performance and logging capabilities for a more complete evaluation and is also available on multiple operating systems.
Figure 16 shows a web user interface, which can even be accessed from the configuration software mentioned above, also dedicated to configuring and developing software and programming for the RFID reader functioning within its application environment.
All the software available during the case study and operating under the right conditions regarding the correct identification of industrial assets using RFID technology was sufficient and indispensable for the fulfilment of the proposed objectives in the evaluation of the new prototype. To this end, it is important to emphasise that, along with the methodology used in the software to process the RFID reading data, the respective dataset “Work Number (Work) + Position in the Work (PosO)” was assigned, which uniquely identifies each asset in the company, to each of the test RFID tags (then associated with the respective product), at the level of its code (considering a passive reading of that code, whose information and associated production data are intended to be processed later via the servers and databases to be taken into account).
Finally,
Figure 17 shows an example of running the RFID software to identify some tags, using the simple inventory option to determine the RFID data. Unfortunately, it was not possible to visualise the RFID tag codes, in their unique identification, in a code format capable of explicitly displaying the number and position on site associated with each one. This was a drawback to better understanding the meaning of each of the results generated within the list of captured tags appearing on the software interface. The code format that was possible (considering the test version of the software) was hexadecimal. That said, it was decided to also show some of the work number and position codes in normal text format associated with these labels in
Figure 17. However, it should be emphasised that such a negative scenario will not occur in the traceability system under study in its final state, with the in-house software developed fully structured, and if its added value in implementation for the company is realised.
3.3. Methods
To this end, a methodology was developed characterised by carrying out a series of experimental studies on the identification of assets or products in an industrial environment using wireless data communication technology. This methodology involved the actual set of methods used in the case study.
The case under study, concerns a specific section within the production process of the company, namely, the packaging section, whose main workstation is shown in
Figure 18.
In turn, these studies are based on timing the traceability times achieved with this new technology, which is theoretically able to offer more advantages when compared to the type of technology currently in operation (barcode technology) for the traceability procedures to be analysed. It is, therefore, hoped that asset identification times will be reduced. The aim is to optimise cycle times and reduce production “dead times”, to improve the workflow for the phase of the production process following the one to be analysed, in this case, the phase following the packaging process for the company’s products that have already been duly approved by the quality department and comply with all the required testing requirements. In addition, it provides important assistance in situations where there is a need for rapid detection and removal of certain assets that have already been inserted into packaging ready for shipping (this is for correcting faults in the allocation of products to packaging, taking into account orders and internal works, among other elements, or possibly for the withdrawal of a given product for use in another production section for specific reasons, at an internal level of activity). It is intended that times will be greatly improved through the application of the innovative data communication system in the context of the current reality of the company studied, and this is based on the content highlighted in the literature review.
The needs underlying the problem under study must then be identified and listed. This stage is the starting point for the entire set of methods to be employed in the research and development work to achieve the desired results. In turn, a prototype RFID system will be demonstrated in the company’s packaging section, along with the proposed implementation of a gantry with the integration of this RFID technology, for traceability and optimisation of the process in question. It should be borne in mind that this will be applied to each of the company’s products (mainly each electro-pneumatic module), with the RFID tags being added directly to these products (and not to the packaging or boxes). It should be noted that the production phase to be focused on within the scope of the implementation proposal under study takes place before the expedition stage (which happens afterward), thus integrating the purpose of applying an Industry 4.0 tool to improve the company’s asset traceability process, which is extremely important and has a high potential for technological optimisation in this context.
This point in the description and analysis of the implementation (considering all the material available and the methods to be applied) will be followed by the first pilot tests carried out. These are aimed at regularising the entire method of operation of the system under study, checking that all the needs are being met and, if possible, achieving all the proposed objectives, as well as analysing whether all the information is being properly tracked (points which are crucial to the good performance of the implementation), and comparing the previous scenario with the future scenario to be designed; all of this is described in the course of the following sections. Still in this context, one of the many examples of the configuration of an order sheet and Dinefer boxes with the products ready for dispatch, arranged on shelves in the production section being studied, is illustrated in
Figure 19.
4. Results
The results obtained during the radio-frequency identification test simulations carried out for the prototype fixed RFID reading system are presented, as well as the performance and added value.
Following on from the previous topic, for obvious reasons, is the decision to implement the entire methodology and operation of test and registration experiments (simulations) in parallel using both processes. In other words, using the current method, through barcode technology, and then using the new asset or product reading system based on the respective RFID gantry structure designed to allow the passage of transport trolleys with the boxes containing the items labelled for their identification and the intended tracking purposes, in this case, at the company’s packaging section.
So, considering the barcode system, and a test sample with 14 assets (and not the total of 15 that is supposed, which is why it can be understood in the following section), the time spent reading and identifying this total number of assets was timed. Barcode labels were added to them for this purpose before the main tests on the prototype RFID system. By timing this time over a total of 20 repetitions, the average time taken to read the barcode of the total assets was estimated to be approximately 45.2 s, with an associated standard deviation of 4.866 s. This is without considering the need to manually enter any of the asset codes in the sample (something that would lead to even more time spent). The results of the reading tests carried out using the prototype RFID system, considering the test sample of a total of 15 assets with RFID tags (for their unique identification) are shown in the form of several bar graphs in
Figure 20. The times taken have been rounded down to tenths of a second, greatly simplifying the analysis of the data obtained.
The traceability system was applied for reading the test sample and 14 assets that are essential to detect (without direct contact with metal) in the company’s packaging section.
Figure 21 shows the comparison of the reading time of the RFID System and the barcode system.
Proceeding with the written indication of the data obtained that is relevant to the context of the study, considering the results presented above, and referring to the data in the main data table resulting from the experiments (which in turn has been organised into the graphs in
Figure 20 and
Figure 21), it is verified that:
Some detections failed, in terms of not reading (identifying) all the sample tags inserted into the non-metallic surfaces of the respective products they identify (i.e., detecting at least 14 of the 15 RFID tags in total) across all 20 test rounds of the experimental set passing through the system’s field of action; this occurred in the cases of the RFID reader positions on the sides of the gantry and with the reader not vertically aligned to the centre of the gantry structure (these reader positions correspond to the last two in the table referred to), so that these detection failures occurred in at least four rounds of passage interspersed with non-failed rounds (in this context of the unequivocal reading of all tags not admissible for identification failure due to direct interference of the element to which they were glued, and not being metal or another material);
The resulting maximum and minimum reading times, with these values effectively representing test rounds in which the condition of reading the 14 assets required to be detected was met, were approximately 4.9 and 0.7 s, respectively.
In turn, it also emerges that in none of the rounds of passing the set of assets (respectively, inside the boxes and on the transport trolley) through the RFID reading system was it possible to track and identify all 15 assets in that set. However, this fact does not in any way jeopardise the possibility of drawing clear conclusions about the feasible and fully applicable practical benefits of the prototype RFID system (involving both the RFID reader and antenna as well as the type of tags being integrated) during the procedure to simulate the tracking operations carried out in the section of activity involved that was carried out. In other words, the asset that was not identified at any time, having always been the same (and the same RFID tag and its code) throughout all the test repetitions, functioned as an element differentiated from all the others in the sample and whose forced failure to detect it was constituted as a predetermined scenario, with the phenomenon of electromagnetic interference at play, and the intention of ascertaining its real influence on the tracking process under study.
Moving on to the table of contents (and the bar graphs drawn up based on the data) of the results obtained with the application of the new system, it can be seen that the testing procedure carried out took into account a total of 20 rounds of passing the trolley with the test boxes (and products with the RFID tags inside) for each respective fixing position and angle of inclination of the RFID reader and antenna on the gantry, which was considered mainly to compare the various alternatives for orientating the reading system concerning its effectiveness and speed in reading.
It should also be noted, regarding the RFID reader’s position and inclination options, that the configuration considered last in the table corresponds to a vertical position very close to the base (the ground) in one of the gantry’s side profiles, set at an angle of 10° downwards (an orientation which, before understanding the justification for its use, may seem unnecessary) on purpose.
The purpose of this study was to investigate in greater detail the system’s RFID reading range, even in positions on the gantry where the assets with the tags do not cross directly in front of the total area covered by the RFID antenna structure (in this case, the area covered by the antenna’s dimensions along a horizontal plane).
Some, or the vast majority, of the assets to be identified may still pass a little to the side of this area, but still inside the gantry (and with the detection range of the system under study either exceeding expectations or, on the contrary, failing to fulfil its function of automatically identifying all the products circulating inside the gantry).
In addition, according to the results the RFID system under study was able to identify 14 assets from the experimental sample in all the test repetitions carried out for the orientations of the “RFID reader + RFID antenna” set: horizontally and at the top of the gantry (three variants), diagonally at 45° on any of the top sides, and also laterally and when aligned with the centre of the gantry, without taking into account upward or downward inclination (for the first five configurations of the tracking system considered in this table).
Consider that the time taken to read the test assets via the barcode system () was approximately 45.2 s before the actual main experiment detailed below.
The average reading times were obtained for the three positions of the RFID reader and antenna set horizontally and on top of the gantry. In these, the times taken to track and identify all the RFID tags that should have been read effectively (except the tag glued to the metal surface, for justified reasons, in the influence of electromagnetic interference for this type of tags in use in the tests) were the lowest, compared to the other alternatives (where in the latter two it was not possible to read all the tags in all the rounds carried out), with values of = 1.06, = 1.59, and = 2.10 for the average of the reading data for the position horizontally and inclined to the side of the start of the trolley’s trajectory under the gantry and the antenna’s detection field, horizontally without any inclination and horizontally with an angle of inclination in the opposite direction to the start of the trolley’s passage, respectively, obtained through several calculations made.
In turn, the average reading time of the asset sample by the RFID system (
) is taken as the average of the three values considered above (with
= 3), using Equation (1):
And finally, it turns out that the improvement in asset-tracking time with RFID tags is given by Equation (2):
In this context, metal surfaces reflect the wave emitted by the RFID reader and cause interference that normal RFID tags cannot withstand. To overcome this obstacle, special RFID tags that use an additional layer of material that separates the RFID antenna from the metal object on which the tag is applied can be incorporated, a type of tag that could address the situation of products with metal-only surfaces in the system’s future implementation scenario.
Figure 22 illustrates the various results and relevant parameters in the context of the RFID process, according to the prototype under study. These results were generated using the RFID software and were displayed on the company computer’s interface. A total of 56 simulation rounds were conducted, during which the set of assets passed under the antenna reading region on the gantry. It is important to note that this represents one of the 140 total test rounds carried out, considering seven different coupling positions of the reading system on the gantry.
The data of interest obtained was displayed in three different tabs—the window with the list of detected tags (tag list view), the performance graph (performance graph), and the simple view of the tags read (tag view)—within the scope of the software’s functionality option corresponding to the advanced test inventory. This option of the RFID reading programme provided as many input settings as possible to configure the device with the most appropriate instructions and the best RFID-tag-detection properties (passing under the system’s reading region).
5. Discussion
Before proceeding with any implementation to achieve the desired objectives based on the discussion of the obtained results, it is necessary to detail what the company has been practising before the change under evaluation, in the context of its traceability activity at the shop-floor level, studying which points to focus on and which to improve.
An assessment was made of the current state of the technology used to trace production flows, in general for all the company’s industrial activity and specifically for a section in which the subject under study is particularly relevant. The company is in a state of transition regarding operational methods for recording information. This transition is largely due to the company’s current financial stability and its desire to develop a technological advance in this context.
At the beginning, with the acquisition of the new hardware system by the company, all the information was recorded using barcode technology. It should also be noted that the respective software component, to be interconnected with the system in question, will be developed definitively by a specialised team of computer engineers and implemented in the company’s traceability system very soon, in the case of adopting the RFID system.
After analysing the data collected, such as the industrial production characteristics, possible limitations, and the respective needs for the innovative traceability system, the company will decide on the best technology to adopt. The main reasons that led to this end decision are set out in
Table 3.
In summary, the main findings indicate that the RFID system outperforms the barcode system in terms of traceability activity. The RFID system demonstrated an approximate 3.627% optimisation in the time required to read the test sample of assets when compared to the barcode system. It is worth noting that the “RFID reader and antenna” positions on the gantry showed high reliability in identifying the 14 tagged products, except for the last two positions. These two positions, where the reading device was located on the sides of the gantry and was not perfectly aligned with the height of the structure and the space through which the trolley carrying the product boxes passed, showed only a minority of failed detections out of a total of 20 rounds of test passes. This highlights the overall effectiveness and robustness of the RFID system even in less-than-ideal conditions.
Therefore, these data show a clear commitment on the part of top management to making the necessary changes to improve traceability performance and internal communication. This commitment is naturally accompanied by an initial financial investment (both with the hardware components already purchased and the additional monetary costs that still must be made).
6. Conclusions
Starting from the initial scenario of identifying the products in the test set using barcode scanning by applying the new RFID system, a very significant optimisation (reduction) of the time taken to read the assets is achieved, even on the scale of tens of seconds (approximately 43.62 s in this case), considering only the small batch of products used for the procedure. This is because by extrapolating the results of optimising the tracking process obtained for the set of 14 assets with RFID tags (except for the 15th, which was not read for predetermined reasons) to a hypothetical scenario of producing and packing products to order for dispatch in a significantly larger quantity per working day and with the tracking system entirely carried out by the RFID prototype on a gantry, the optimisation time for tracking and identification over the months of production could become quite positive.
In the course of analysing and evaluating the prototype RFID reading system under study, which was the main purpose, and the objective of proving that it was the right implementation proposal and capable of increasing the company’s profits (in the context of acting on the internal traceability system) in the medium and long term, it can be seen that it does indeed constitute an added value for the company, and has a promising future for optimising the production flow and reducing costs with non-value-added production times for the customer.
In addition, the interface of the RFID data processing software applied, as can be seen, is an important tool for generating a whole range of information that is very useful for analysis and for monitoring the performance of the traceability system under study.
Once the implementation phase has been completed and the idealised project is up and running without fail, it will be time to make the new operating method official with the operators who make up the company’s production flow, specifically in the packaging section, although also considering the quality control section, whose involvement in the smooth running of the new RFID system will be very critical. This stage necessarily includes raising the awareness of the respective workers on the shop floor about how beneficial the change will be for the company, as well as the importance of the project, so that they do not resist the change.
However, whenever necessary, employees will need a support team to solve any problems that may arise, so that there are no interruptions in work or anomalies in information records. It is assumed that, in the initial phase, this type of event will have a higher error rate, since failures in handling the new equipment are more likely. However, this scenario will not jeopardise the viability of the new automatic identification and data capture system, which will be essential for the company’s technological future and will allow it to pursue a competitive advantage in the market.
Finally, the pursuit of excellence should never be overlooked in any project, and, in this sense, continuous improvement will have to be present in the implementation, proactively collecting feedback from the operators in question and analysing whether the various opinions can add value to the new system. It will be necessary to ensure that there are no glitches in the system to be implemented, thus providing greater security and ease if interruptions are generated for possible additional, slightly more complex, configurations of the new system.
In the future, the new traceability system will be completely installed. This phase will involve ensuring that the entire software system is operational and acquiring any remaining hardware components necessary for full system functionality. The objective is to provide each operator in the packaging section, as well as in other stages of production, including the vital quality control section, with their own RFID reading system. In the specific case study, an asset gantry system with UHF-RFID tags affixed beneath the antenna’s reading area will be employed. This system will promote the real-time transmission of essential information regarding the status of manufacturing orders and grant access to relevant data within the software interface and structured databases. This access will be available from any equipment or hardware located within the industrial environment.


 ,
, 


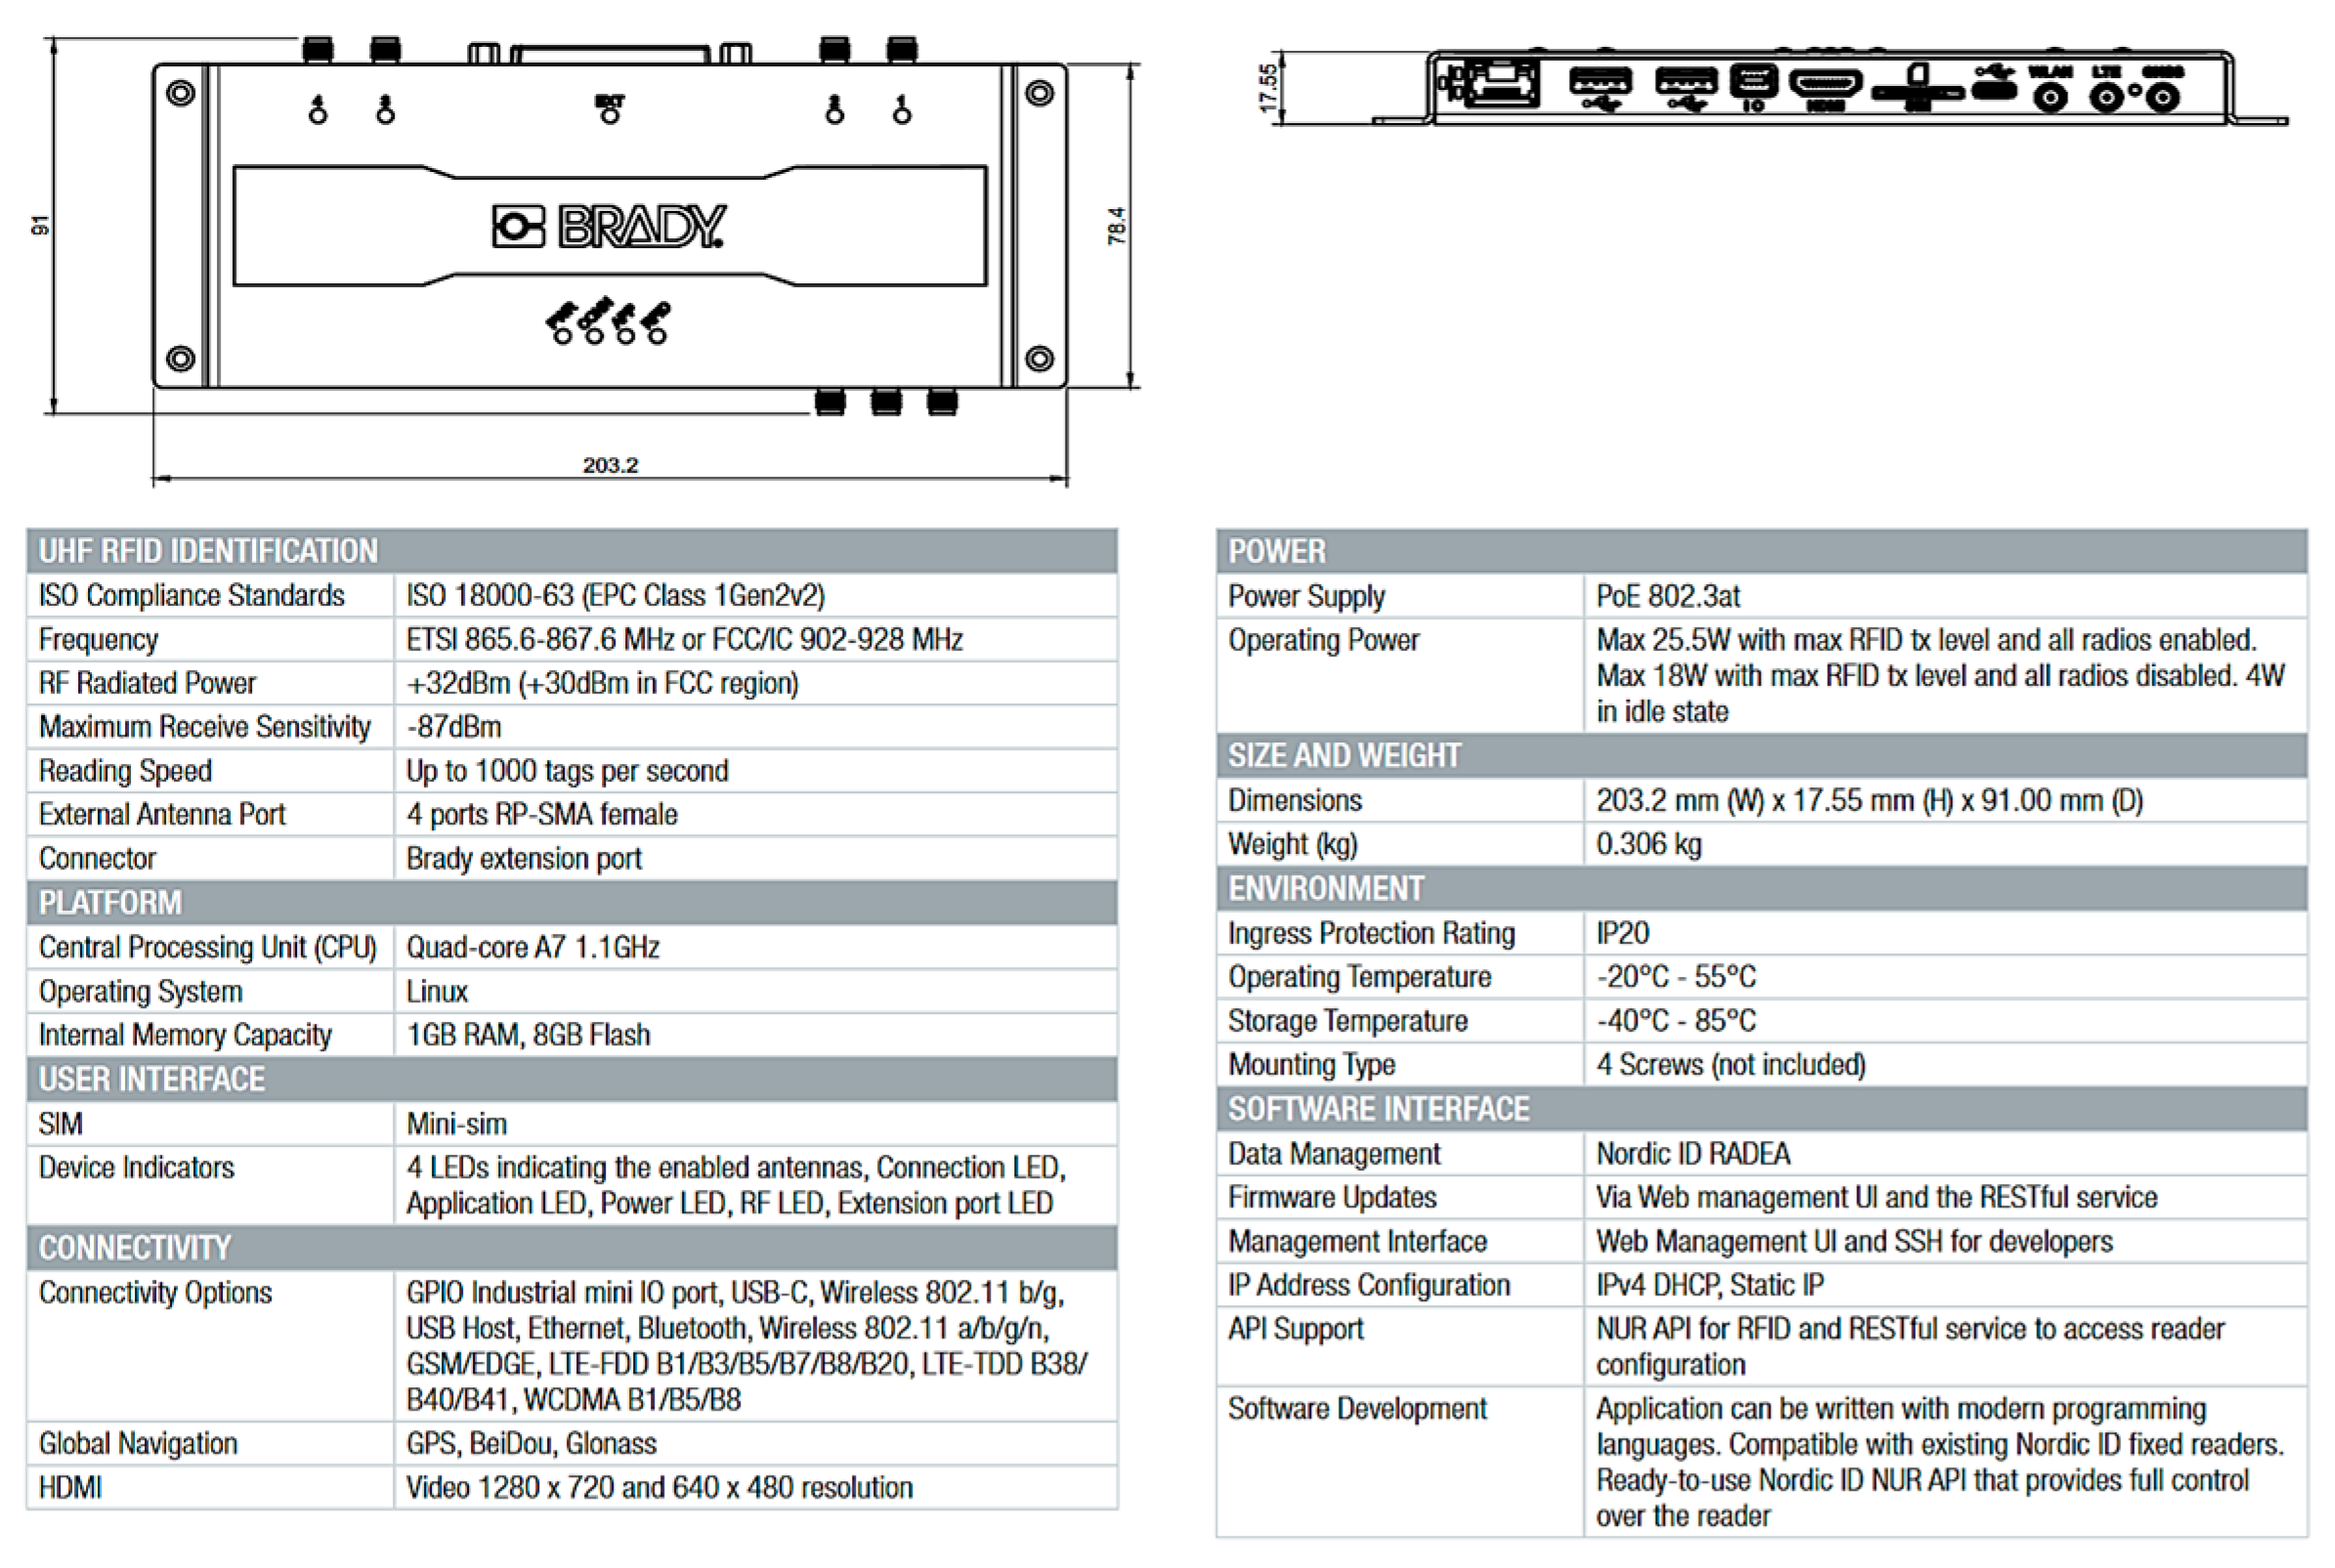
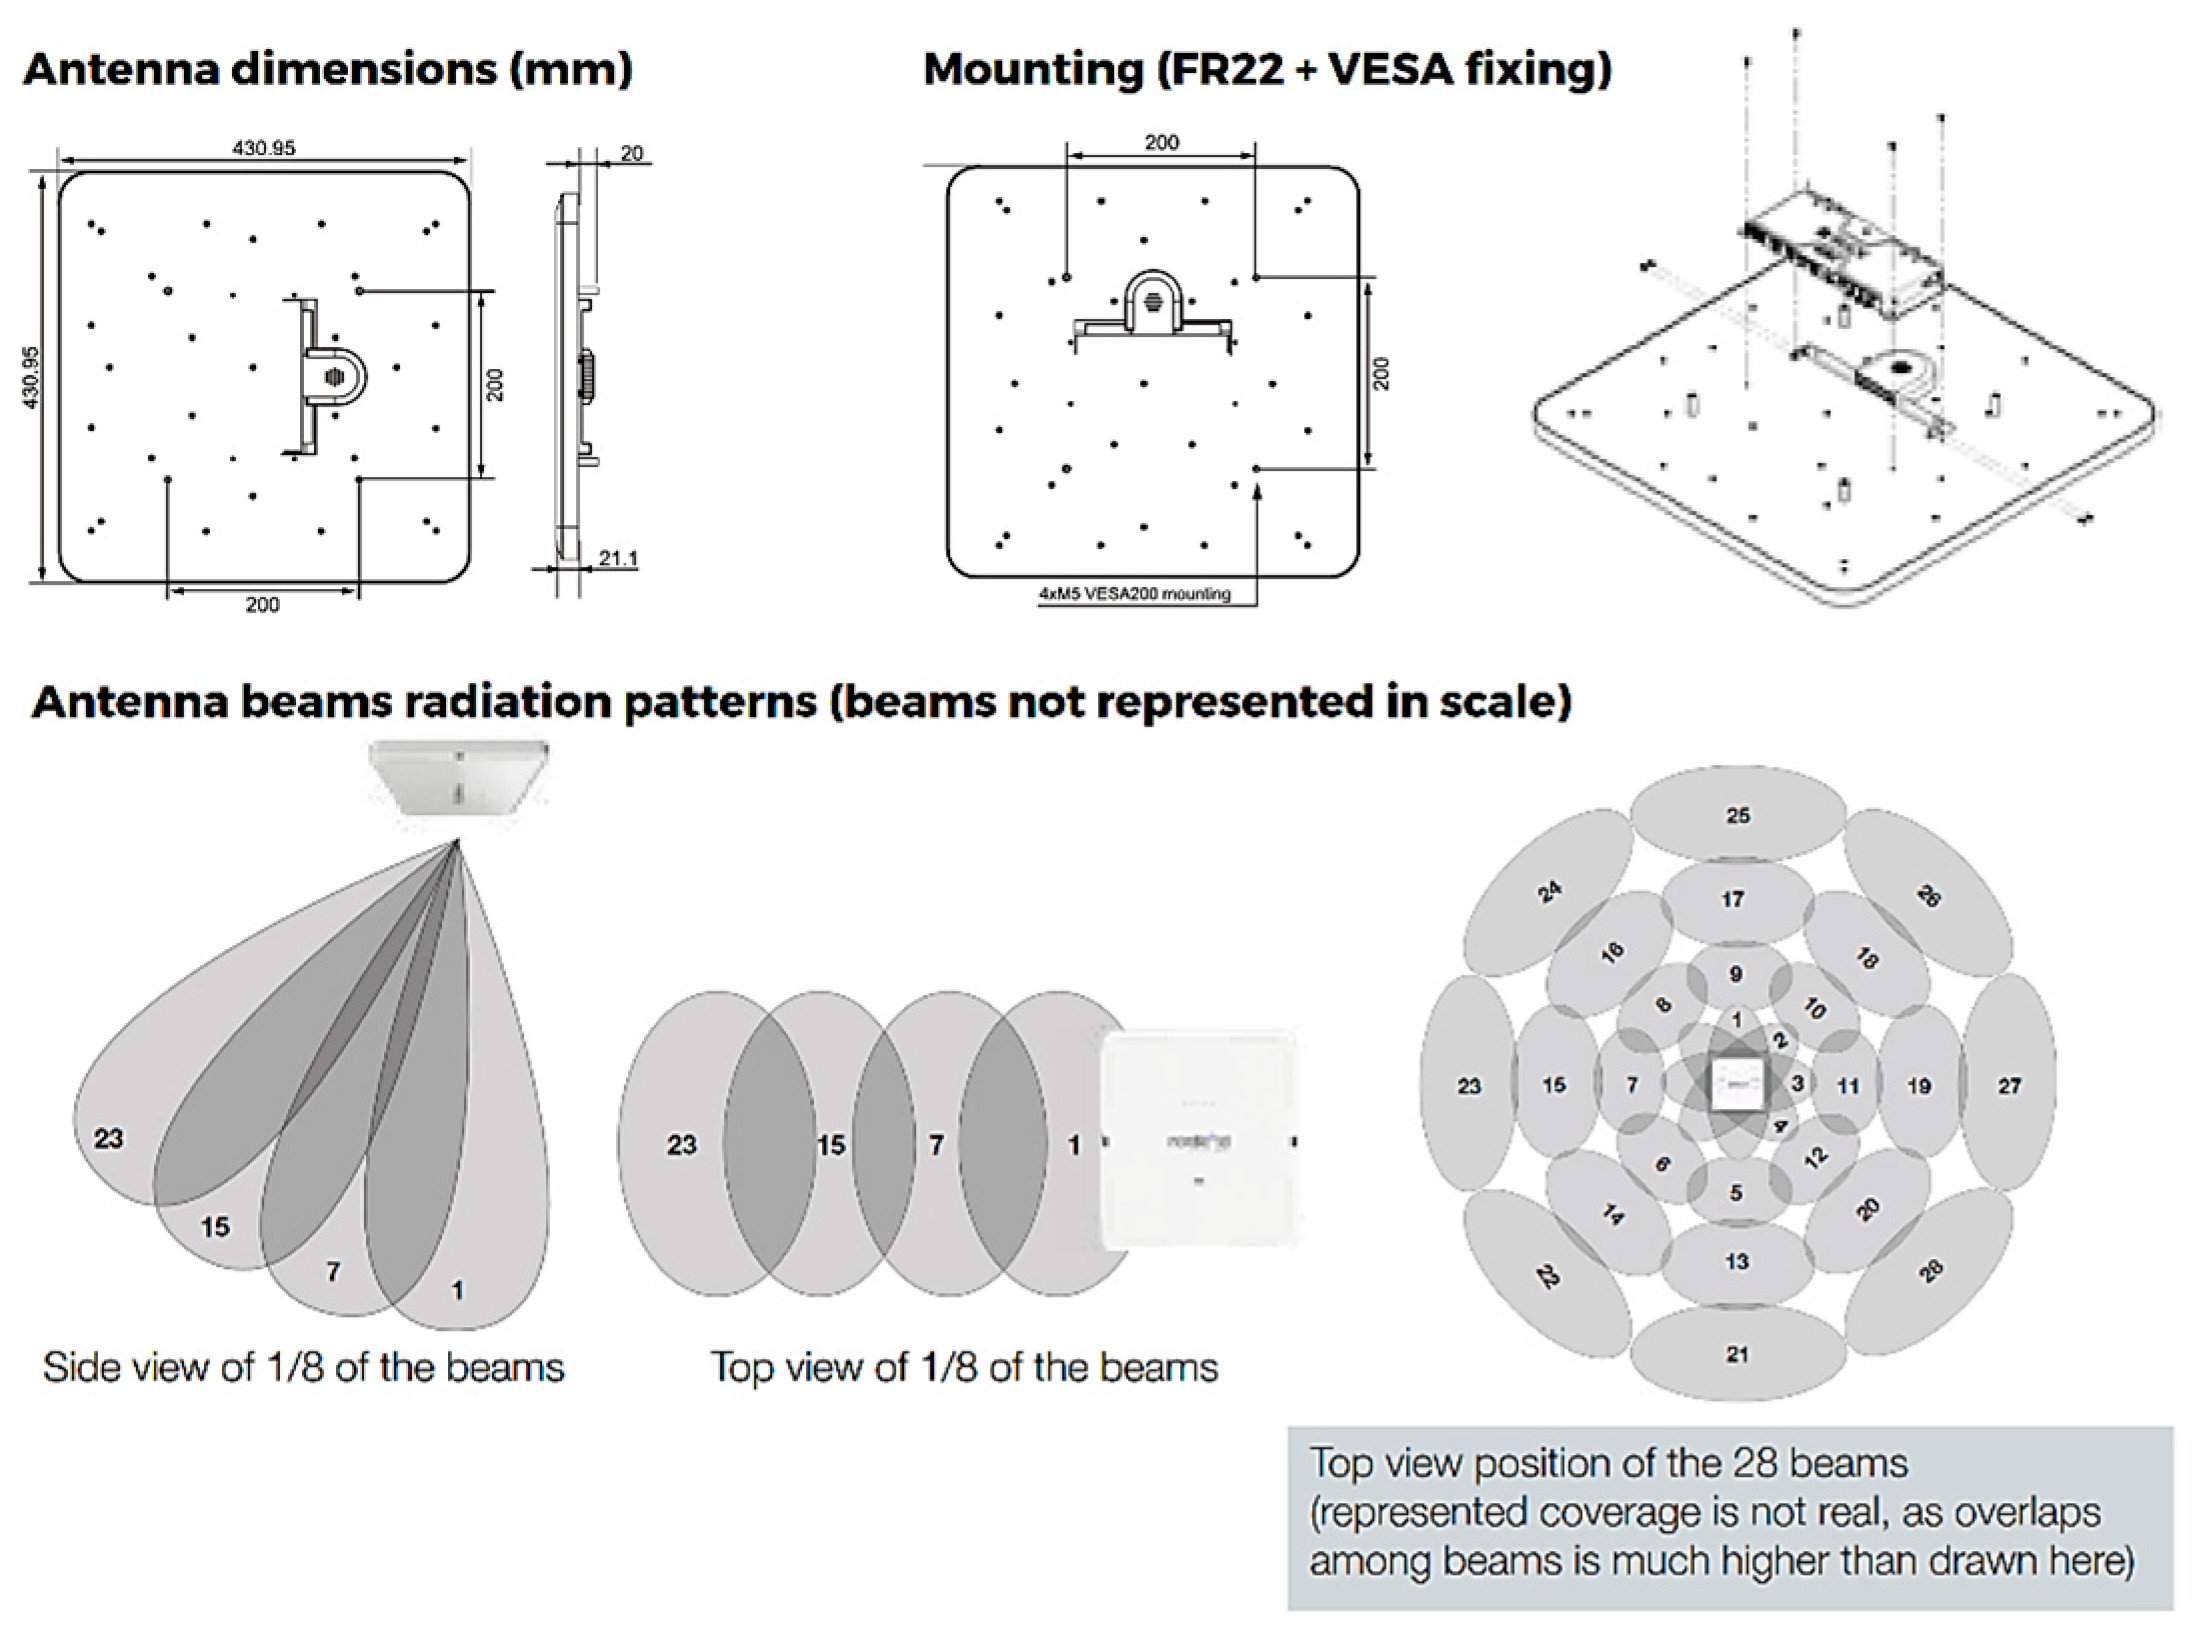
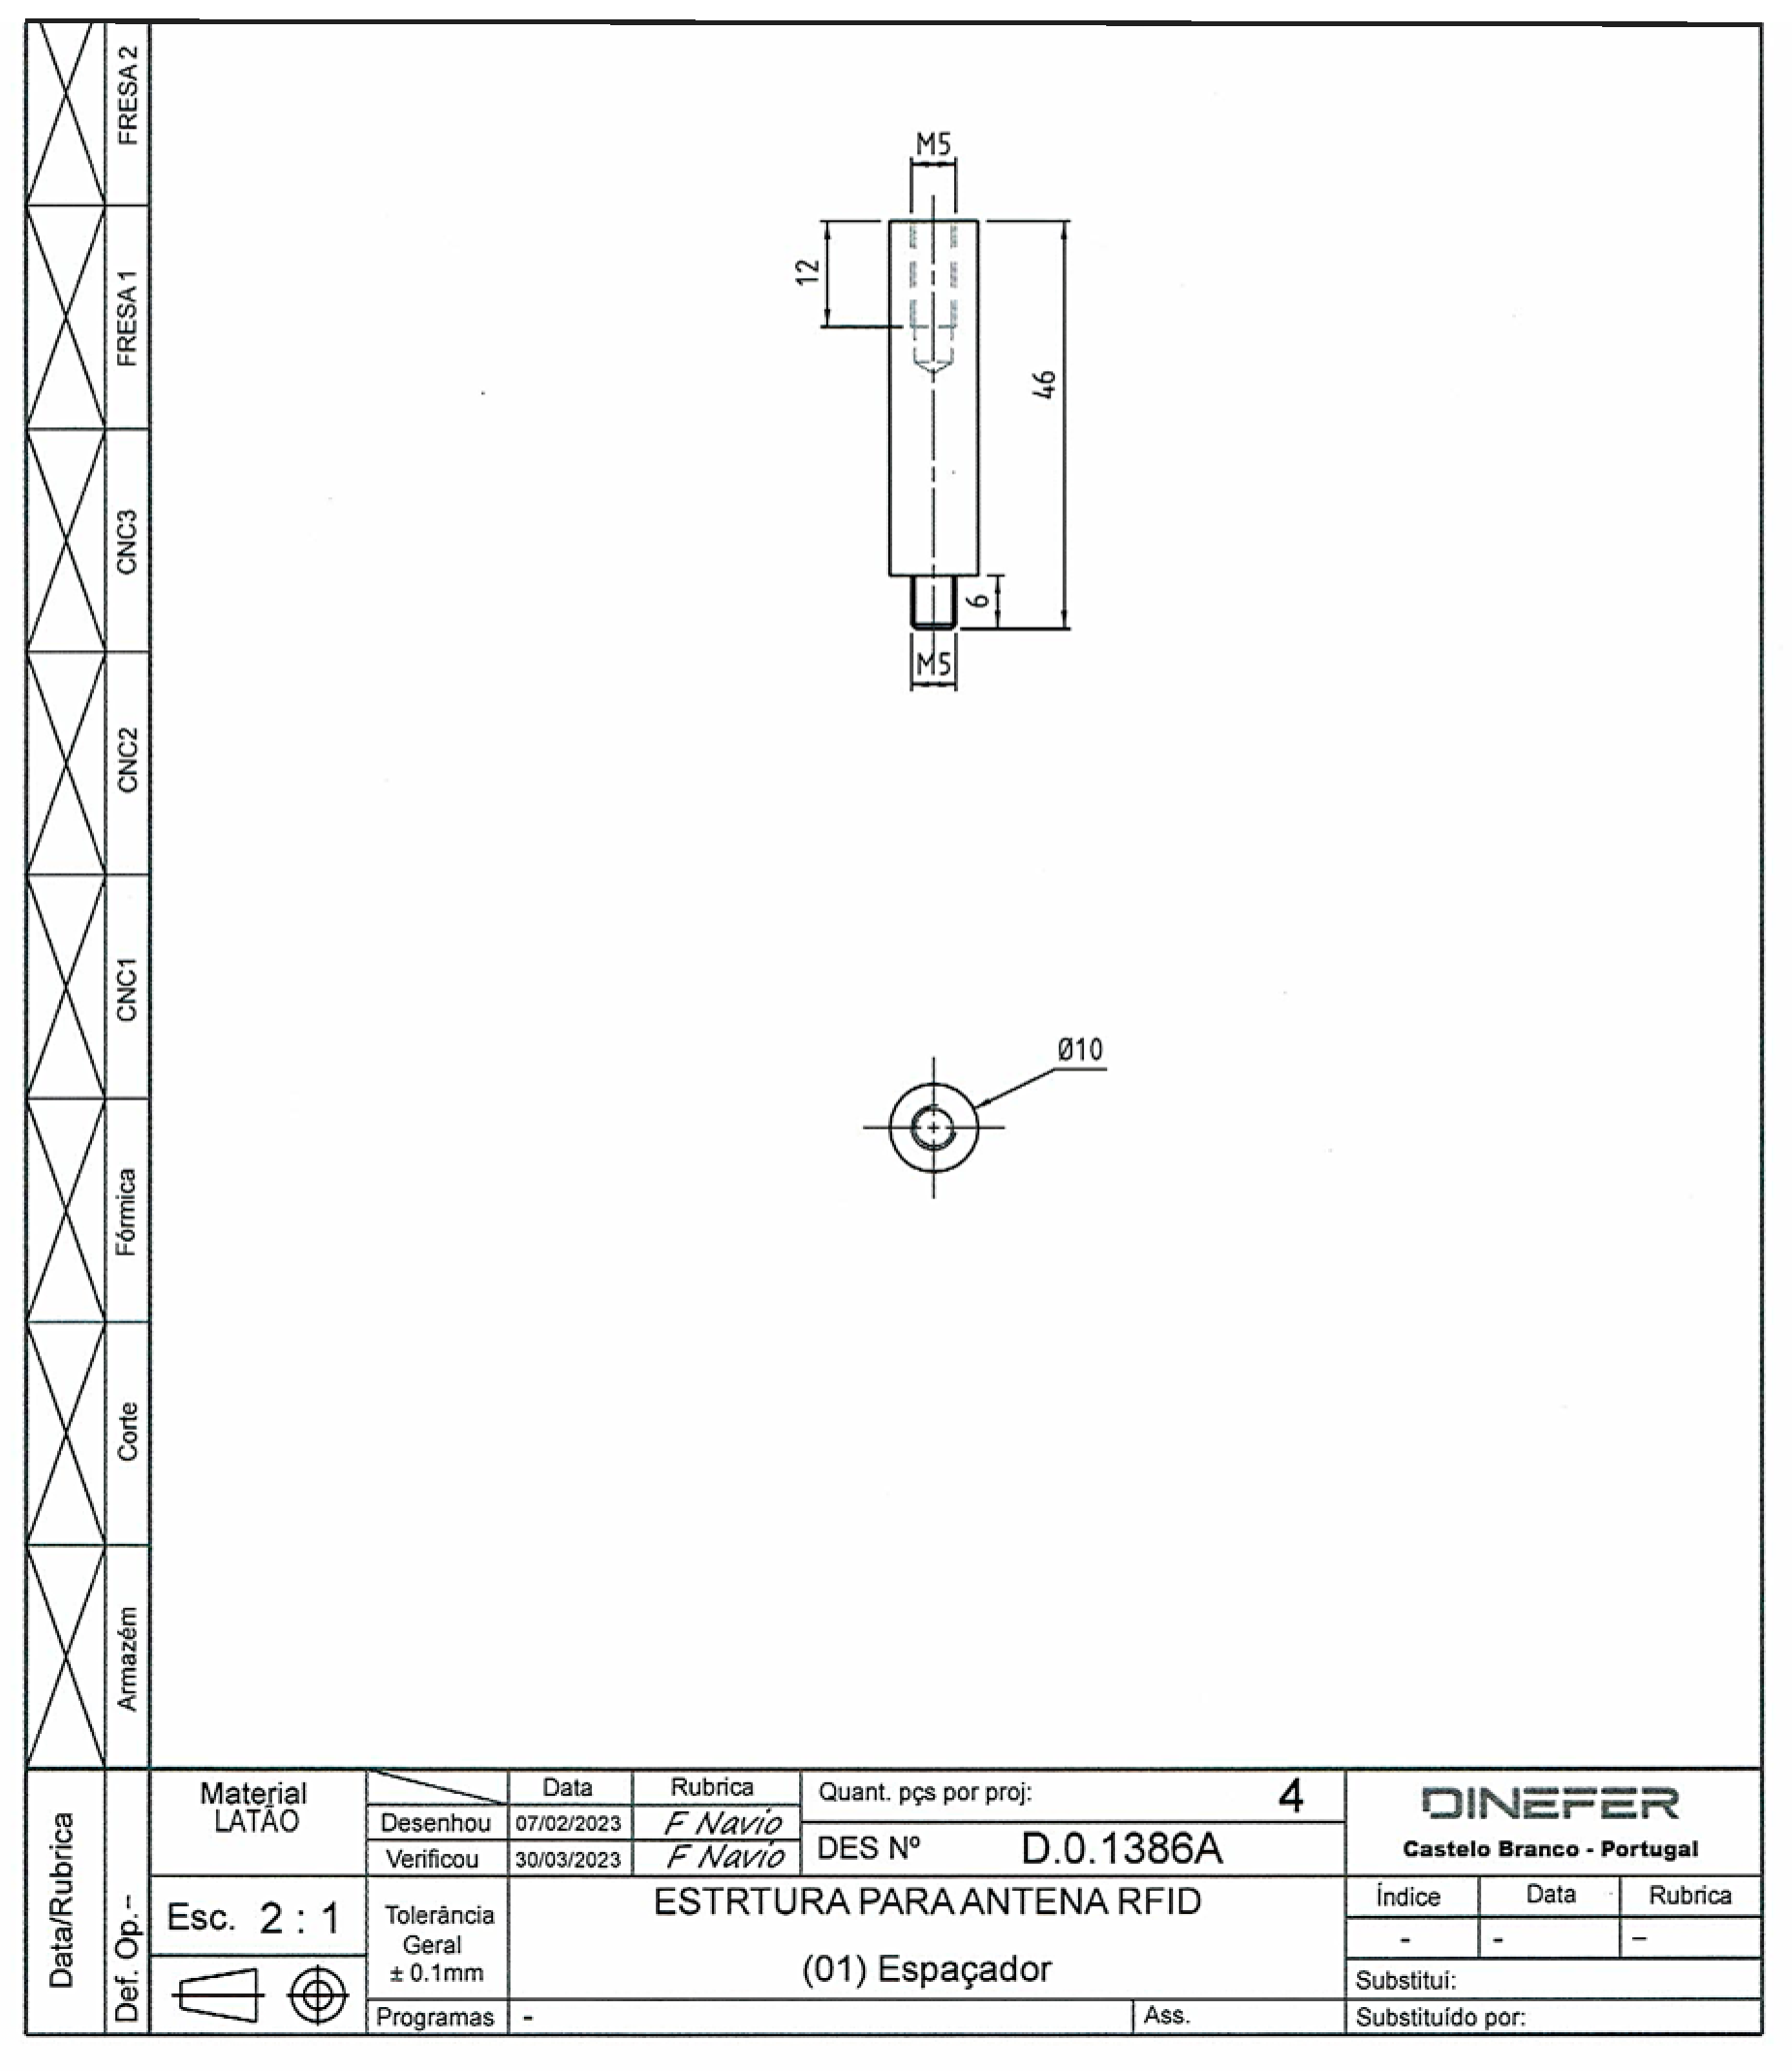
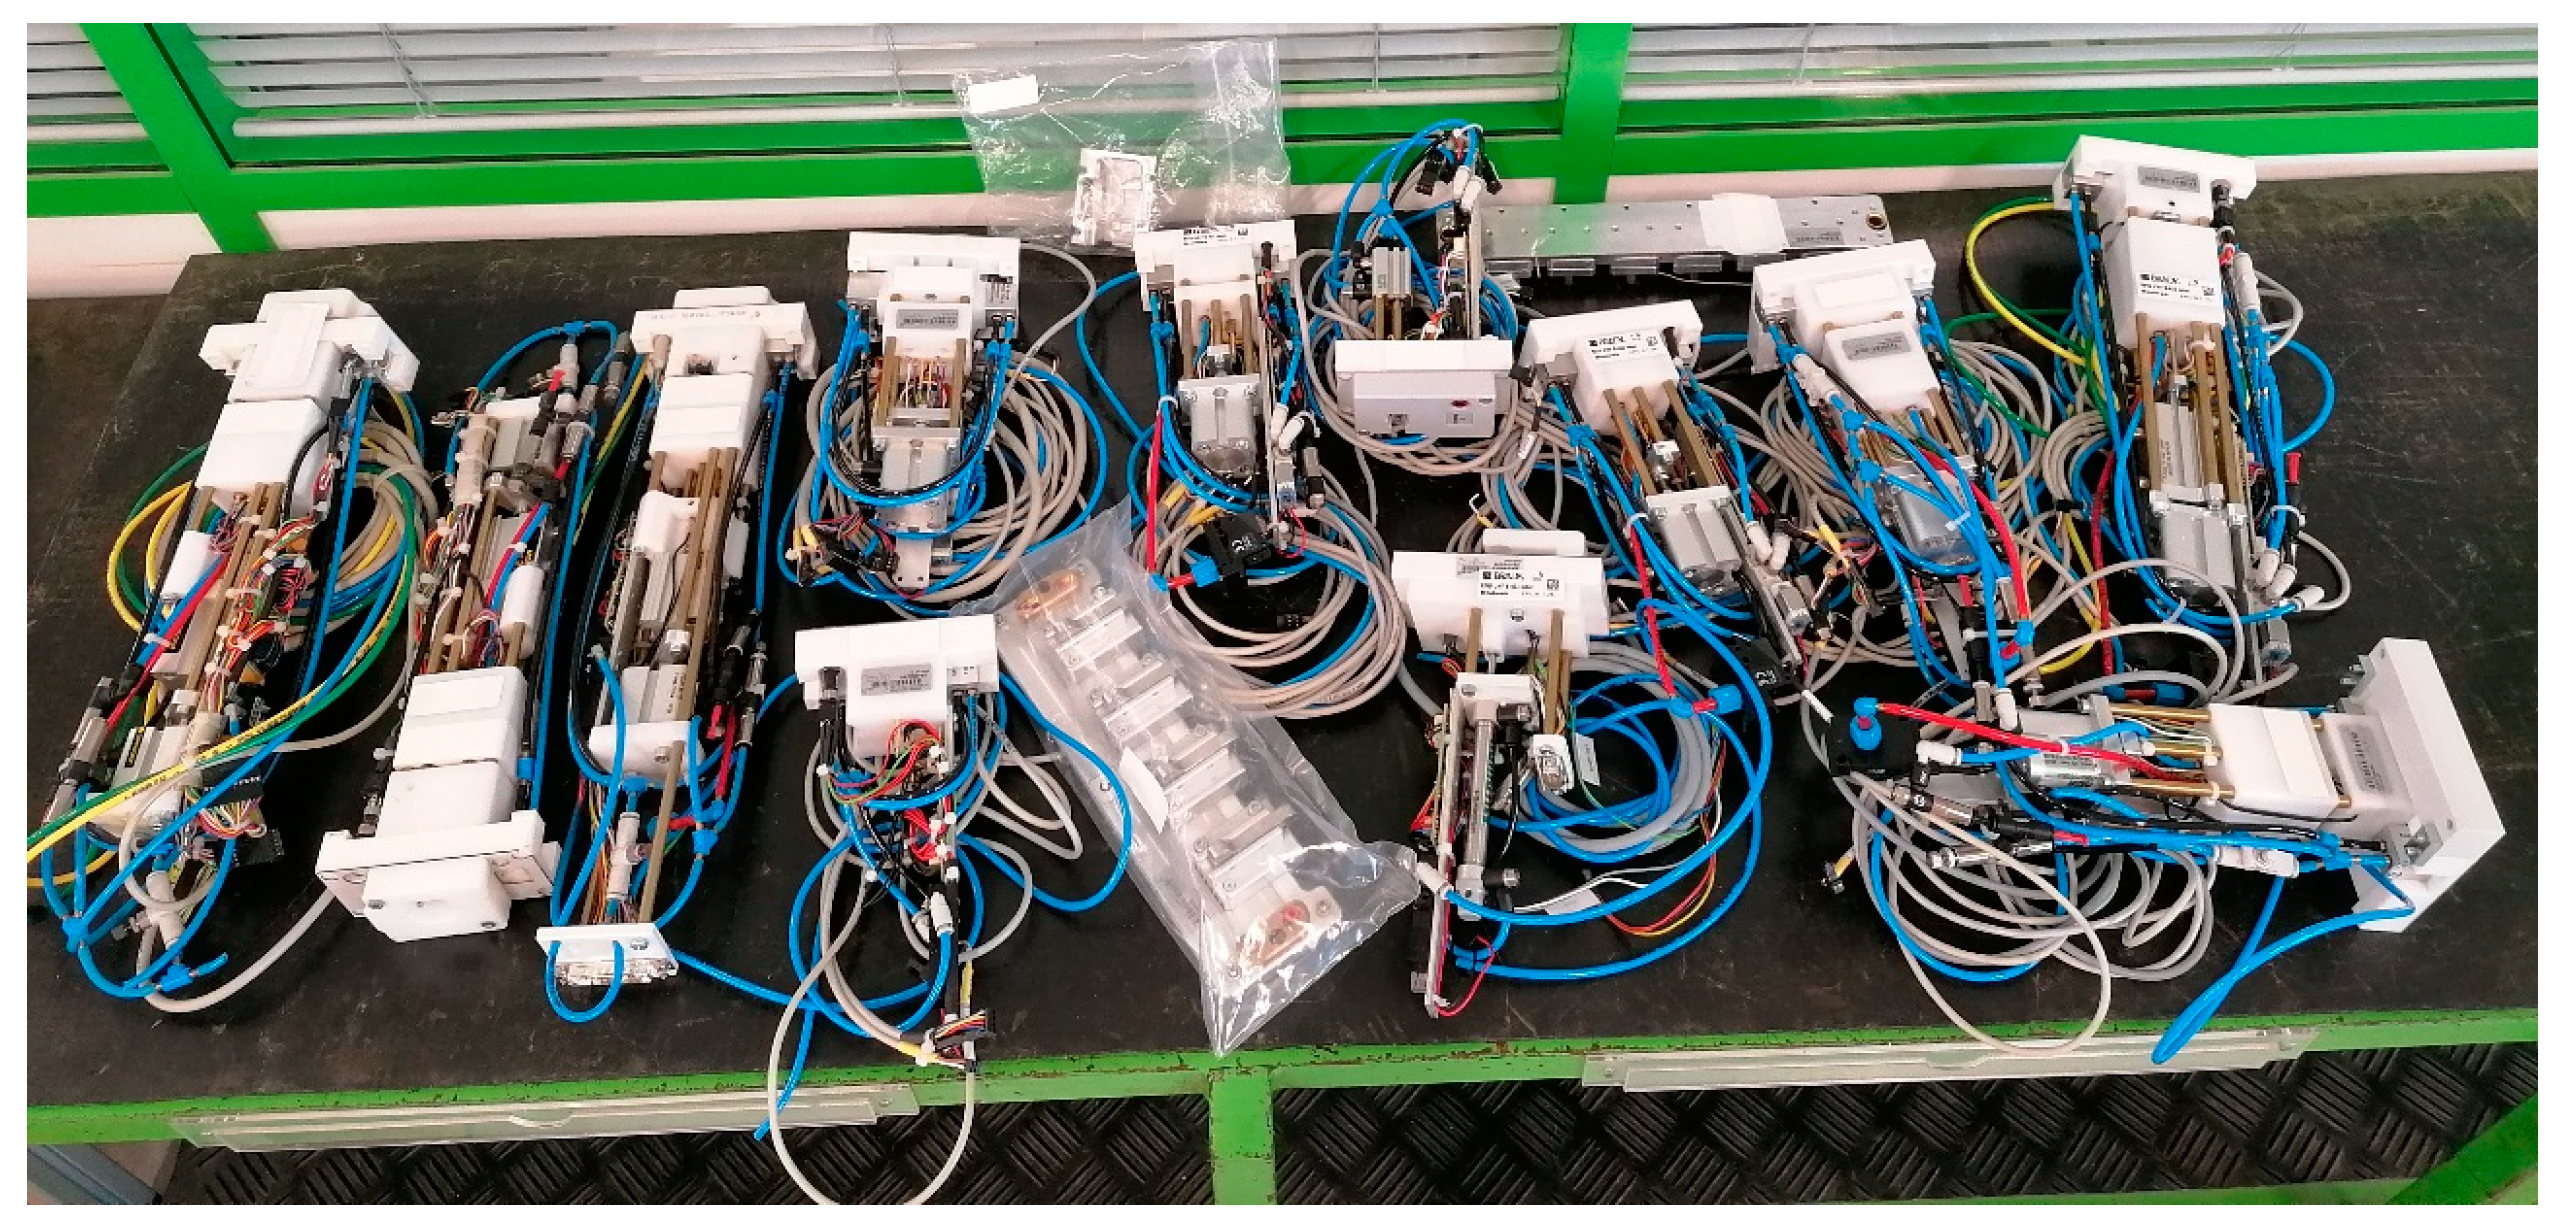
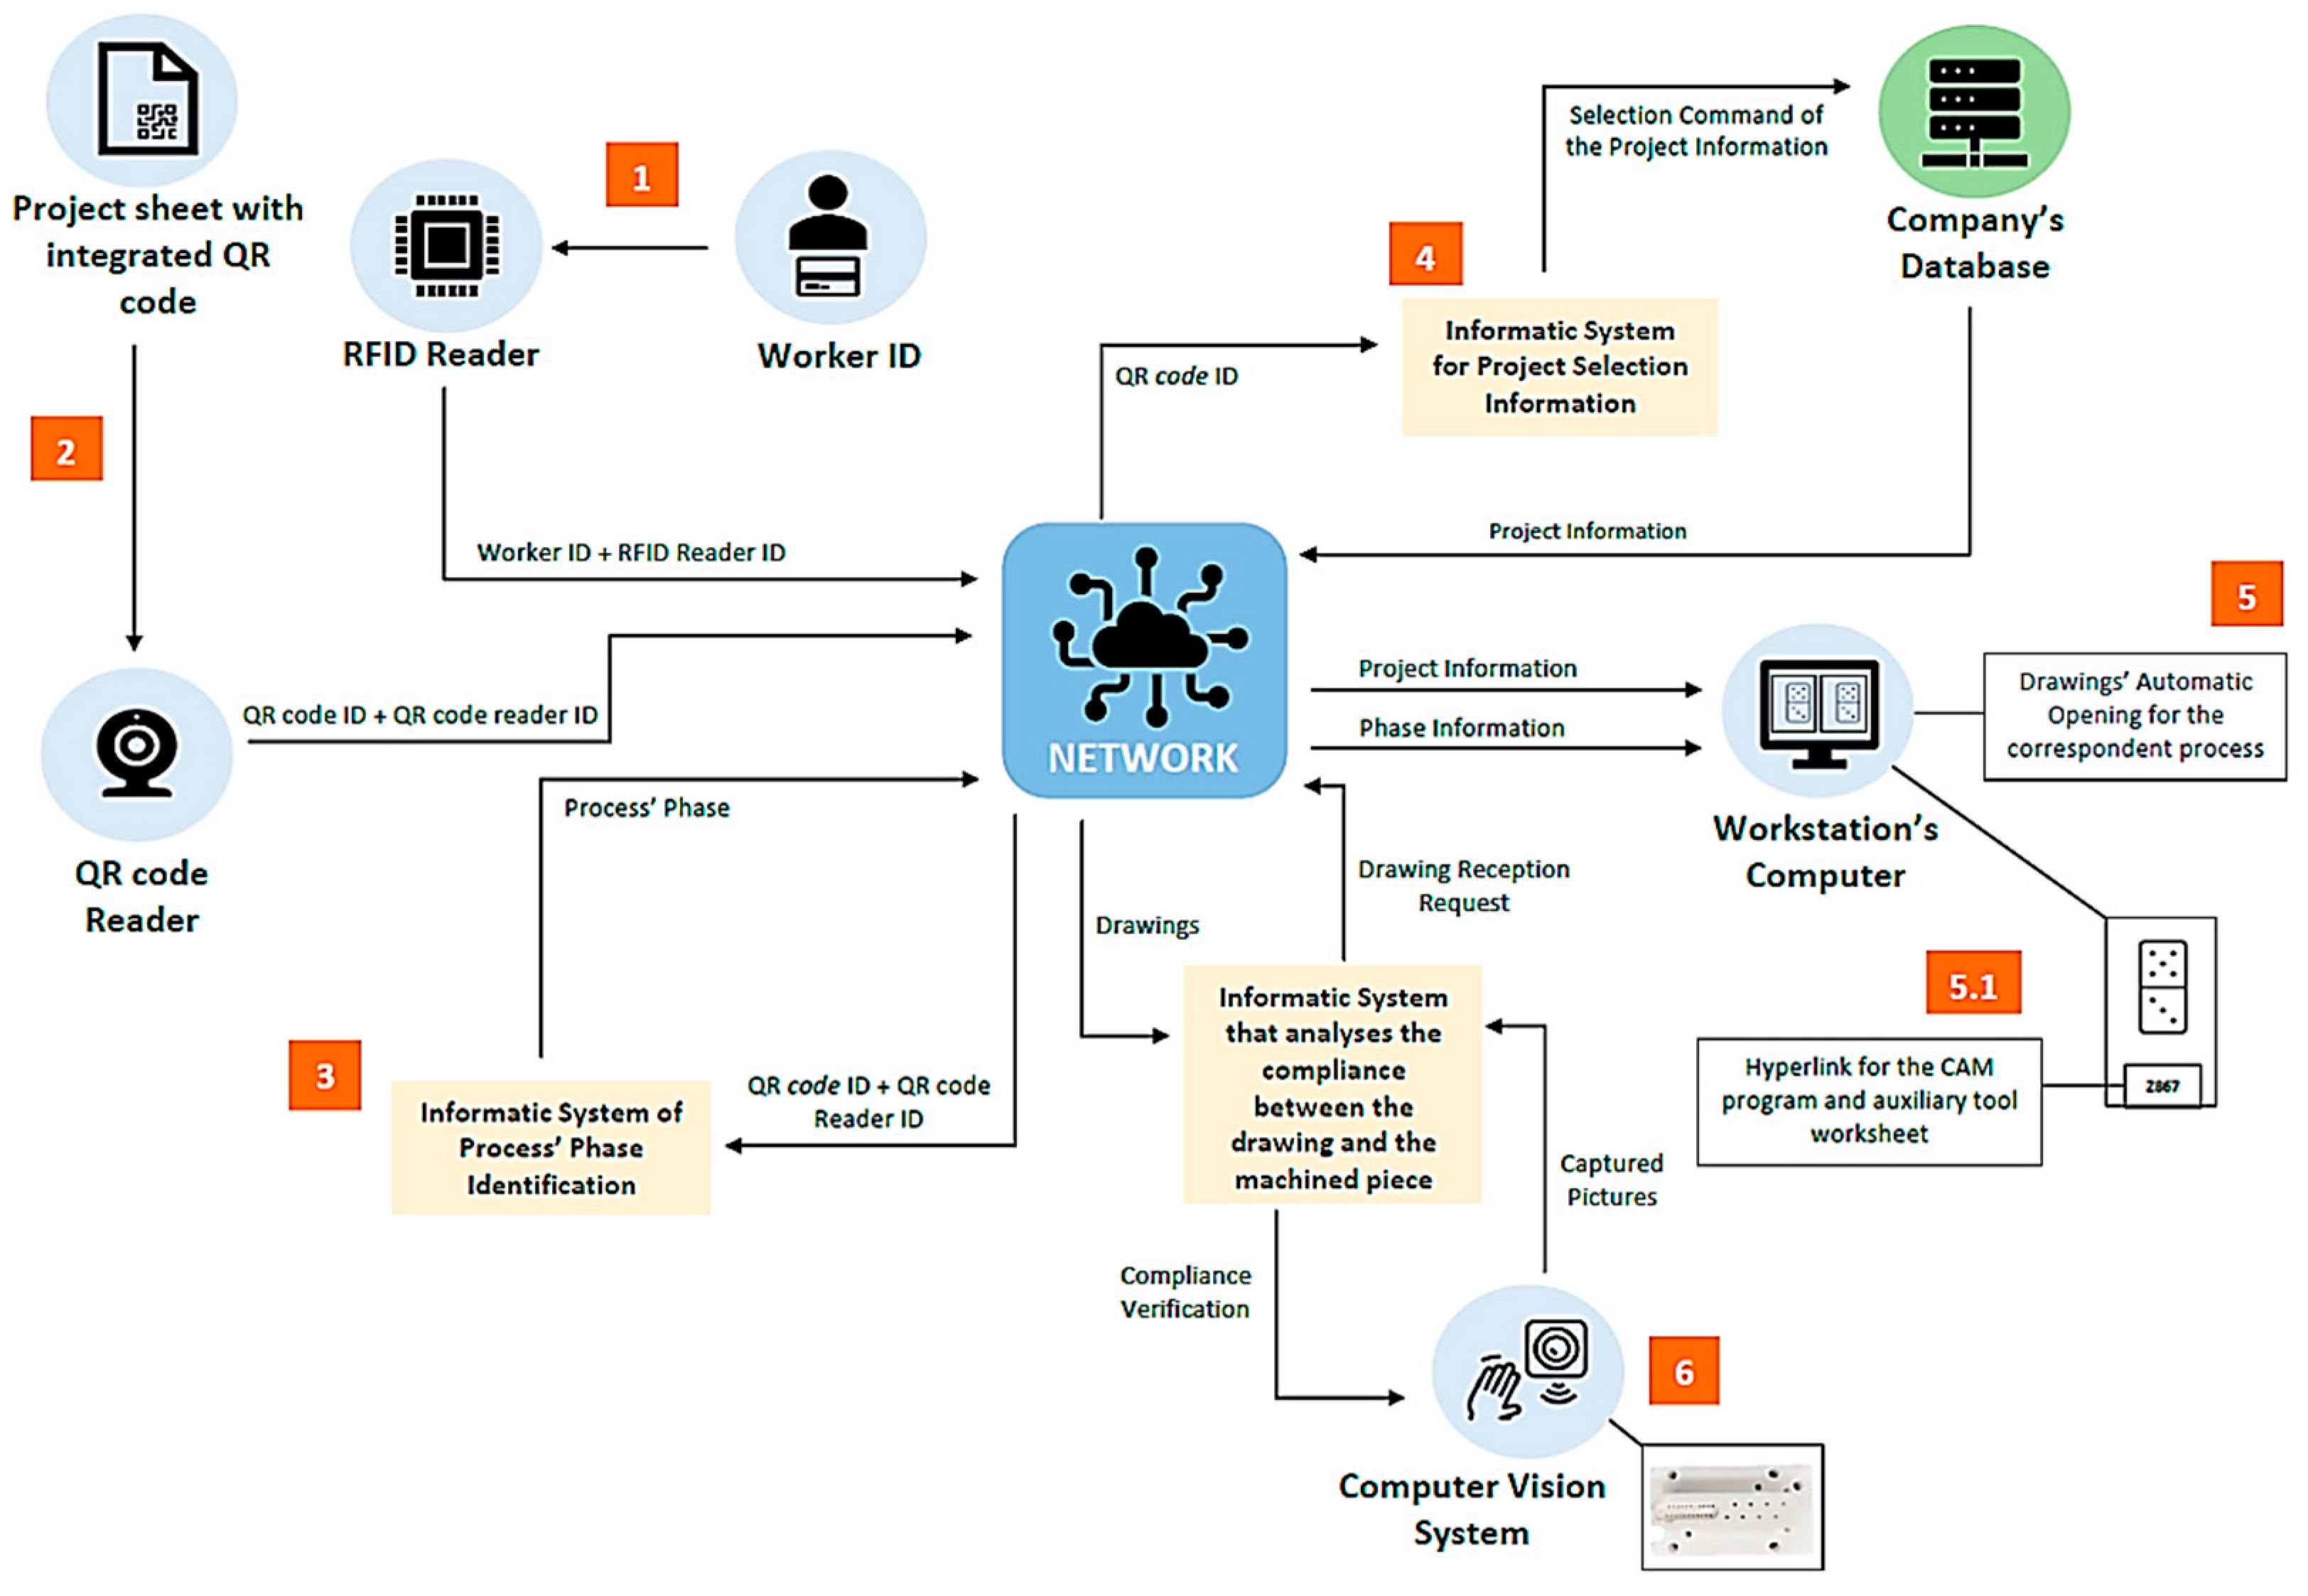
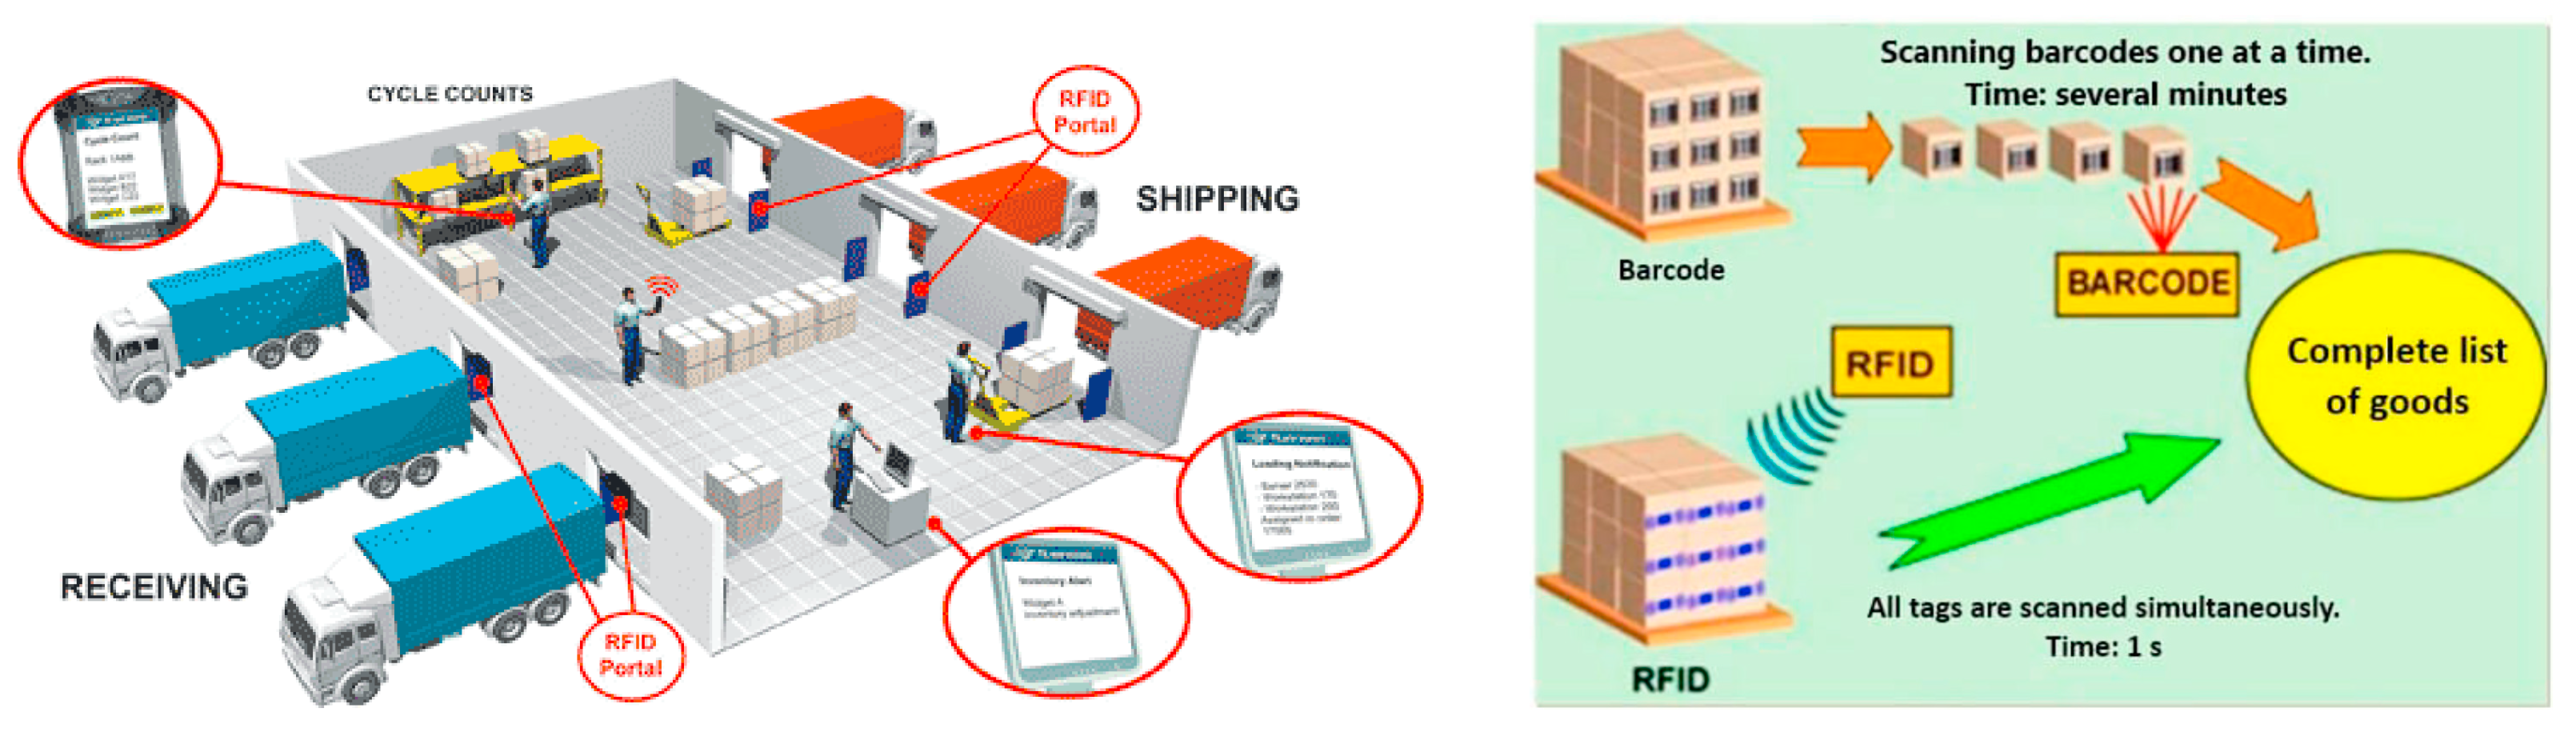

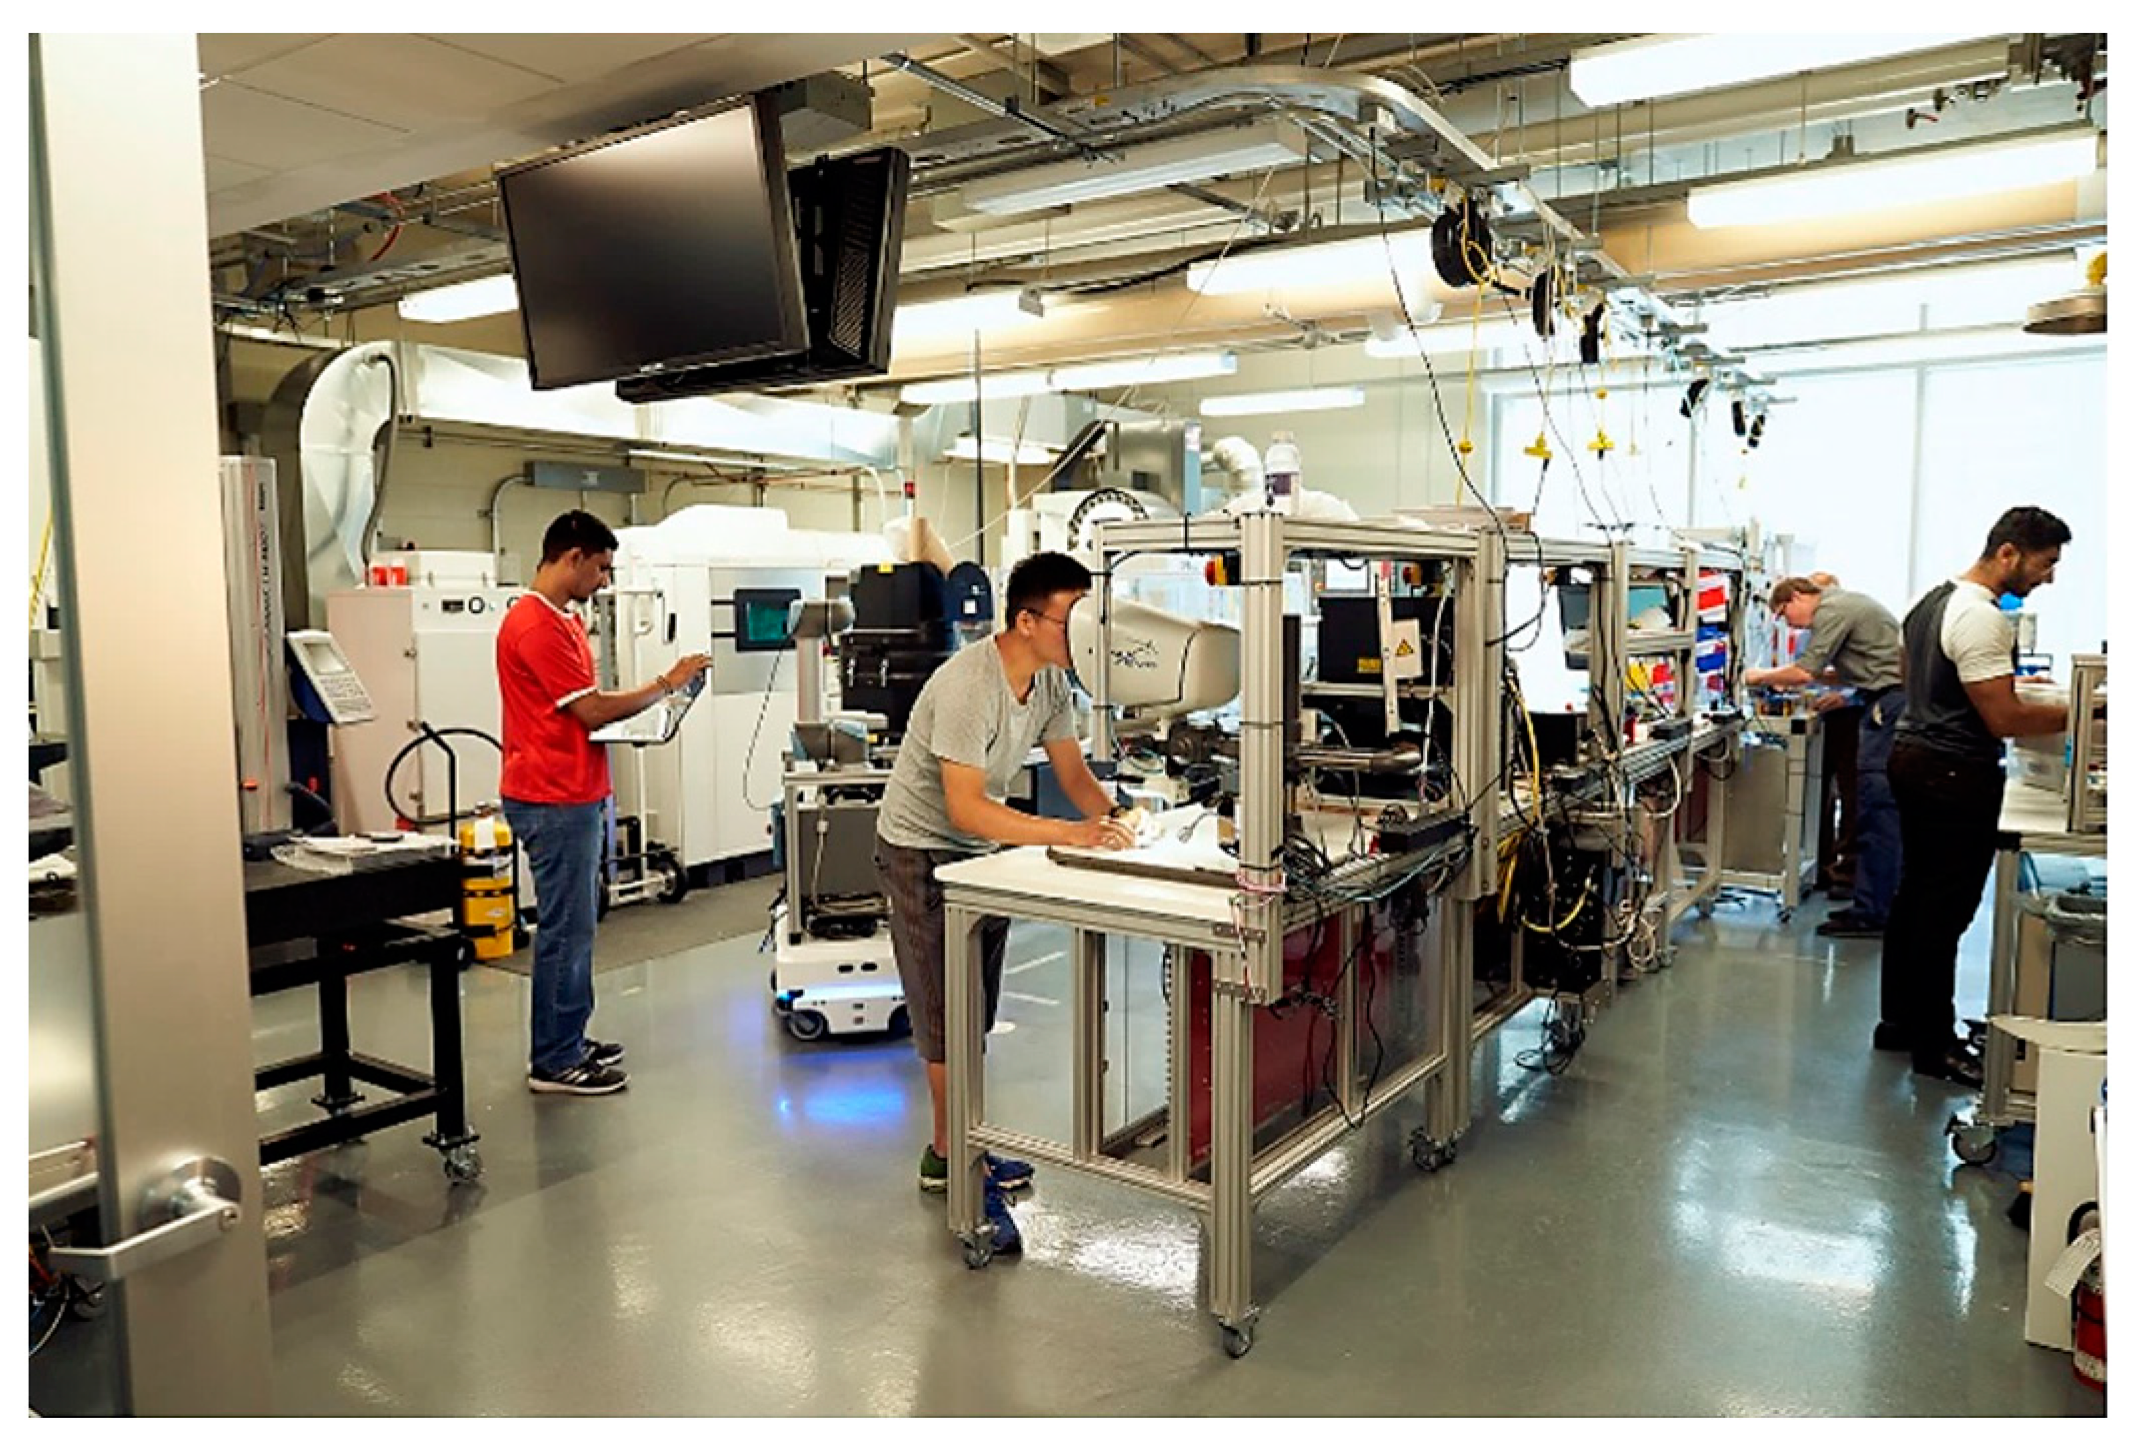
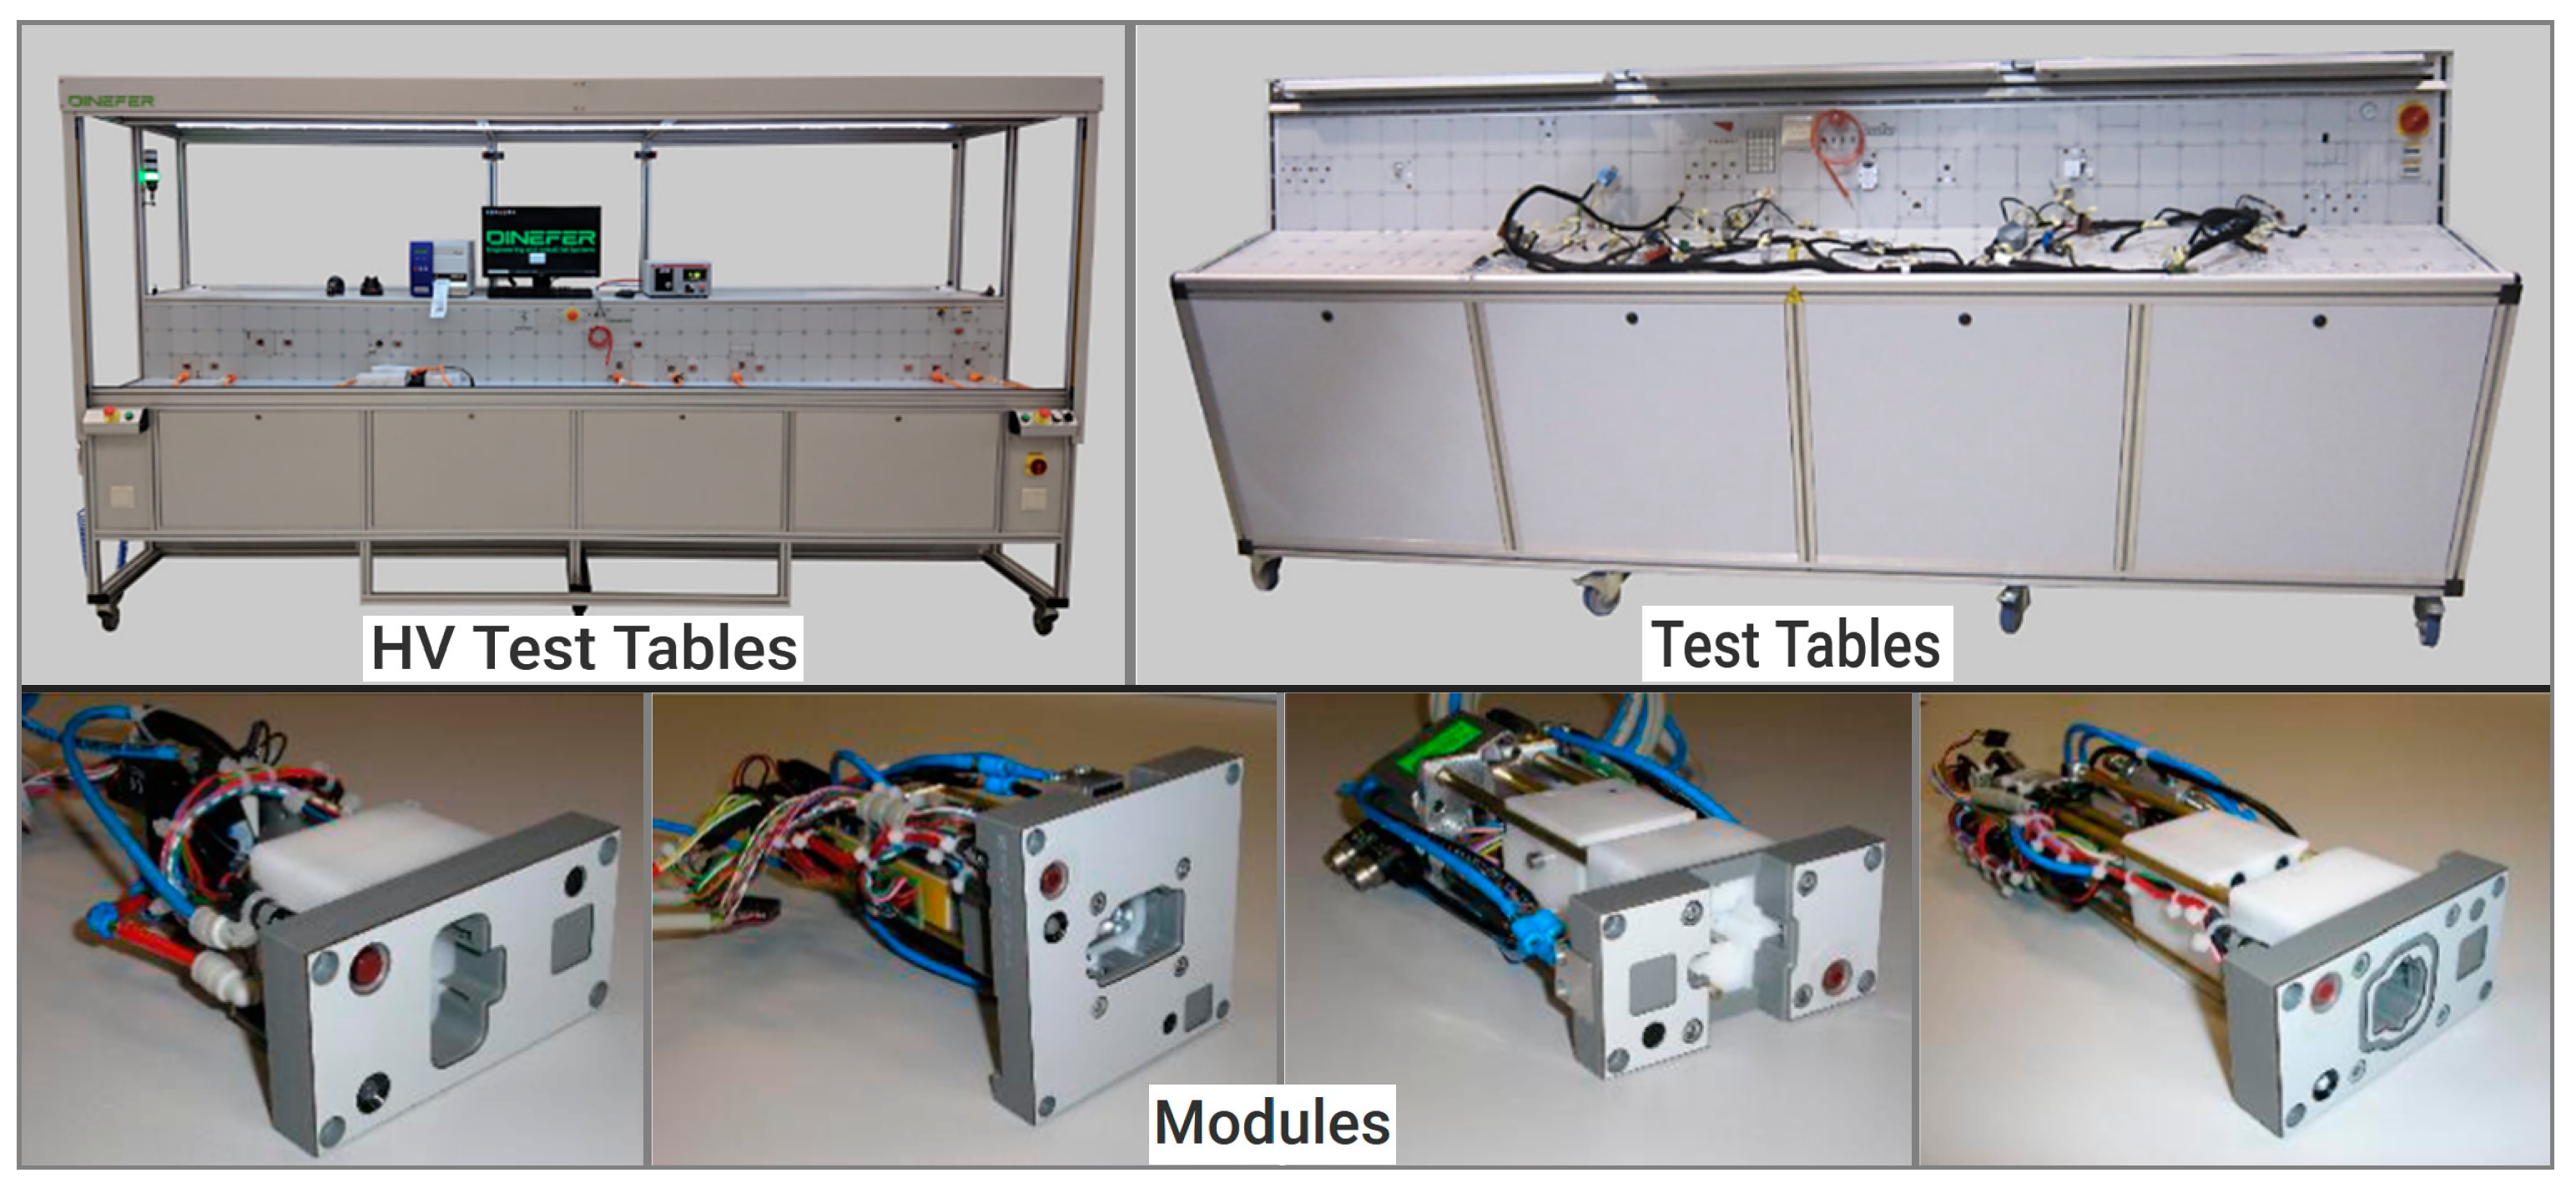
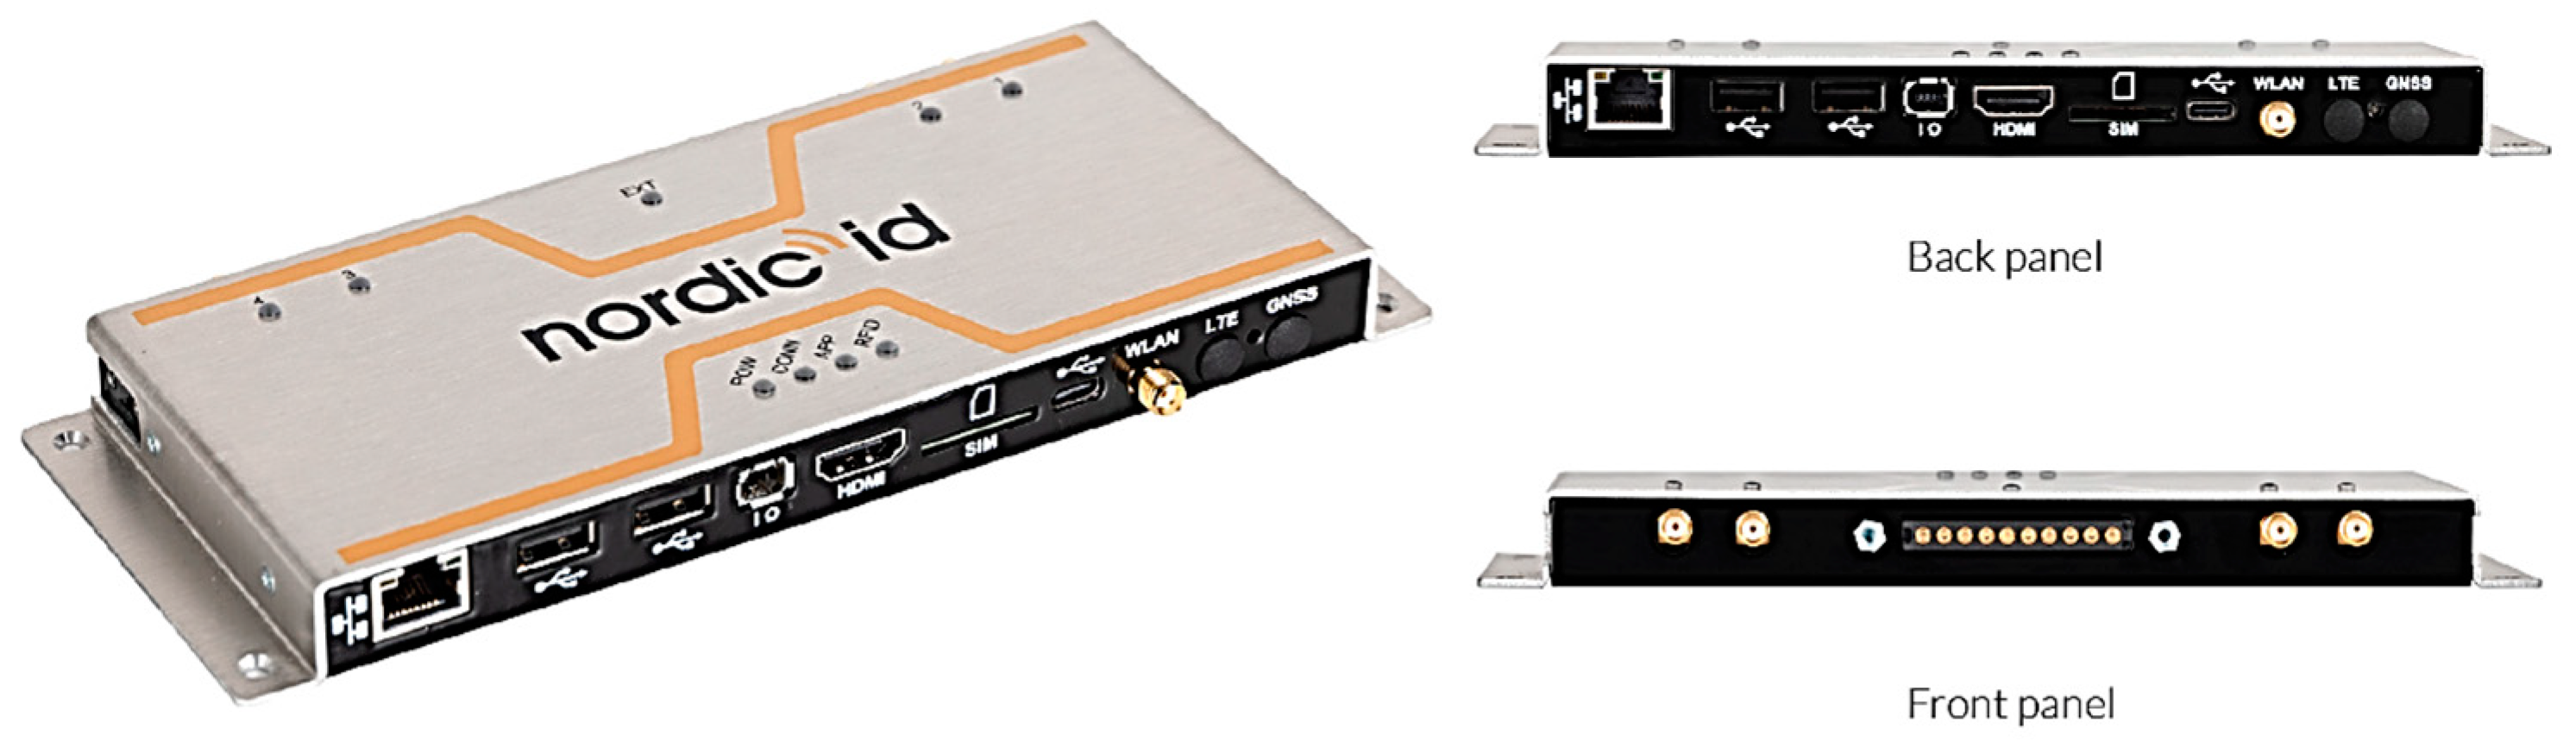
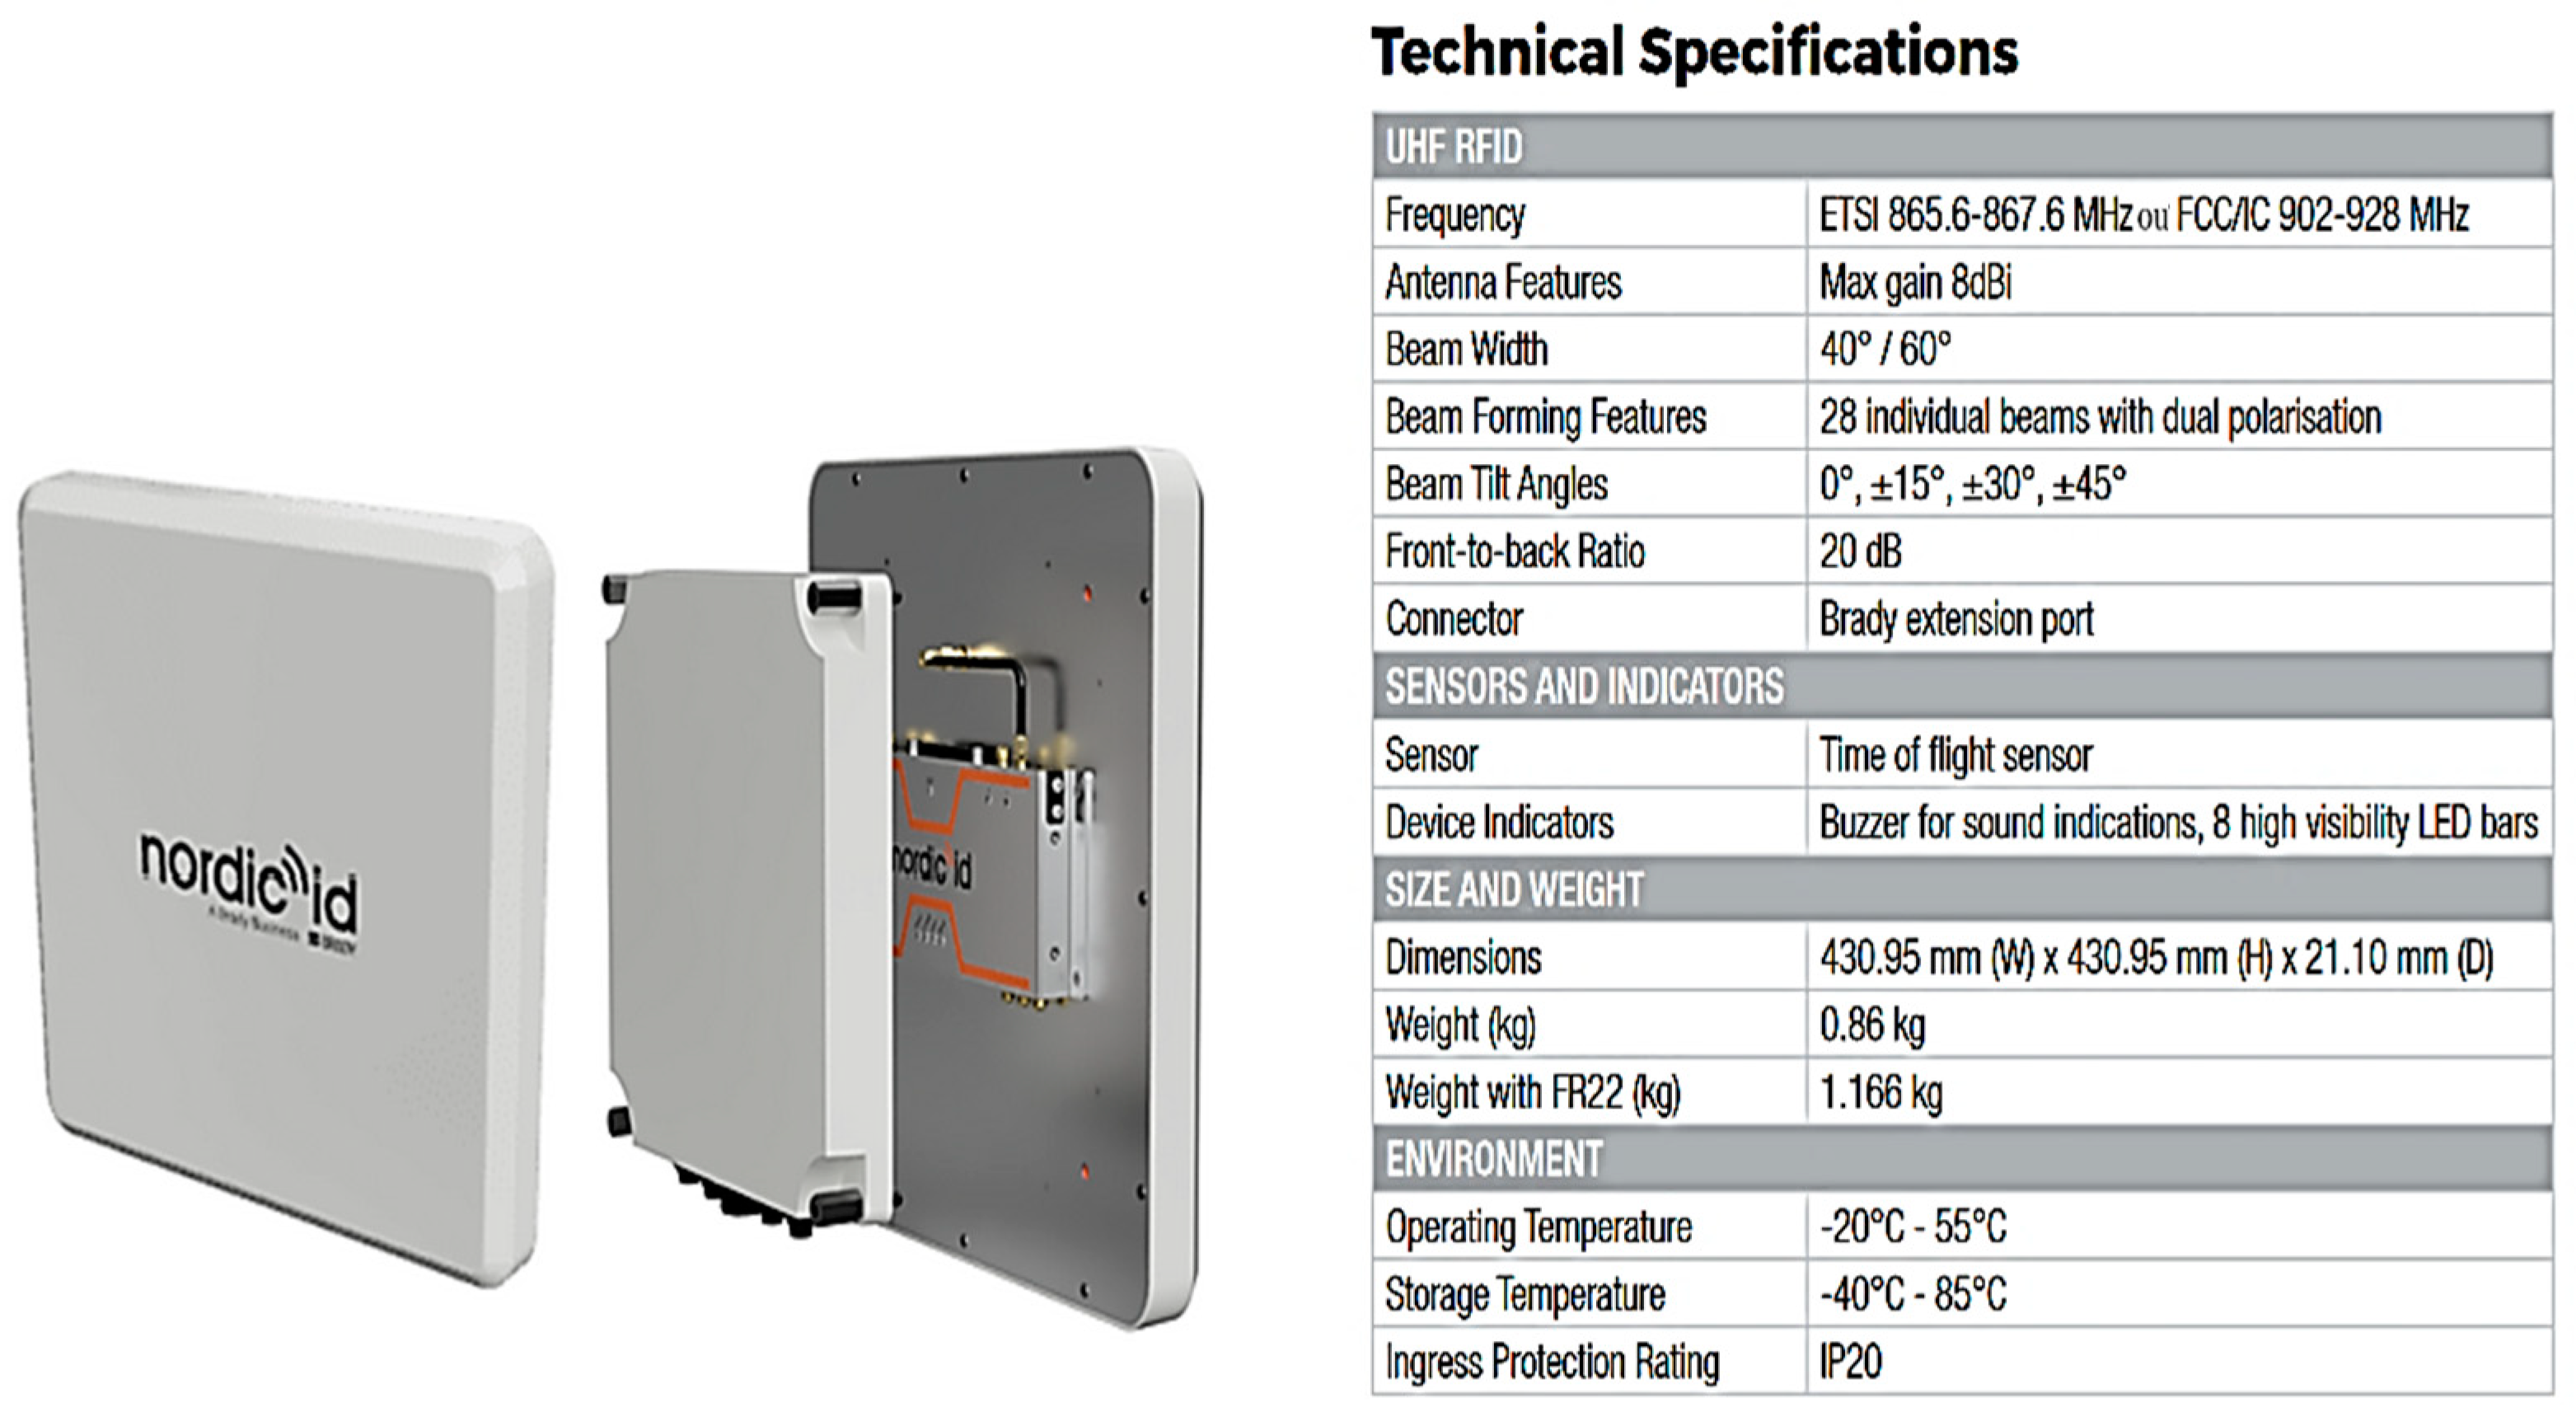
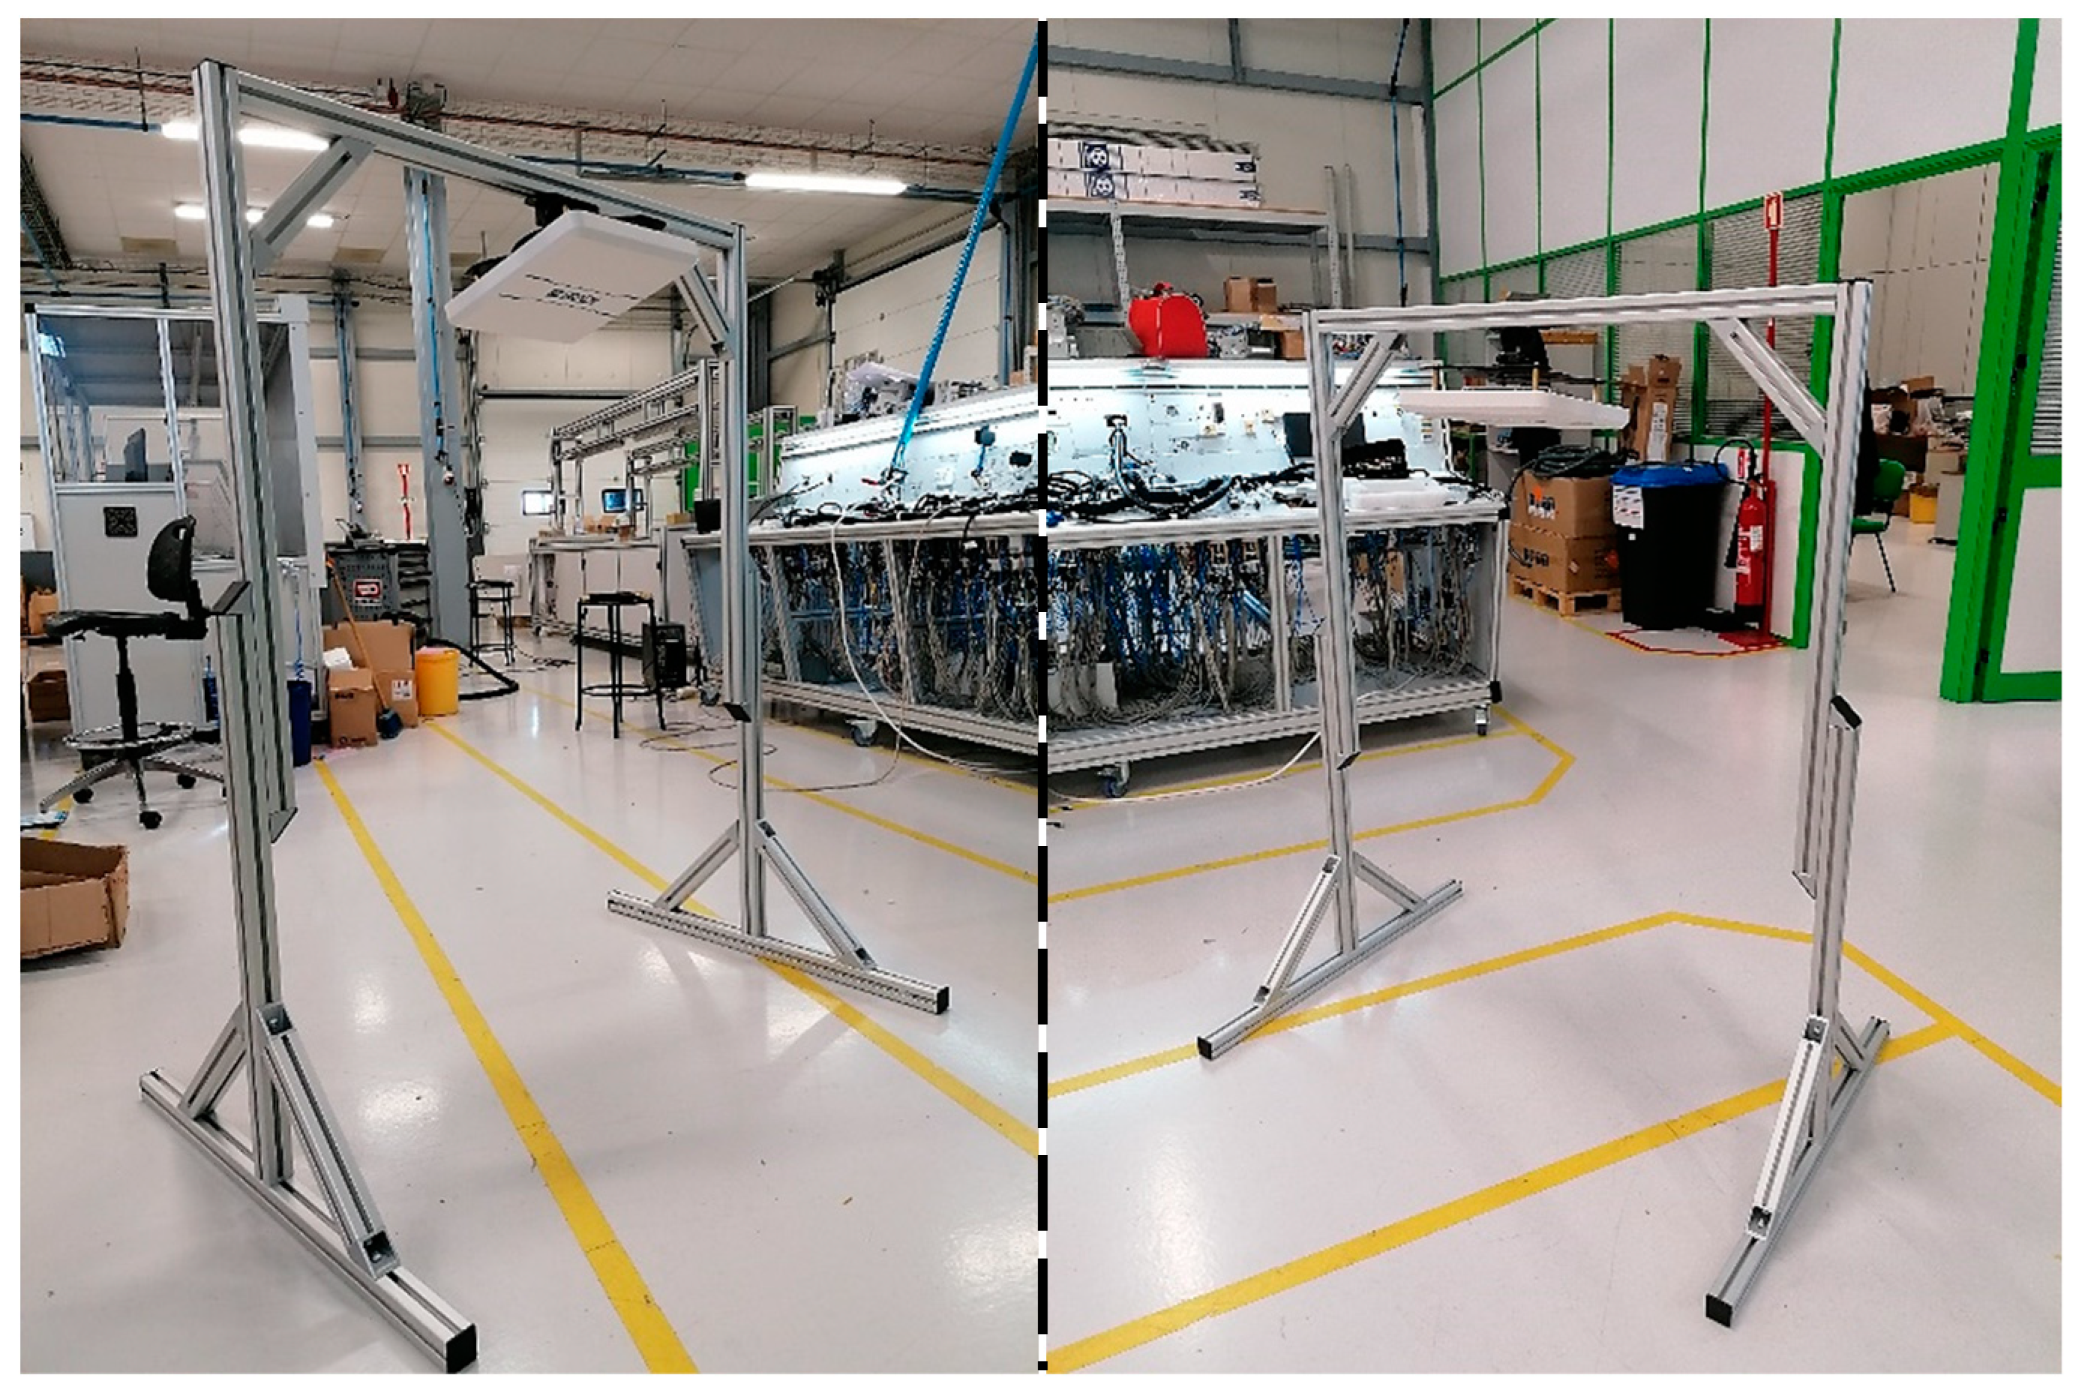

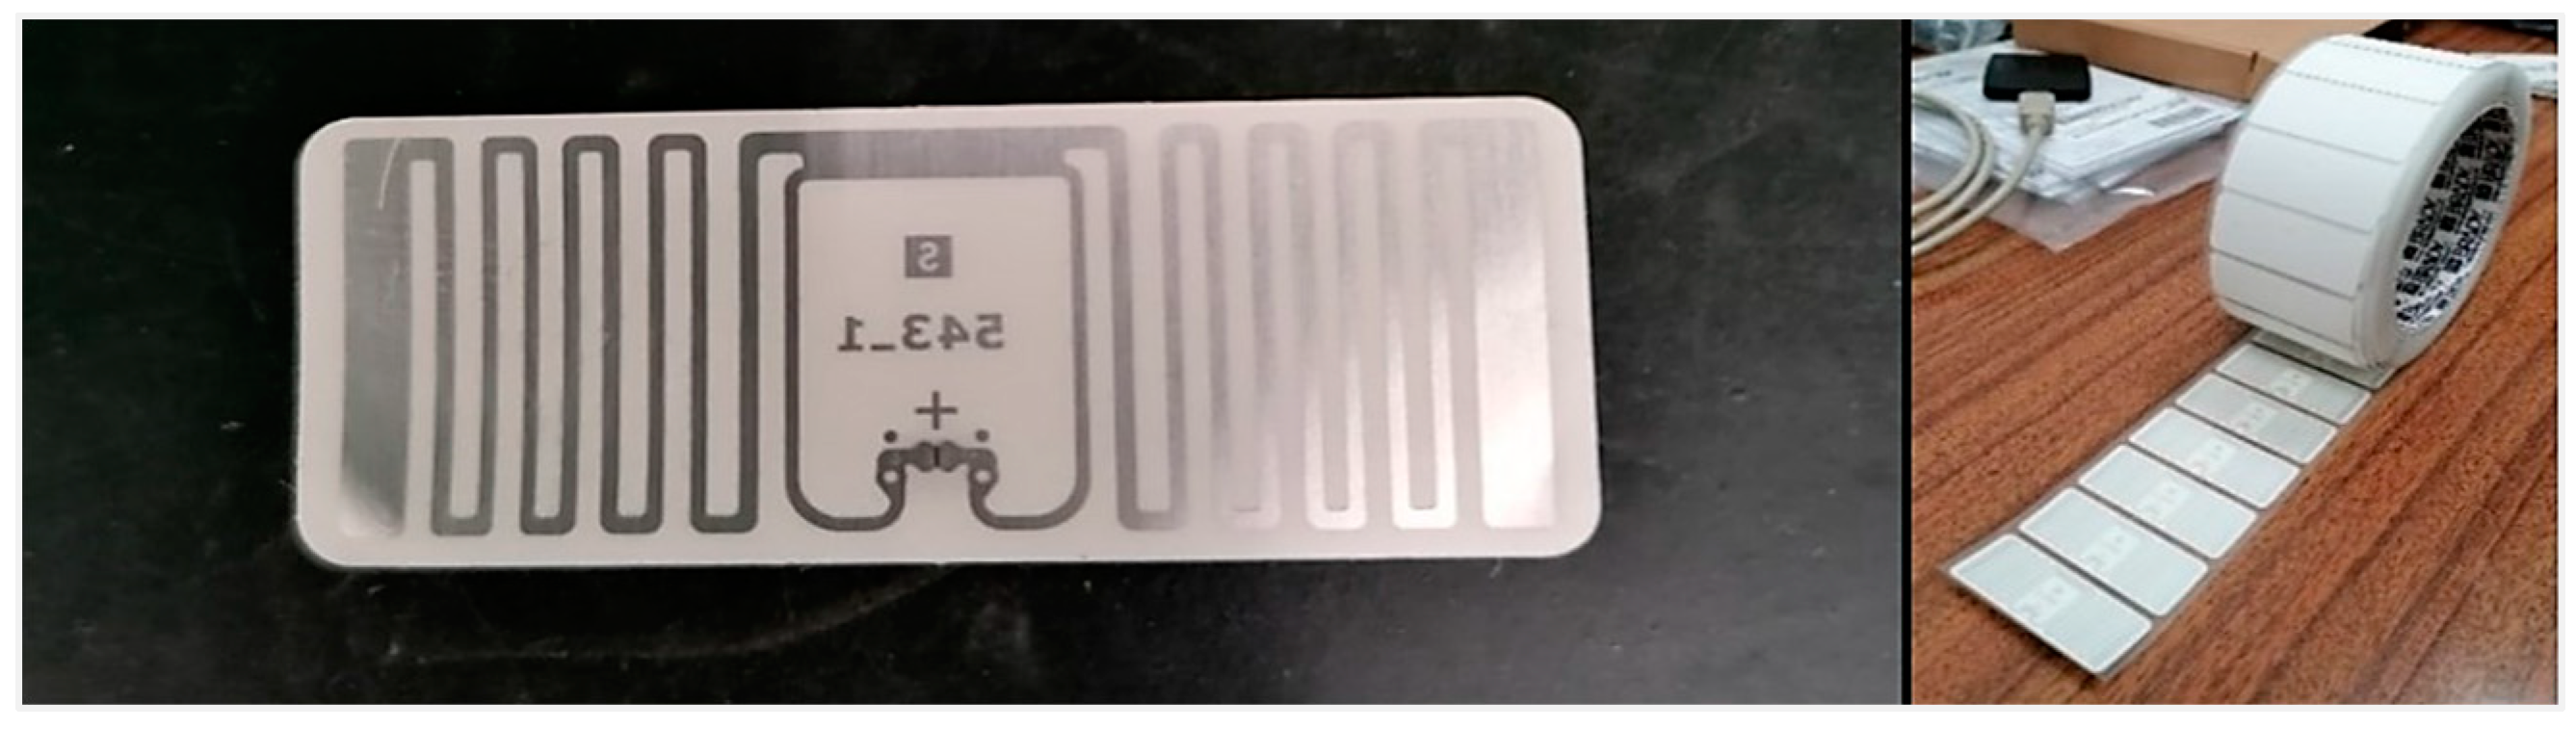

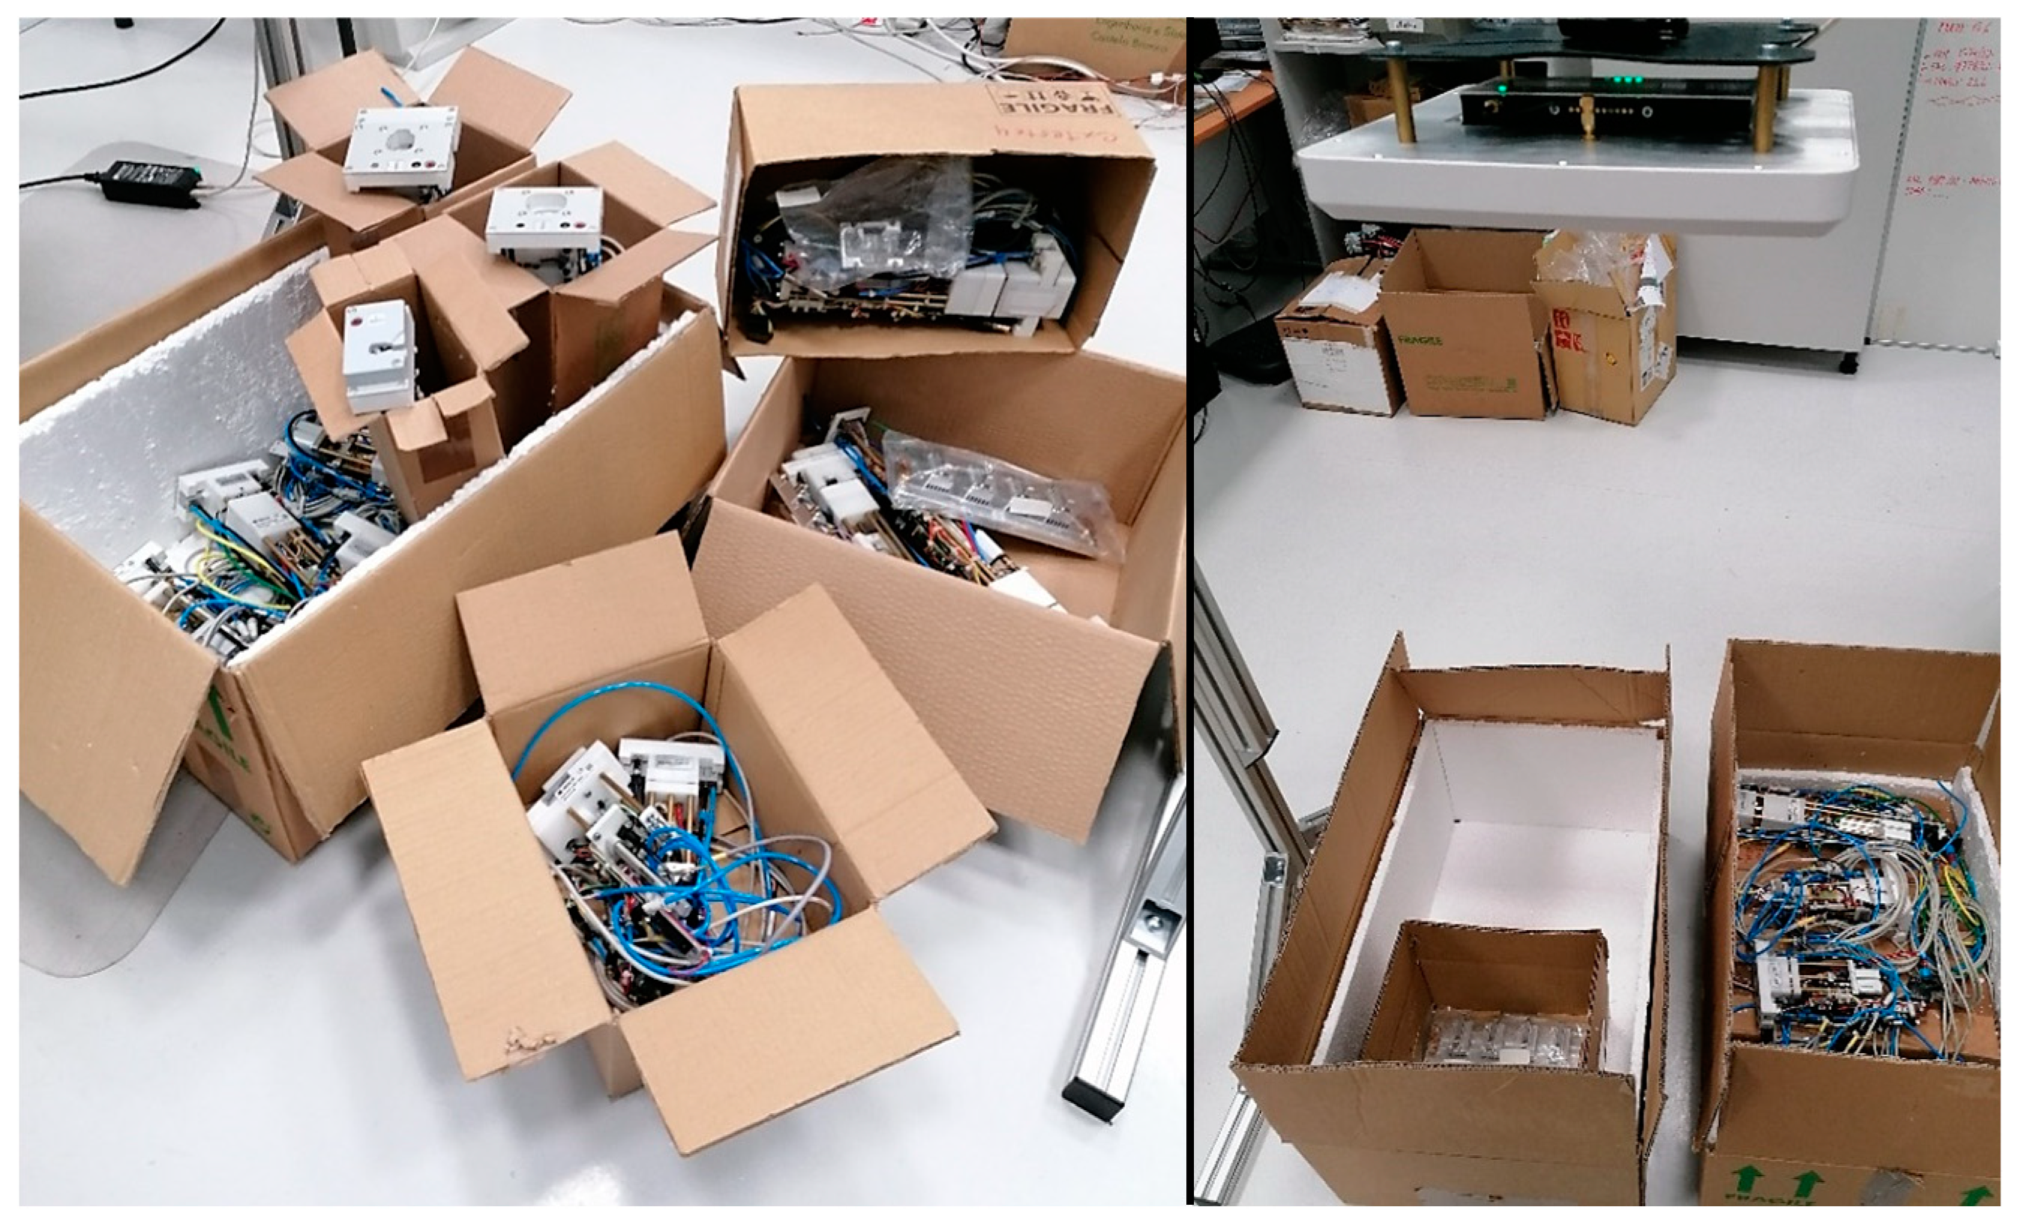
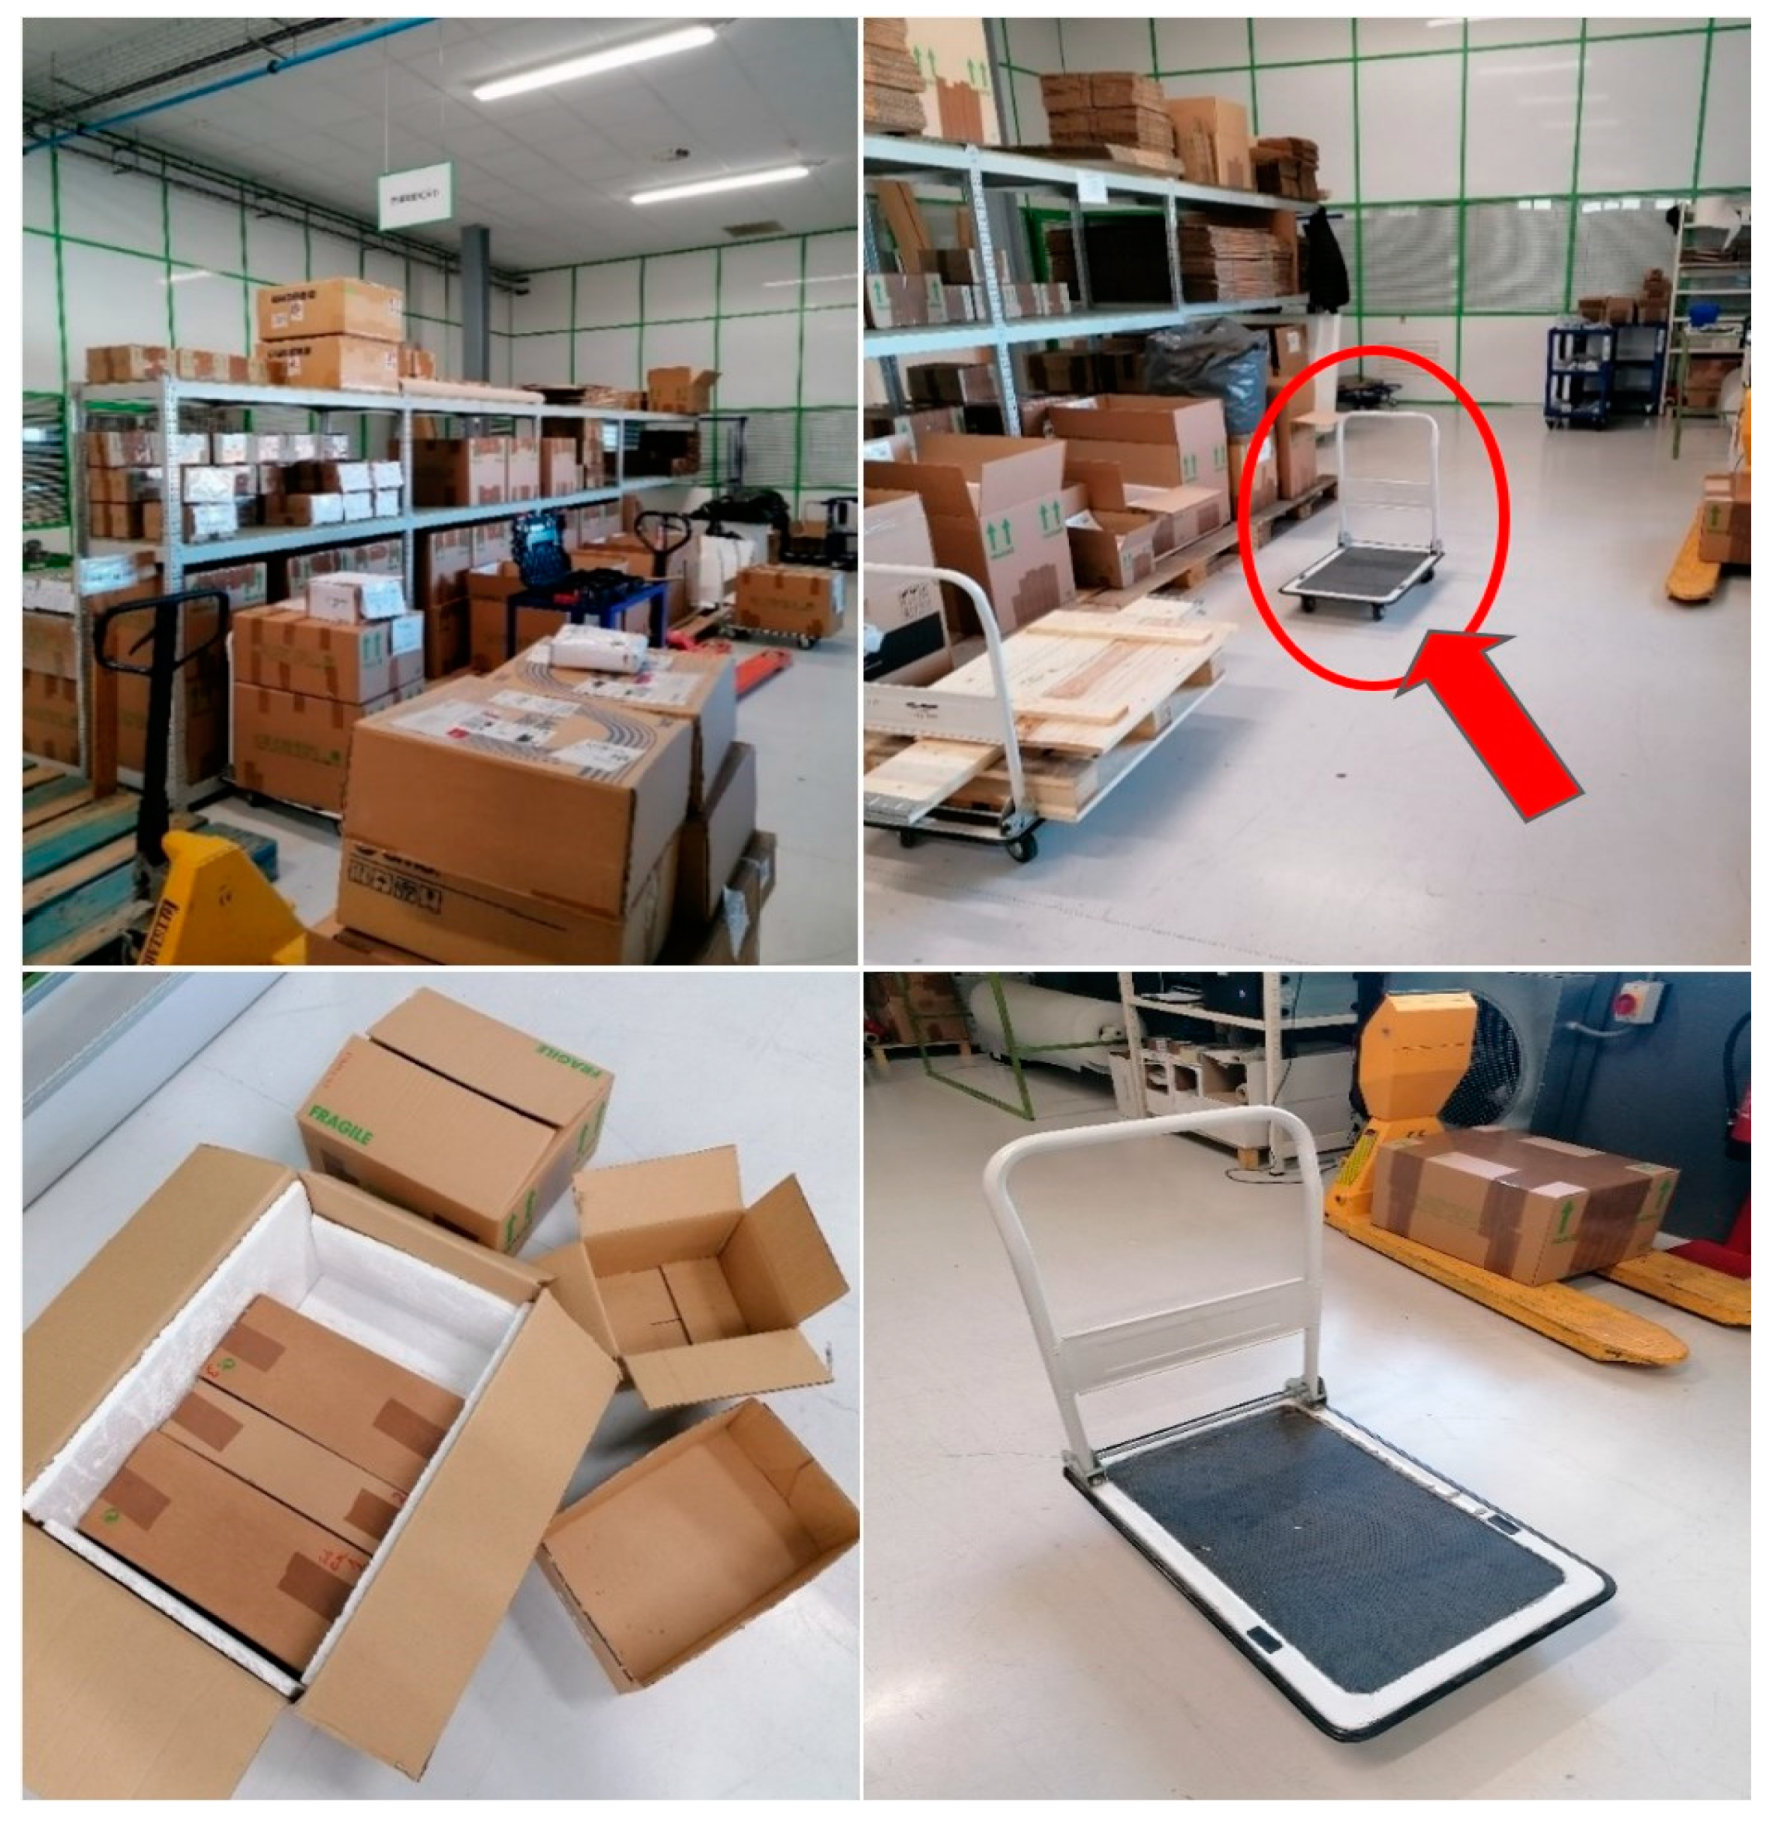
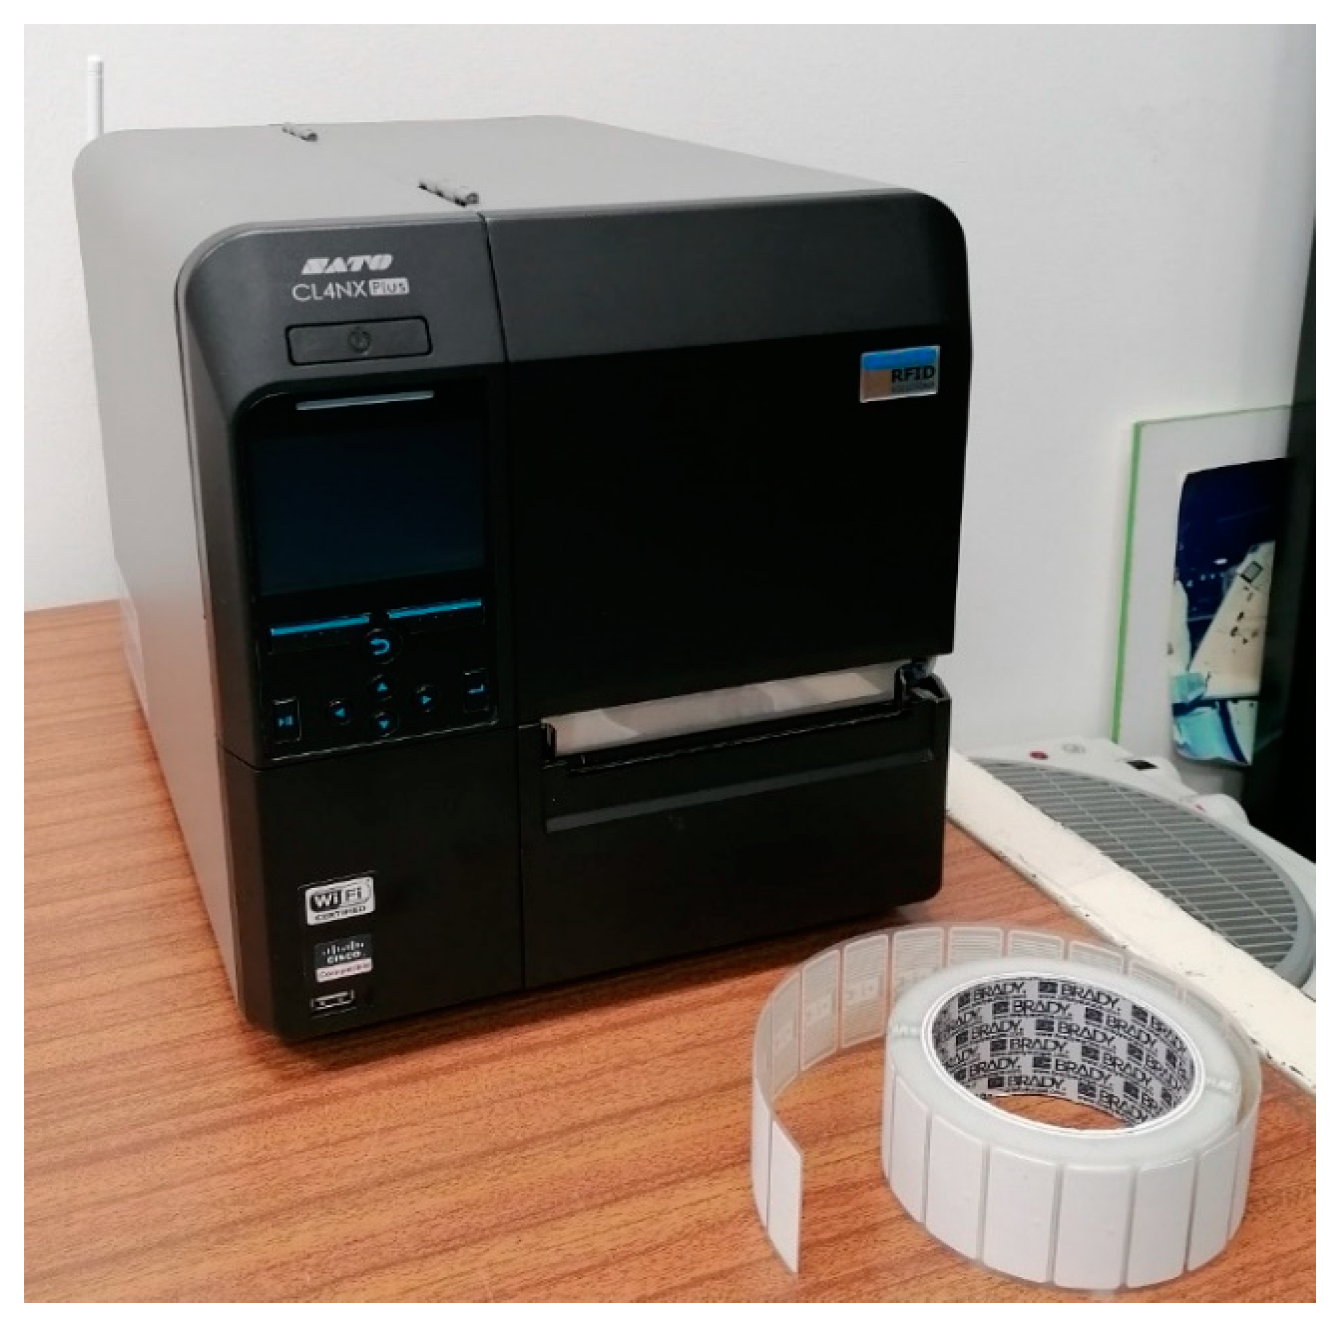
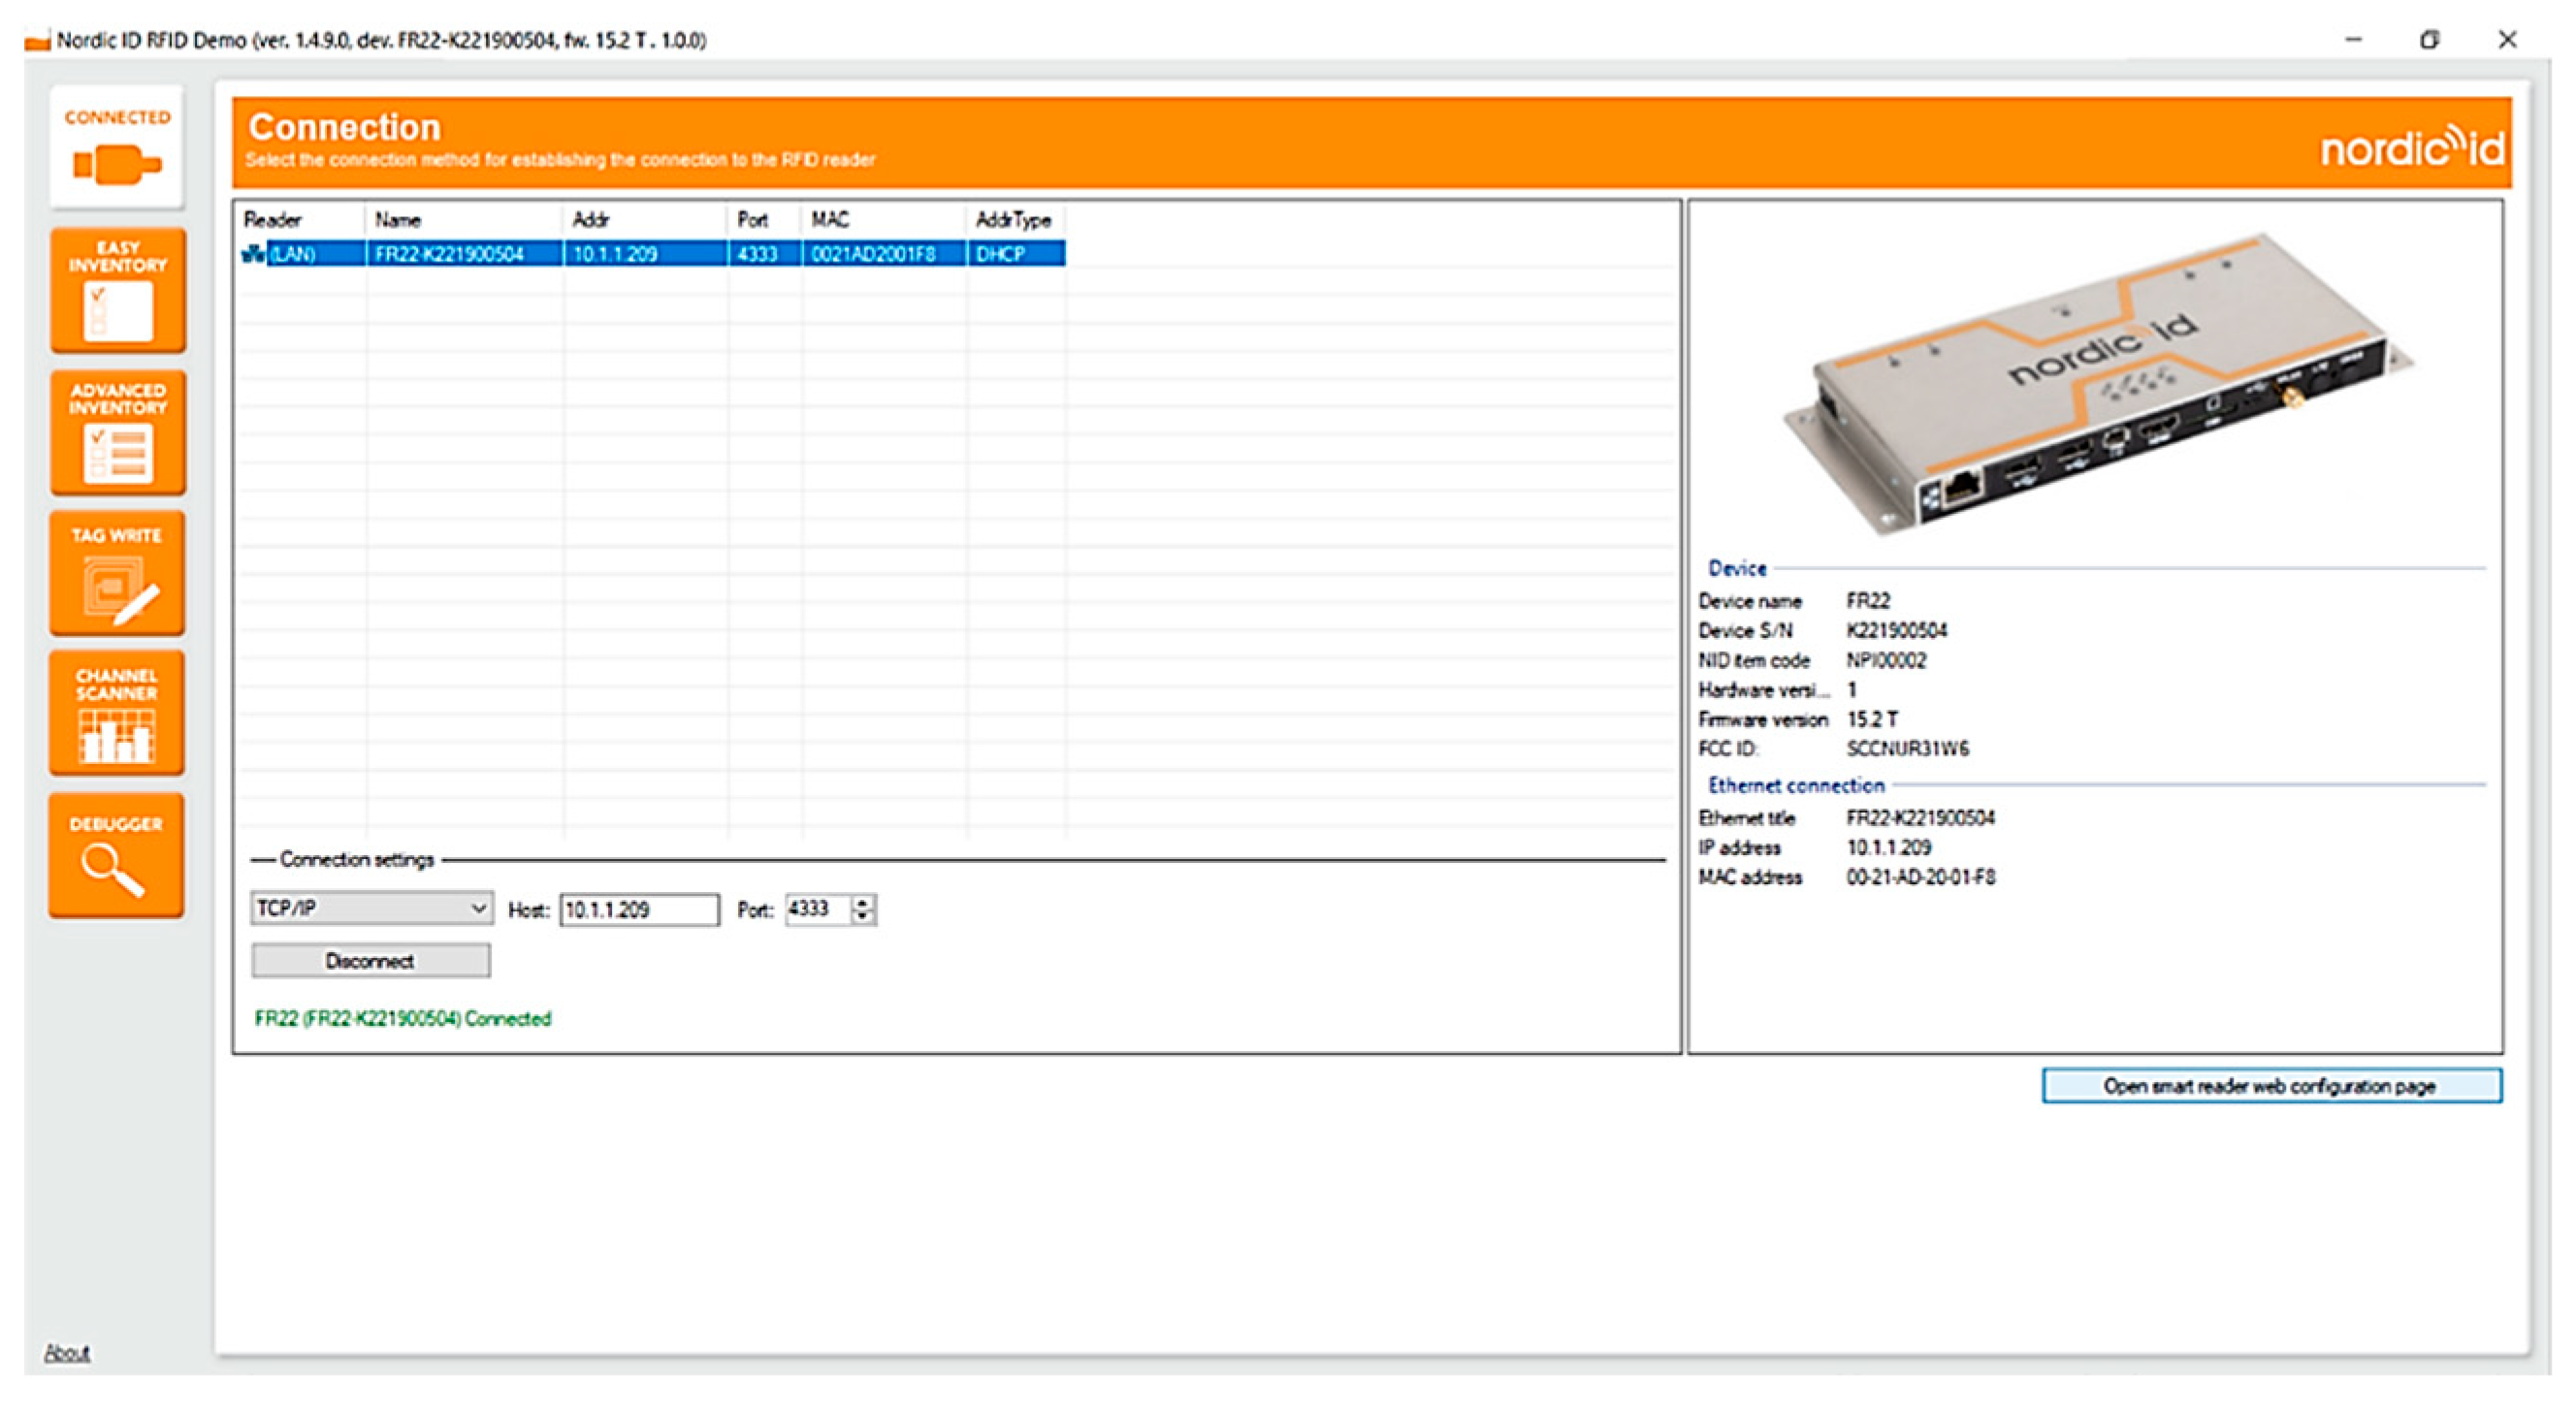
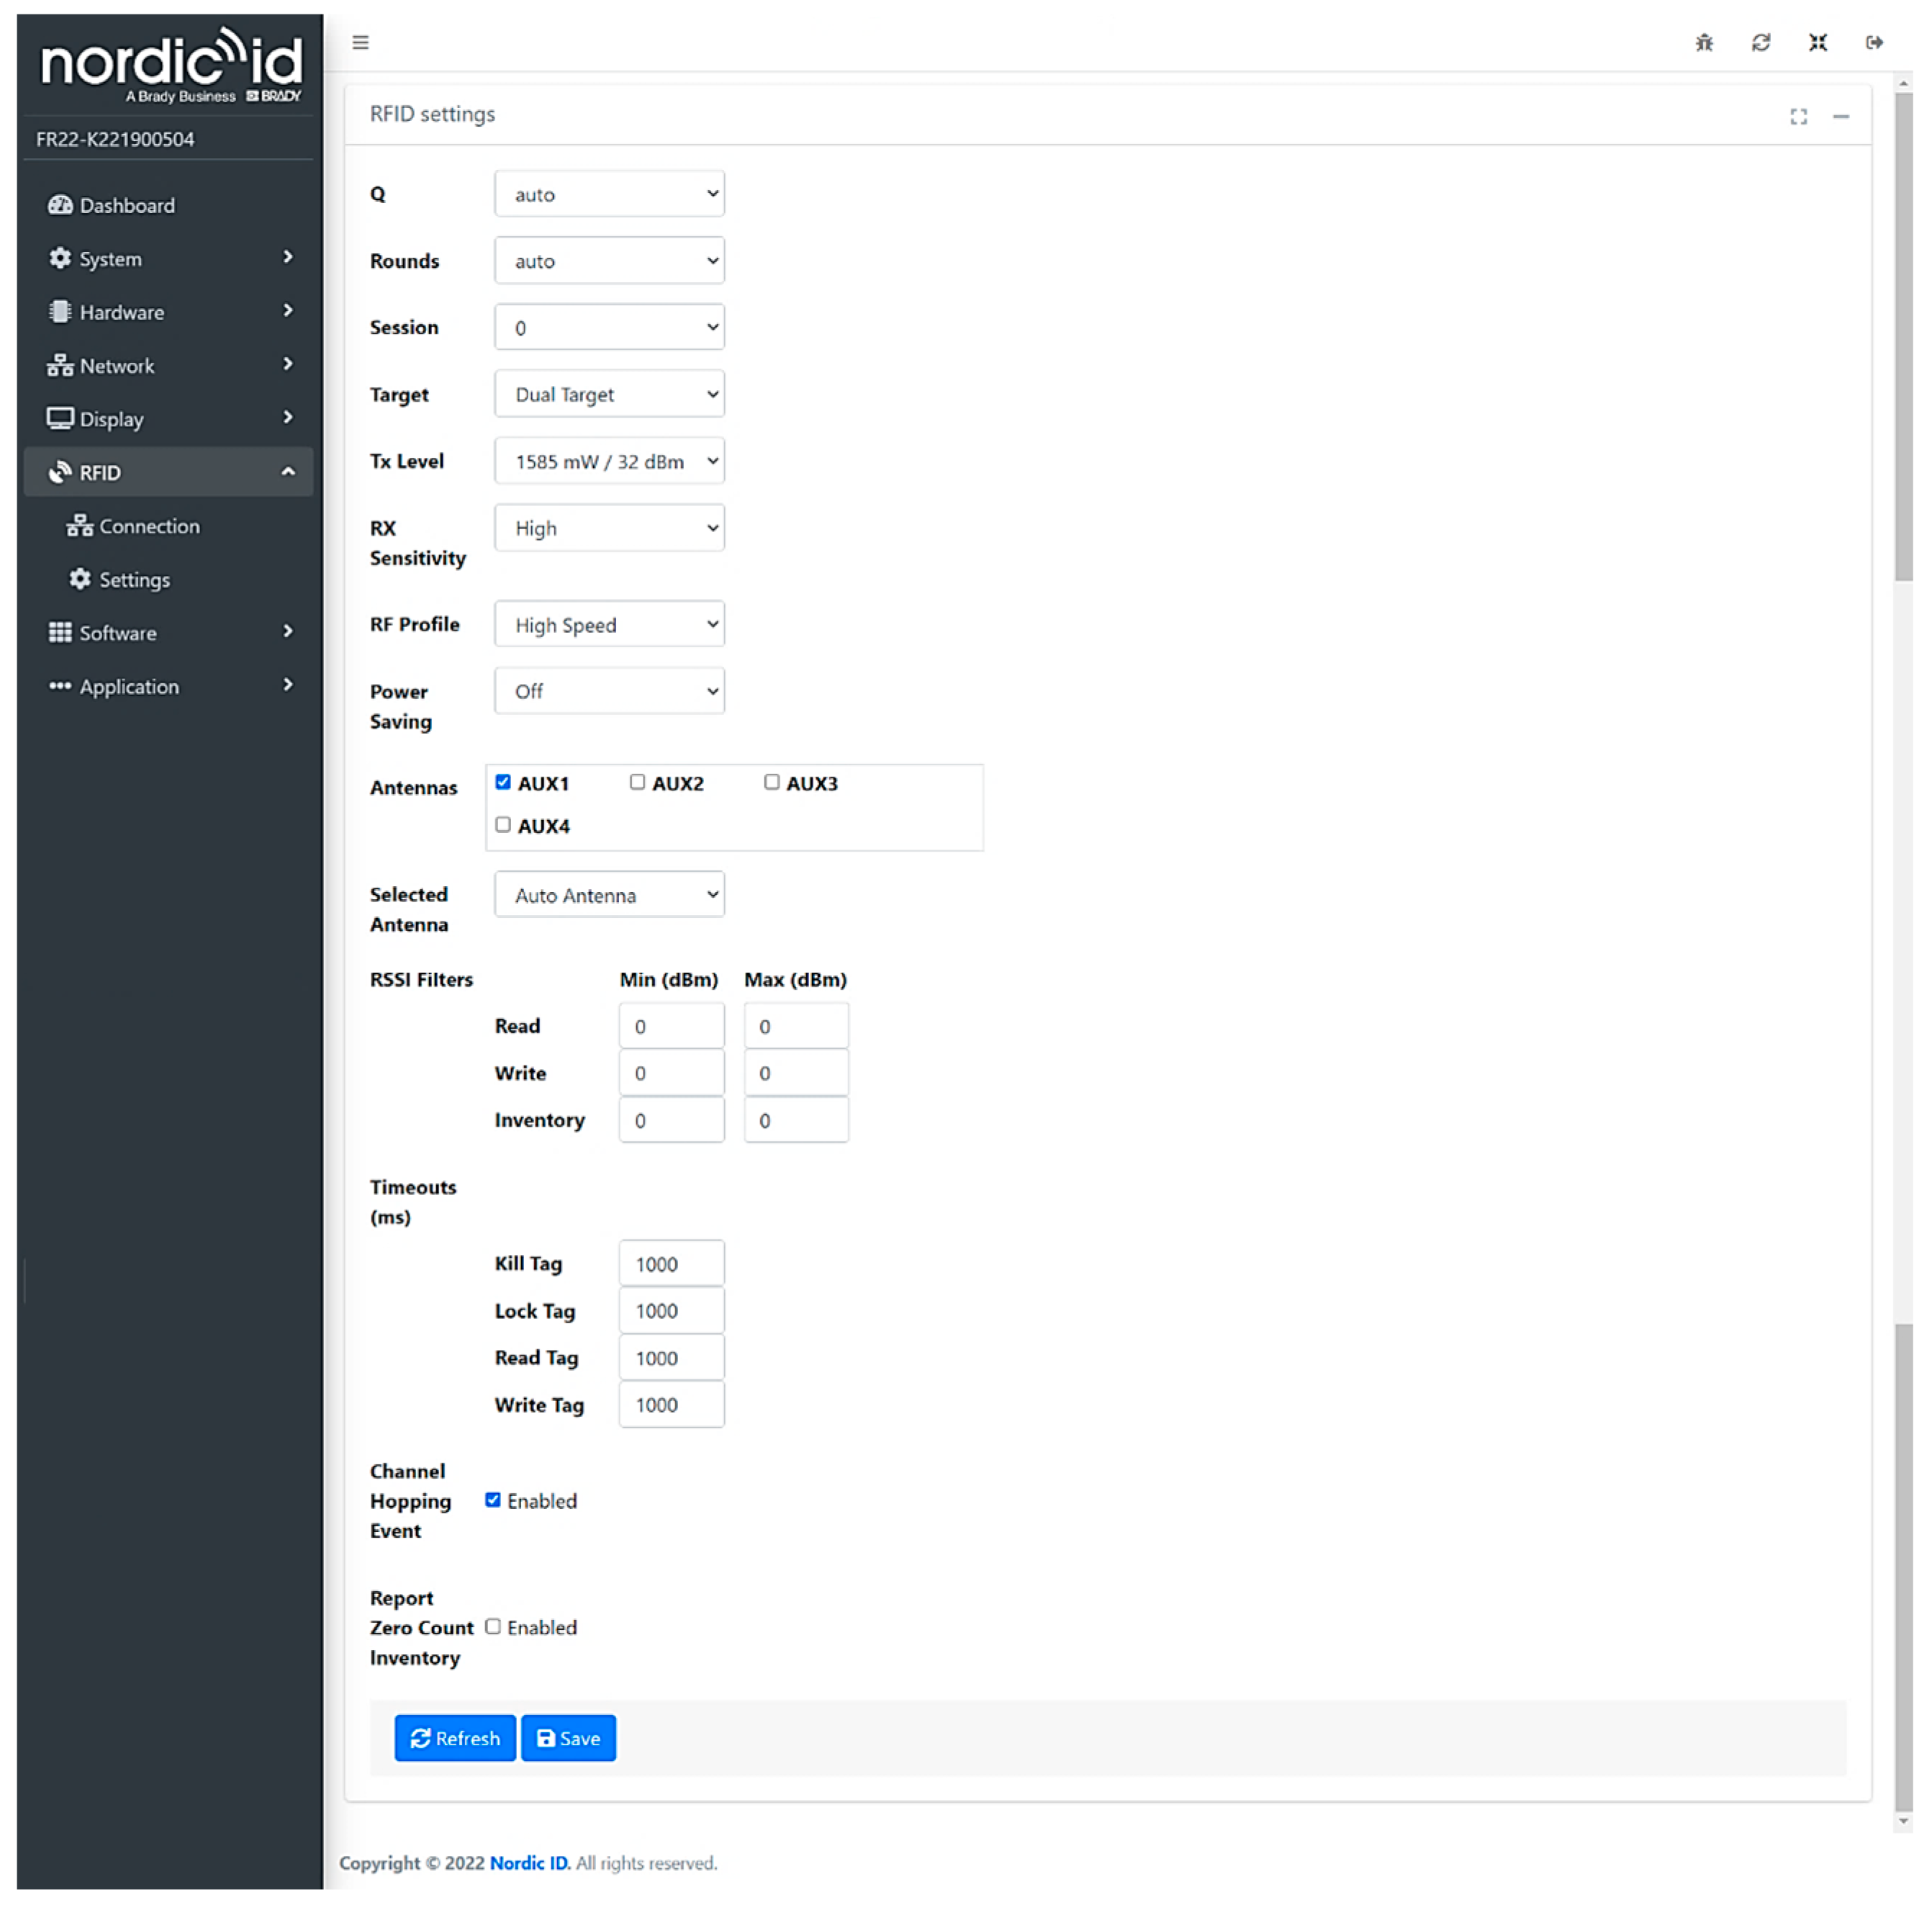
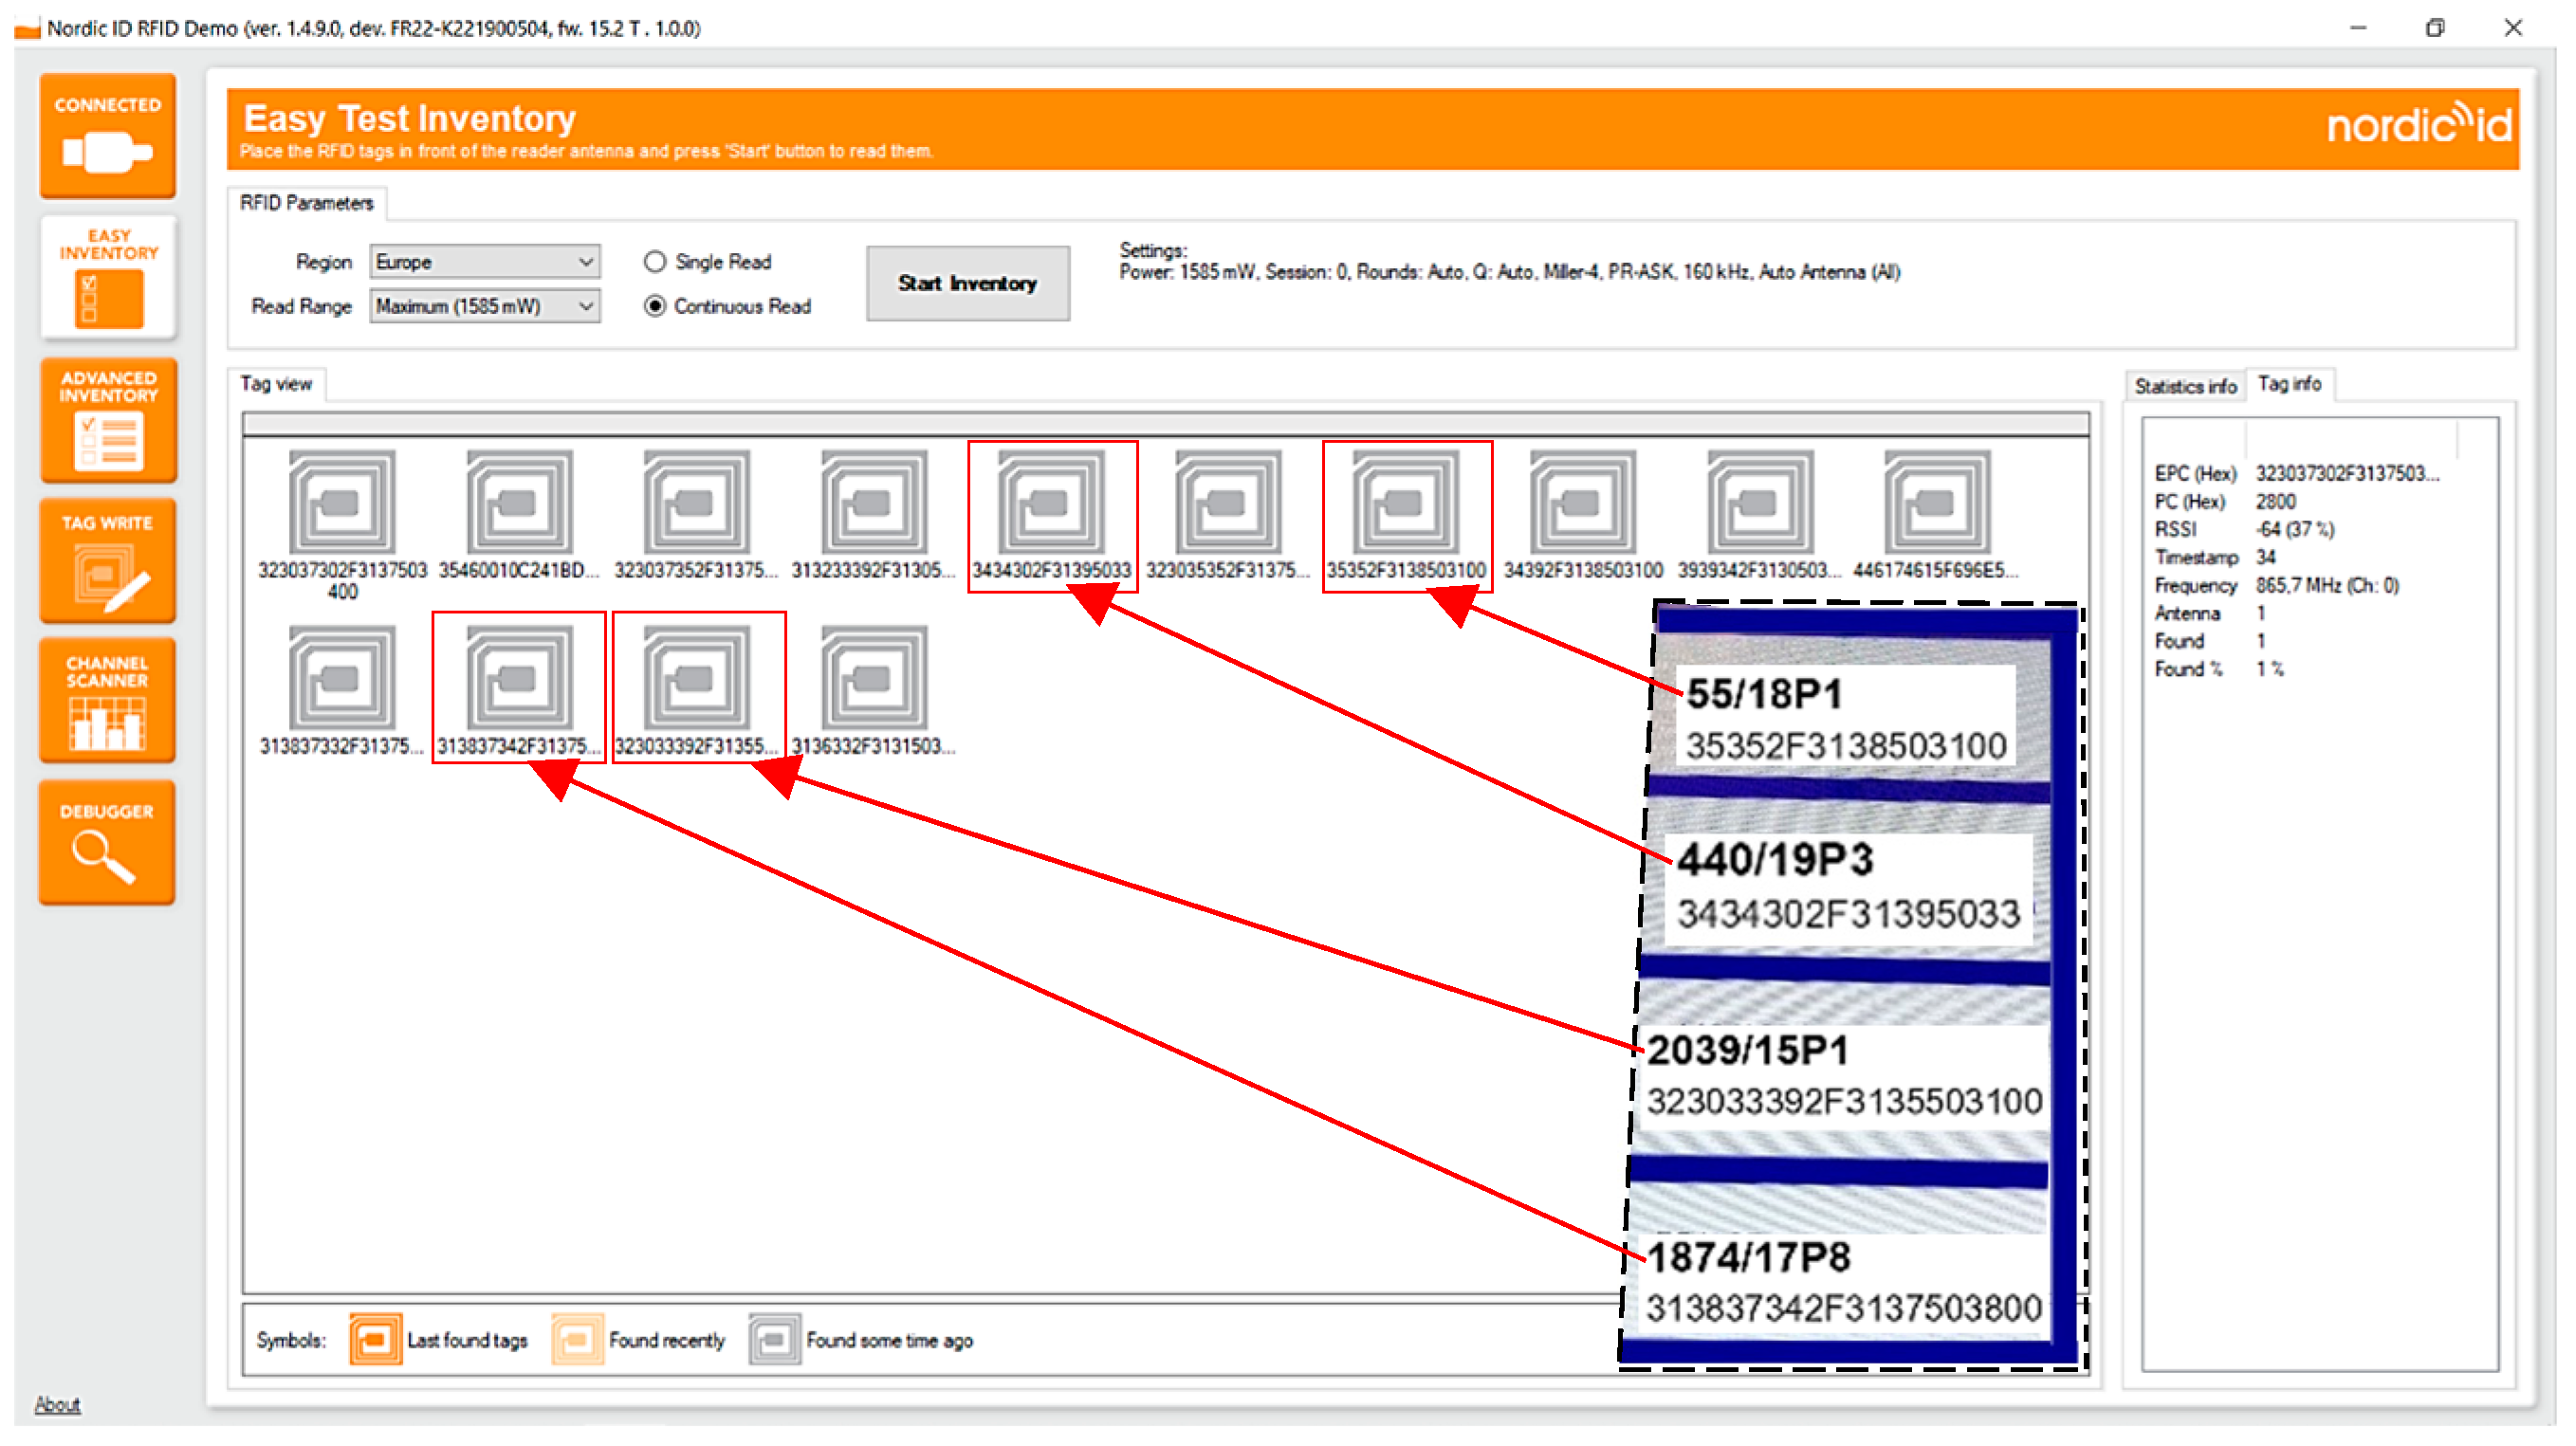
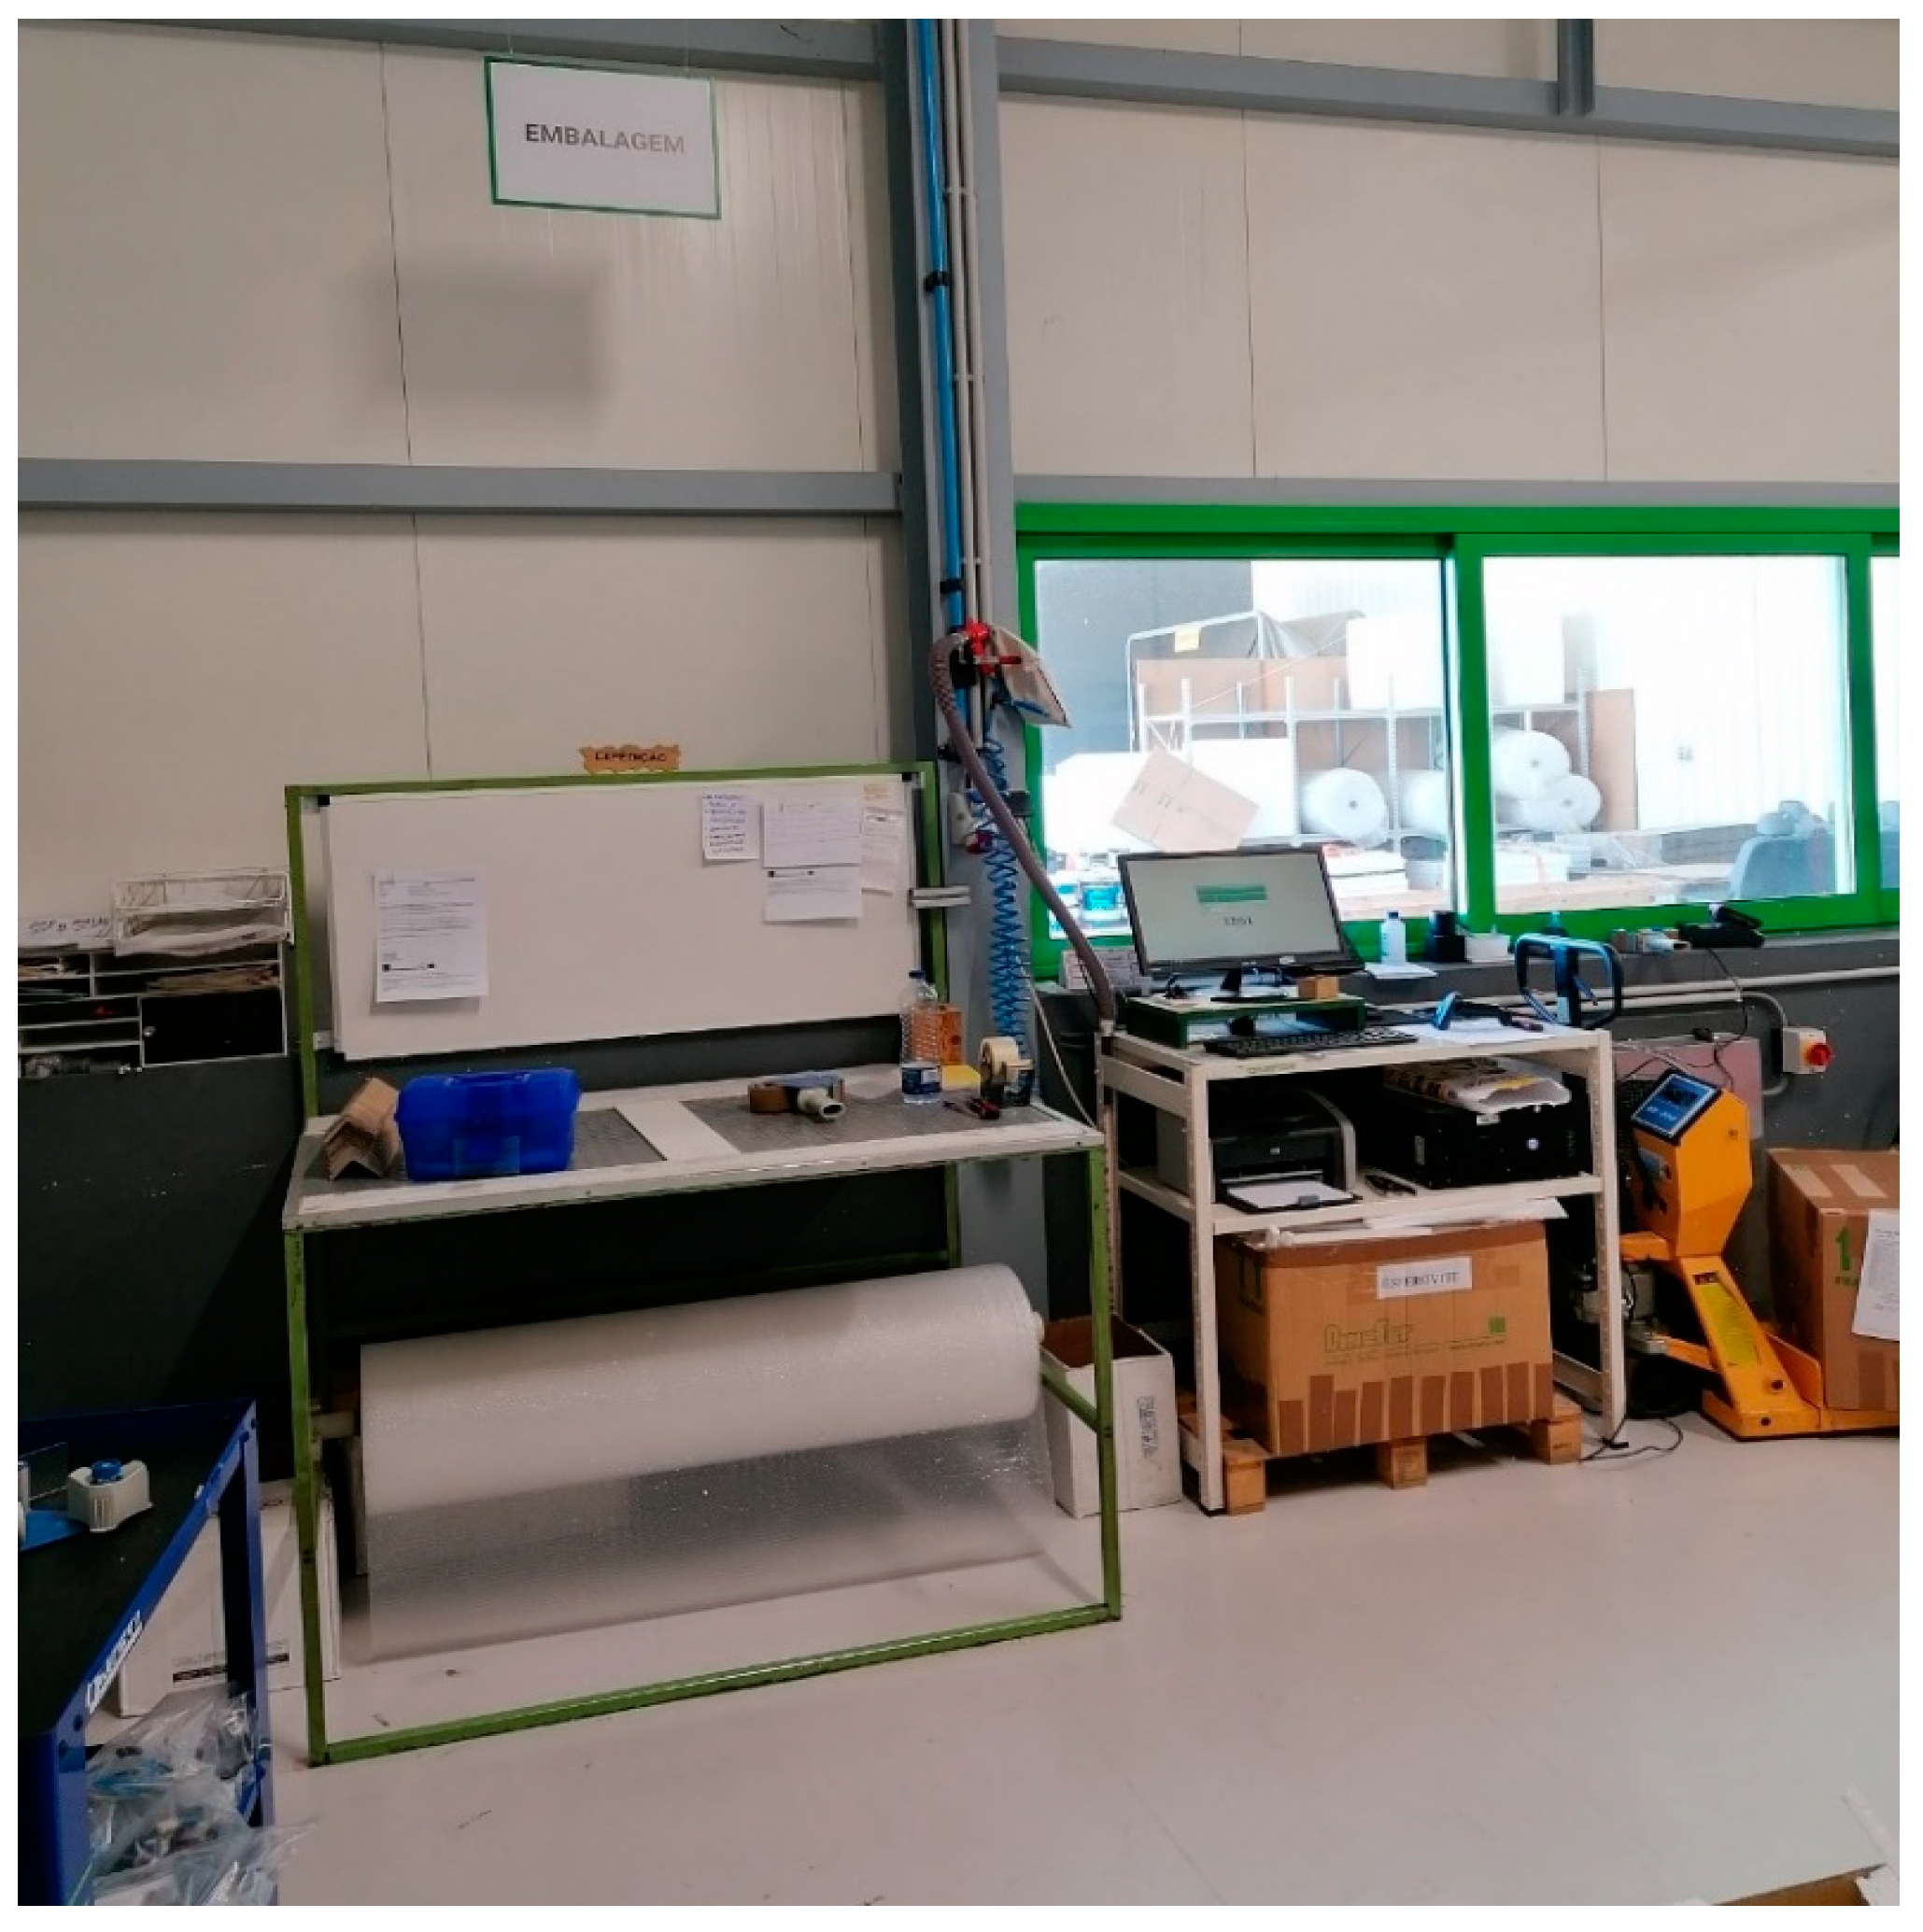


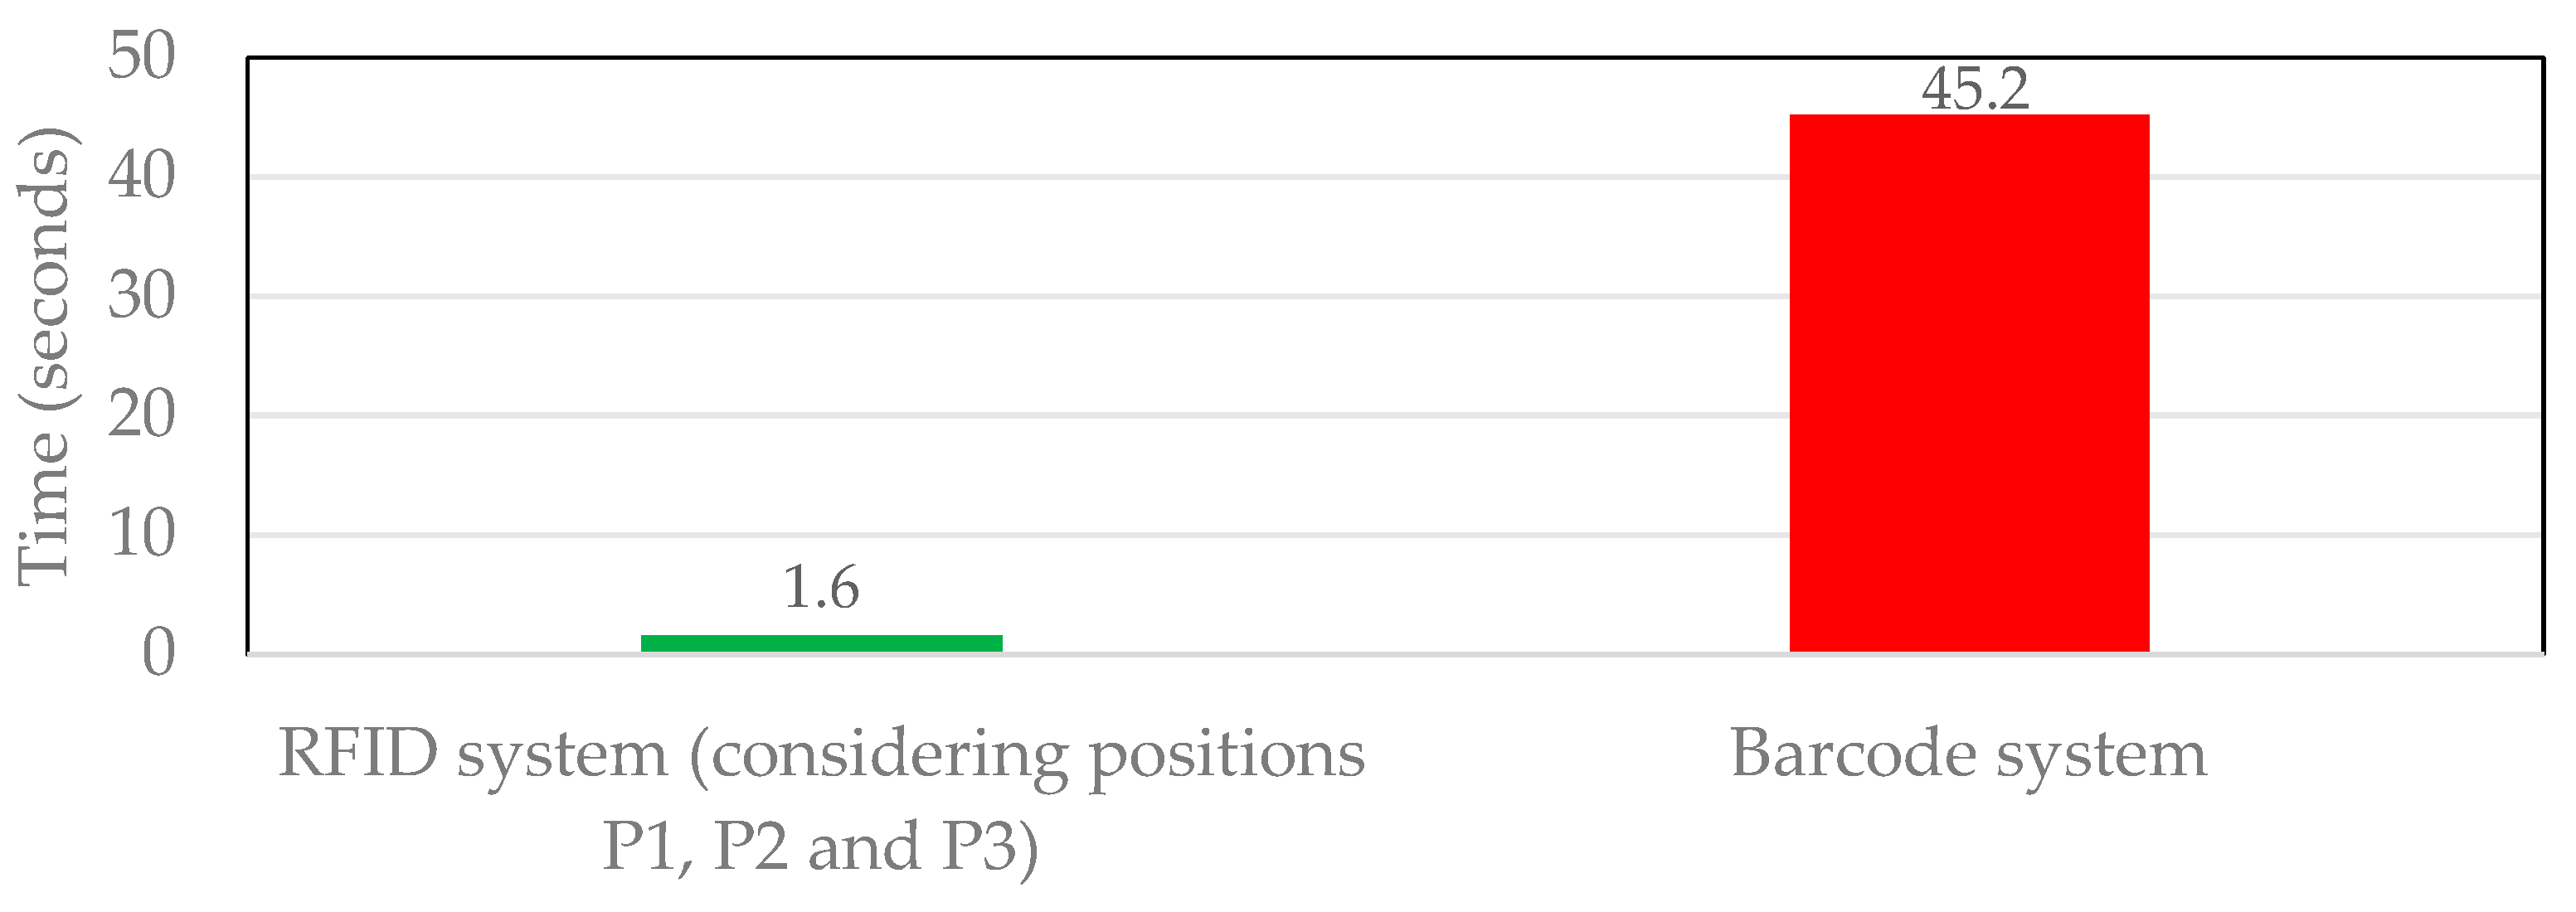

