
Online Dynamic Network Visualization Based on SIPA Layout Algorithm
Abstract
:1. Introduction
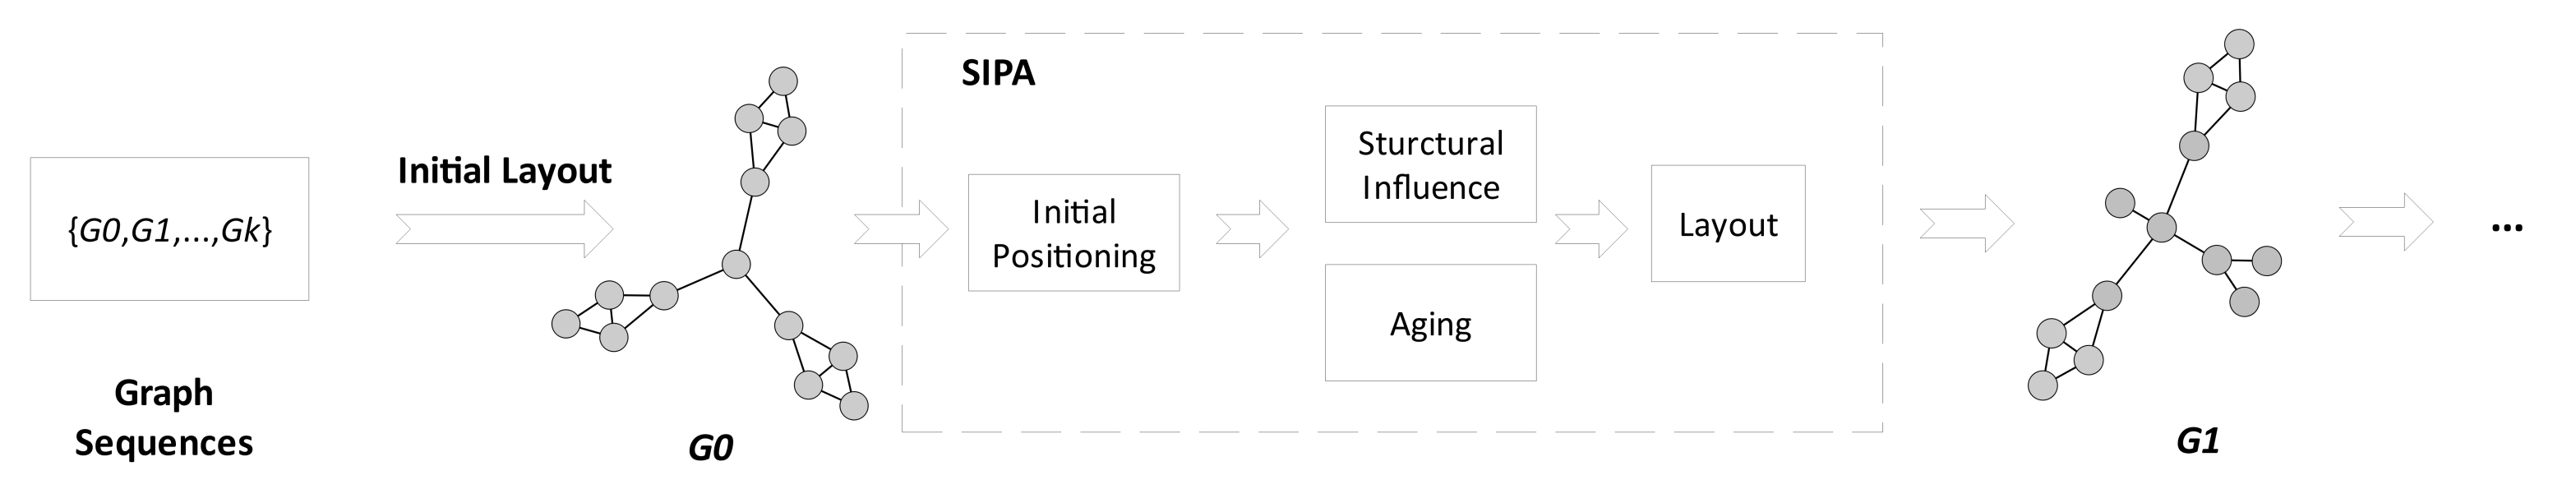
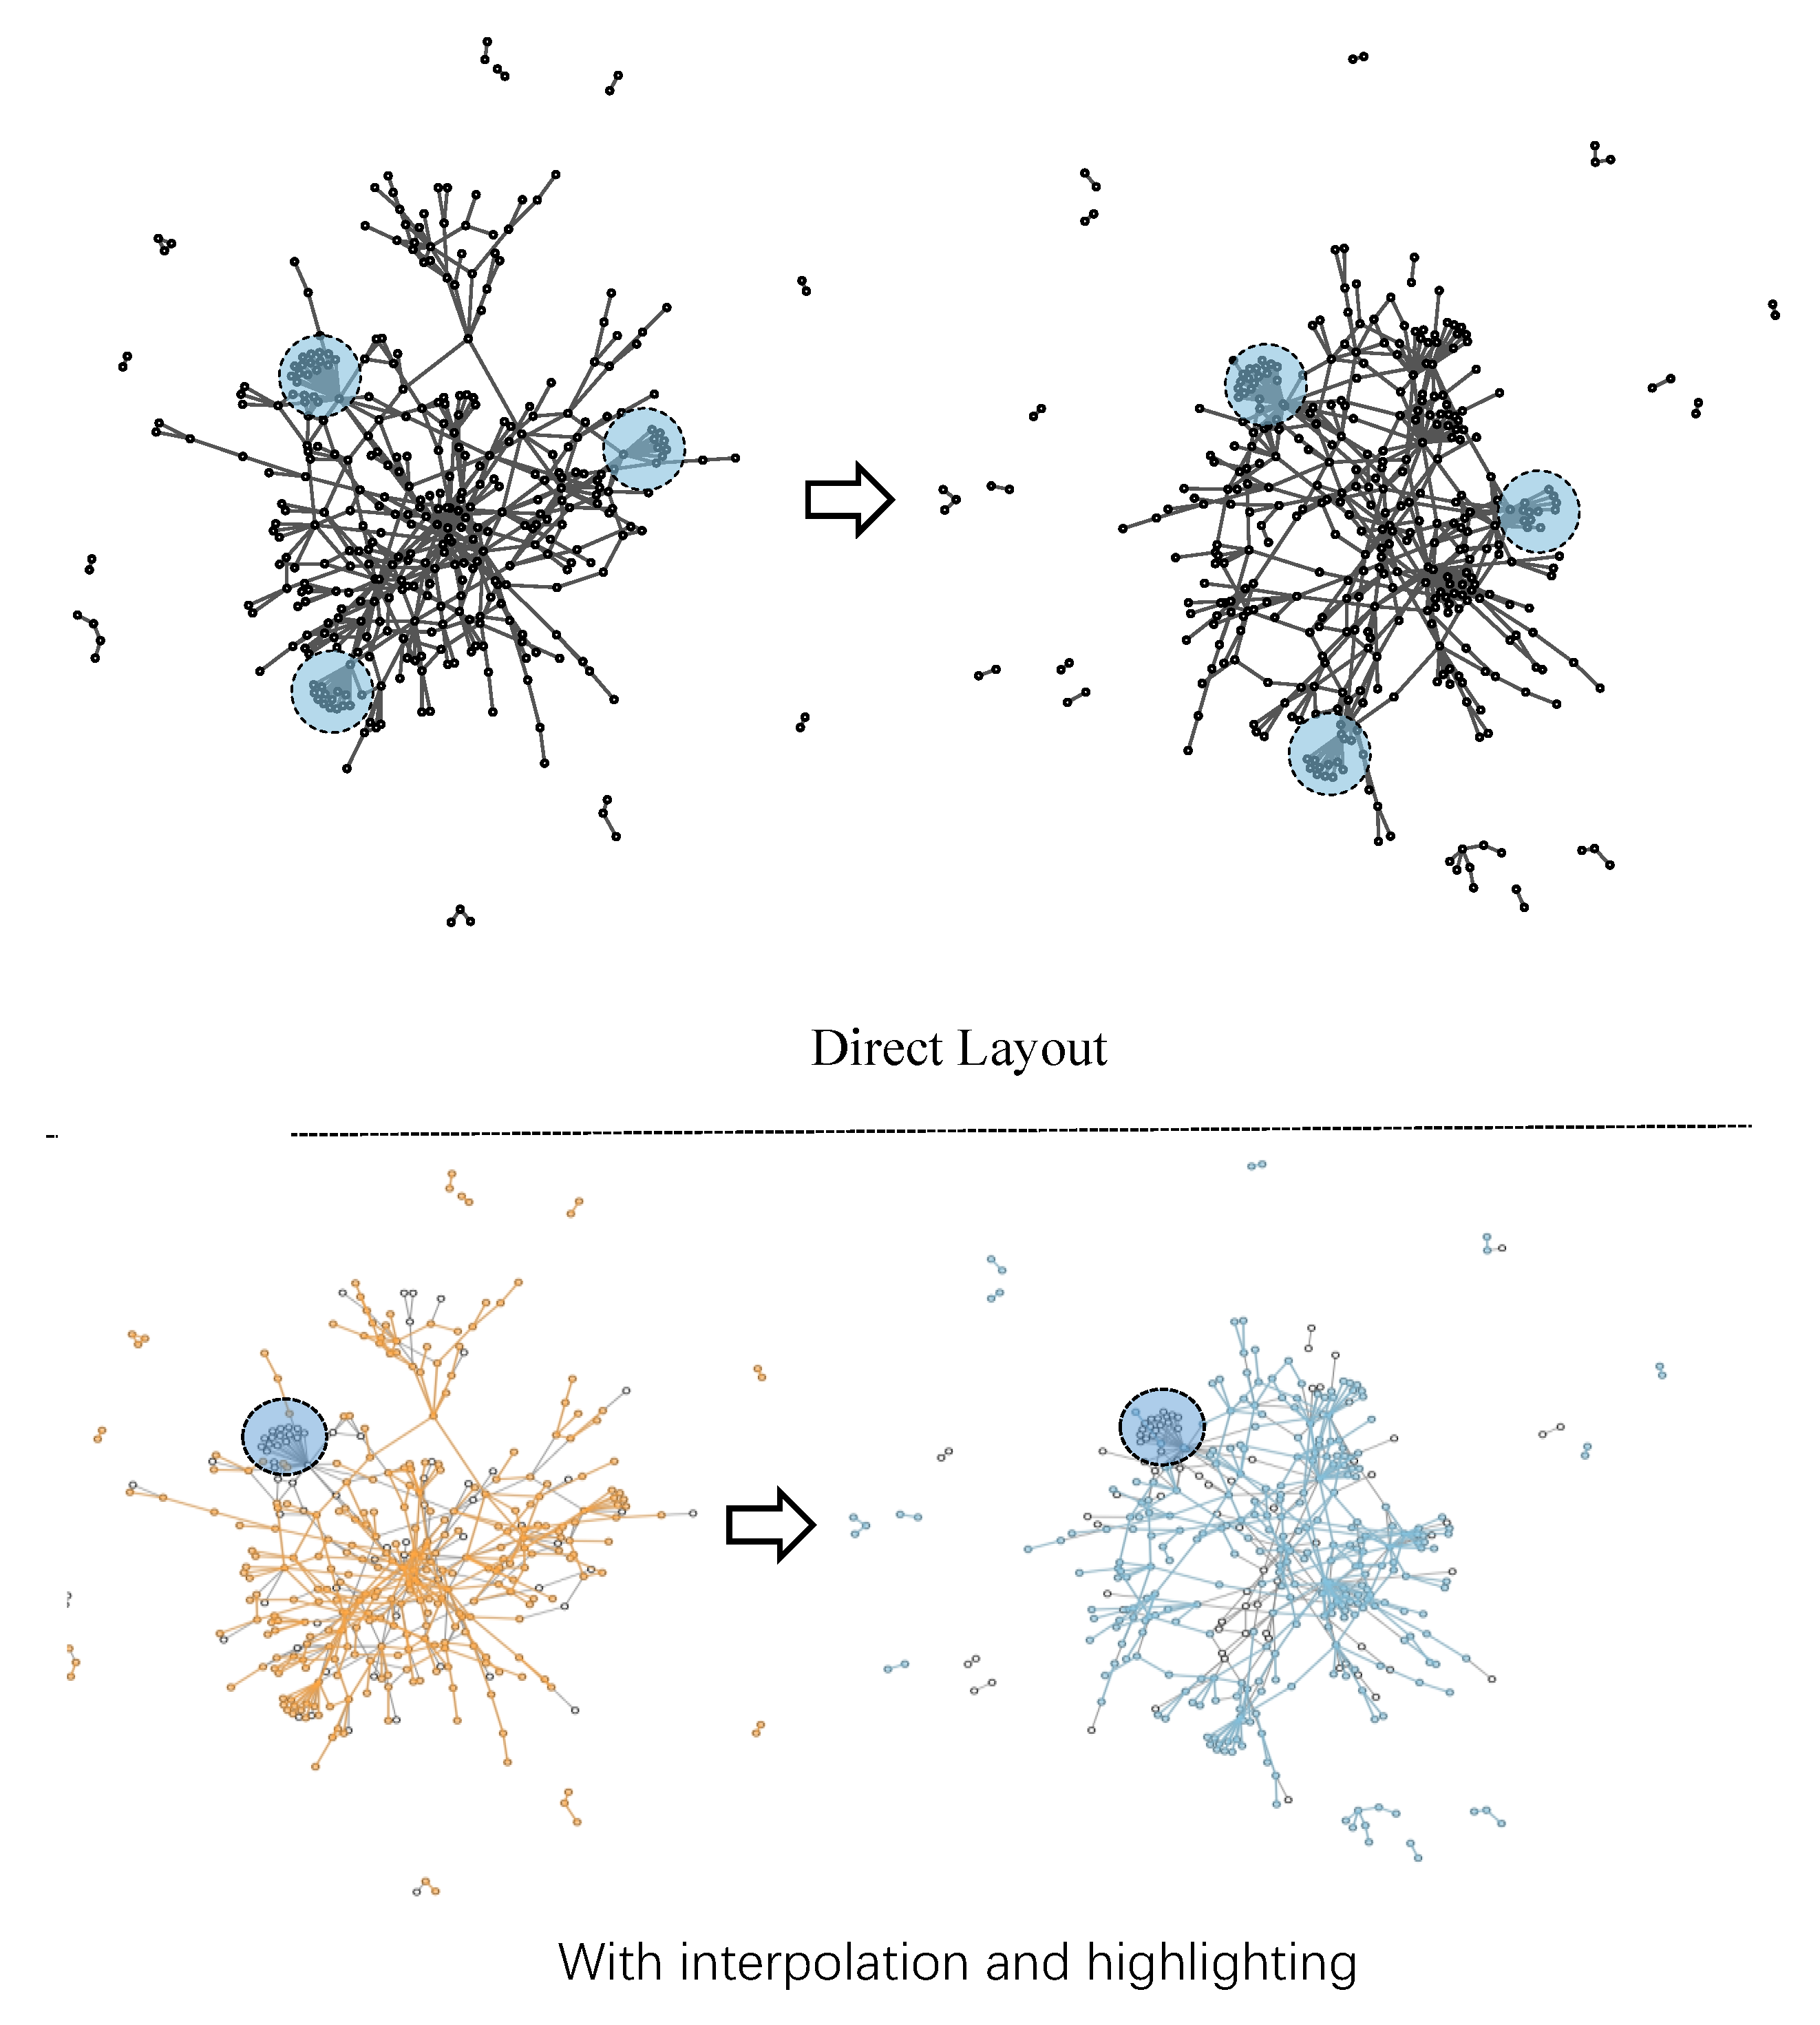
- We extend previous online dynamic layout methods by a novel SIPA layout algorithm. This algorithm is proposed based on the influence of structural changes to different nodes, and with a combination of node ages. While ensuring layout quality, our algorithm better preserves the relative positions and shapes of structures that persist across adjacent time steps. These stable structures provide anchors for tracing the network evolution and thus contributes to enhancing the overall layout stability.
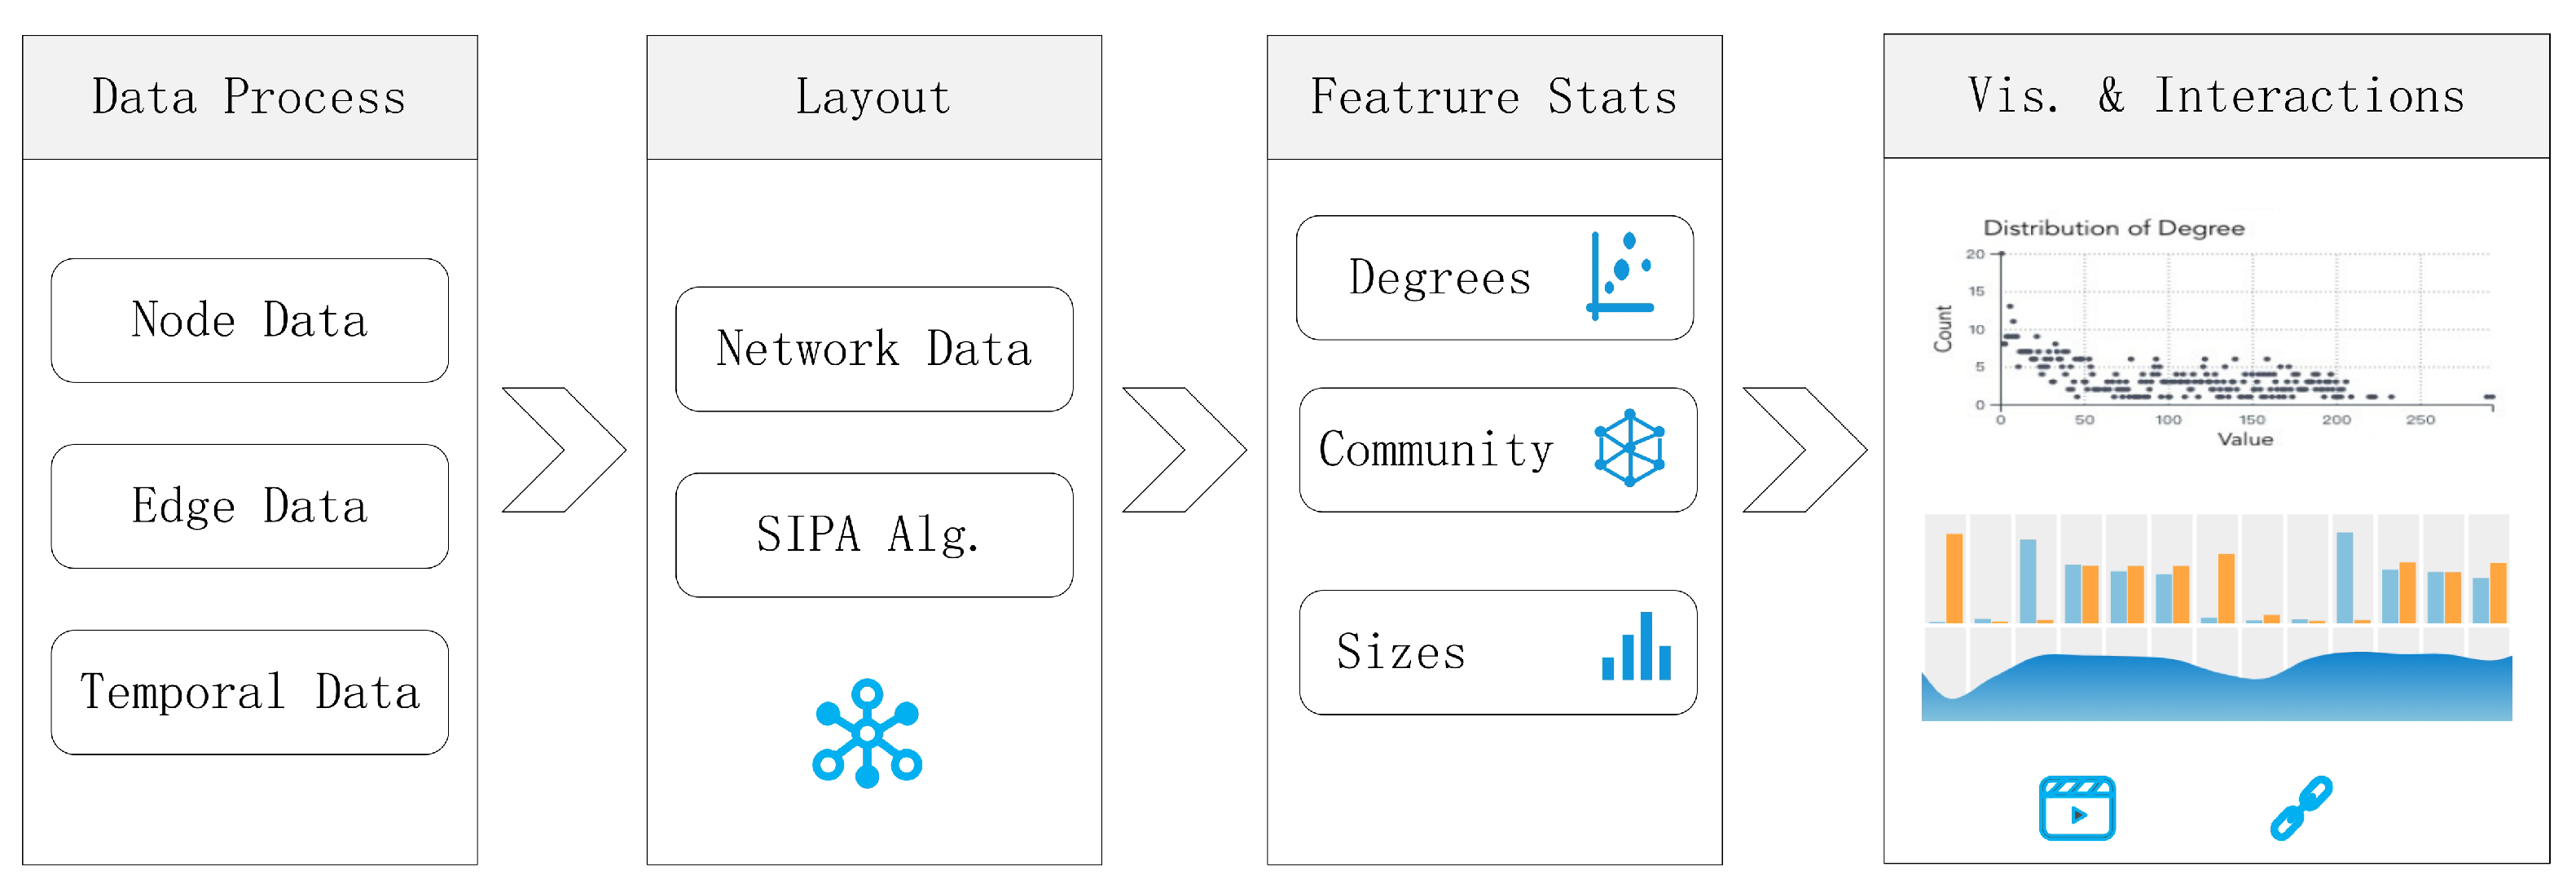
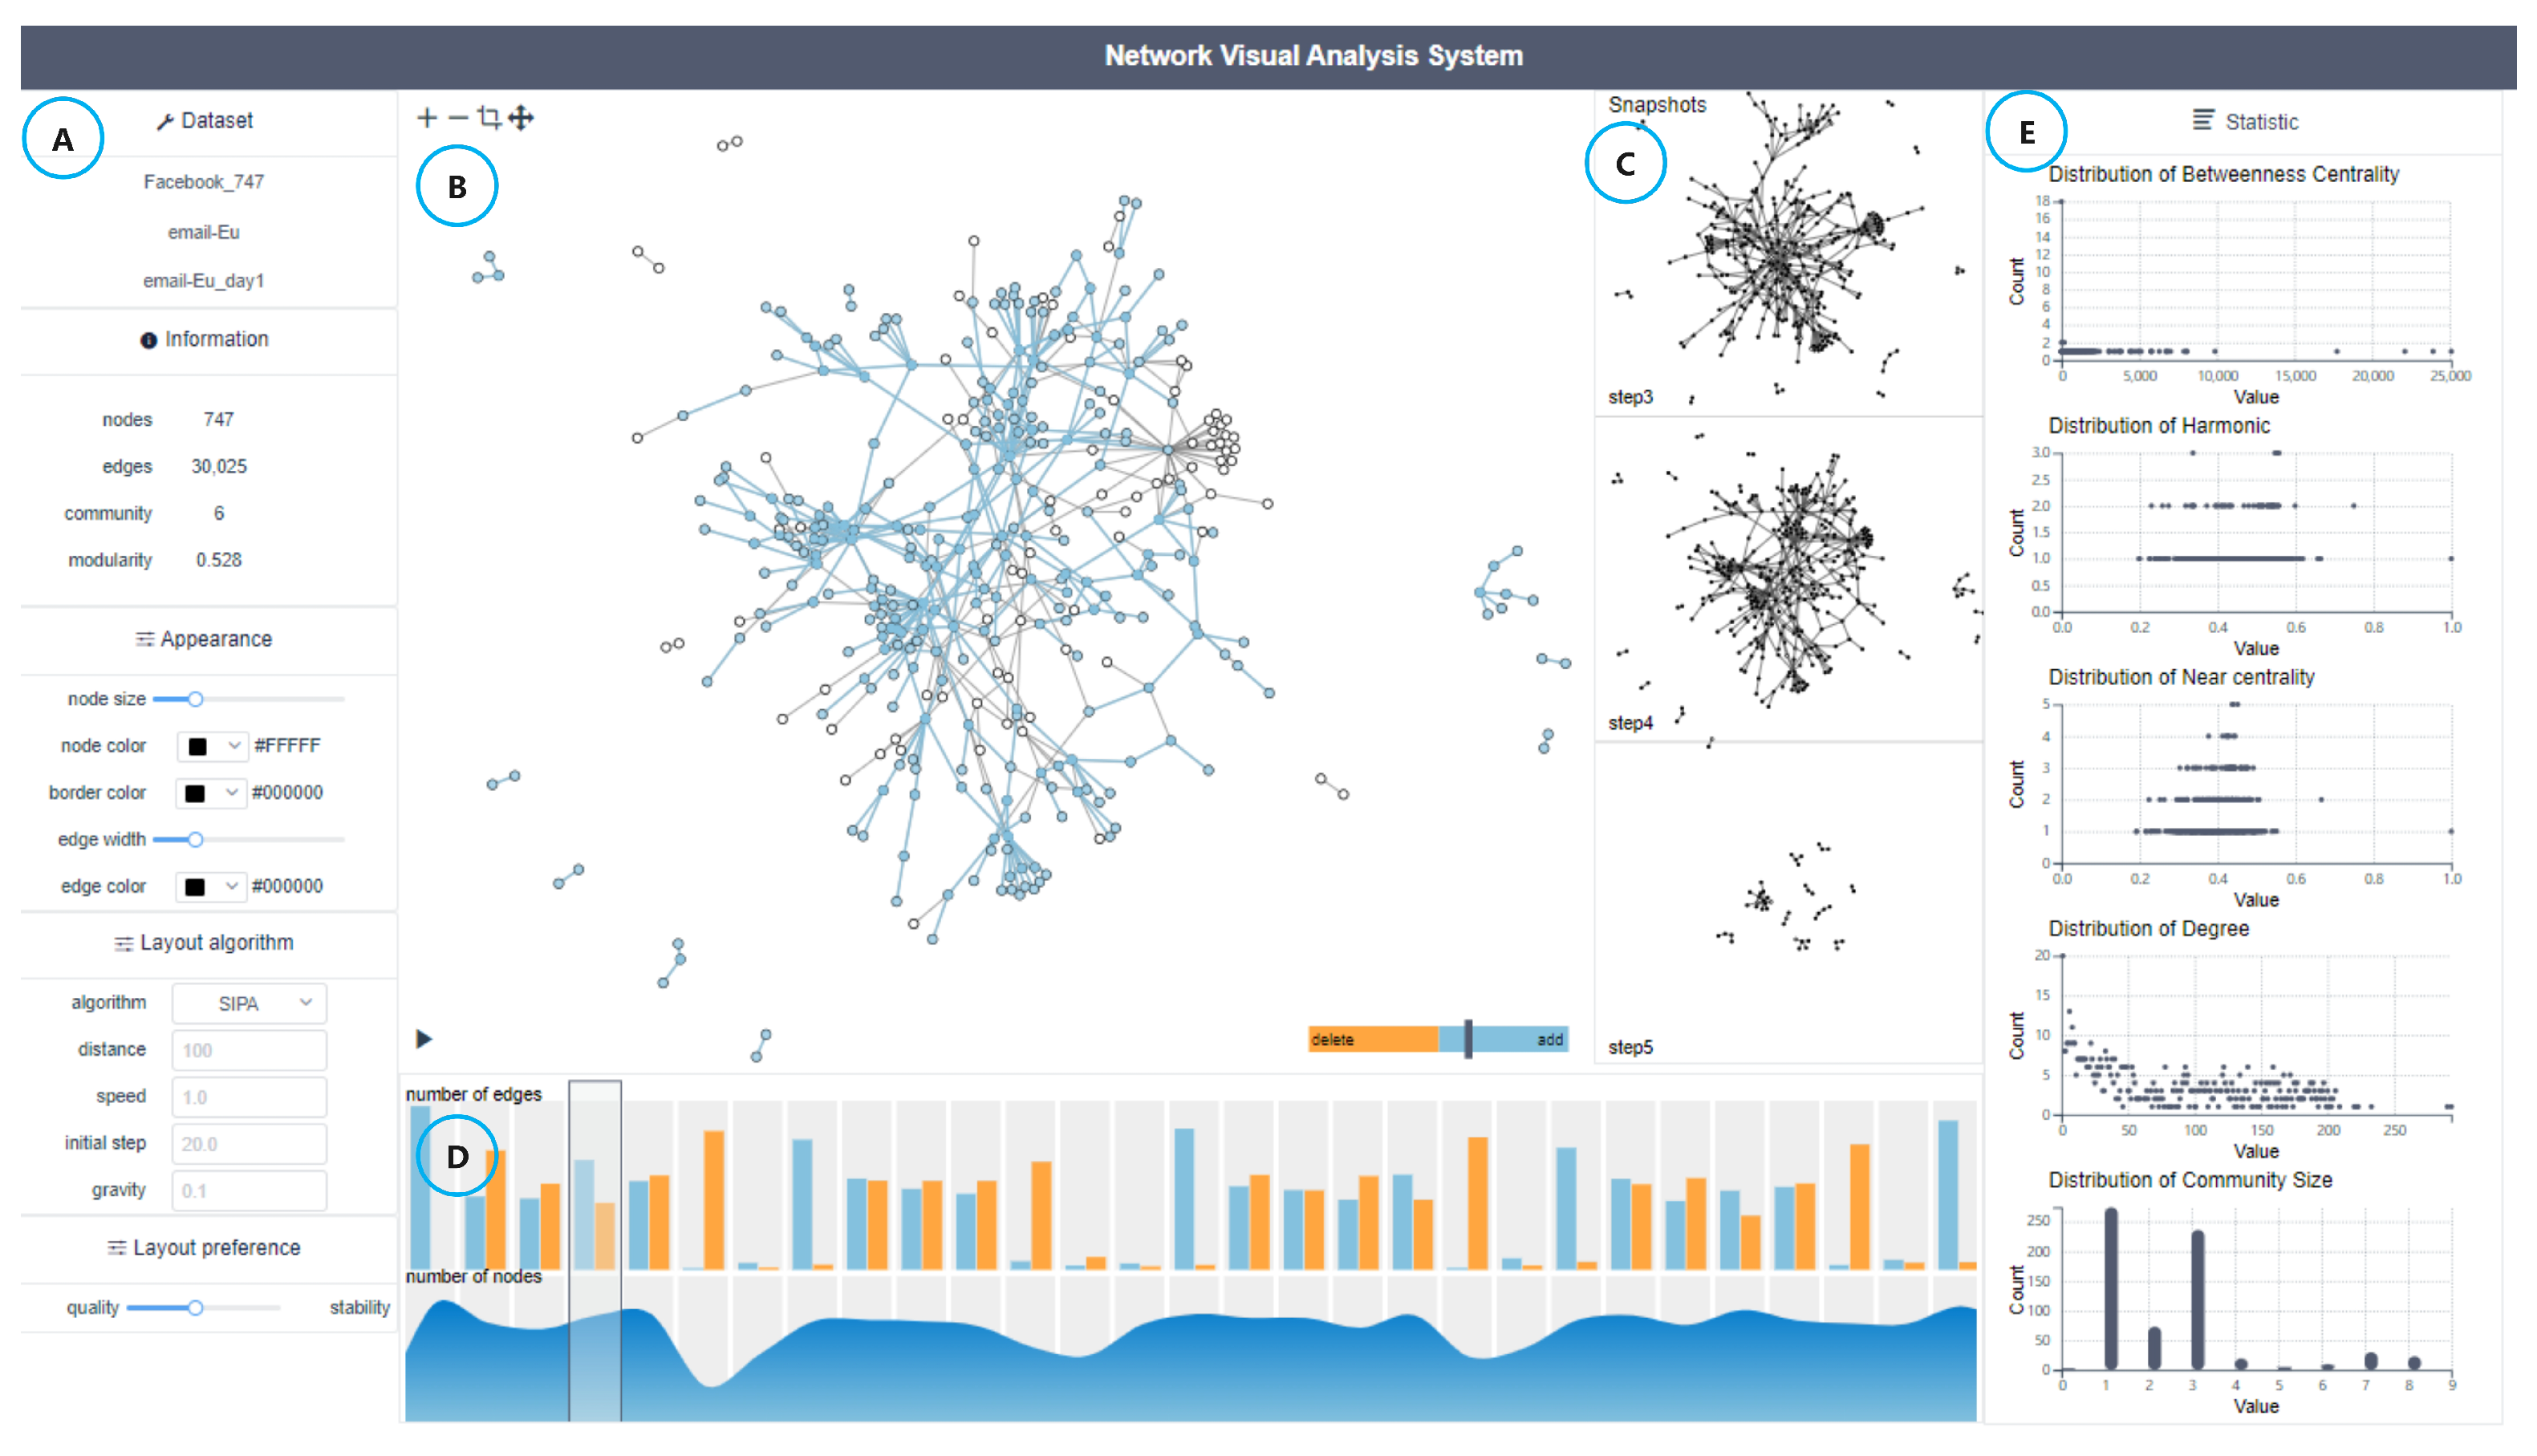
- We design and implement an interactive visualization system that enriches dynamic network analysis with multiple coordinated views. The system provides crucial temporal aspects and features of dynamic networks, enhancing exploration, tracking, and comparison of network dynamics.
- We verify the performance of our algorithm by comparative experiments based on three dynamic network datasets; and we demonstrate the usability and effectiveness of our system through use cases and a user study.
2. Related Work
2.1. Dynamic Graph Layout Methods
2.2. Dynamic Network Visualization Approaches
3. Dynamic Network Layout Algorithm
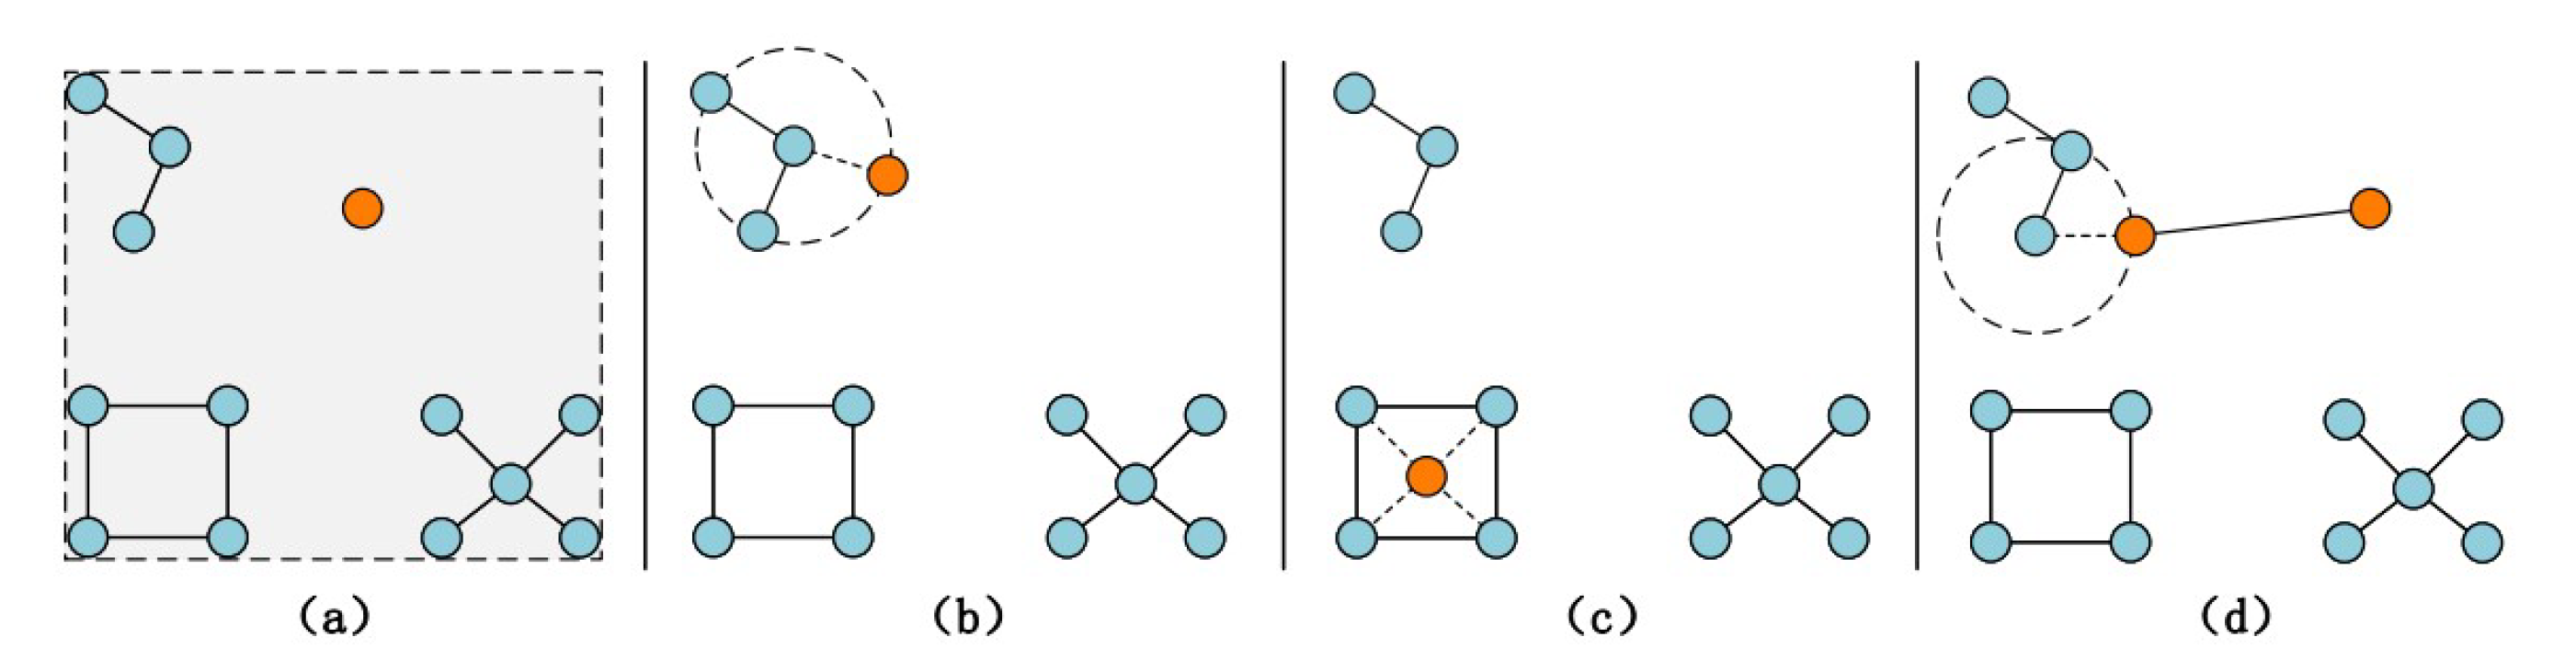
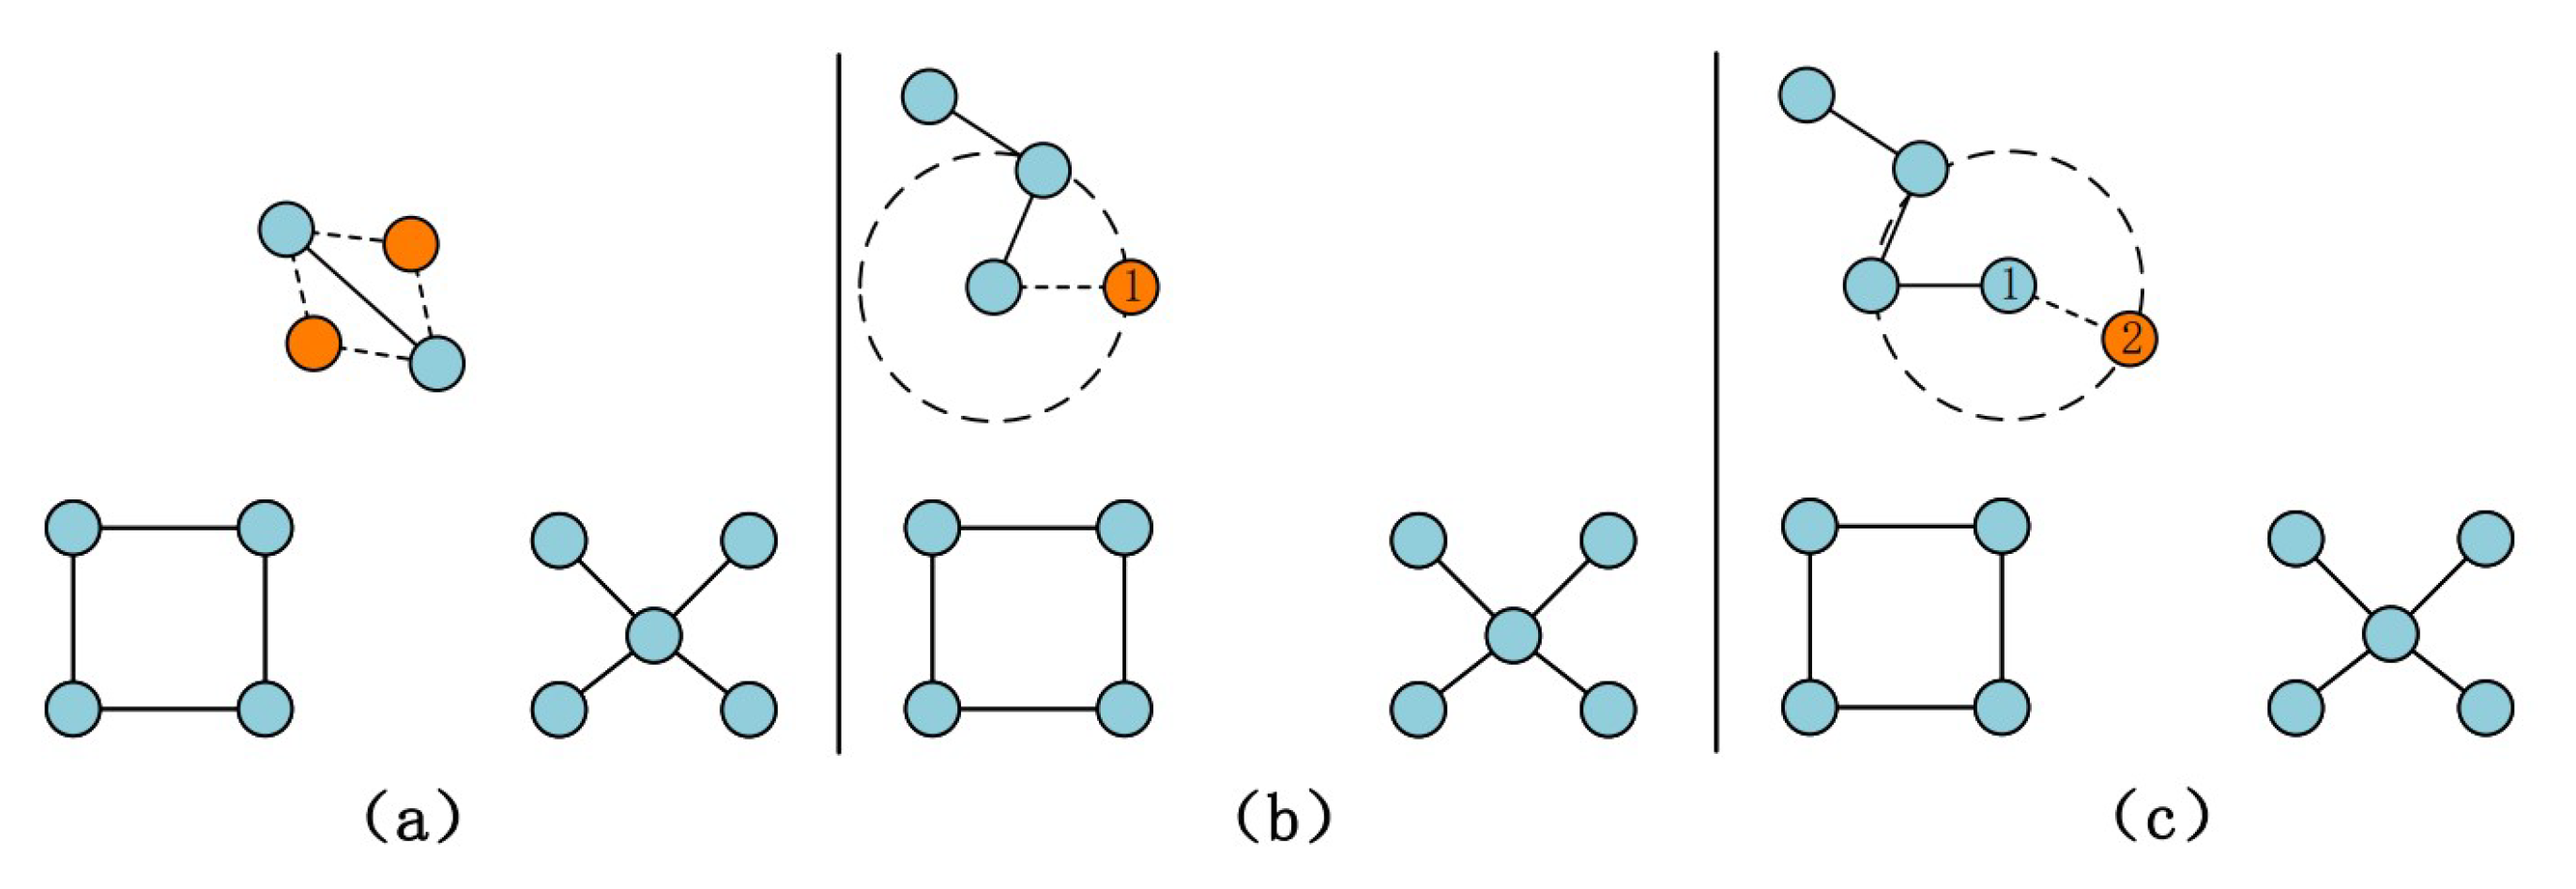
3.1. Initial Positioning for Newly Added Nodes
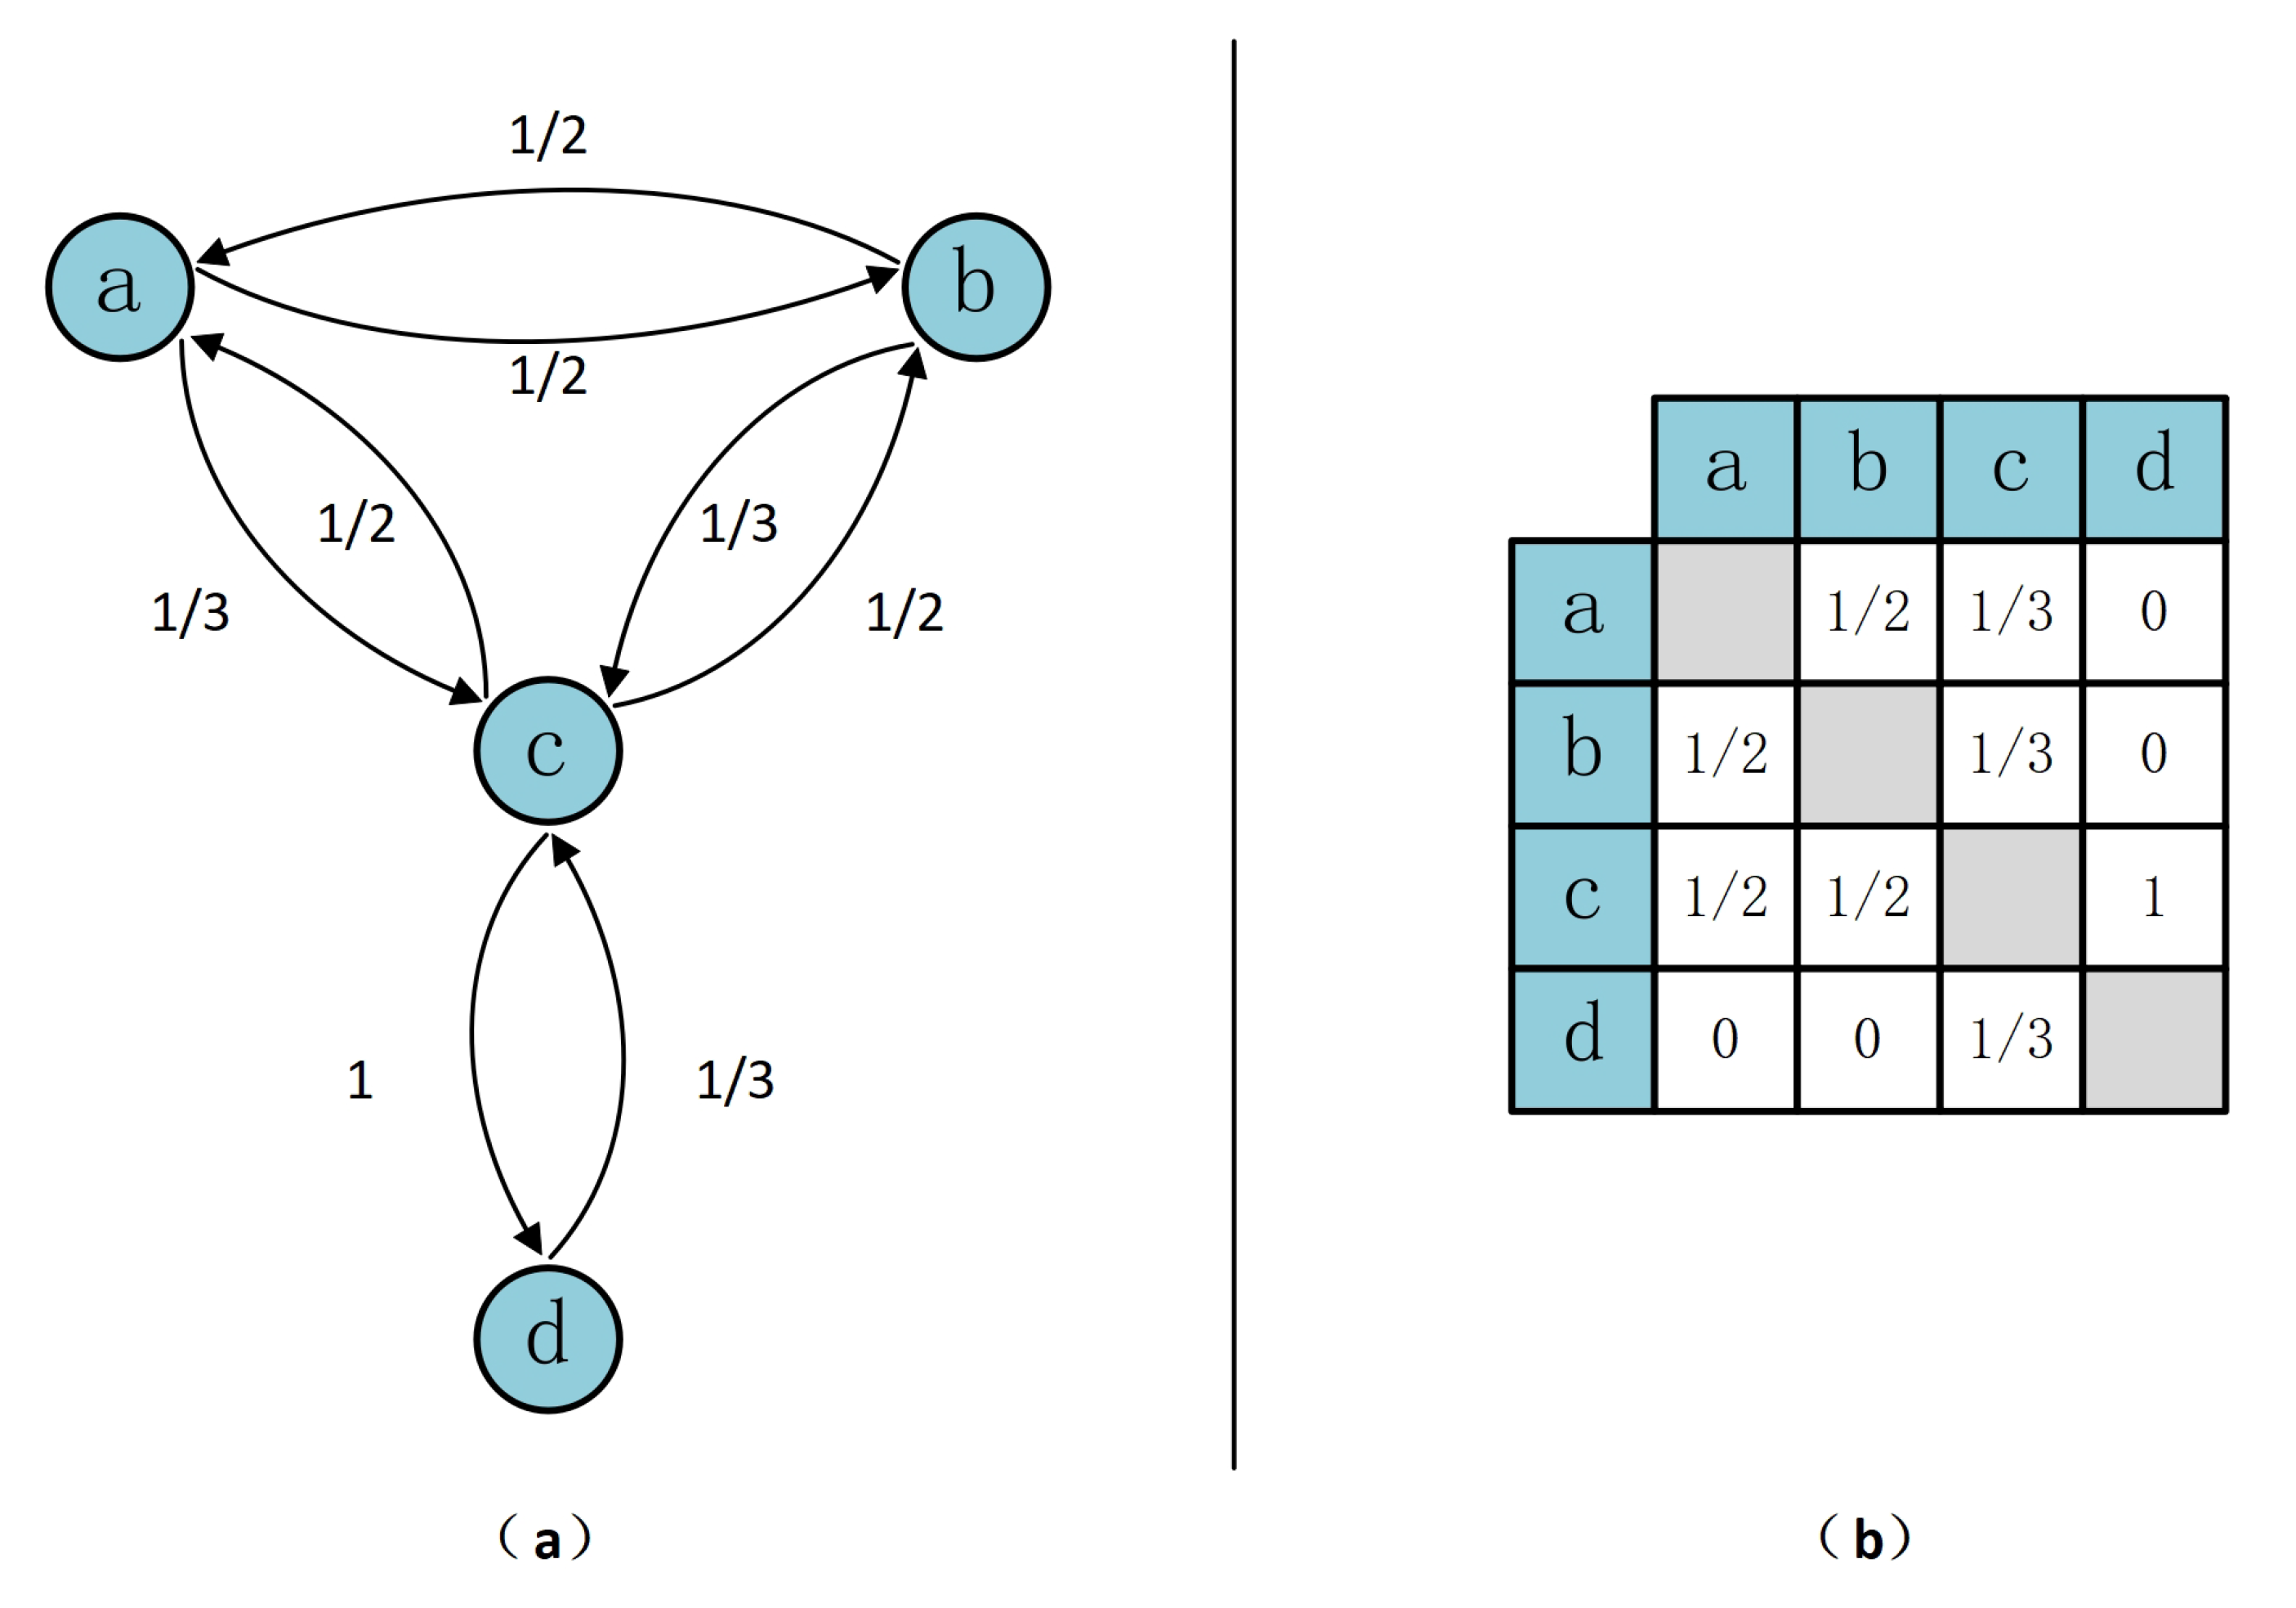
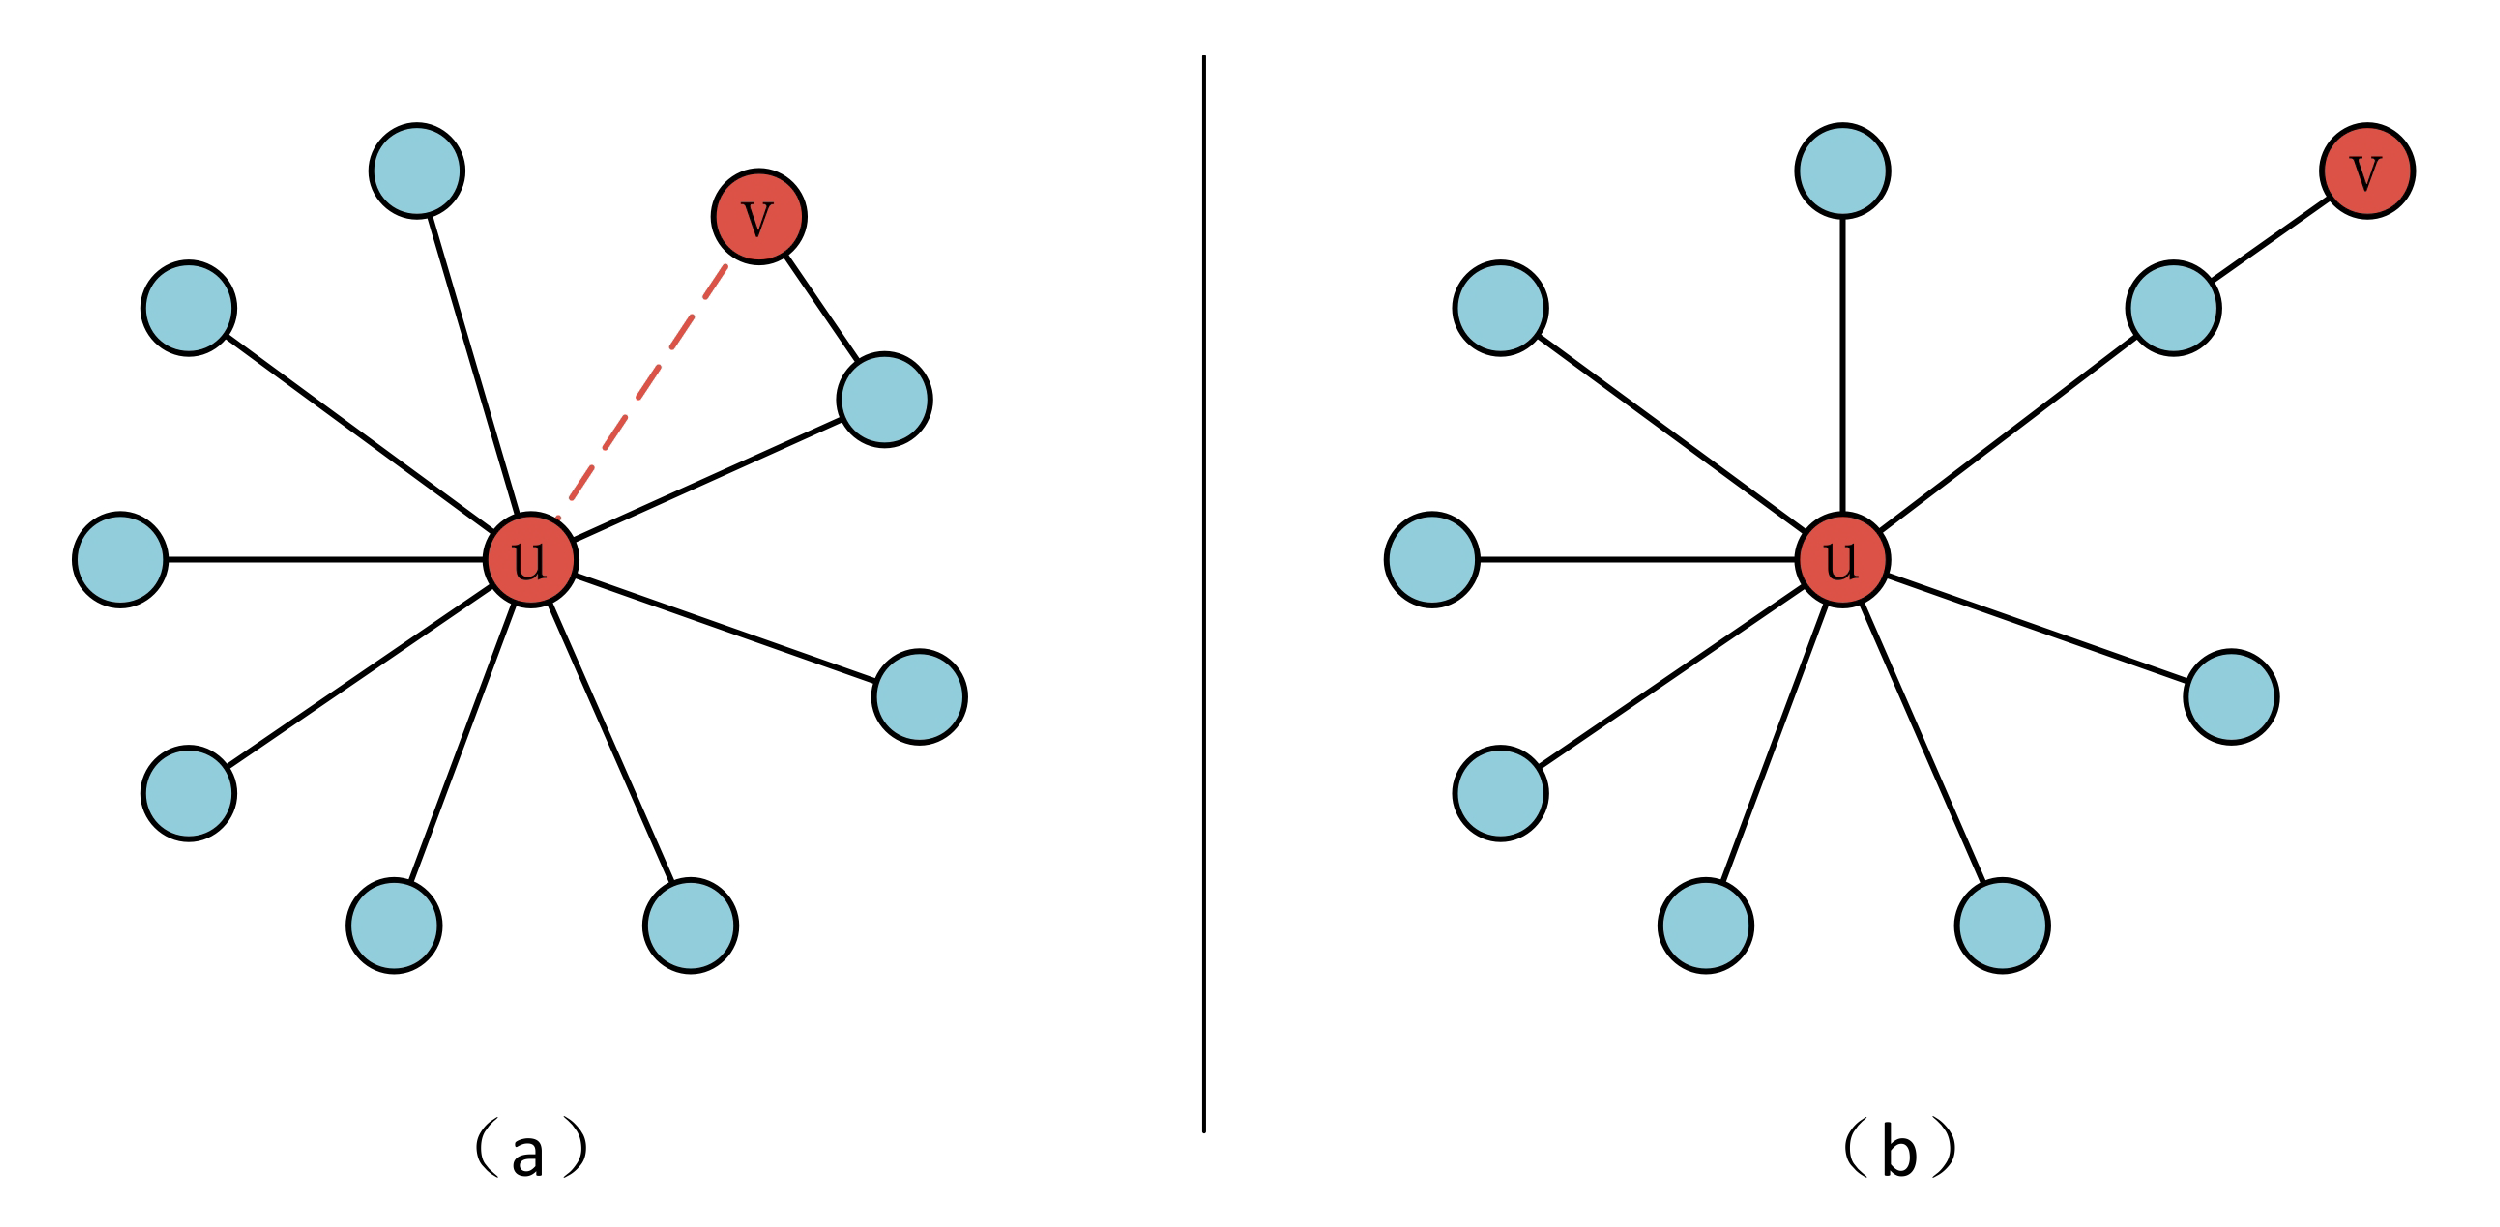
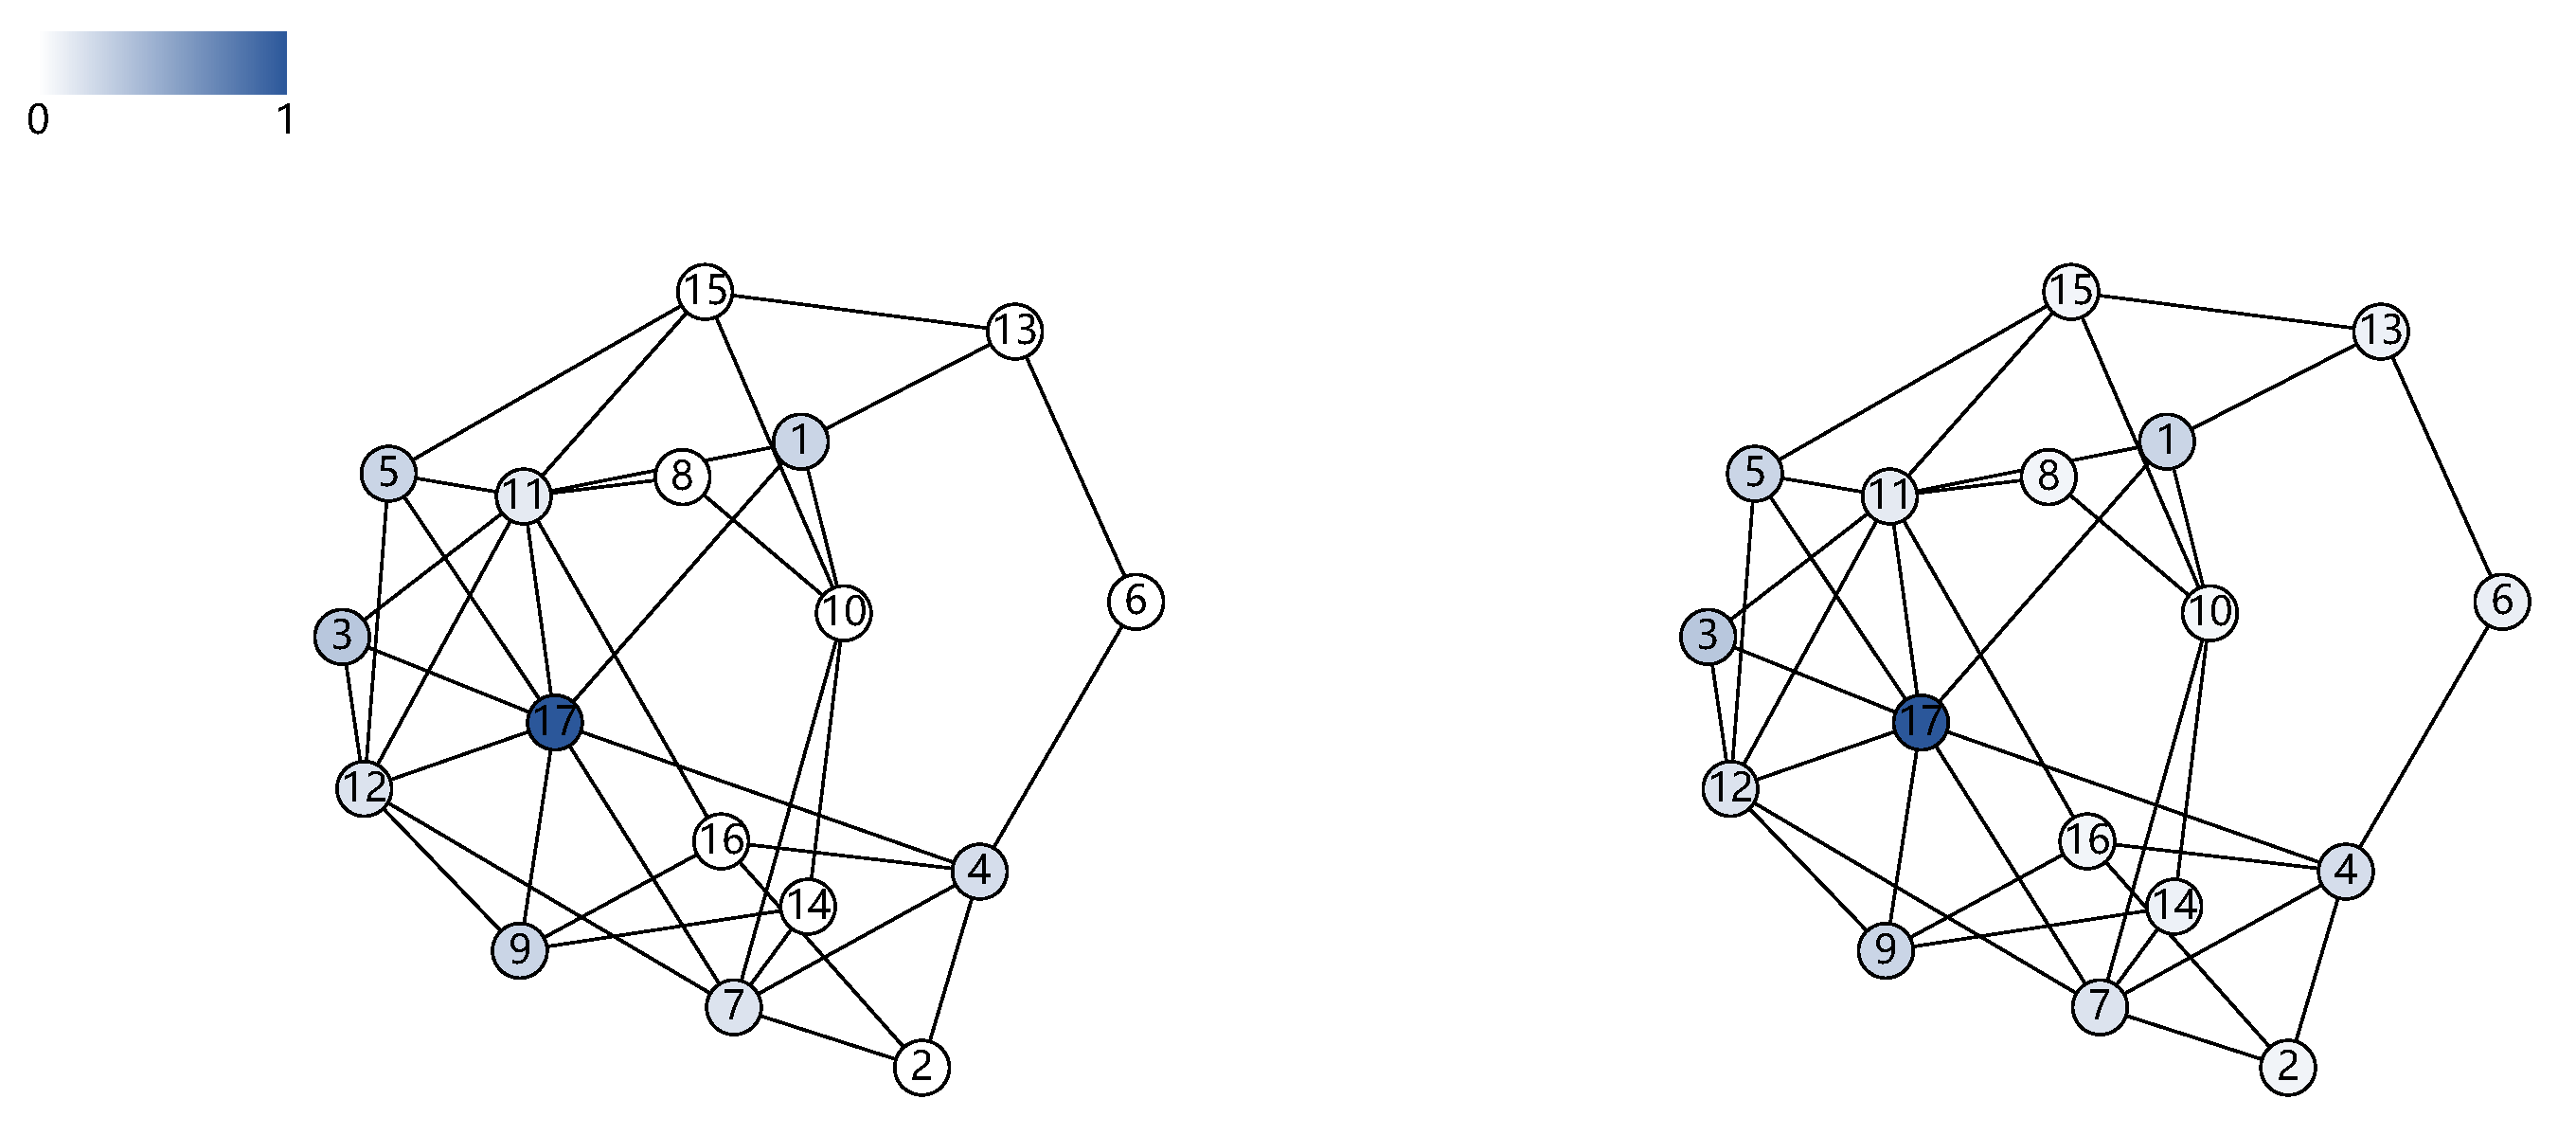
3.2. Structure-Based Influence Computation and Propagation
3.3. Node Aging Strategy
3.4. Node Mobility Factor and Layout
4. Interactive Visualization System
4.1. Visualization Design
4.2. Interaction Design
4.3. Implementations
5. Evaluations
5.1. Experiments on Layout Approach
5.1.1. Experiment Settings
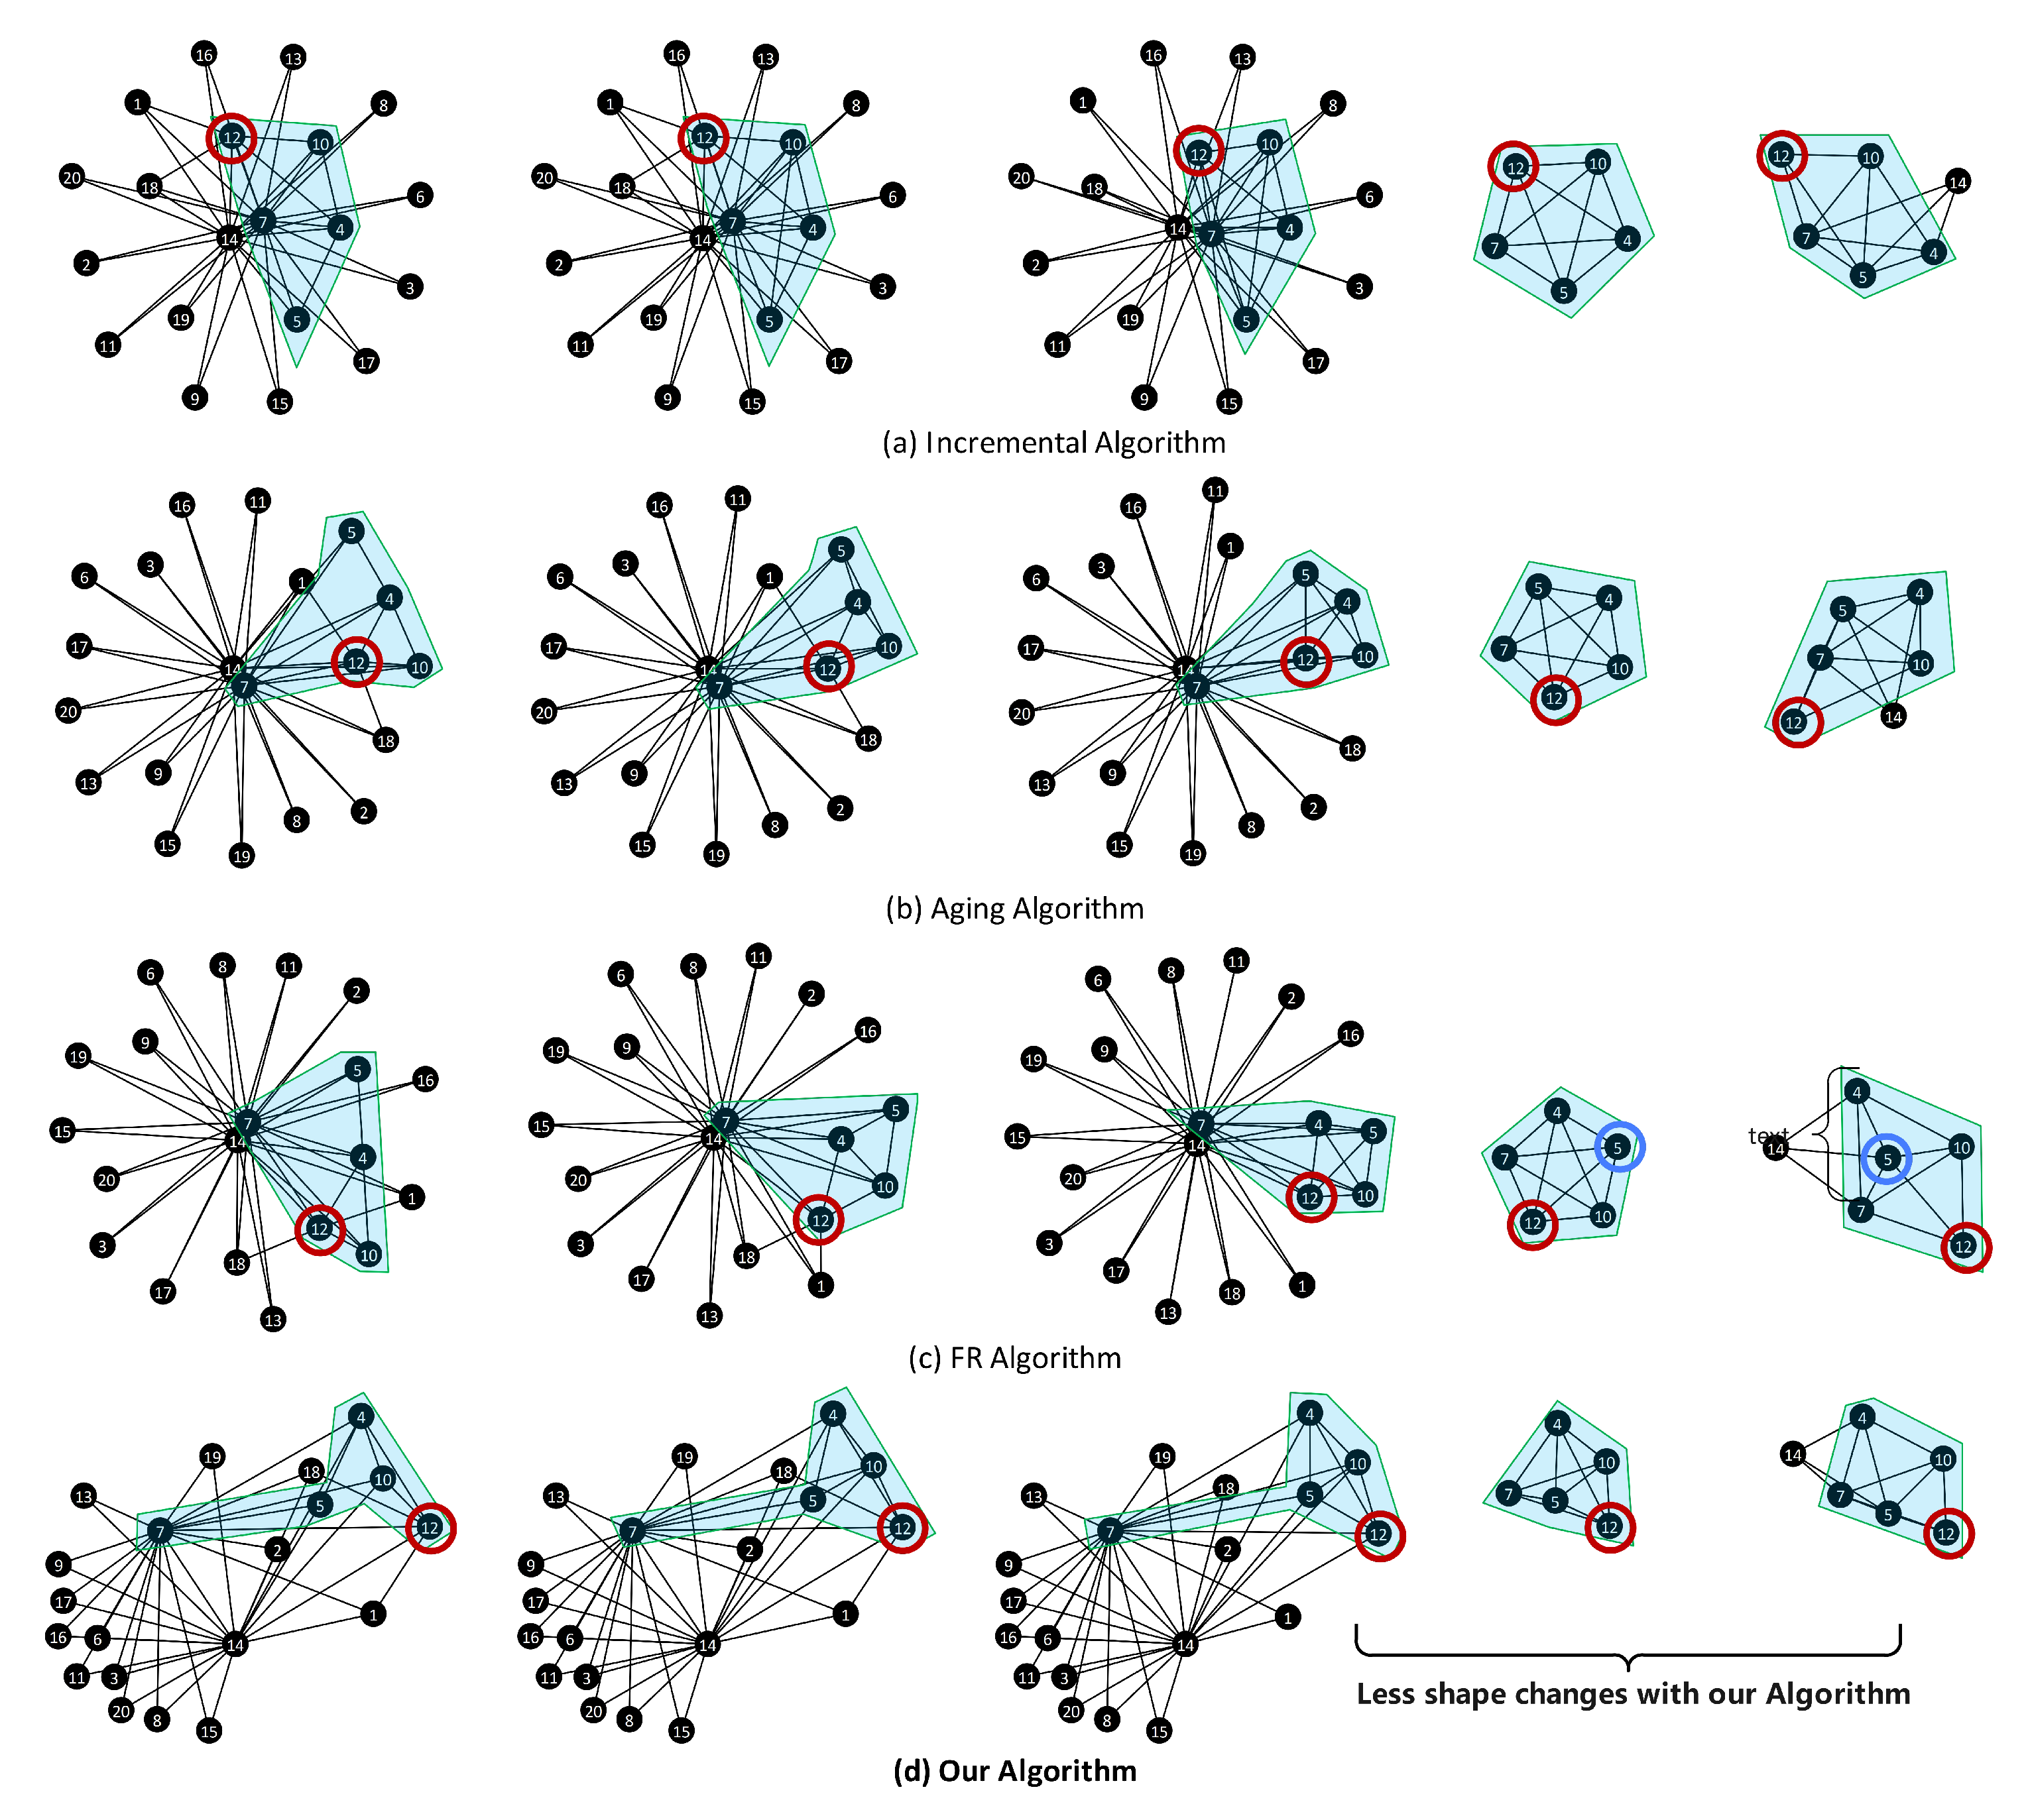
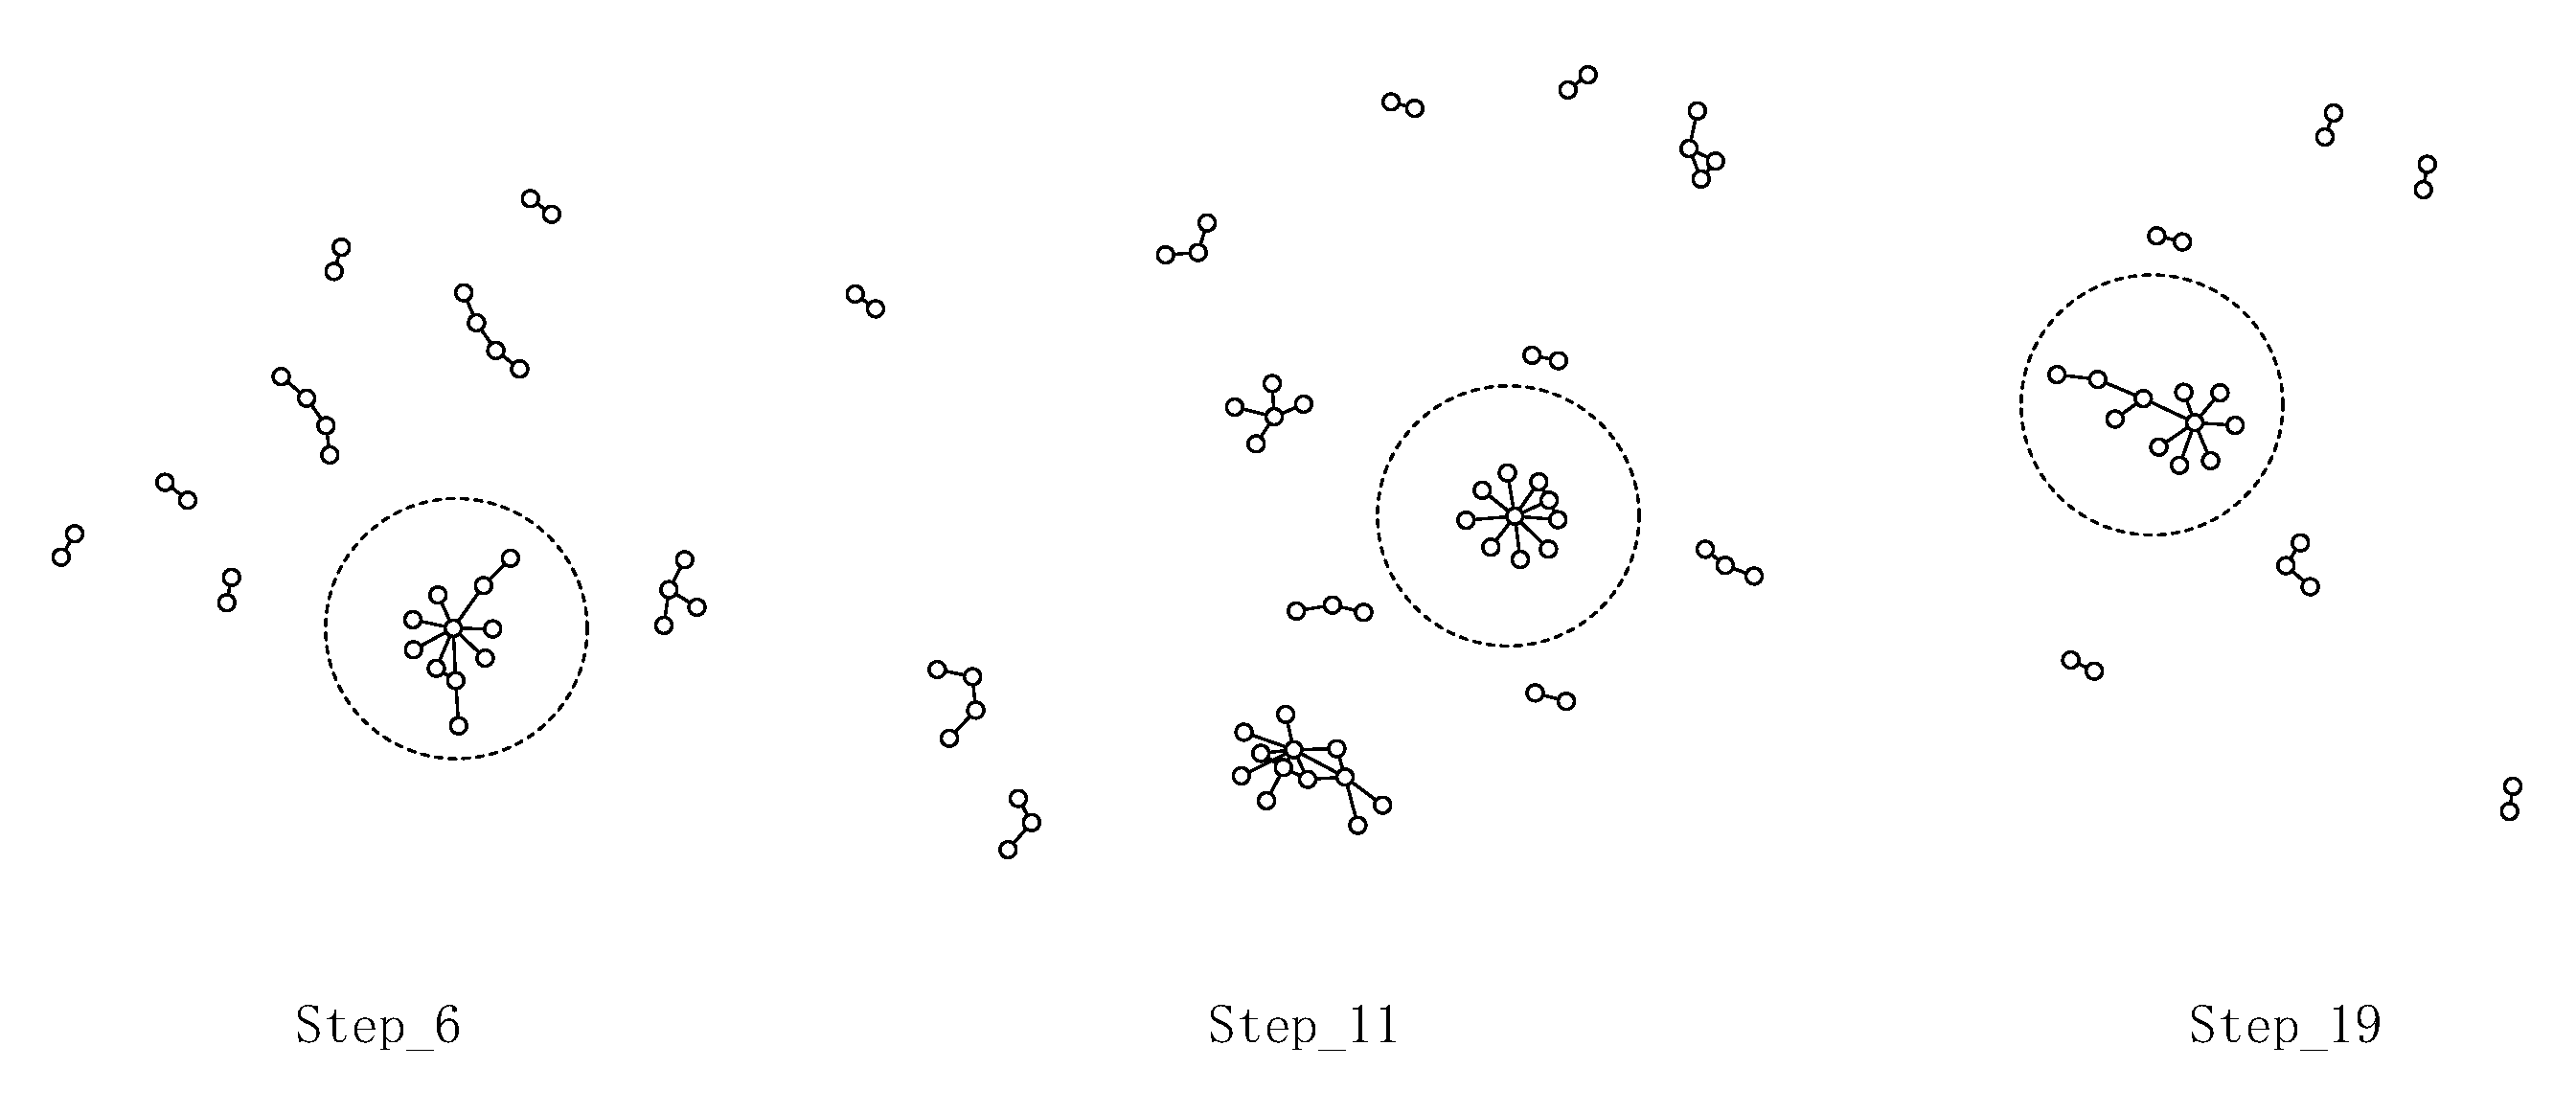
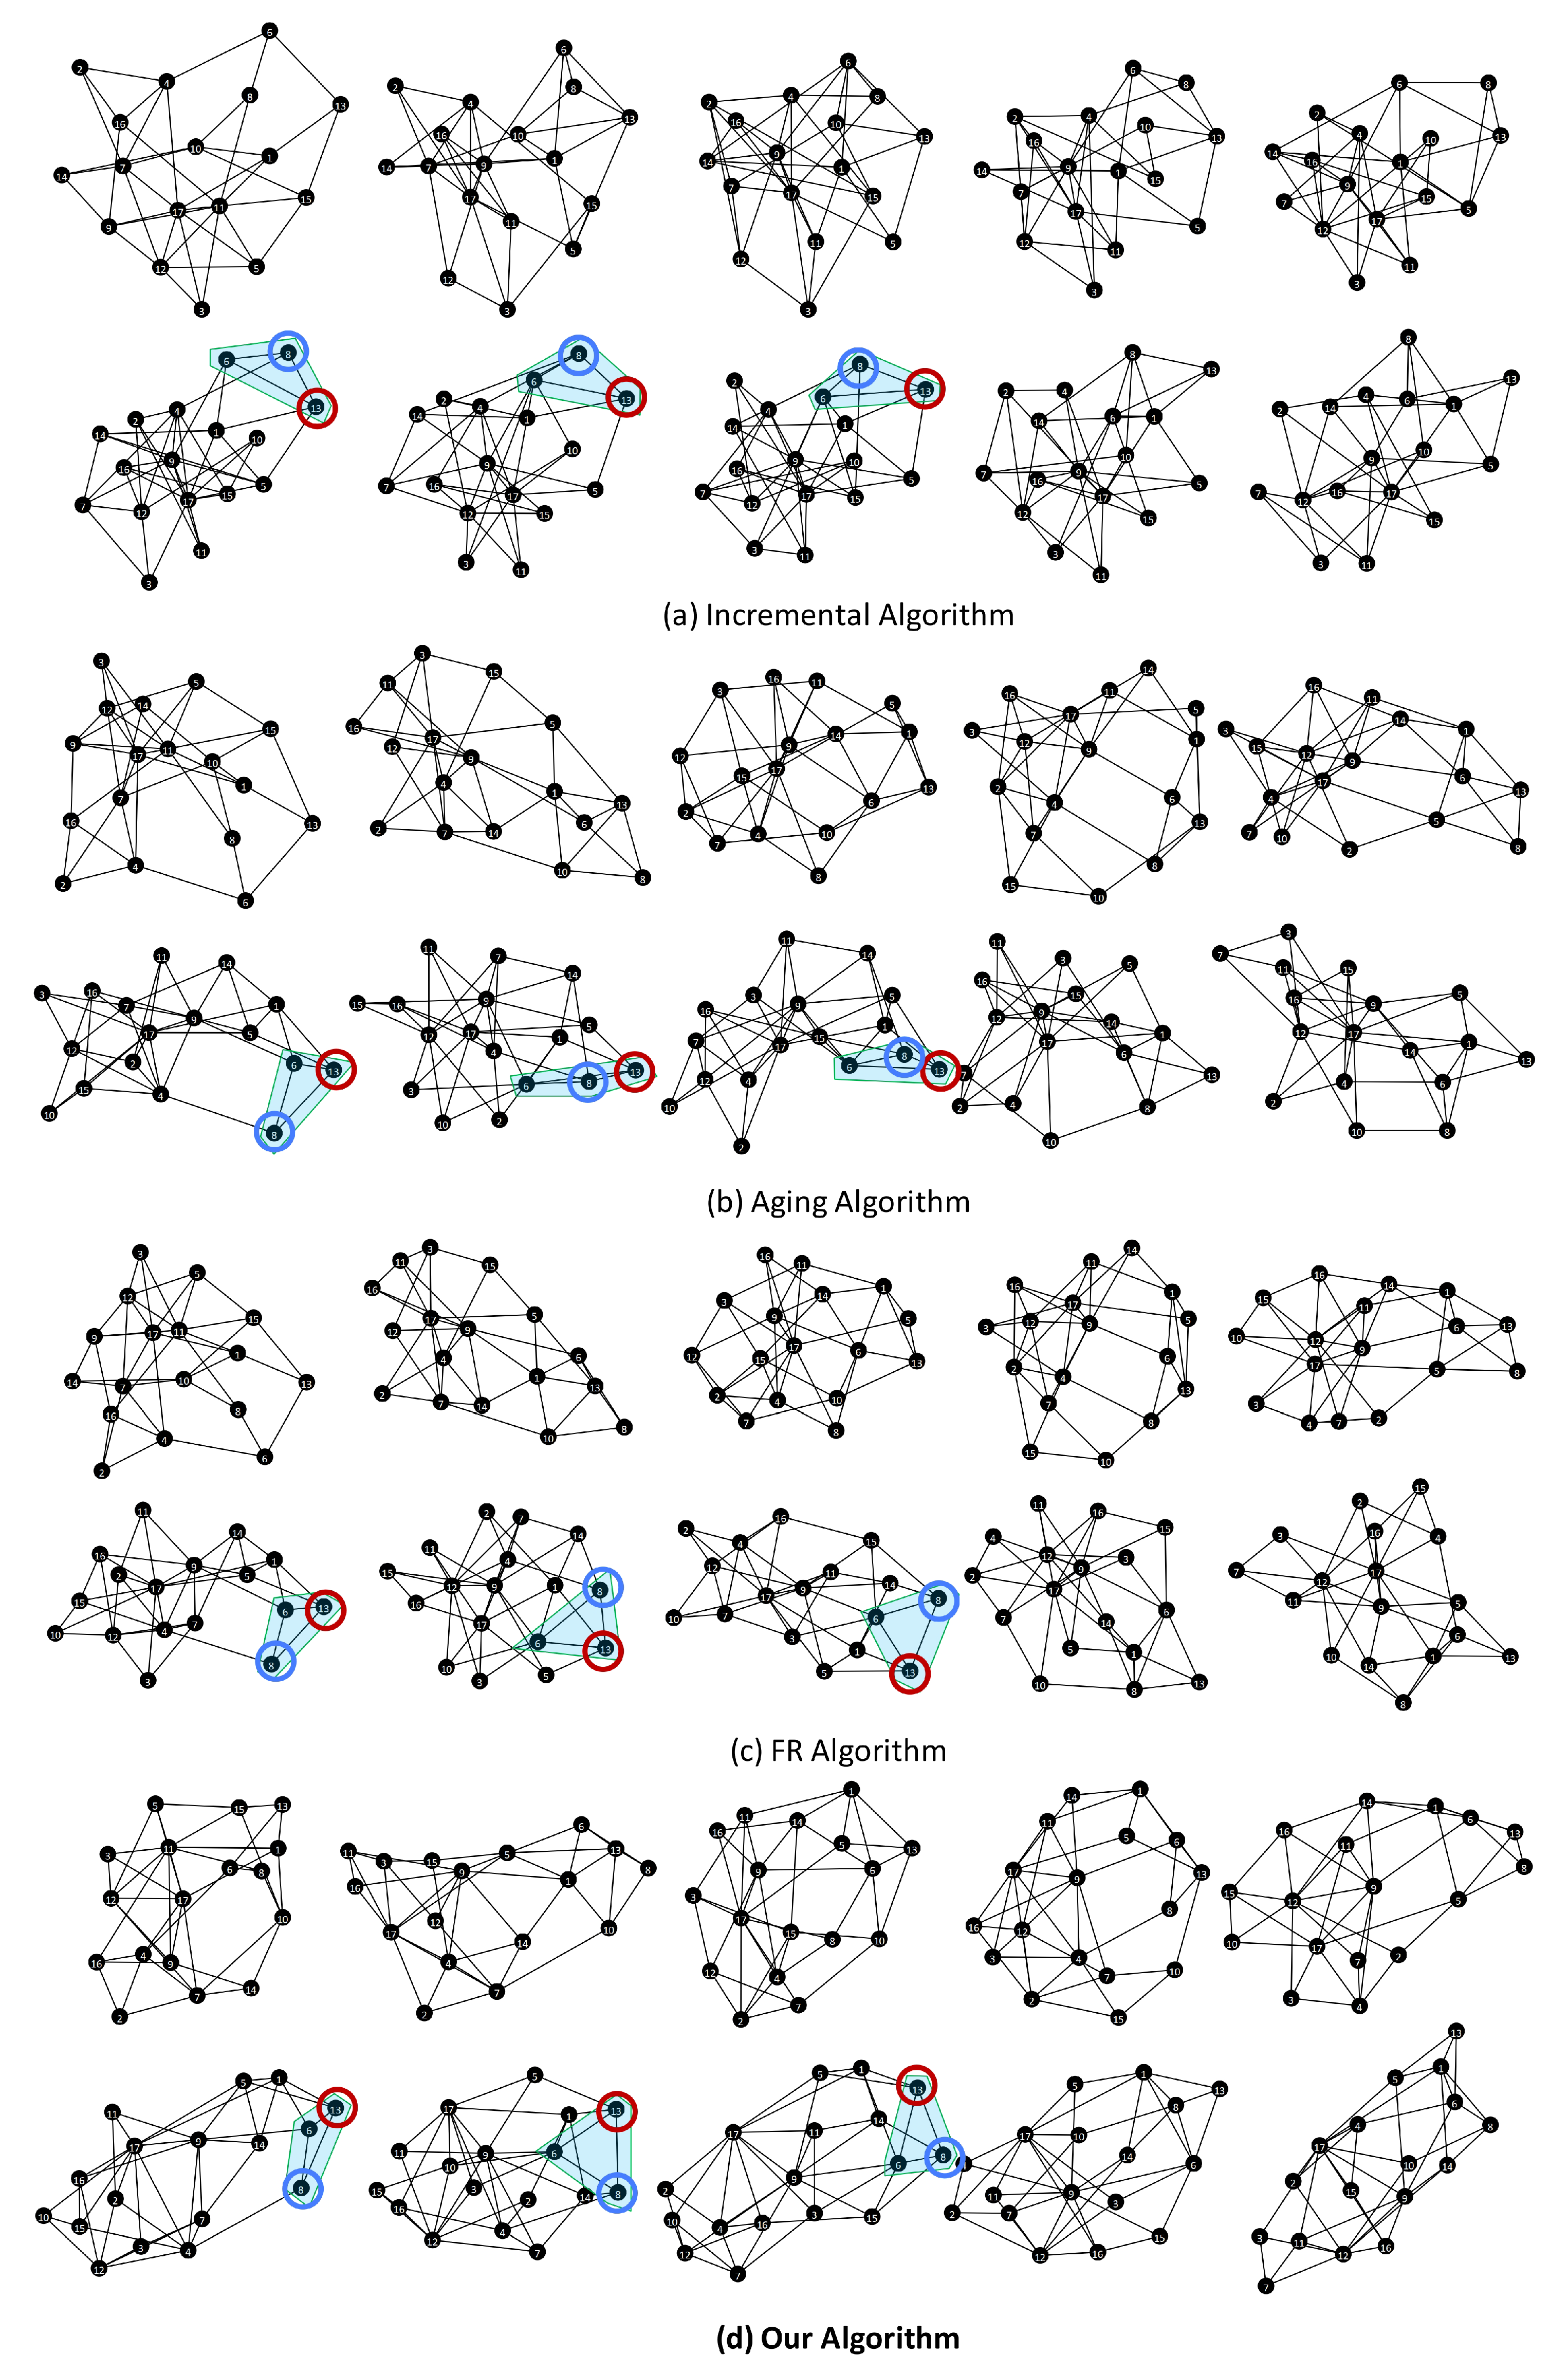
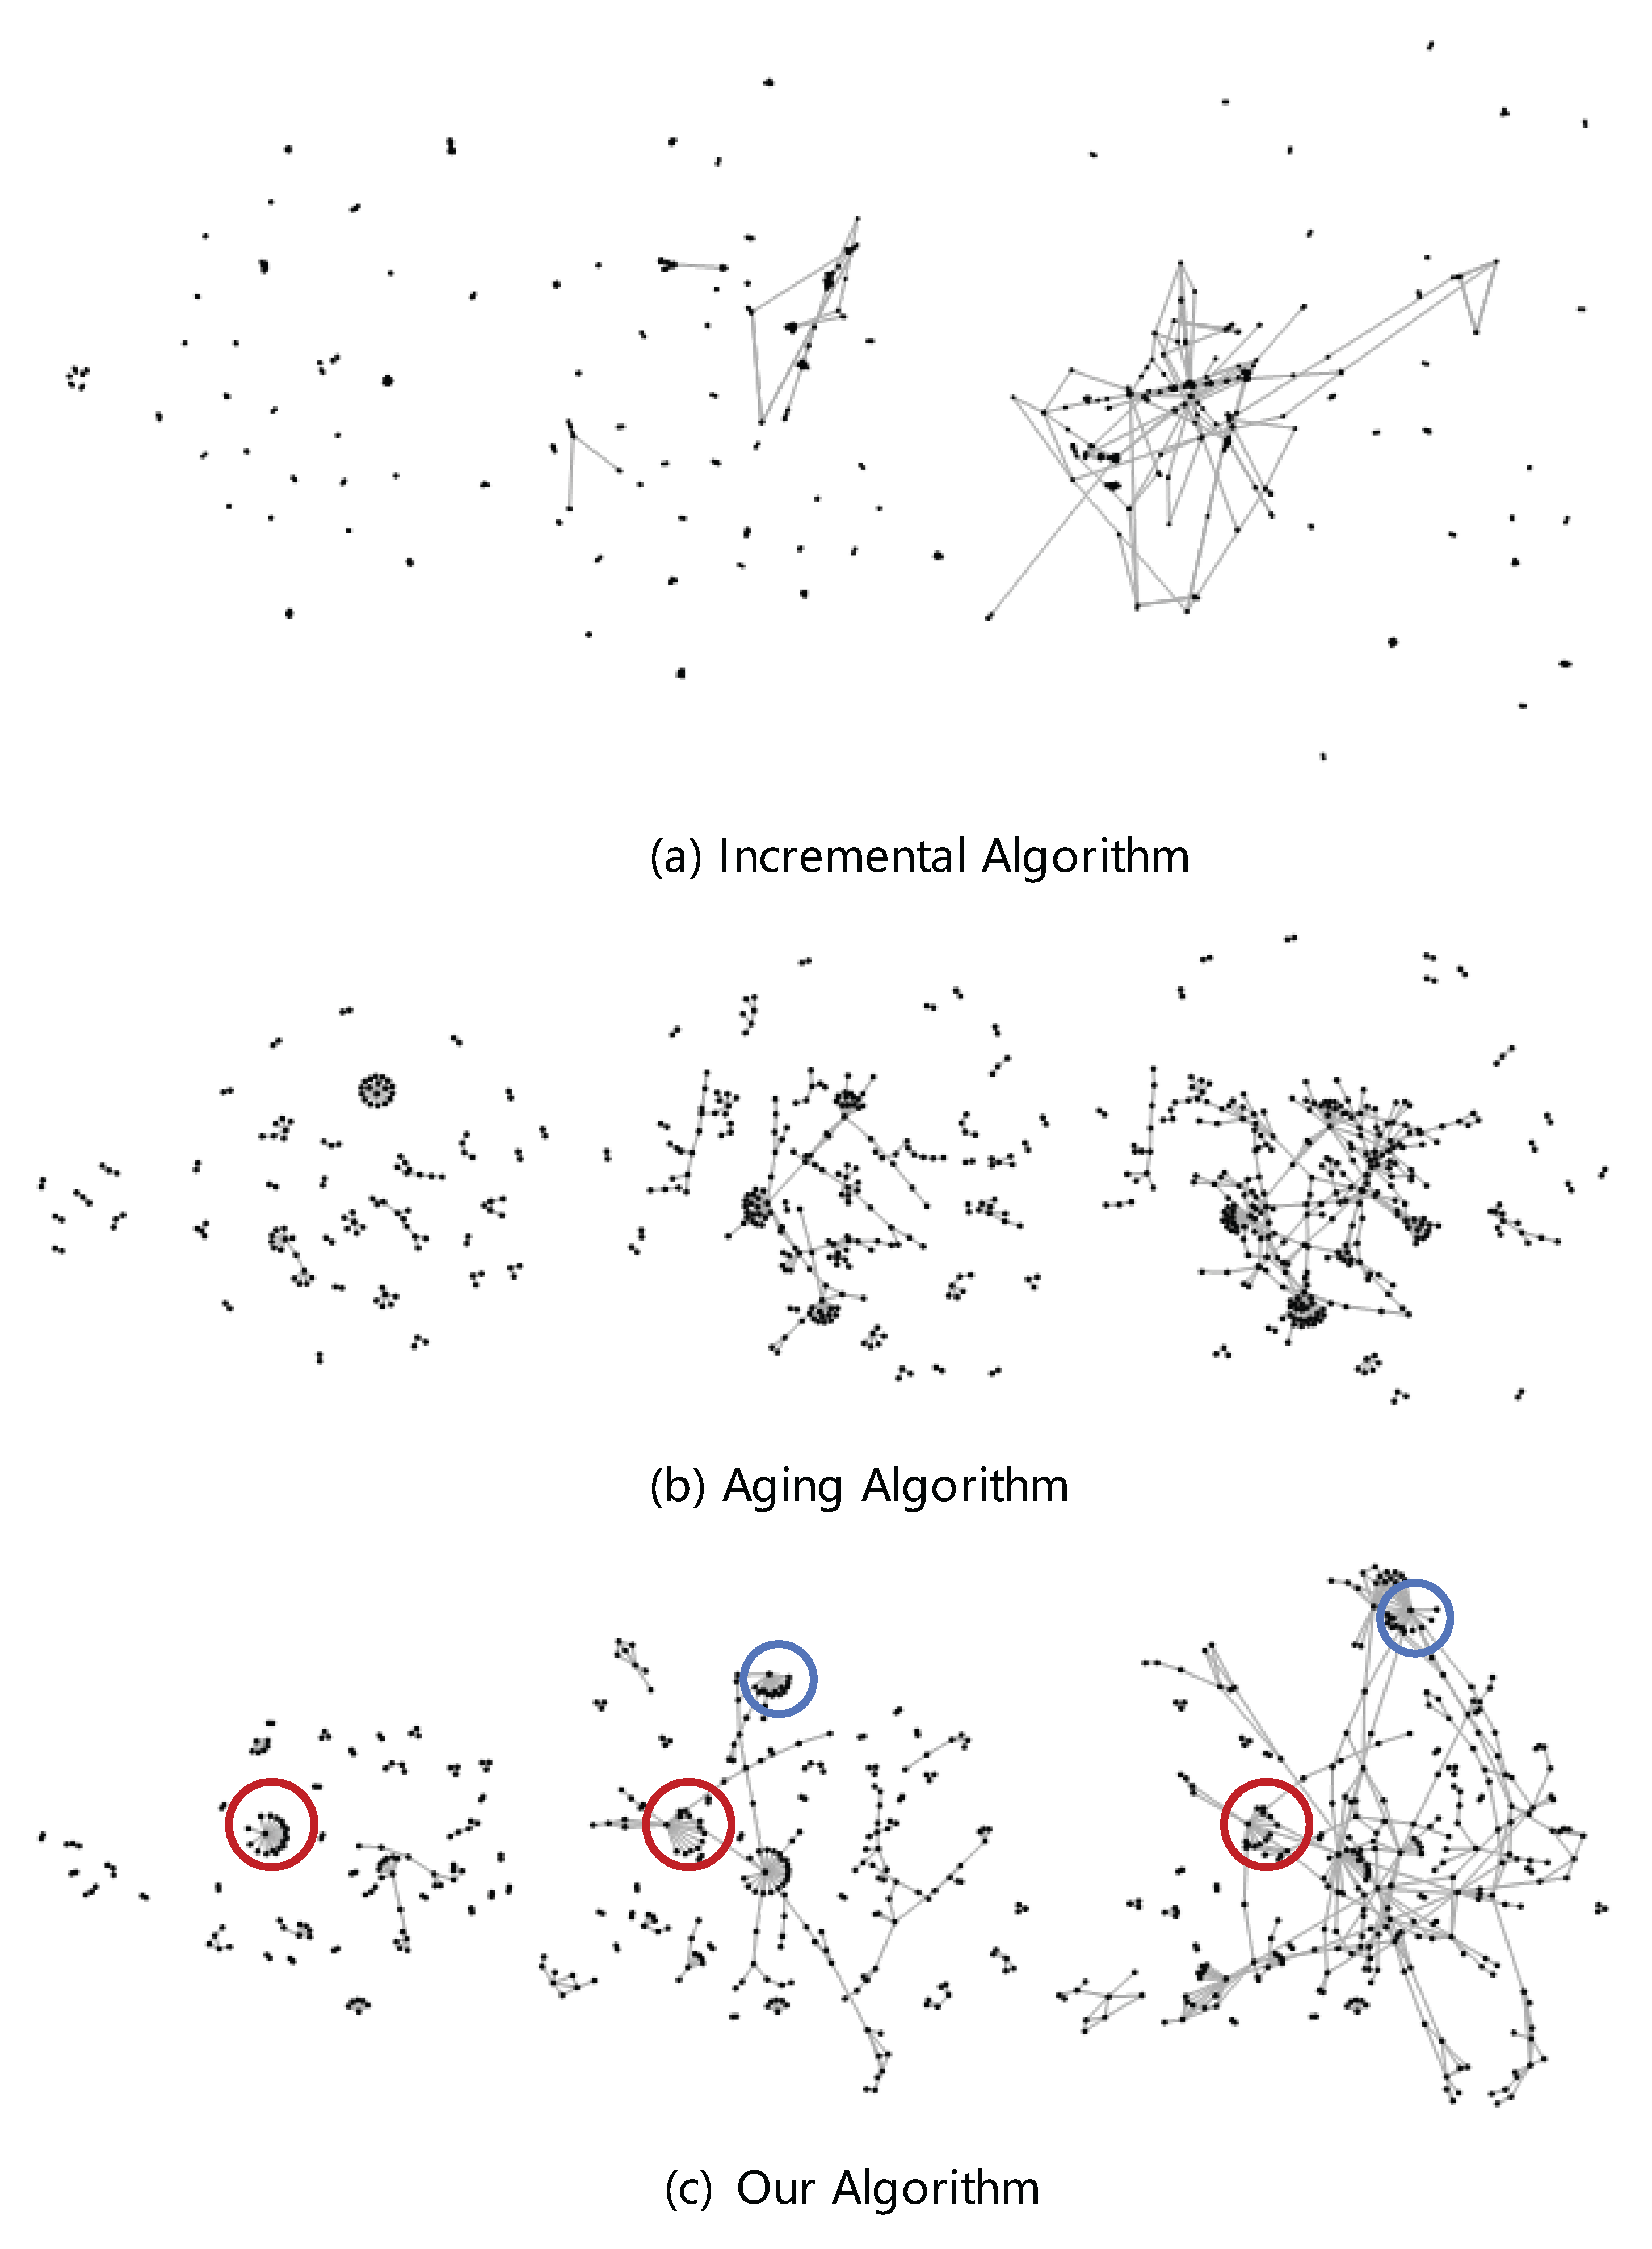
5.1.2. Layout Result Analysis
5.1.3. Quantitative Evaluation and Results Analysis
5.2. Informal Evaluation on Visualization System
5.2.1. Use Cases
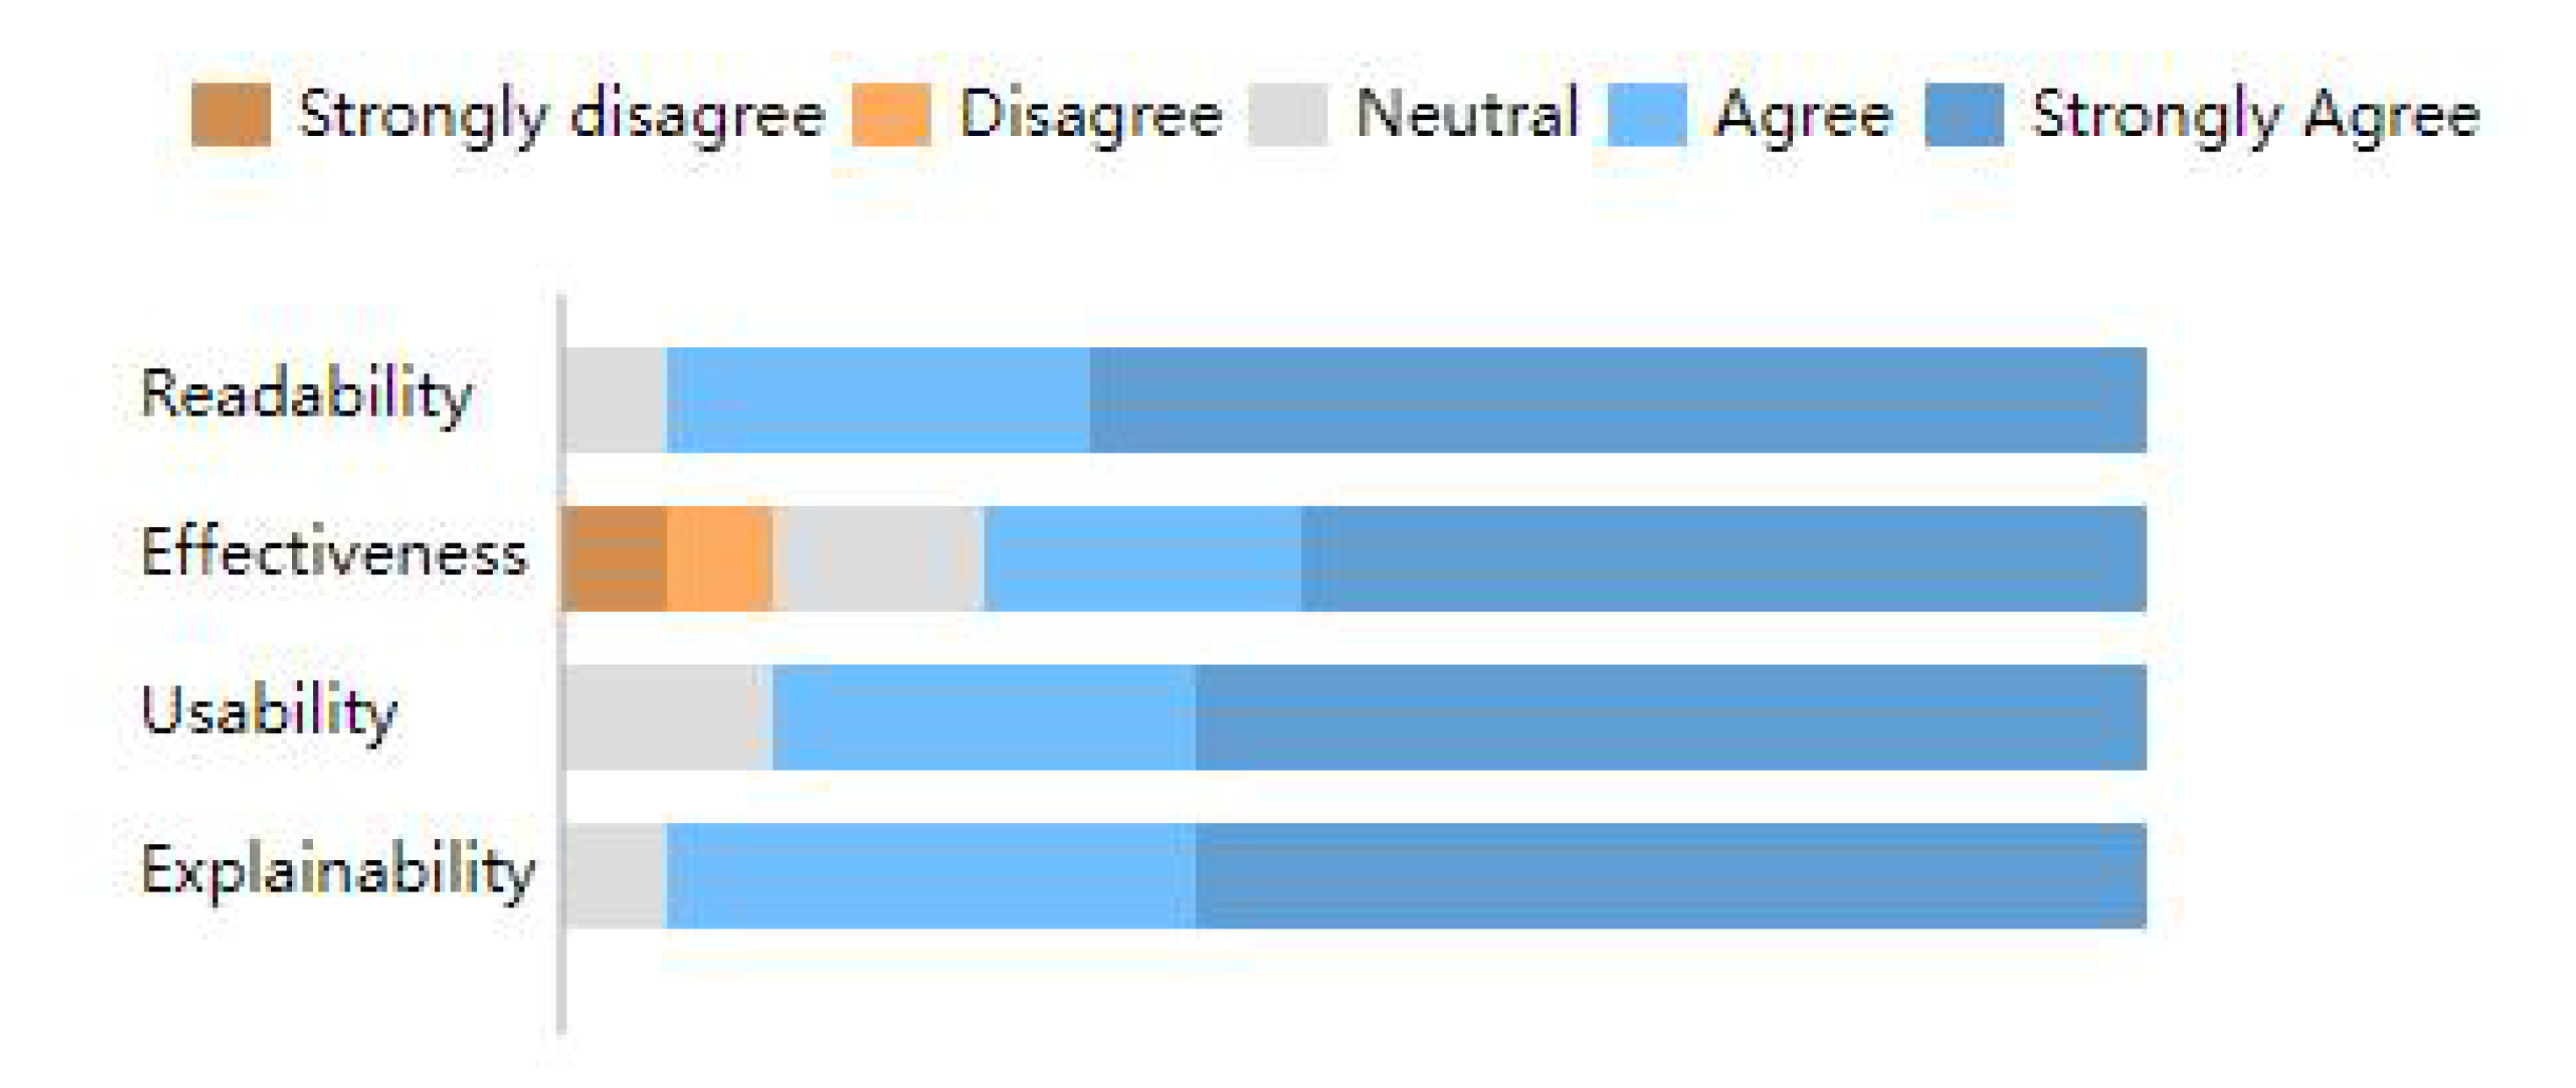
5.2.2. User Experiment
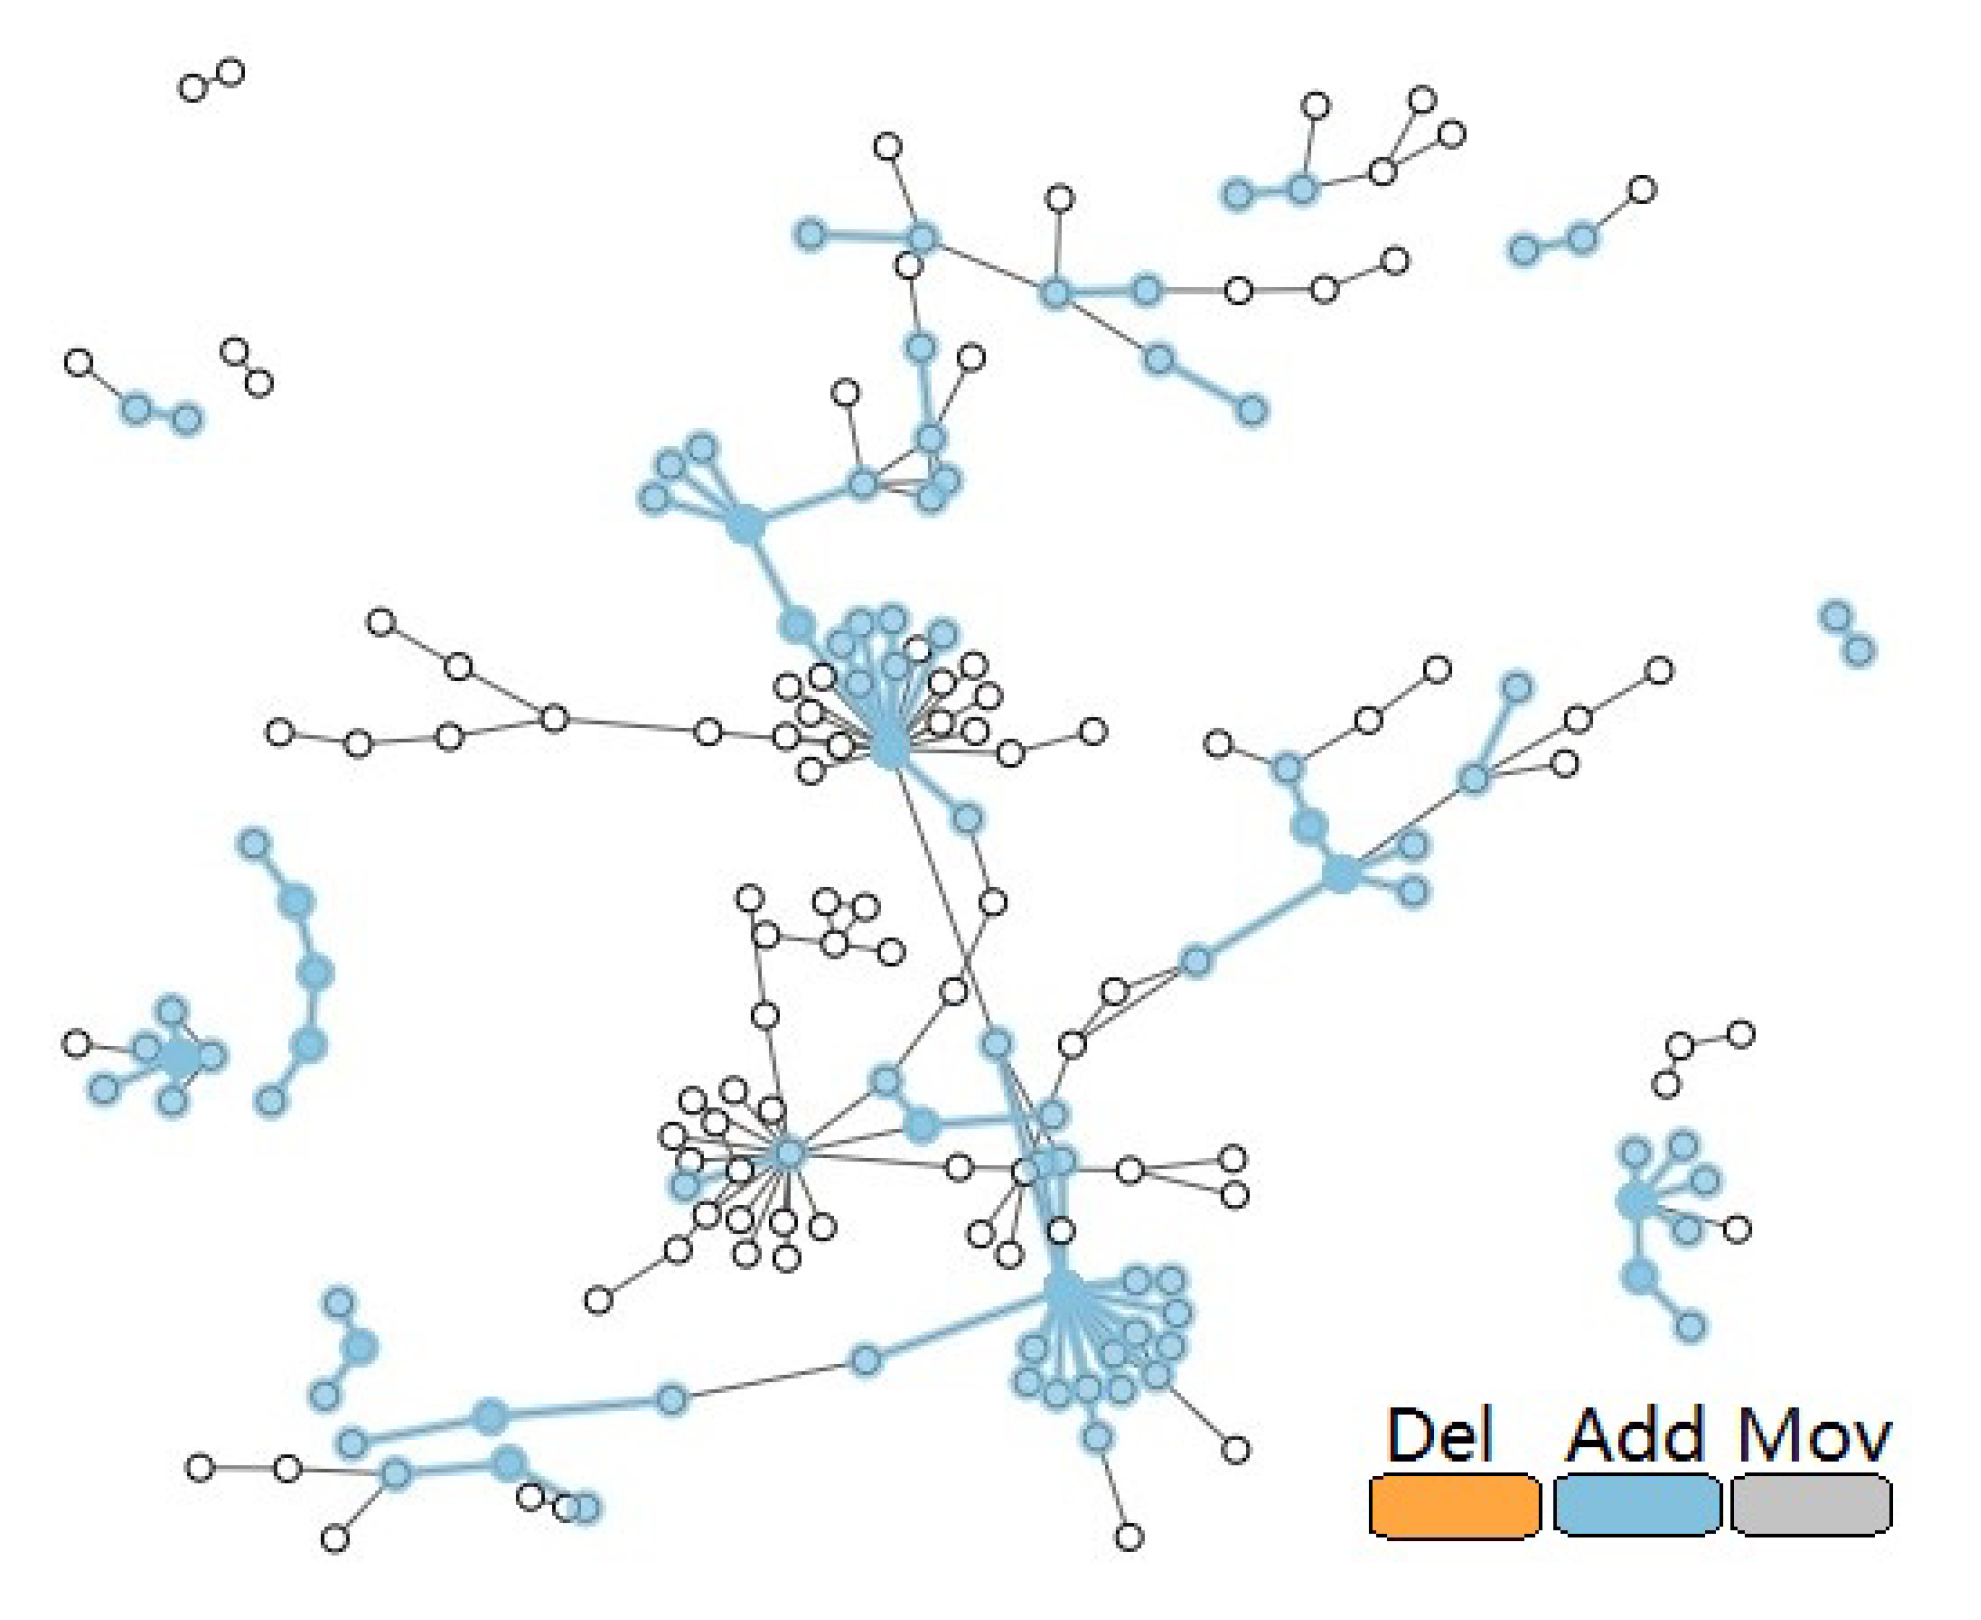
- Identify changes in network scale (increase, decrease, or unchanged).
- Determine if there have been significant changes in network structure.
- Identify whether specific structures have been preserved.
- Provide the previous layout position of specific nodes.
6. Discussions
7. Conclusions and Future Work
Author Contributions
Funding
Institutional Review Board Statement
Informed Consent Statement
Data Availability Statement
Conflicts of Interest
References
- Filipov, V.; Arleo, A.; Miksch, S. Are We There Yet? A Roadmap of Network Visualization from Surveys to Task Taxonomies. Comput. Graph. Forum 2023, 42, e14794. [Google Scholar] [CrossRef]
- Das, R.; Soylu, M. A key review on graph data science: The power of graphs in scientific studies. Chemom. Intell. Lab. Syst. 2023, 240, 104896. [Google Scholar] [CrossRef]
- Sobral, T.; Galvão, T.; Borges, J. Visualization of urban mobility data from intelligent transportation systems. Sensors 2019, 19, 332. [Google Scholar] [CrossRef] [PubMed]
- Riegler, V.; Wang, L.; Doppler-Haider, J.; Pohl, M. Evaluation of a novel visualization for dynamic social networks. In Proceedings of the 12th International Symposium on Visual Information Communication and Interaction, Shanghai, China, 20–22 September 2019; pp. 1–8. [Google Scholar]
- Brasch, S.; Fuellen, G.; Linsen, L. VENLO: Interactive visual exploration of aligned biological networks and their evolution. In Visualization in Medicine and Life Sciences II: Progress and New Challenges; Springer: Berlin/Heidelberg, Germany, 2012; pp. 229–247. [Google Scholar]
- Wu, Y.; Pitipornvivat, N.; Zhao, J.; Yang, S.; Huang, G.; Qu, H. egoslider: Visual analysis of egocentric network evolution. IEEE Trans. Vis. Comput. Graph. 2015, 22, 260–269. [Google Scholar] [CrossRef]
- Sondag, M.; Turkay, C.; Xu, K.; Matthews, L.; Mohr, S.; Archambault, D. Visual analytics of contact tracing policy simulations during an emergency response. Comput. Graph. Forum 2022, 41, 29–41. [Google Scholar] [CrossRef]
- Soylu, M.; Soylu, A.; Das, R. A new approach to recognizing the use of attitude markers by authors of academic journal articles. Expert Syst. Appl. 2023, 230, 120538. [Google Scholar] [CrossRef]
- Frishman, Y.; Tal, A. Online dynamic graph drawing. IEEE Trans. Vis. Comput. Graph. 2008, 14, 727–740. [Google Scholar] [CrossRef]
- Oh-Hyun, K.; Tarik, C.; Kwan-Liu, M. What would a graph look like in this layout. A machine learning approach to large graph visualization. IEEE Trans. Vis. Comput. Graph. 2018, 24, 478–488. [Google Scholar]
- Eades, P.; Lai, W.; Misue, K.; Sugiyama, K. Preserving the Mental Map of a Diagram; Technical report, Technical Report IIAS-RR-91-16E; Fujitsu Laboratories: Fukuoka, Japan, 1991. [Google Scholar]
- Beck, F.; Burch, M.; Diehl, S.; Weiskopf, D. A taxonomy and survey of dynamic graph visualization. Comput. Graph. Forum 2017, 36, 133–159. [Google Scholar] [CrossRef]
- Simonetto, P.; Archambault, D.; Kobourov, S. Event-based dynamic graph visualisation. IEEE Trans. Vis. Comput. Graph. 2018, 26, 2373–2386. [Google Scholar] [CrossRef]
- Sheng, S.Y.; Chen, S.T.; Dong, X.J.; Wu, C.Y.; Yuan, X.R. Inverse Markov Process Based Constrained Dynamic Graph Layout. J. Comput. Sci. Technol. 2021, 36, 707–718. [Google Scholar] [CrossRef]
- Chen, Y.; Guan, Z.; Zhang, R.; Du, X.; Wang, Y. A survey on visualization approaches for exploring association relationships in graph data. J. Vis. 2019, 22, 625–639. [Google Scholar] [CrossRef]
- Gorochowski, T.E.; di Bernardo, M.; Grierson, C.S. Using aging to visually uncover evolutionary processes on networks. IEEE Trans. Vis. Comput. Graph. 2011, 18, 1343–1352. [Google Scholar] [CrossRef] [PubMed]
- Crnovrsanin, T.; Chu, J.; Ma, K.L. An incremental layout method for visualizing online dynamic graphs. In Proceedings of the Graph Drawing and Network Visualization: 23rd International Symposium, GD 2015, Los Angeles, CA, USA, 24–26 September 2015; Revised Selected Papers 23. Springer: Berlin/Heidelberg, Germany, 2015; pp. 16–29. [Google Scholar]
- Misue, K.; Eades, P.; Lai, W.; Sugiyama, K. Layout adjustment and the mental map. J. Vis. Lang. Comput. 1995, 6, 183–210. [Google Scholar] [CrossRef]
- Lin, C.C.; Lee, Y.Y.; Yen, H.C. Mental map preserving graph drawing using simulated annealing. Inf. Sci. 2011, 181, 4253–4272. [Google Scholar] [CrossRef]
- Purchase, H.C. Metrics for graph drawing aesthetics. J. Vis. Lang. Comput. 2002, 13, 501–516. [Google Scholar] [CrossRef]
- Ahmed, N.K.; Neville, J.; Kompella, R. Network sampling: From static to streaming graphs. ACM Trans. Knowl. Discov. Data (TKDD) 2013, 8, 1–56. [Google Scholar] [CrossRef]
- Sheng, S.; Wu, C.; Dong, X.; Chen, S. Research on Dynamic Graph Layout by Parallel Computing and Markov Process. In Proceedings of the 2019 IEEE Intl Conf on Parallel & Distributed Processing with Applications, Big Data & Cloud Computing, Sustainable Computing & Communications, Social Computing & Networking (ISPA/BDCloud/SocialCom/SustainCom), Xiamen, China, 16–18 December 2019; IEEE: Piscataway, NJ, USA, 2019; pp. 1092–1098. [Google Scholar]
- Dwyer, T.; Koren, Y. Dig-CoLa: Directed graph layout through constrained energy minimization. In Proceedings of the IEEE Symposium on Information Visualization, INFOVIS 2005, Xiamen, China, 16–18 December 2005; IEEE: Piscataway, NJ, USA, 2005; pp. 65–72. [Google Scholar]
- Yuan, X.; Che, L.; Hu, Y.; Zhang, X. Intelligent graph layout using many users’ input. IEEE Trans. Vis. Comput. Graph. 2012, 18, 2699–2708. [Google Scholar] [CrossRef]
- Wang, Y.; Wang, Y.; Sun, Y.; Zhu, L.; Lu, K.; Fu, C.W.; Sedlmair, M.; Deussen, O.; Chen, B. Revisiting stress majorization as a unified framework for interactive constrained graph visualization. IEEE Trans. Vis. Comput. Graph. 2017, 24, 489–499. [Google Scholar] [CrossRef]
- Che, L.; Liang, J.; Yuan, X.; Shen, J.; Xu, J.; Li, Y. Laplacian-based dynamic graph visualization. In Proceedings of the 2015 IEEE Pacific Visualization Symposium (PacificVis), Hangzhou, China, 14–17 April 2015; IEEE: Piscataway, NJ, USA, 2015; pp. 69–73. [Google Scholar]
- Cohen, R.F.; Di Battista, G.; Tamassia, R.; Tollis, I.G.; Bertolazzi, P. A framework for dynamic graph drawing. In Proceedings of the Eighth Annual Symposium on Computational Geometry, Berlin, Germany, 10–12 June 1992; pp. 261–270. [Google Scholar]
- Erten, C.; Harding, P.J.; Kobourov, S.G.; Wampler, K.; Yee, G. GraphAEL: Graph animations with evolving layouts. In Proceedings of the Graph Drawing: 11th International Symposium, GD 2003, Perugia, Italy, 21–24 September 2003; Revised Papers 11. Springer: Berlin/Heidelberg, Germany, 2004; pp. 98–110. [Google Scholar]
- Bach, B.; Pietriga, E.; Fekete, J.D. GraphDiaries: Animated transitions andtemporal navigation for dynamic networks. IEEE Trans. Vis. Comput. Graph. 2013, 20, 740–754. [Google Scholar] [CrossRef]
- Shi, L.; Wang, C.; Wen, Z.; Qu, H.; Lin, C.; Liao, Q. 1.5 D egocentric dynamic network visualization. IEEE Trans. Vis. Comput. Graph. 2014, 21, 624–637. [Google Scholar] [CrossRef] [PubMed]
- Burch, M.; Weiskopf, D. Flip-Book Visualization of Dynamic Graphs. Int. J. Softw. Inform. 2015, 9, 3–21. [Google Scholar]
- Bach, B.; Henry-Riche, N.; Dwyer, T.; Madhyastha, T.; Fekete, J.D.; Grabowski, T. Small MultiPiles: Piling time to explore temporal patterns in dynamic networks. Comput. Graph. Forum 2015, 34, 31–40. [Google Scholar] [CrossRef]
- Farrugia, M.; Quigley, A. Effective temporal graph layout: A comparative study of animation versus static display methods. Inf. Vis. 2011, 10, 47–64. [Google Scholar] [CrossRef]
- Beck, F.; Burch, M.; Diehl, S.; Weiskopf, D. The State of the Art in Visualizing Dynamic Graphs. In EuroVis (STARs); The Eurographics Association: Eindhoven, The Netherlands, 2014. [Google Scholar]
- Nobre, C.; Meyer, M.; Streit, M.; Lex, A. The state of the art in visualizing multivariate networks. Comput. Graph. Forum 2019, 38, 807–832. [Google Scholar] [CrossRef]
- Ghoniem, M.; Fekete, J.D.; Castagliola, P. A comparison of the readability of graphs using node-link and matrix-based representations. In Proceedings of the IEEE Symposium on Information Visualization, Austin, TX, USA, 10–12 October 2004; IEEE: Piscataway, NJ, USA, 2004; pp. 17–24. [Google Scholar]
- Van Den Elzen, S.; Holten, D.; Blaas, J.; Van Wijk, J.J. Dynamic network visualization with Extended massive sequence views. IEEE Trans. Vis. Comput. Graph. 2013, 20, 1087–1099. [Google Scholar] [CrossRef]
- Ponciano, J.R.; Linhares, C.D.; Faria, E.R.; Travençolo, B.A. An online and nonuniform timeslicing method for network visualisation. Comput. Graph. 2021, 97, 170–182. [Google Scholar] [CrossRef]
- Zhao, Y.; Chen, W.; She, Y.; Wu, Q.; Peng, Y.; Fan, X. Visualizing dynamic network via sampled massive sequence view. In Proceedings of the 12th International Symposium on Visual Information Communication and Interaction, Shanghai, China, 20–22 September 2019; pp. 1–2. [Google Scholar]
- Burch, M.; Ten Brinke, K.B.; Castella, A.; Peters, G.K.S.; Shteriyanov, V.; Vlasvinkel, R. Dynamic graph exploration by interactively linked node-link diagrams and matrix visualizations. Vis. Comput. Ind. Biomed. Art 2021, 4, 1–14. [Google Scholar] [CrossRef]
- Lu, Q.; Huang, J.; Ge, Y.; Wen, D.; Chen, B.; Yu, Y. EgoVis: A Visual Analysis System for Social Networks Based on Egocentric Research. Int. J. Coop. Inf. Syst. 2020, 29, 1930003. [Google Scholar] [CrossRef]
- Hayashi, A.; Matsubayashi, T.; Hoshide, T.; Uchiyama, T. Initial positioning method for online and real-time dynamic graph drawing of time varying data. In Proceedings of the 2013 17th International Conference on Information Visualisation, London, UK, 16–18 July 2013; IEEE: Piscataway, NJ, USA, 2013; pp. 435–444. [Google Scholar]
- Bostock, M. D3.js: Data-Driven Documents, 2010. JavaScript Library for Manipulating Documents Based on Data. Available online: https://d3js.org/ (accessed on 10 May 2023).
- Khan, B.S.; Niazi, M.A. Network community detection: A review and visual survey. arXiv 2017, arXiv:1708.00977. [Google Scholar]
- Clauset, A.; Newman, M.E.; Moore, C. Finding community structure in very large networks. Phys. Rev. E 2004, 70, 066111. [Google Scholar] [CrossRef] [PubMed]
- Newcomb, T.M. The Acquaintance Process as a Prototype of Human Interaction; Holt, Rinehart & Winston: New York, NY, USA, 1961. [Google Scholar]
- McFarland, D.A. Student resistance: How the formal and informal organization of classrooms facilitate everyday forms of student defiance. Am. J. Sociol. 2001, 107, 612–678. [Google Scholar] [CrossRef]
- Leskovec, J.; Krevl, A. SNAP Datasets: Stanford Large Network Dataset Collection. 2014. Available online: https://snap.stanford.edu/data/ (accessed on 10 May 2023).
- Wang, Y.; Archambault, D.; Haleem, H.; Moeller, T.; Wu, Y.; Qu, H. Nonuniform timeslicing of dynamic graphs based on visual complexity. In Proceedings of the 2019 IEEE Visualization Conference (VIS), Vancouver, BC, Canada, 20–25 October 2019; IEEE: Piscataway, NJ, USA, 2019; pp. 1–5. [Google Scholar]
- Sikdar, S.; Chakraborty, T.; Sarkar, S.; Ganguly, N.; Mukherjee, A. Compas: Community preserving sampling for streaming graphs. arXiv 2018, arXiv:1802.01614. [Google Scholar]
- Stanley, N.; Kwitt, R.; Niethammer, M.; Mucha, P.J. Compressing networks with super nodes. Sci. Rep. 2018, 8, 10892. [Google Scholar] [CrossRef] [PubMed]
- Kruiger, J.F.; Rauber, P.E.; Martins, R.M.; Kerren, A.; Kobourov, S.; Telea, A.C. Graph Layouts by t-SNE. Comput. Graph. Forum 2017, 36, 283–294. [Google Scholar] [CrossRef]
- van den Elzen, S.; Holten, D.; Blaas, J.; van Wijk, J.J. Reducing snapshots to points: A visual analytics approach to dynamic network exploration. IEEE Trans. Vis. Comput. Graph. 2015, 22, 1–10. [Google Scholar] [CrossRef]
- von Landesberger, T.; Kuijper, A.; Schreck, T.; Kohlhammer, J.; van Wijk, J.J.; Fekete, J.D.; Fellner, D.W. Visual analysis of large graphs. In Proceedings of the Eurographics (State of the Art Reports), Norrköping, Sweden, 3–7 May 2010; pp. 37–60. [Google Scholar]
- Richer, G.; Pister, A.; Abdelaal, M.; Fekete, J.D.; Sedlmair, M.; Weiskopf, D. Scalability in visualization. IEEE Trans. Vis. Comput. Graph. 2022, 1–15. [Google Scholar] [CrossRef]
- Yoghourdjian, V.; Archambault, D.; Diehl, S.; Dwyer, T.; Klein, K.; Purchase, H.C.; Wu, H.Y. Exploring the limits of complexity: A survey of empirical studies on graph visualisation. Vis. Infor. 2018, 2, 264–282. [Google Scholar] [CrossRef]
- Linhares, C.D.; Ponciano, J.R.; Pedro, D.S.; Rocha, L.E.; Traina, A.J.; Poco, J. LargeNetVis: Visual exploration of large temporal networks based on community taxonomies. IEEE Trans. Vis. Comput. Graph. 2022, 29, 203–213. [Google Scholar] [CrossRef]
- Mi, P.; Sun, M.; Masiane, M.; Cao, Y.; North, C. Interactive graph layout of a million nodes. Informatics 2016, 3, 23. [Google Scholar] [CrossRef]
- Ahmed, N.K.; Duffield, N.; Willke, T.; Rossi, R.A. On sampling from massive graph streams. arXiv 2017, arXiv:1703.02625. [Google Scholar] [CrossRef]
- Etemadi, R.; Lu, J. Pes: Priority edge sampling in streaming triangle estimation. IEEE Trans. Big Data 2019, 8, 470–481. [Google Scholar] [CrossRef]
- Ponciano, J.R.; Linhares, C.D.; Rocha, L.E.; Faria, E.R.; Travençolo, B.A. A streaming edge sampling method for network visualization. Knowl. Inf. Syst. 2021, 63, 1717–1743. [Google Scholar] [CrossRef]
- Sarmento, R.P.; Cordeiro, M.M.; Gama, J. Streaming networks sampling using top-k networks. In Proceedings of the 17th International Conference on Enterprise Information Systems (ICEIS-2015), Barcelona, Spain, 27–30 April 2015. [Google Scholar]


| Network | Node Count | Avg Edge Count | Steps |
|---|---|---|---|
| Newcomb | 17 | 40 | 15 |
| McFarland | 20 | 28 | 82 |
| email-Eu | 414 | 592 | 30 |
| Network | Aging | FR | Incremental | Ours |
|---|---|---|---|---|
| Newcomb | 2.6905 | 3.9169 | 1.0798 | 3.1675 |
| McFarland | 0.3969 | 1.0571 | 0.9594 | 0.3851 |
| email-Eu | 9.4554 | 15.1272 | 9.1390 | 12.1970 |
| email-Eu_day1 | 0.84235 | 6.1739 | 0.6715 | 4.5652 |
| Network | Aging | FR | Incremental | Ours |
|---|---|---|---|---|
| Newcomb | 0.9361 | 0.9394 | 0.8979 | 0.9468 |
| McFarland | 0.9236 | 0.9292 | 0.8910 | 0.9430 |
| email-Eu | 0.9949 | 0.9962 | 0.9916 | 0.9968 |
| email-Eu_day1 | 0.9948 | 0.9970 | 0.9953 | 0.9952 |
| Network | Aging | FR | Incremental | Ours |
|---|---|---|---|---|
| Newcomb | 0.3388 | 0.3334 | 0.2860 | 0.3723 |
| McFarland | 0.5710 | 0.6498 | 0.5506 | 0.6040 |
| email-Eu | 0.7733 | 0.7725 | 0.7743 | 0.7848 |
| email-Eu_day1 | 0.81342 | 0.8203 | 0.8496 | 0.8165 |
| Network | Aging | FR | Incremental | Ours |
|---|---|---|---|---|
| Newcomb | 0.3362 | 0.3812 | 0.2905 | 0.3515 |
| McFarland | 0.4292 | 0.2723 | 0.3526 | 0.4854 |
| email-Eu | 0.2289 | 0.2500 | 0.2838 | 0.3090 |
| email-Eu_day1 | 0.2928 | 0.3371 | 0.3916 | 0.3368 |
Disclaimer/Publisher’s Note: The statements, opinions and data contained in all publications are solely those of the individual author(s) and contributor(s) and not of MDPI and/or the editor(s). MDPI and/or the editor(s) disclaim responsibility for any injury to people or property resulting from any ideas, methods, instructions or products referred to in the content. |
© 2023 by the authors. Licensee MDPI, Basel, Switzerland. This article is an open access article distributed under the terms and conditions of the Creative Commons Attribution (CC BY) license (https://creativecommons.org/licenses/by/4.0/).
Share and Cite
Wang, G.; Chen, H.; Zhou, R.; Wu, Y.; Gao, W.; Liao, J.; Wang, F. Online Dynamic Network Visualization Based on SIPA Layout Algorithm. Appl. Sci. 2023, 13, 12873. https://doi.org/10.3390/app132312873
Wang G, Chen H, Zhou R, Wu Y, Gao W, Liao J, Wang F. Online Dynamic Network Visualization Based on SIPA Layout Algorithm. Applied Sciences. 2023; 13(23):12873. https://doi.org/10.3390/app132312873
Chicago/Turabian StyleWang, Guijuan, Huarong Chen, Rui Zhou, Yadong Wu, Wei Gao, Jing Liao, and Fupan Wang. 2023. "Online Dynamic Network Visualization Based on SIPA Layout Algorithm" Applied Sciences 13, no. 23: 12873. https://doi.org/10.3390/app132312873
APA StyleWang, G., Chen, H., Zhou, R., Wu, Y., Gao, W., Liao, J., & Wang, F. (2023). Online Dynamic Network Visualization Based on SIPA Layout Algorithm. Applied Sciences, 13(23), 12873. https://doi.org/10.3390/app132312873