Abstract
In this study, the phenomenon of column separation that occurs in the downstream pipeline of a rapid closure valve is experimentally investigated. Special attention is paid to the dynamic behavior of the formation, growth, and collapse processes of cavities, which are observed using a high-speed camera. Synchronized images of cavity patterns and measured pressure histories are analyzed to elucidate the process of water column separation, the mechanism of column separation events, and the influence of parameters on the transient flow. Experimental results indicate that during the collapse process of vapor cavities, a superposition phenomenon involving a positive pressure wave and collapse wave occurs, resulting in a nearly three times rise of Joukowsky pressure. In all test cases, the maximum pressure of the pipeline exceeded 150 times the reservoir static pressure. A new classification for a water hammer combined with cavitation (four types of pressure oscillation patterns) is proposed based on whether the duration of column separation decreases sequentially and the maximum pipeline pressure follows the first collapse of cavities at the valve. As the initial flow velocity increases, there is generally an increase in maximum pressure; however, this trend may be scattered under certain operation conditions.
1. Introduction
Water hammer events, including column separation, occur in a pipeline system when the pressure drops to vaporization pressure level. Extreme high pressure may occur when the separated water columns rejoin (i.e., collapse of vapor cavities), which causes pipe failures and can lead to severe accidents. Since Joukowsky first observed column separation in his experimental pipeline system [1], many researchers have paid great attention to this issue. A number of investigations have been carried out to study the behavior of water hammers with transient cavitation. Bergant et al. [1] reviewed the historical development of column separation. In most cases, mathematical and numerical models (e.g., the discrete vapor cavity model and discrete gas cavity model, which were solved using different numerical methods [2,3,4,5], two-phase flow models [6,7], interface models [8,9], CFD approach [10,11,12], etc.) have been discussed, but little information on experiments and experimental data has been published, especially in cases when column separation occurs due to the rapid closure of a valve at the downstream end of the pipeline.
For column separation on the upstream side of a rapid closure valve, experiments have mainly been performed to verify numerical models [3,8,13]. Bergant and Simpson [3] proposed a classification of column separation (active or passive) based on whether the maximum pipeline pressure generated following column separation results in a short-duration pressure pulse. Mitosek [14] observed pressure oscillation with gradually increasing frequency following the collapse of vapor bubbles. The shapes of pressure histories at valves are distinctly different, with typical examples recorded by Simpson [8] and Bergant and Simpson [3]. Some scholars have conducted visualization studies on column separation by incorporating a transparent section into the pipeline system [15,16,17]. Adamkowski and Lewandowski [16] presented photographs of local cavities formed at the top of a pipe with a horizontal lower surface. A vaporous cavitation zone extended along the pipe’s length to three quarters of the pipe’s distance from the valve. Kashada [17] presented photographs of vapor bubbles in two situations: limited cavitation and classic severe cavitation.
However, few studies have focused on column separation on the downstream side of a rapid closure valve. Regarding published reports on this topic, most researchers have merely discussed the variation characteristic of pressure over time and its influencing parameters. Safwat and Van Den Polder [18] discussed the transient pressure and velocity changes in hydraulic transients resulting from the closure of a pipeline’s upstream valve, and pointed out that the existence of cavitation bubbles creates large resistance to flow, resulting in larger actual transient pressure and velocity damping. Zheng et al. [19] concluded that the instantaneous pressure following the collapse of cavitation bubbles in the downstream side of a valve is much larger than the conventional Joukowsky pressure rise in the upstream side of the valve, leading to severe accidents. Autrique et al. [20] experimentally investigated the occurrence of column separation on the downstream side of a valve and observed that the superposition of positive pressure waves was capable of causing an extreme pressure rise close to two times the Joukowsky pressure rise. Soares et al. [21,22] performed experimental tests on transient cavitating flow in viscoelastic pipes to verify their proposed numerical model with the viscoelasticity of high-density polyethylene pipes.
Other studies on column separation initiated by the closure valve located on the upstream end of a pipeline have also produced photographs of the creation and collapse of a cavity. Baltzer [23] observed a cavitation region with plenty of tiny bubbles occupying the entire pipe cross-section, extending along the pipeline over a long distance. Himr [24] presented photographs of a cavity in the downstream side of a closure valve. The creation of a cavity was captured, the growth in size of which caused partial separation of the water column in the upper portion of the pipe cross-section. In the experiments, the maximum length of the cavity reached up to 30 cm, approximately three-fourths of the pipe cross-section. Unfortunately, synchronization analyses between transient pressures and the dynamic behavior of a cavity, which are key to exploring the physical processes of the transient events that accompany a column’s separation, are limited.
The main objective of this paper is to explore the dynamic behaviors of column separation following the closure of an upstream valve in a horizontal pipe. In particular, high-resolution photographs of cavity formation and collapse, captured using a high-speed camera, are synchronized with recorded pressure histories in order to illustrate their interrelations. Moreover, the influence of parameters such as initial flow velocity, reservoir static pressure head, and pipeline length on column separation events is discussed in detail.
2. Experimental Apparatus
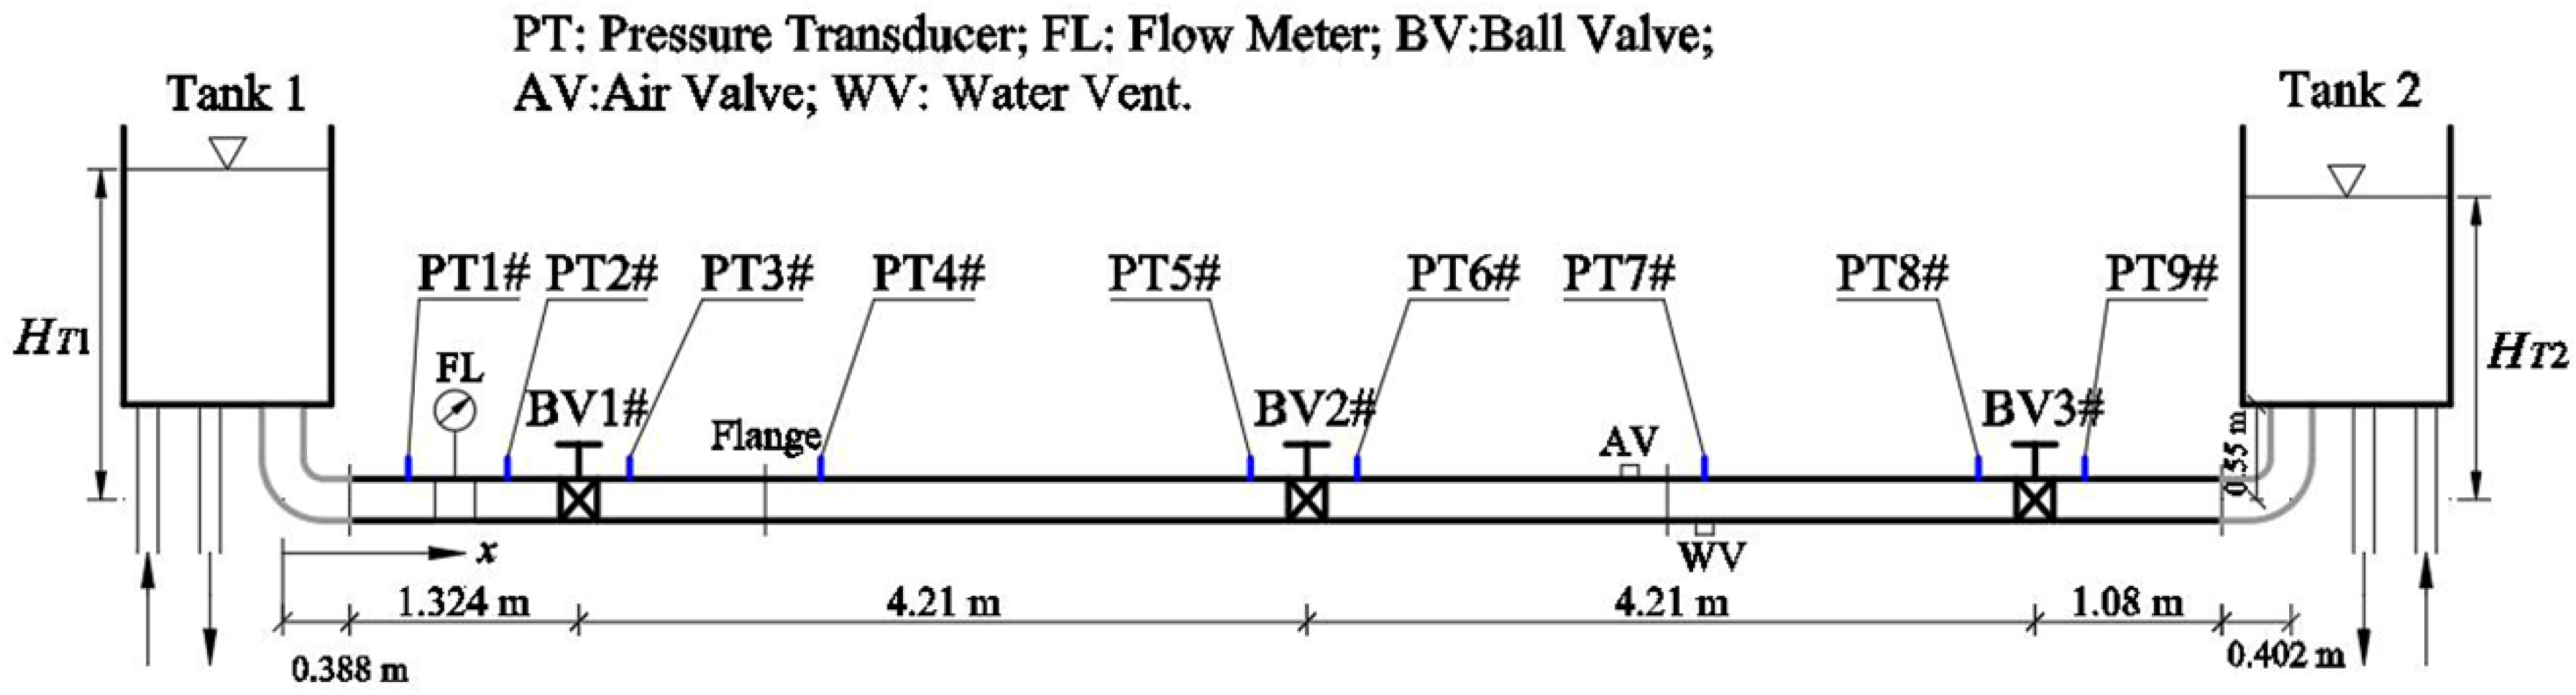
A flexible experimental system for investigating water column separation on the downstream side of a fully closed upstream valve was designed and constructed at the Hydraulic Laboratory of Hohai University. The apparatus shown in Figure 1 consists of an upstream reservoir, a 12.714 m long, 40 mm inside diameter pipe, three quarter-turn ball valves, and a downstream reservoir. The pipeline has two L-shaped stainless steel pipes (with 40 mm inside diameter and 3 mm wall thickness) that are connected to a horizontal PMMA pipe (with 10 mm wall thickness) and two reservoirs. The length of the horizontal section of the pipeline is 11.614 m. The upstream and downstream reservoirs have the same dimensions: 1.3 m long, 1.0 m wide, and 4.0 m high. The maximum pressure head in both tanks could reach 4.55 m.
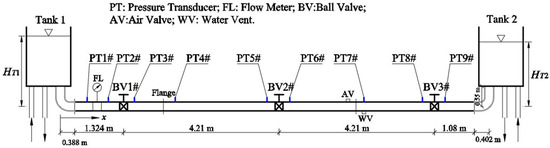
Figure 1.
Schematic diagram of the hydraulic transient apparatus.
Nine piezoelectric pressure transducers were used to measure the pressure variation in the pipeline. The installation locations are provided in Table 1. All the pressure transducers used were BYP300. Pressure ranged from −0.1 to 3 MPa with an output range from 0 to +5 V. The lag error was less than 0.15% of the full range. An electromagnetic flow meter was installed at 1.445 m downstream in Tank 1 to measure the steady flowrate that ranged from 0 to 25 m3/h with a DC voltage output ranging from 1 to 5 V. The error was less than 0.2% of the full range. A fast-response data acquisition system was utilized to collect, digitize, and record voltages from the transient signals: flowrate and nine pressures. A software package for date acquisition and analysis, National Instruments software LabVIEW v2016, was used to control the data acquisition. The ten signals were fed into a National Instruments 16-bit A-D card, Model OCI 6221. The data acquisition software was set to initiate data collection automatically. The pressure and flowrate oscillation histories were displayed on the computer screen. Both data sampling frequencies for pressure and flowrate were 5000 Hz. A high-speed, high-resolution digital video camera (Memrecam Q1m) was used to record changes in the cavity during column separation. The shooting frequency of the high-speed camera was 1000 Hz.

Table 1.
Installation locations of pressure transducers.
The wave speed a was measured during water hammer events with no cavitation by using Equation (1):
where L is the length of the pipeline, and T is the pipeline period of pressure wave reflection. Using the average wave speed values under different single-phase water hammer conditions, the wave speed value for the pipeline was determined as 763 ± 21 m/s.
The friction factor in the steady flow state was evaluated using the Darcy–Weisbach formula [25]:
where hf is the total pressure head loss, D is the inner diameter of the pipes, V is the flow velocity, and g is the gravitational acceleration. For our experimental system, the friction factor ranged between 0.034 and 0.055.
The valve closure time, tc, recorded using the high-speed camera, ranged from 0.02 to 0.05 s. The delay time of the ball valve ranged from 0.02 to 0.03 s.
3. Observations and Results
In this work, the column separation phenomenon that occurs in the downstream side of a closing valve was investigated. The influence of initial flow velocity, reservoir static pressure head, and pipeline length on column separation events in an experimental apparatus (Figure 1) was studied. Experimental runs were performed for the rapid closure of ball valves, BV1# or BV2#, with three constant downstream static heads in Tank 2 (HT2 = 1.55, 2.55, 3.55 m). The flow direction was from Tank 1 to Tank 2. The initial static head in Tank 1#, HT1, varied with an interval of 0.01 m in each experimental case, which created different initial flow velocity conditions. The experiments thus contained 28 individual cases, as listed in Table 2.
Table 2.
Summary of experimental cases.
An initial steady flow condition was established by controlling the water levels in both the upstream and downstream tanks. All valves were fully open. Then, a valve was closed rapidly to initiate a water hammer event. Each experimental case was repeated at least three times until the magnitude and timing of the main pressure pulse were almost the same. In order to better establish the consistency of the results, each repetition was carefully conducted.
3.1. Column Separation Behaviors and Synchronous Pressure Surges
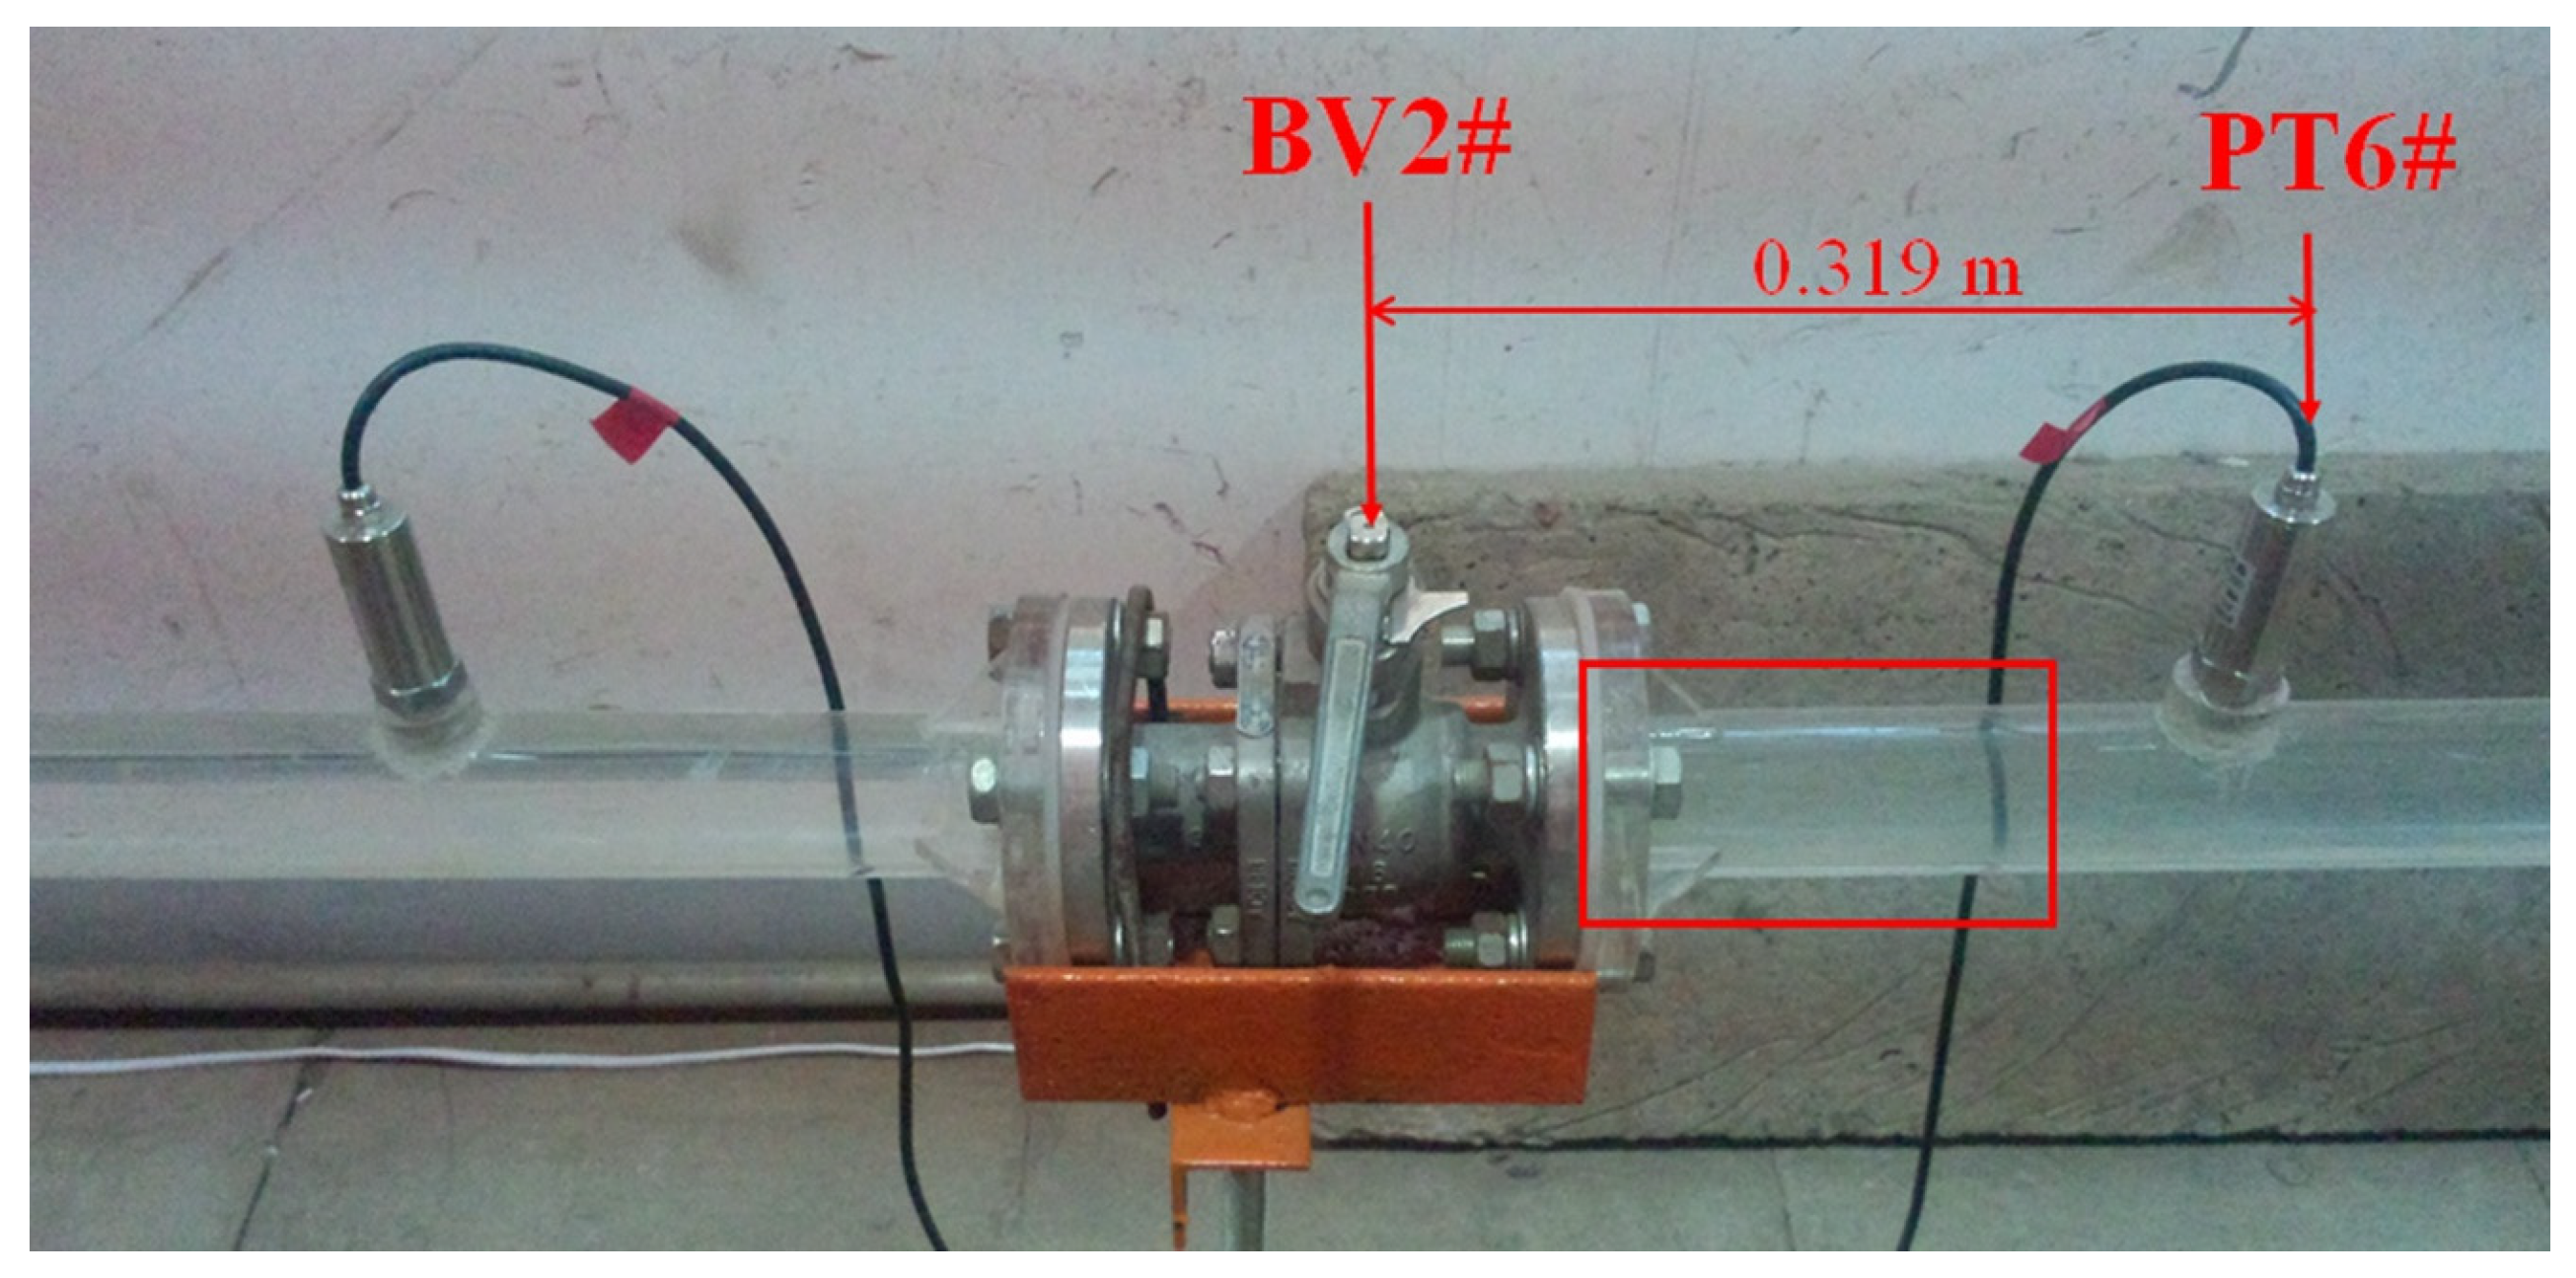
To capture cavitation behaviors in pipelines, the high-speed camera was located downstream of the operating valve, BV1# or BV2#, as shown in Figure 2. A sequence of photographs and the associated pressure variations were synchronously illustrated to show cavity behavior during a column separation event.

Figure 2.
Shooting position of the high-speed camera when BV2# is closing.
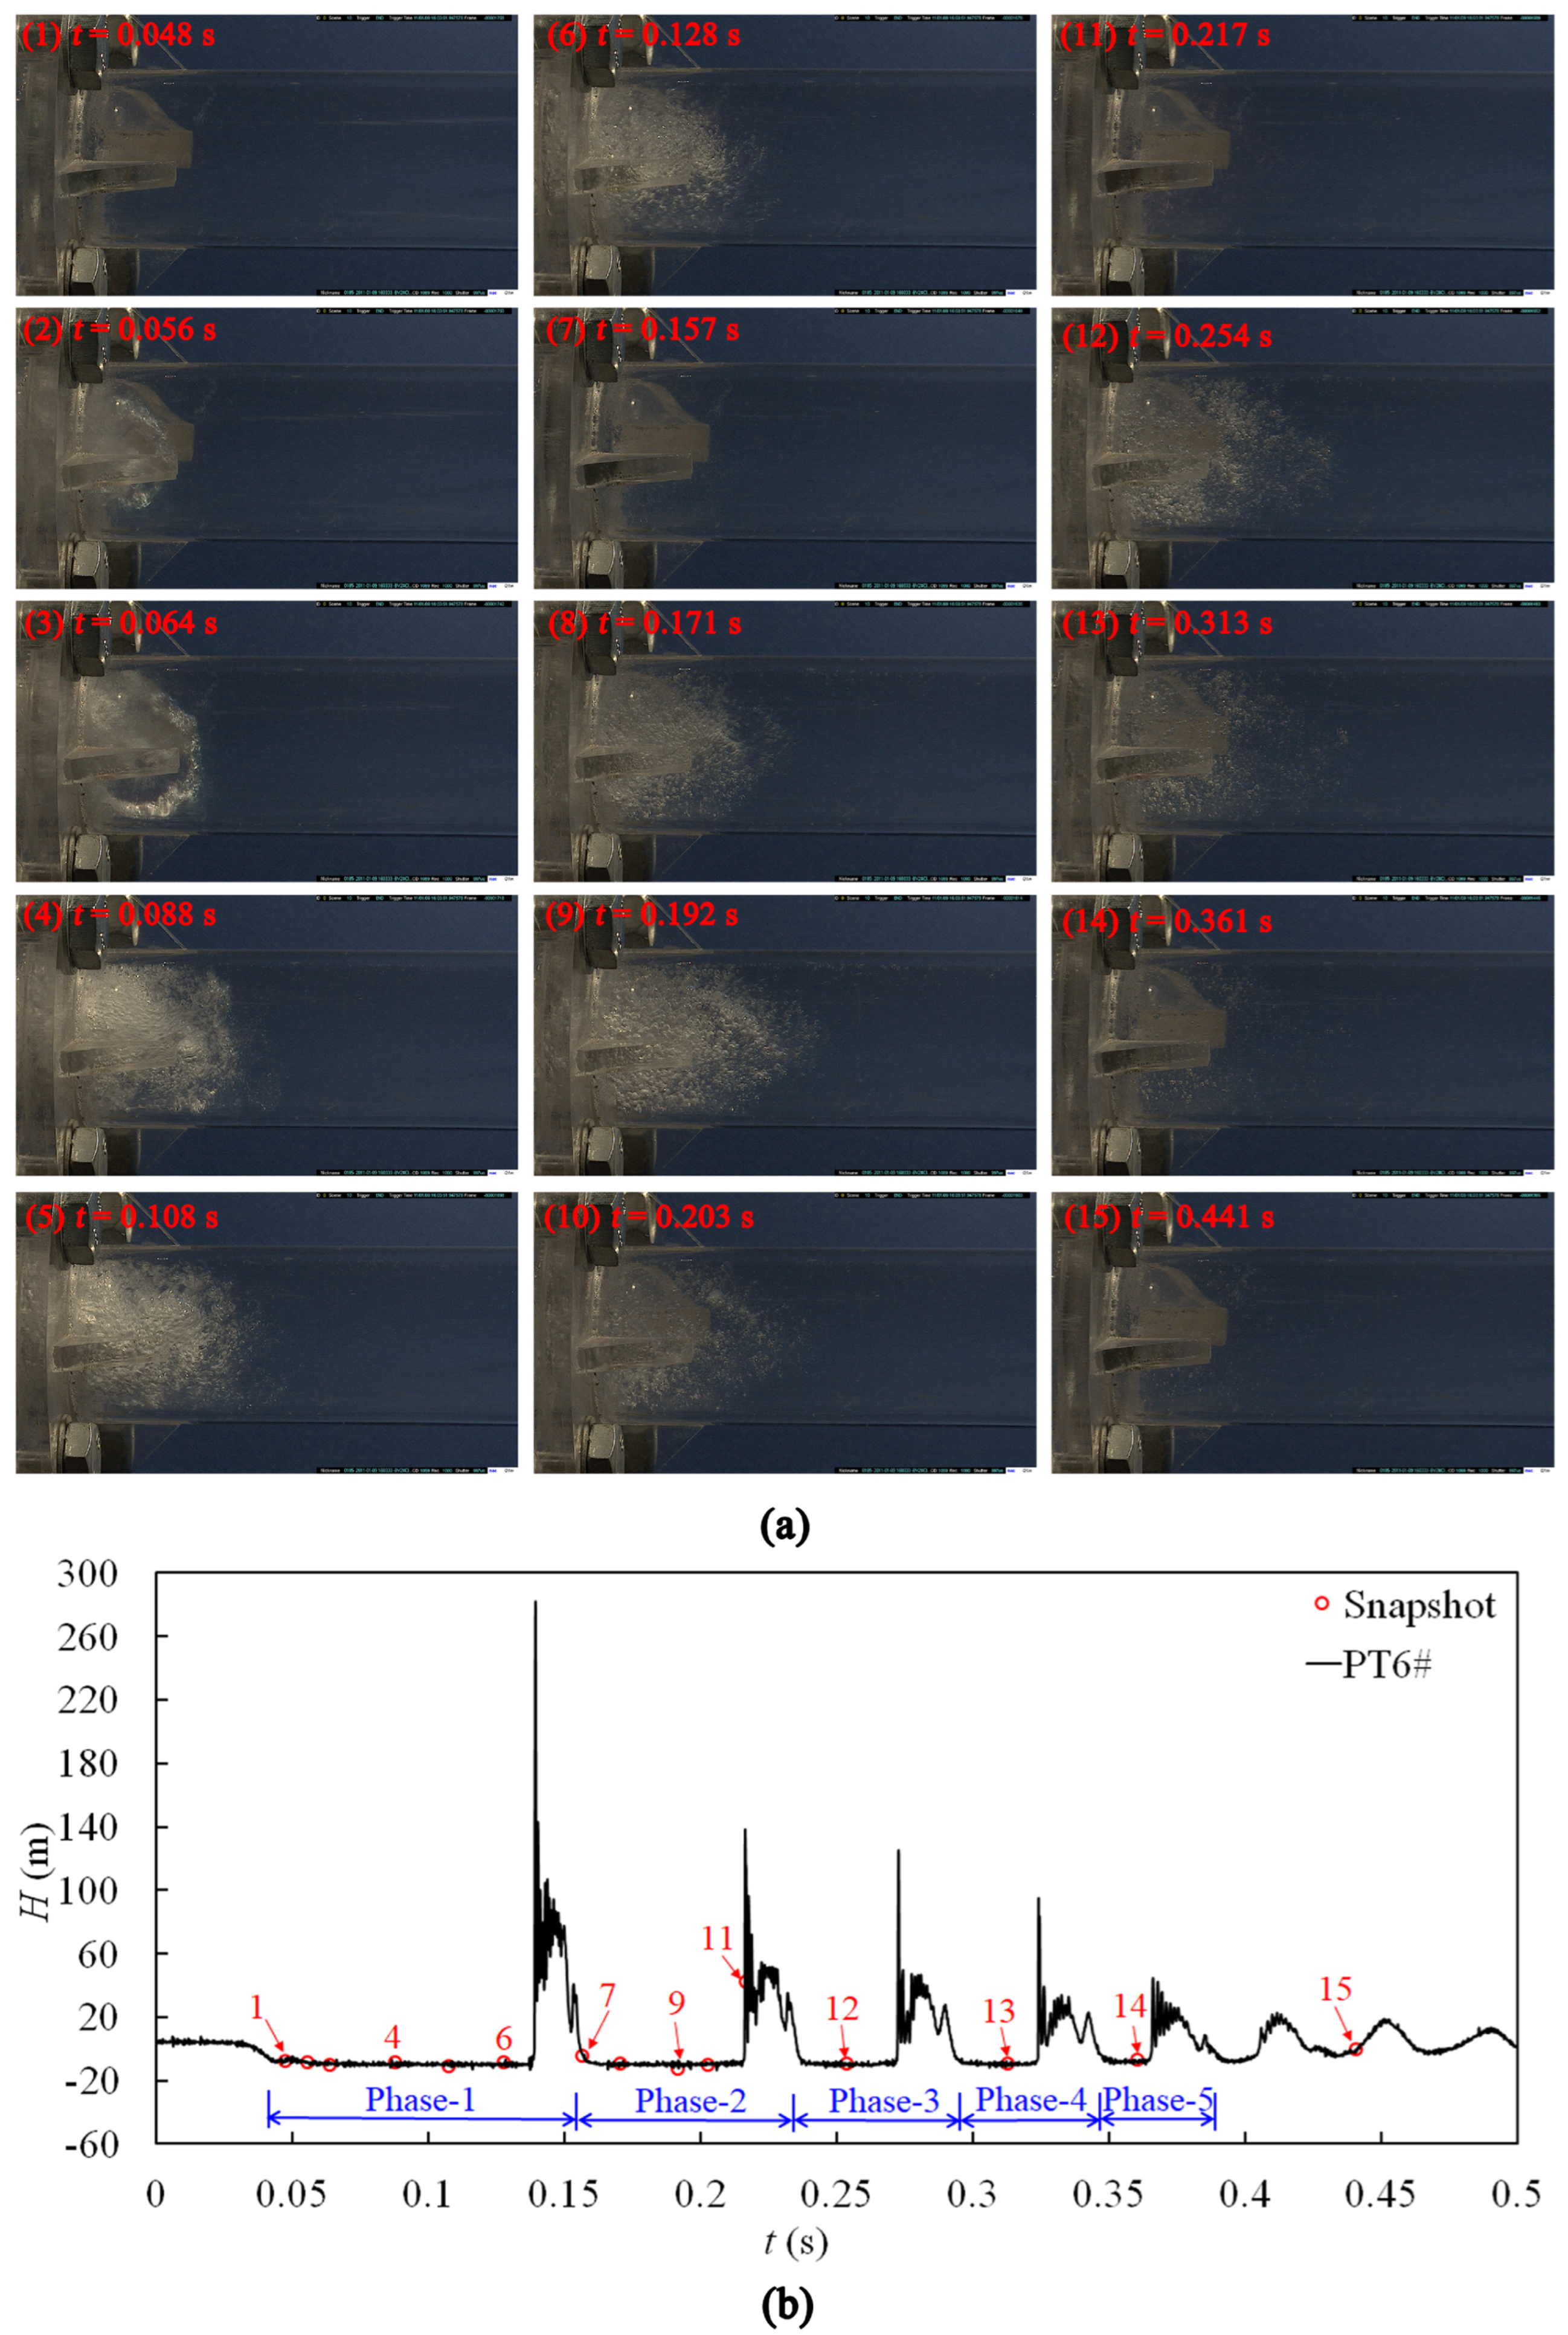
Figure 3 presents a series of photographs and the synchronous pressure variations at PT6# to illustrate the behaviors of column separation in the downstream side during the fast closure of BV2#. The initial steady-state conditions were as follows: HT2 = 3.53 m, V0 = 1.027 m/s, tc = 0.05 s. To facilitate discussion, the pressure oscillation process during one period of the water column’s separation and collapse, named a “Phase”, is shown in Figure 3. It illustrates that there are five episodes of pressure dropping to the vapor pressure level in this test-column separation that occurs five times. According to Figure 3, the sequence of a column separation event is described as follows:
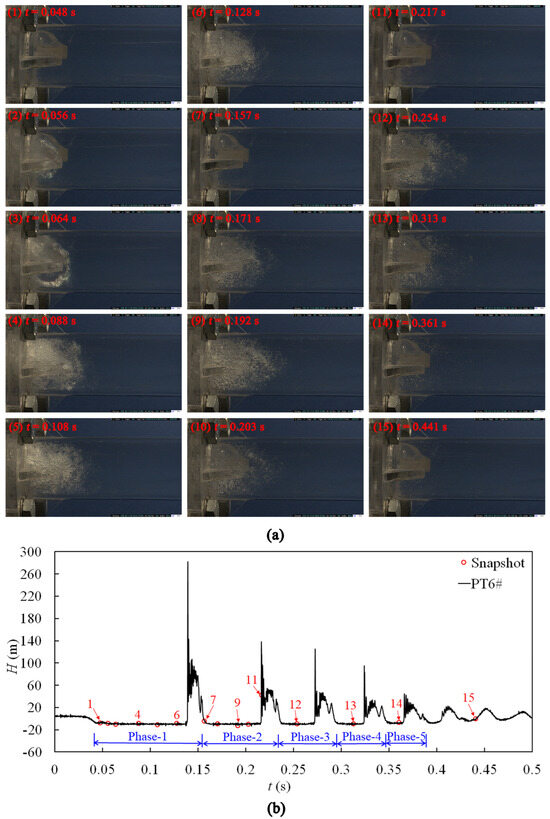
Figure 3.
Cavitation visualization and pressure histories in the case of closing BV2# (HT2 = 3.53 m, V0 = 1.027 m/s): (a) frames of cavitation zones; (b) synchronized pressure history at PT6#.
- (a)
- Closing the valve (t = 0.0–0.05 s): When the static pressure head in each tank reached the target values (here, HT1 = 4.22 m and HT2 = 3.53 m, then V0 = 1.027 m/s), the ball valve began to close (t = 0.0 s). The operation time of the ball valve was 0.05 s. Once the valve action stopped, obvious vibration and movement were observed.
- (b)
- Phase-1 (t = 0.048–0.157 s): The duration of visible cavitation was 0.09 s. Before the valve stopped action, the pressure at PT6# dropped to the vapor pressure level (at t = 0.048 s). Meanwhile, a cavity resembling “white clouds” had already appeared in the position of the pipeline flange, as shown in Frame 1. There was no clear gas–liquid interface for this cavitation structure. Then, the cavity dilated rapidly, and the gas–liquid interface close to PT6# became clear, eventually occupying the entire pipe cross-section, as shown in Frames 2 and 3. At 0.064 s (Frame 3), tiny bubbles appeared at the top of the pipe wall and expanded towards Tank 2#, indicating that a region of vaporous cavitation had formed. After this, the “white clouds” slowed their expansion rate and eventually reached their maximum size at 0.088 s (Frame 4). During this period, the mist cavity structure developed gradually into several little bubbles with clear gas–liquid interfaces. Then, the bubble number density increased quickly and eventually stopped at 0.108 s (Frame 5). Coinciding with the maximum bubble number density, the tiny bubbles in the cavity structure were eliminated gradually, showing a screw-type evolutional path. Following the complete elimination of the vaporous region at the top of the pipe wall (t = 0.128 s, see Frame 6), the number of tiny bubbles in the cavity structure rapidly diminished, while some bubbles gradually developed into a mist structure. All cavities vanished entirely by 0.139 s, and the pressure at PT6# began to rise, almost instantaneously reaching a maximum value of 281.75 m in 0.004 s, which is nearly three times that of the Joukowsky pressure rise. Subsequently, the damped pressure oscillation at PT6# showed high frequency and high amplitude characteristics. In addition, almost immediately after the cavities collapsed, a resounding noise could be heard following obvious pipeline vibration and movement.
- (c)
- Phase-2 (t = 0.157–0.237 s): The duration of visible cavitation was 0.061 s. When t = 0.157 s (Frame 7), a mist cavitation structure appeared throughout the entire pipe, while the pressure at PT6# was slightly larger than the vaporization pressure (it reached Hv in 0.001 s). The “mist” quickly developed into “bubble clouds” composed of large amounts of tiny bubbles with clear gas–liquid interfaces, expanding downstream with a screw-type evolutional path, as shown in Frames 7–9. The maximum length of the cavitation structure, which was longer than the one in Phase-1, was reached at 0.181 s (Frame 9). Compared with Phase-1, the tiny bubble number density in Phase-2 was lower, and the vaporous region at the top of the pipe wall in the shooting area was more obvious. Then, the front of the “bubble clouds” turned to “mist”, backing up towards BV2#, as shown in Frame 10. Unlike Phase-1, repeated transformations from “mist” to “bubble clouds” could be observed. The transformation process stopped at t = 0.216 s, and the cavitation in the shooting area eventually presented in the form of mist. At 0.0004 s, the pressure at PT6# reached its the maximum, albeit lower than that of Phase-1. Importantly, a small amount of mist structure could be observed even though the pressure at PT6# was larger than that in Hv, as shown in Frame 11 (t = 0.217 s). This structure flickered with the oscillations in pressure. This may have been the result of the release of gases dissolved in water, which would also explain the decrease in wave speed in Phase-2.
- (d)
- Subsequent phases: The durations of visible cavitation for Phase-3, Phase-4, and Phase-5 were 0.036 s, 0.031 s, and 0.012 s, respectively. The dynamic behaviors of column separation in Phase-3, Phase-4, and Phase-5 were similar to those in Phase-2. The cavitation structure shapes adjacent to BV2# and reaching maximum size are displayed in Frames 12, 13, and 14, respectively. The amount of gas released in each phase increased as time went on, which reduced the wave speed further.
- (e)
- After Phase-5′s end (t > 0.369 s): The formation, expansion, and contraction of tiny bubbles could be observed in the pipeline several times, even though the pressure at PT6# was larger than that in Hv, as shown in Frame 15. After the pressure oscillations becoming flat, these bubbles moved towards the top of the pipe wall and were eventually suspended at the top wall.
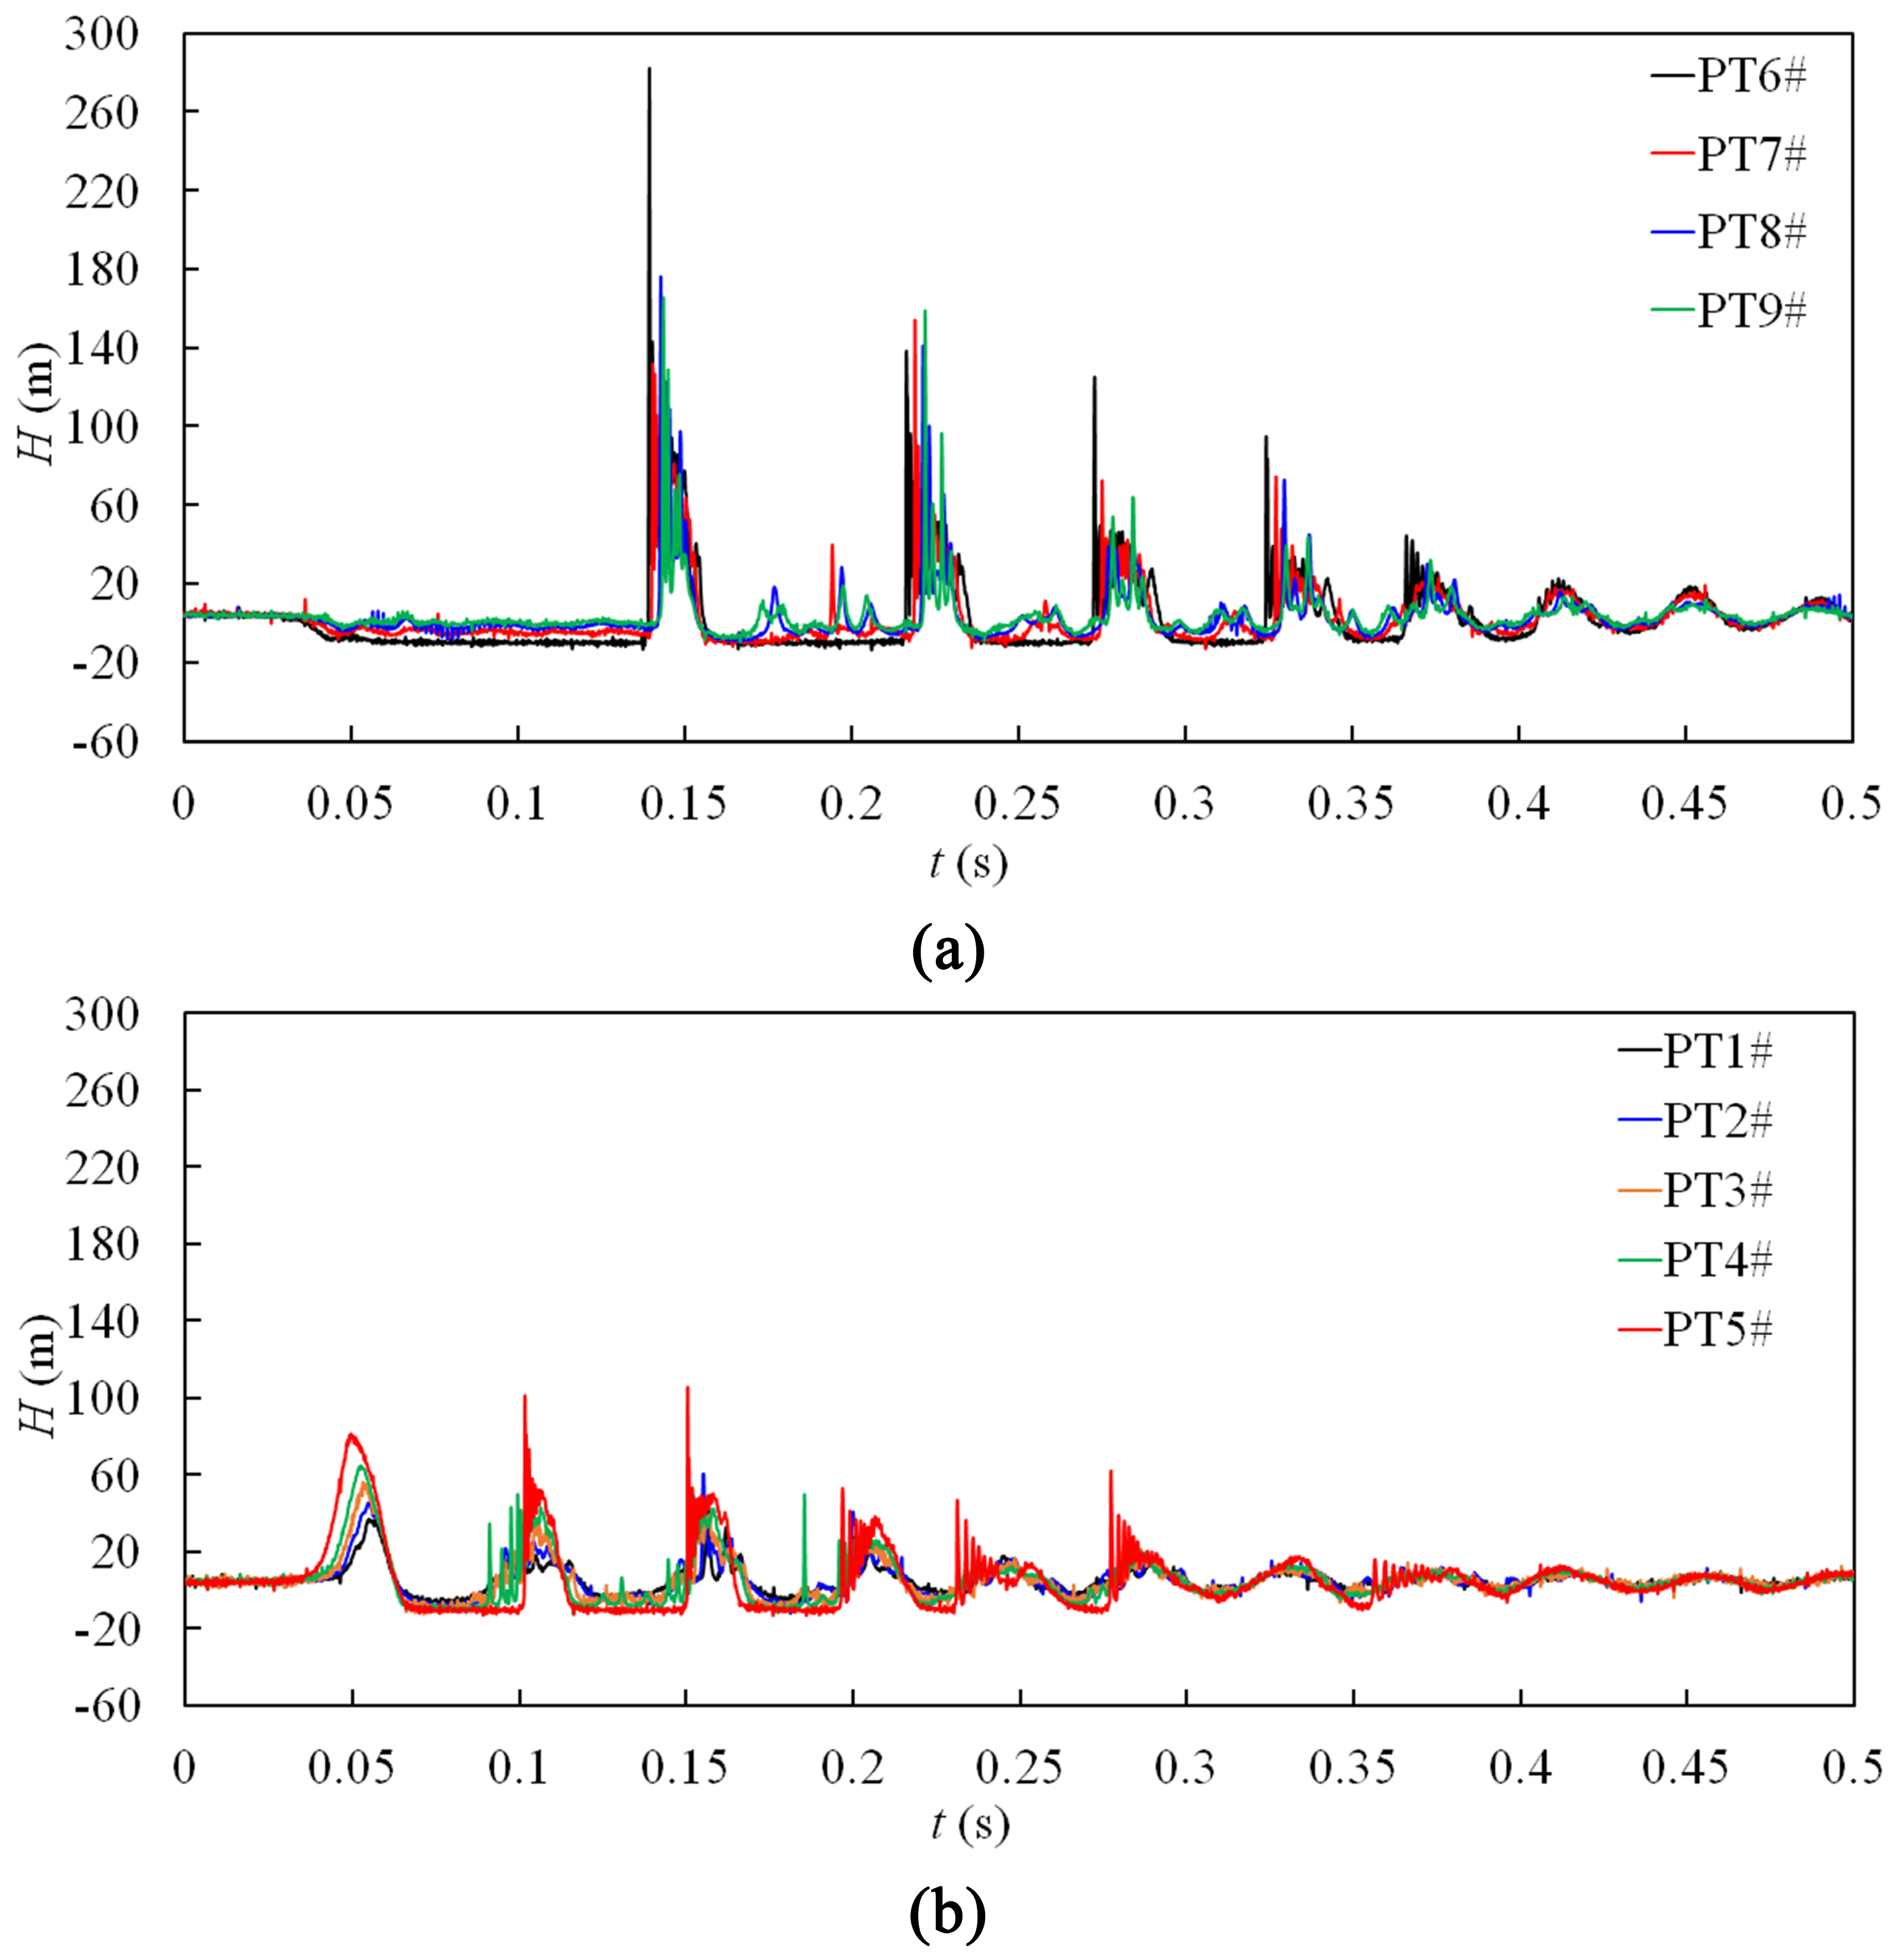
Figure 4 displays the pressure variation over time, which was measured at nine locations (PT1# to PT9#) along the whole pipeline for the test, as shown in Figure 3. As can be seen, column separation occurred at least four times in the upstream side of the pipeline of the closed BV2#. For the pressure variation in the pipeline located on the downstream side of BV2# (Figure 4a), the maximum measured pressure head of 281.75 m occurred in the first phase following the collapse of cavities at the valve. Only the pressures at PT7# and PT8# in Phase-2 and the pressure at PT7# in Phase-3 dropped to the vapor pressure level. This indicates that the vaporous cavitation region expanded to the location of PT8# in Phase-2 and the location of PT7# in Phase-3, which also explains why the bubbles at the top pipe wall in Phase-2 were larger than those in Phase-1, as shown in Frames 3 and 8 in Figure 3. For the pressure variation in the pipeline located on the upstream side of BV2# (Figure 4a), the maximum pressure head of 104.88 m occurred in PT 5# after the second collapse of cavities, accounting for only 37.22% of the maximum pressure in the pipeline system on the downstream side of the closing valve. It should be noted that the shapes of pressure histories at PT5# were similar to the results reported by Mitosek [14].

Figure 4.
Pressure heads along the pipeline for the test in Figure 3: (a) pressures at PT6# to PT9#; (b) pressures at PT1# to PT5#.
3.2. Types of Pressure Oscillation Patterns
During the experimental tests—except for the case shown in Figure 4, where the duration time of column separation decreased sequentially with time and the maximum pipeline pressure (Hmax) followed the first collapse of cavities at the valve—several contrasting instances were frequently observed. These included non-sequential decreases in the duration of column separation with time, and the maximum pipeline pressure occurring at a position away from the valve. As shown in Table 3, four types of pressure oscillation patterns can be defined according to the changing trends of the duration of column separation and the occurrence position of the maximum pipeline pressure. Therefore, the pressure oscillation pattern for the case in Figure 4 belongs to Type 1. Figure 5 and Figure 6, respectively, present examples of three other types in the cases of BV2# and BV1# closure valves.
Table 3.
Pressure oscillation patterns for column separation in the experimental tests.
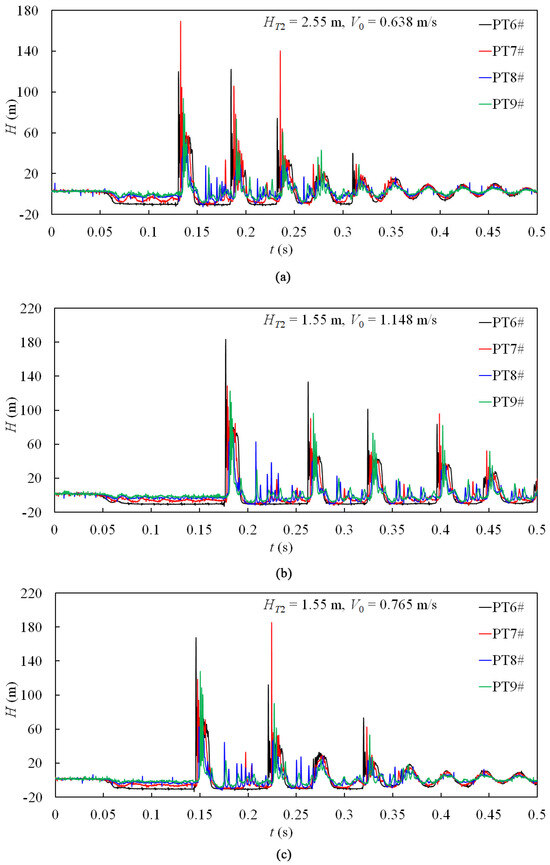
Figure 5.
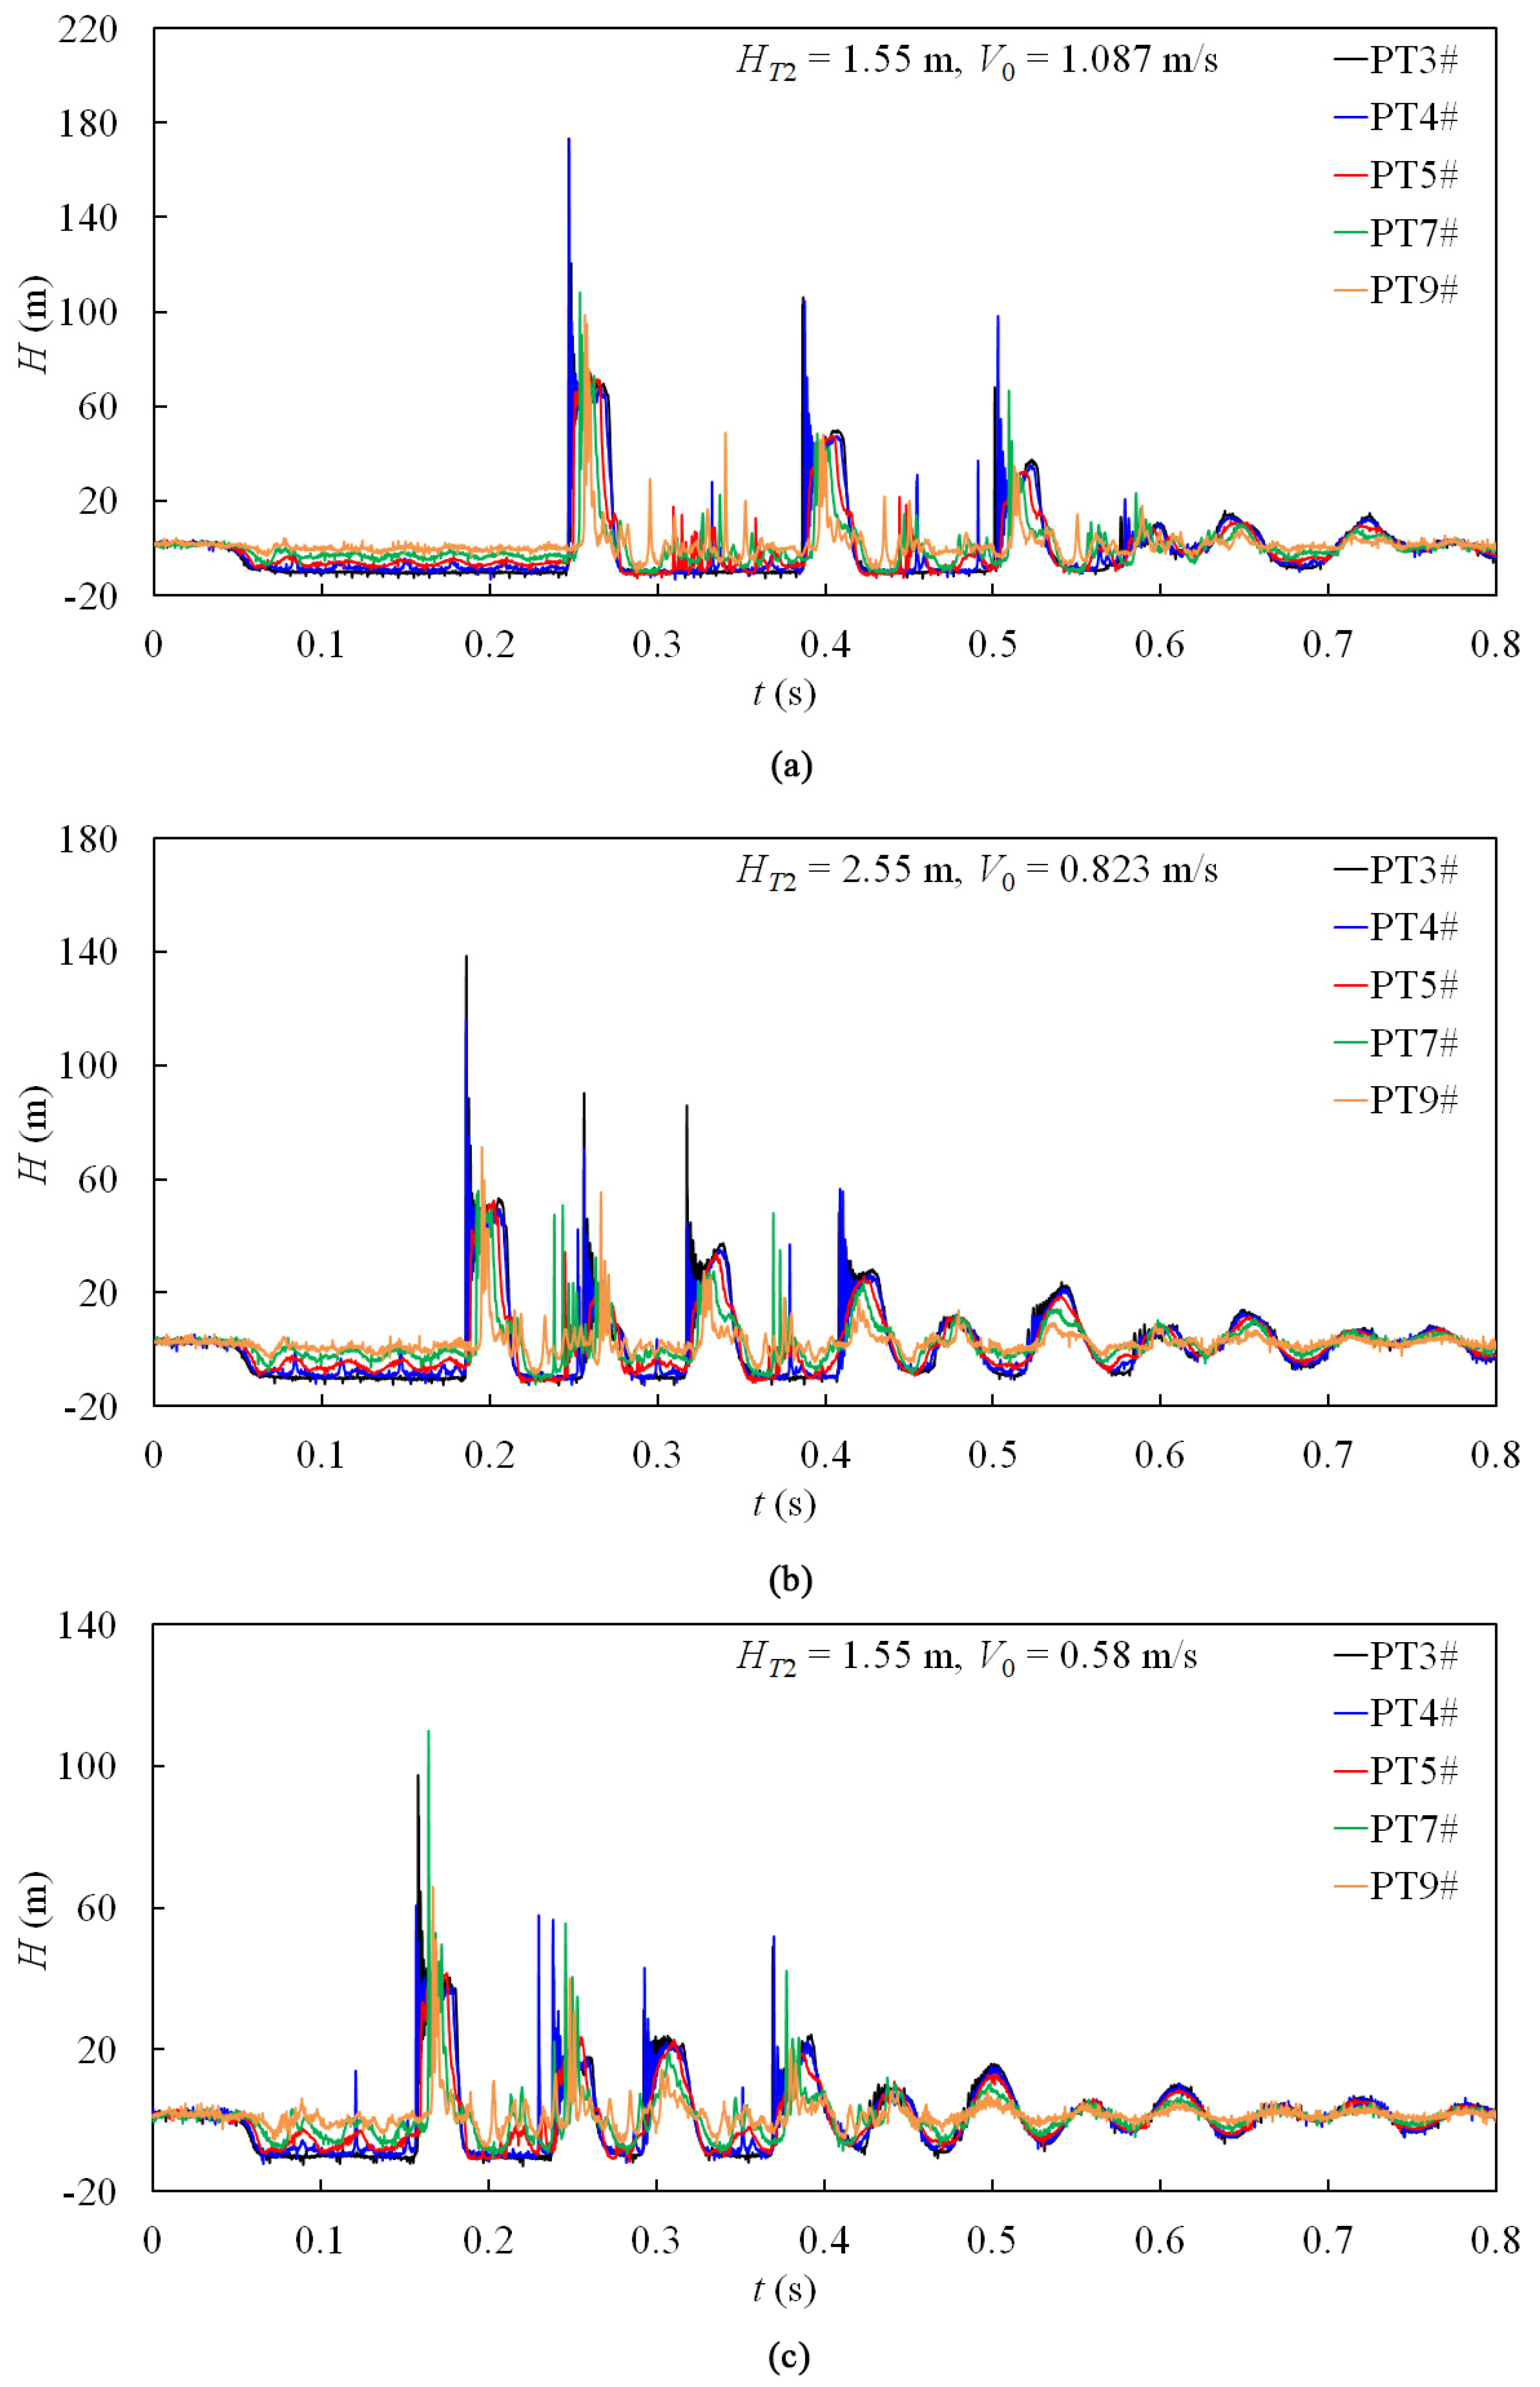
Pressure oscillation patterns for column separation on the downstream side of BV2#: (a) Type 2; (b) Type 3; (c) Type 4.
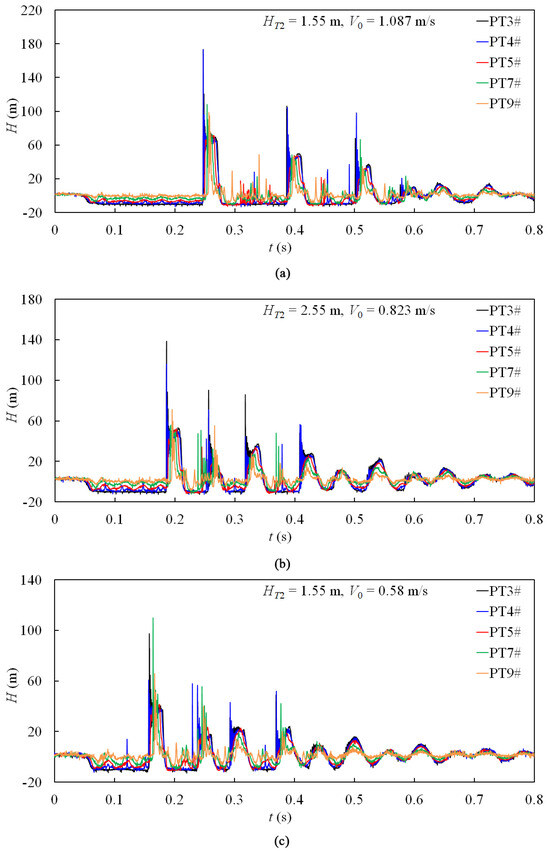
Figure 6.
Pressure oscillation patterns for column separation on the downstream side of BV1#: (a) Type 2; (b) Type 3; (c) Type 4.
The position and timing of the maximum pipeline pressure is uncertain, as depicted in Figure 5 and Figure 6, and it does not always coincide with the collapse of cavities. In Figure 5a, a maximum pressure of 167.17 m (30.9% higher than the maximum value at PT6#) occurs at PT7# during Phase-1, where no cavities formed due to sustained pressure above the vapor pressure before Hmax appeared. This could be attributed to the interaction between the pressure waves resulting from valve closure and the collapse of cavities adjacent to the valve and the stress wave caused by the pipeline’s movement. Similarly, in Phase-1 of the Figure 6a test, Hmax was observed at PT4# (1.2% higher than the maximum pressure at PT3#), while in the test displayed in Figure 6c, it occurred at PT7# (12.3% higher than the maximum pressure at PT3#). However, in the case of Figure 5c, Hmax occurred at PT7# (11% higher than the maximum pressure at PT6#) during Phase-2, in which the pressure at PT7# decreased to the vapor level for approximately 0.021 s, indicating possible cavity formation at this position. The resulting wave from the collapse of cavities at PT7# may have further contributed to the interaction effect observed here.
The duration of cavities near the valve during Phase-4 for the tests shown in Figure 5b,c and Figure 6b,c was longer compared to that observed during Phase-3 with proportions being recorded as follows: 17.6%, 51.3%, 26.8%, and 101.1%, respectively. This complex interaction between the water hammer wave, collapse wave of cavities, and stress wave induced by pipeline movement likely serves as a principal contributing factor.
3.3. Influence of Quantities on Column Separation Events
3.3.1. Effect of Initial Flow Velocity
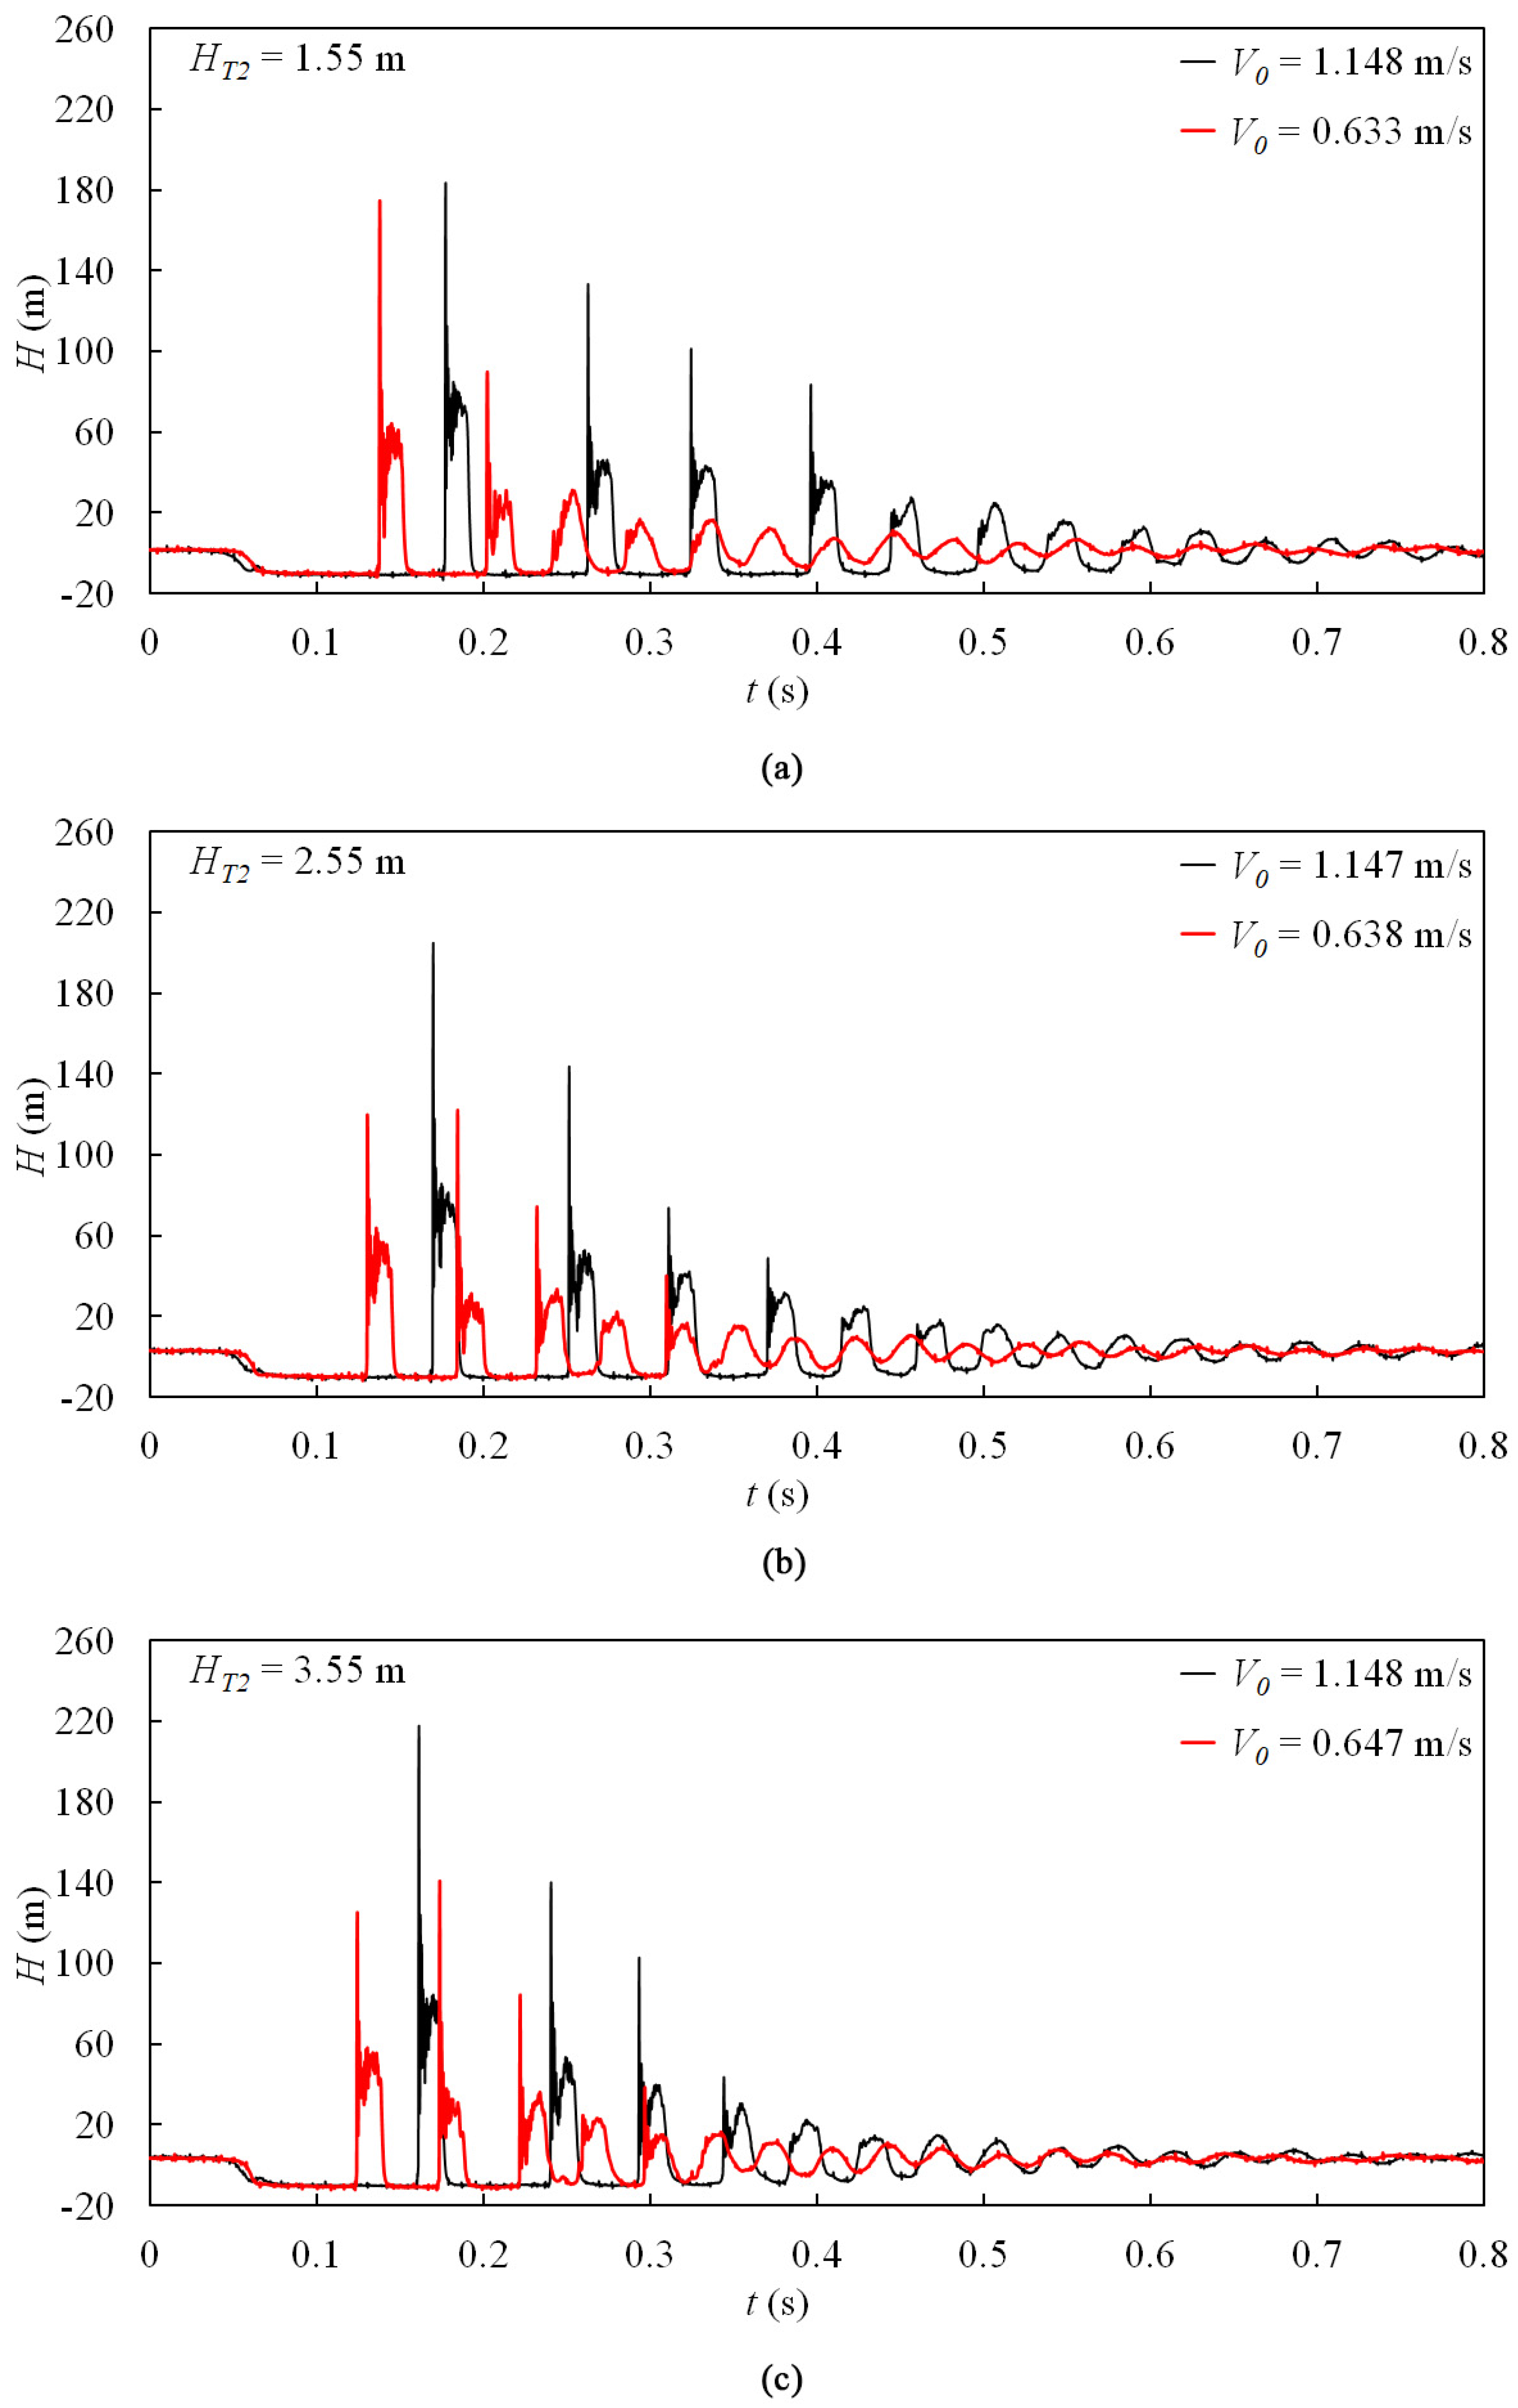
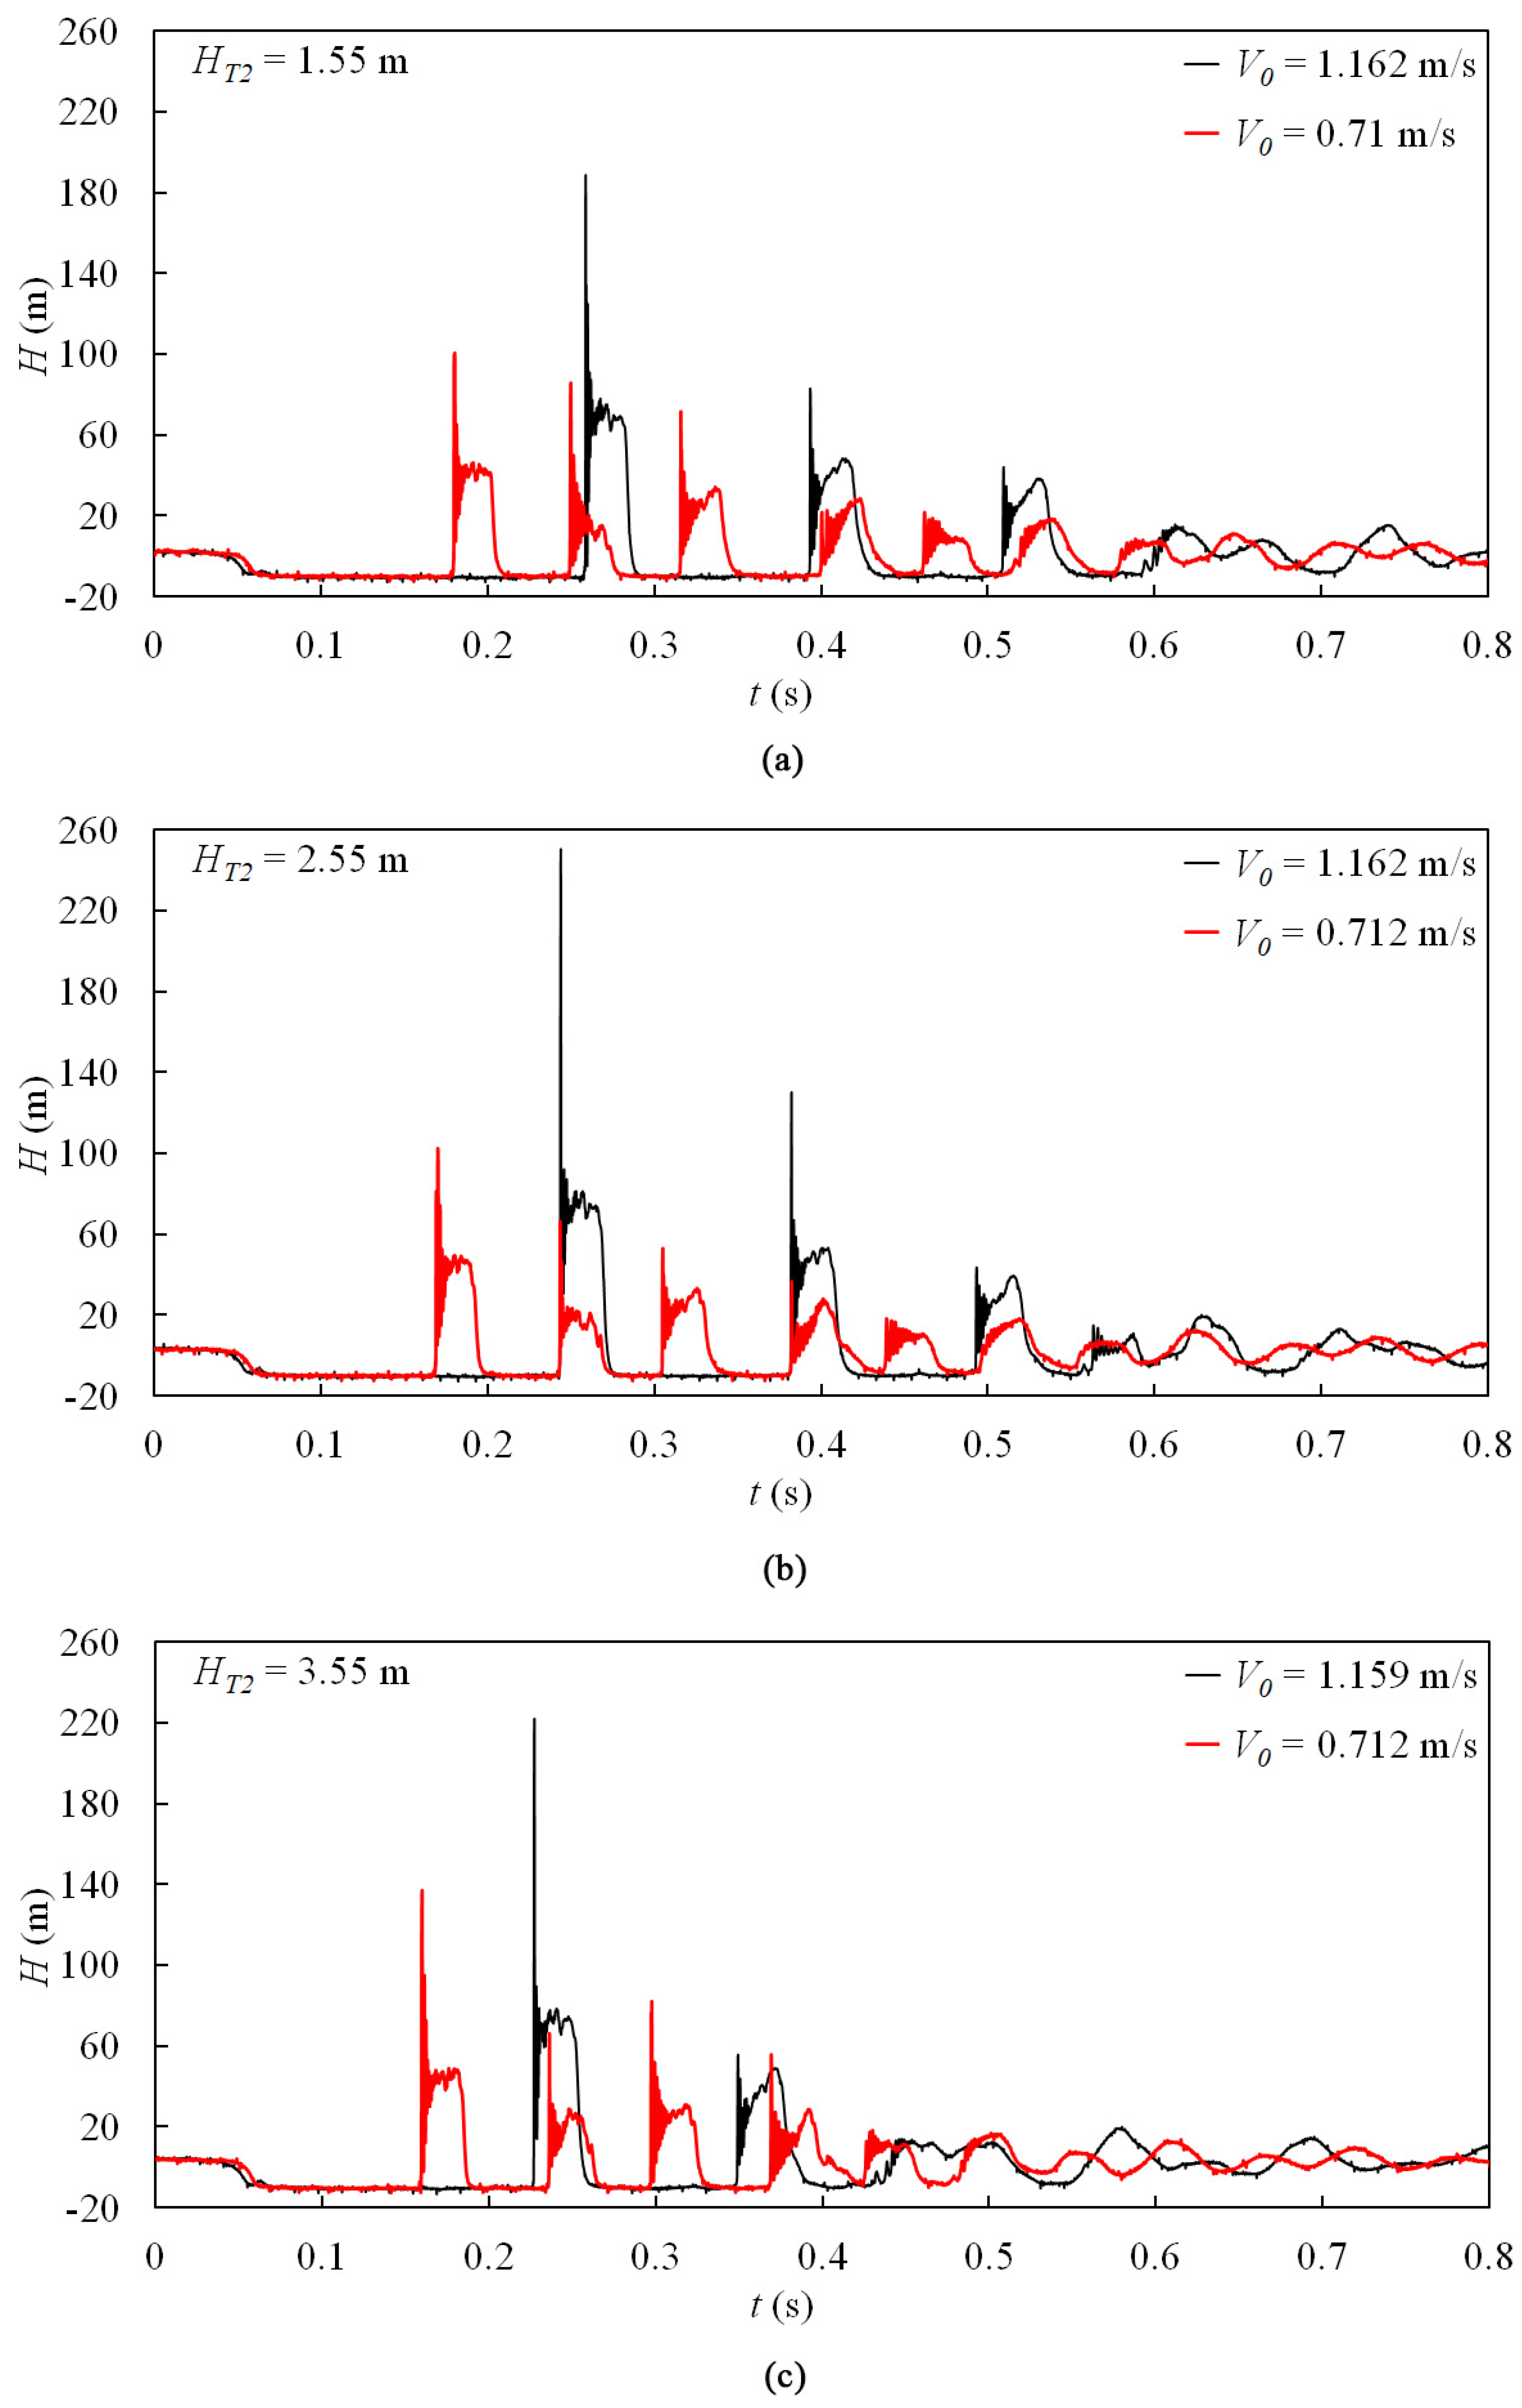
The pressure measurements at PT6# (BV2# closure) and PT3# (BV1# closure) for two initial flow velocities and three static heads at Tank 2# are presented in Figure 7 and Figure 8, respectively. With a constant downstream reservoir static head, both the duration of column separation and the instantaneous pressure rise following cavity collapse increased as the initial flow velocity increased. However, the location of maximum pipeline pressure may not be near the valve. For the test conditions of HT2 = 2.55 m and V0 = 0.638 m/s presented in Figure 7b and Figure 5a, for instance, Hmax occurred at PT7# at a proportion 30.9% higher than the maximum value at PT6#. The type of pressure oscillation pattern evolved from cases where the duration of column separation decreased non-sequentially with time (i.e., Type 3 or 4) to cases in which the duration of column separation decreased sequentially with time (i.e., Type 1 or 2).
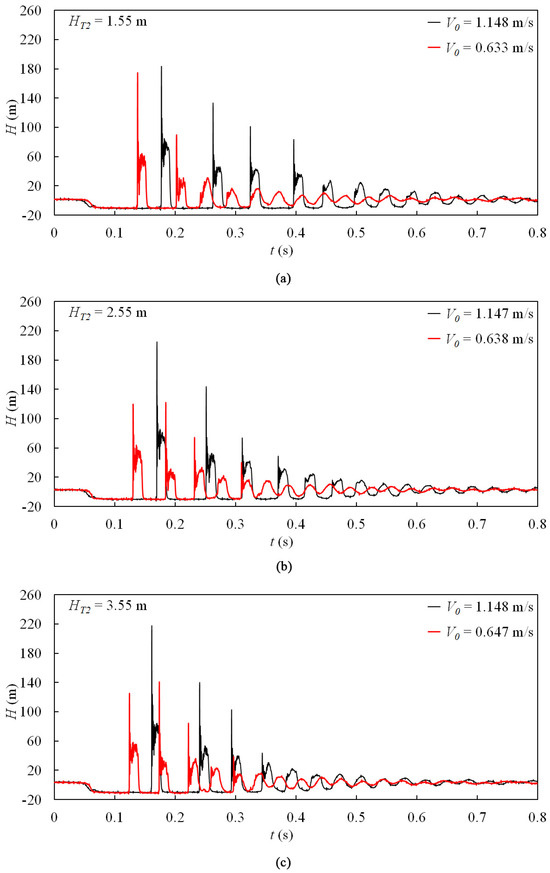
Figure 7.
Measured pressure head at PT6# in the case of closing BV2# for different initial flow velocities: (a) HT2 = 1.55 m; (b) HT2 = 2.55 m; (c) HT2 = 3.55 m.
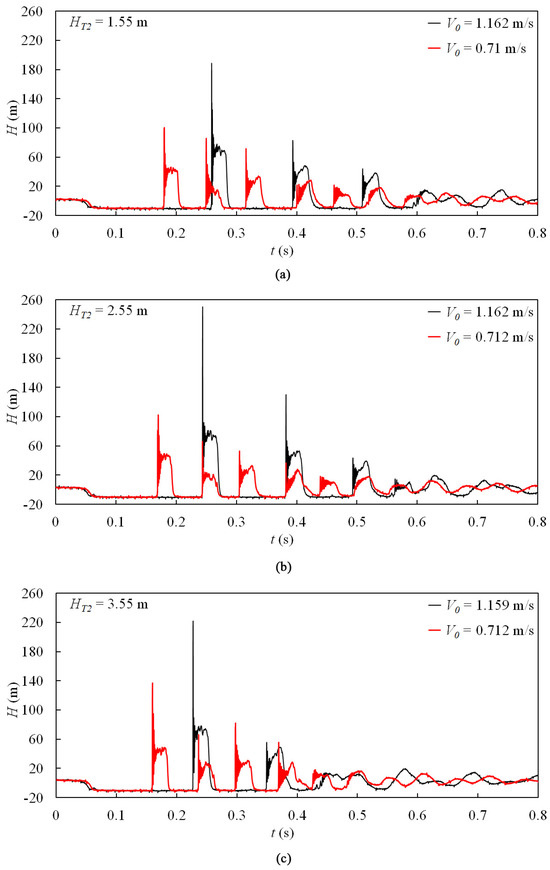
Figure 8.
Measured pressure head at PT3# in the case of closing BV1# for different initial flow velocities: (a) HT2 = 1.55 m; (b) HT2 = 2.55 m; (c) HT2 = 3.55 m.
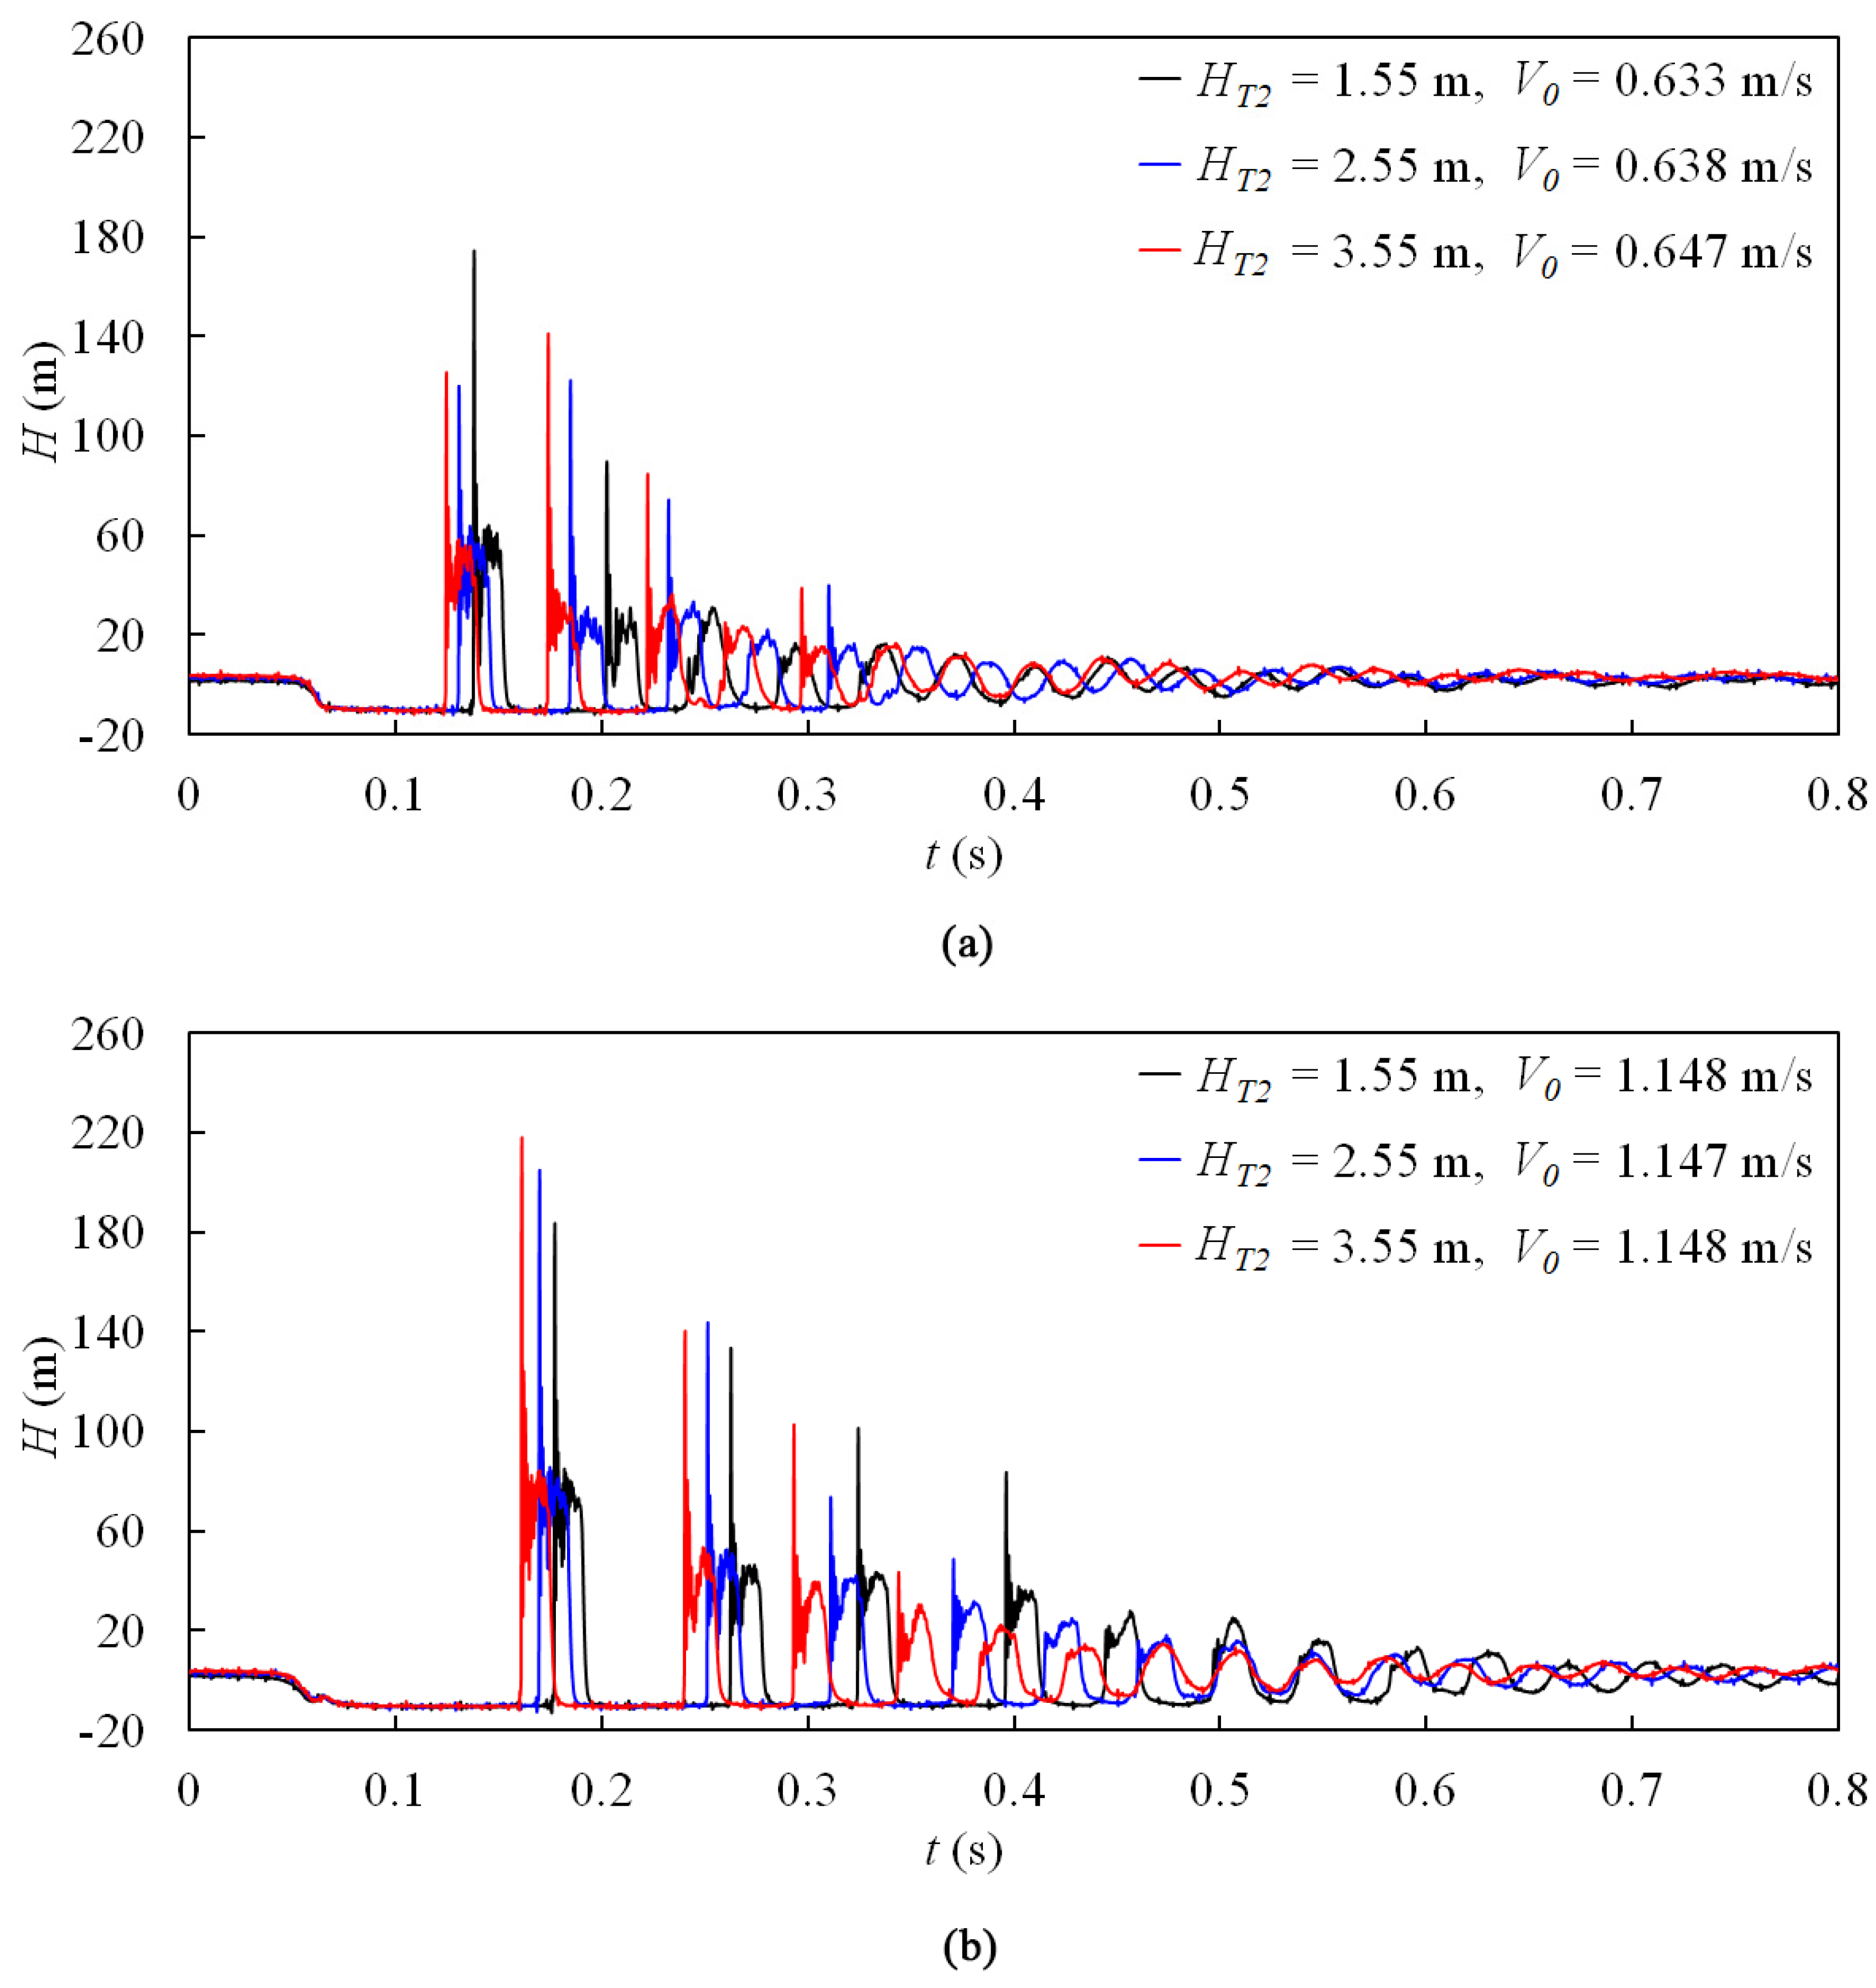
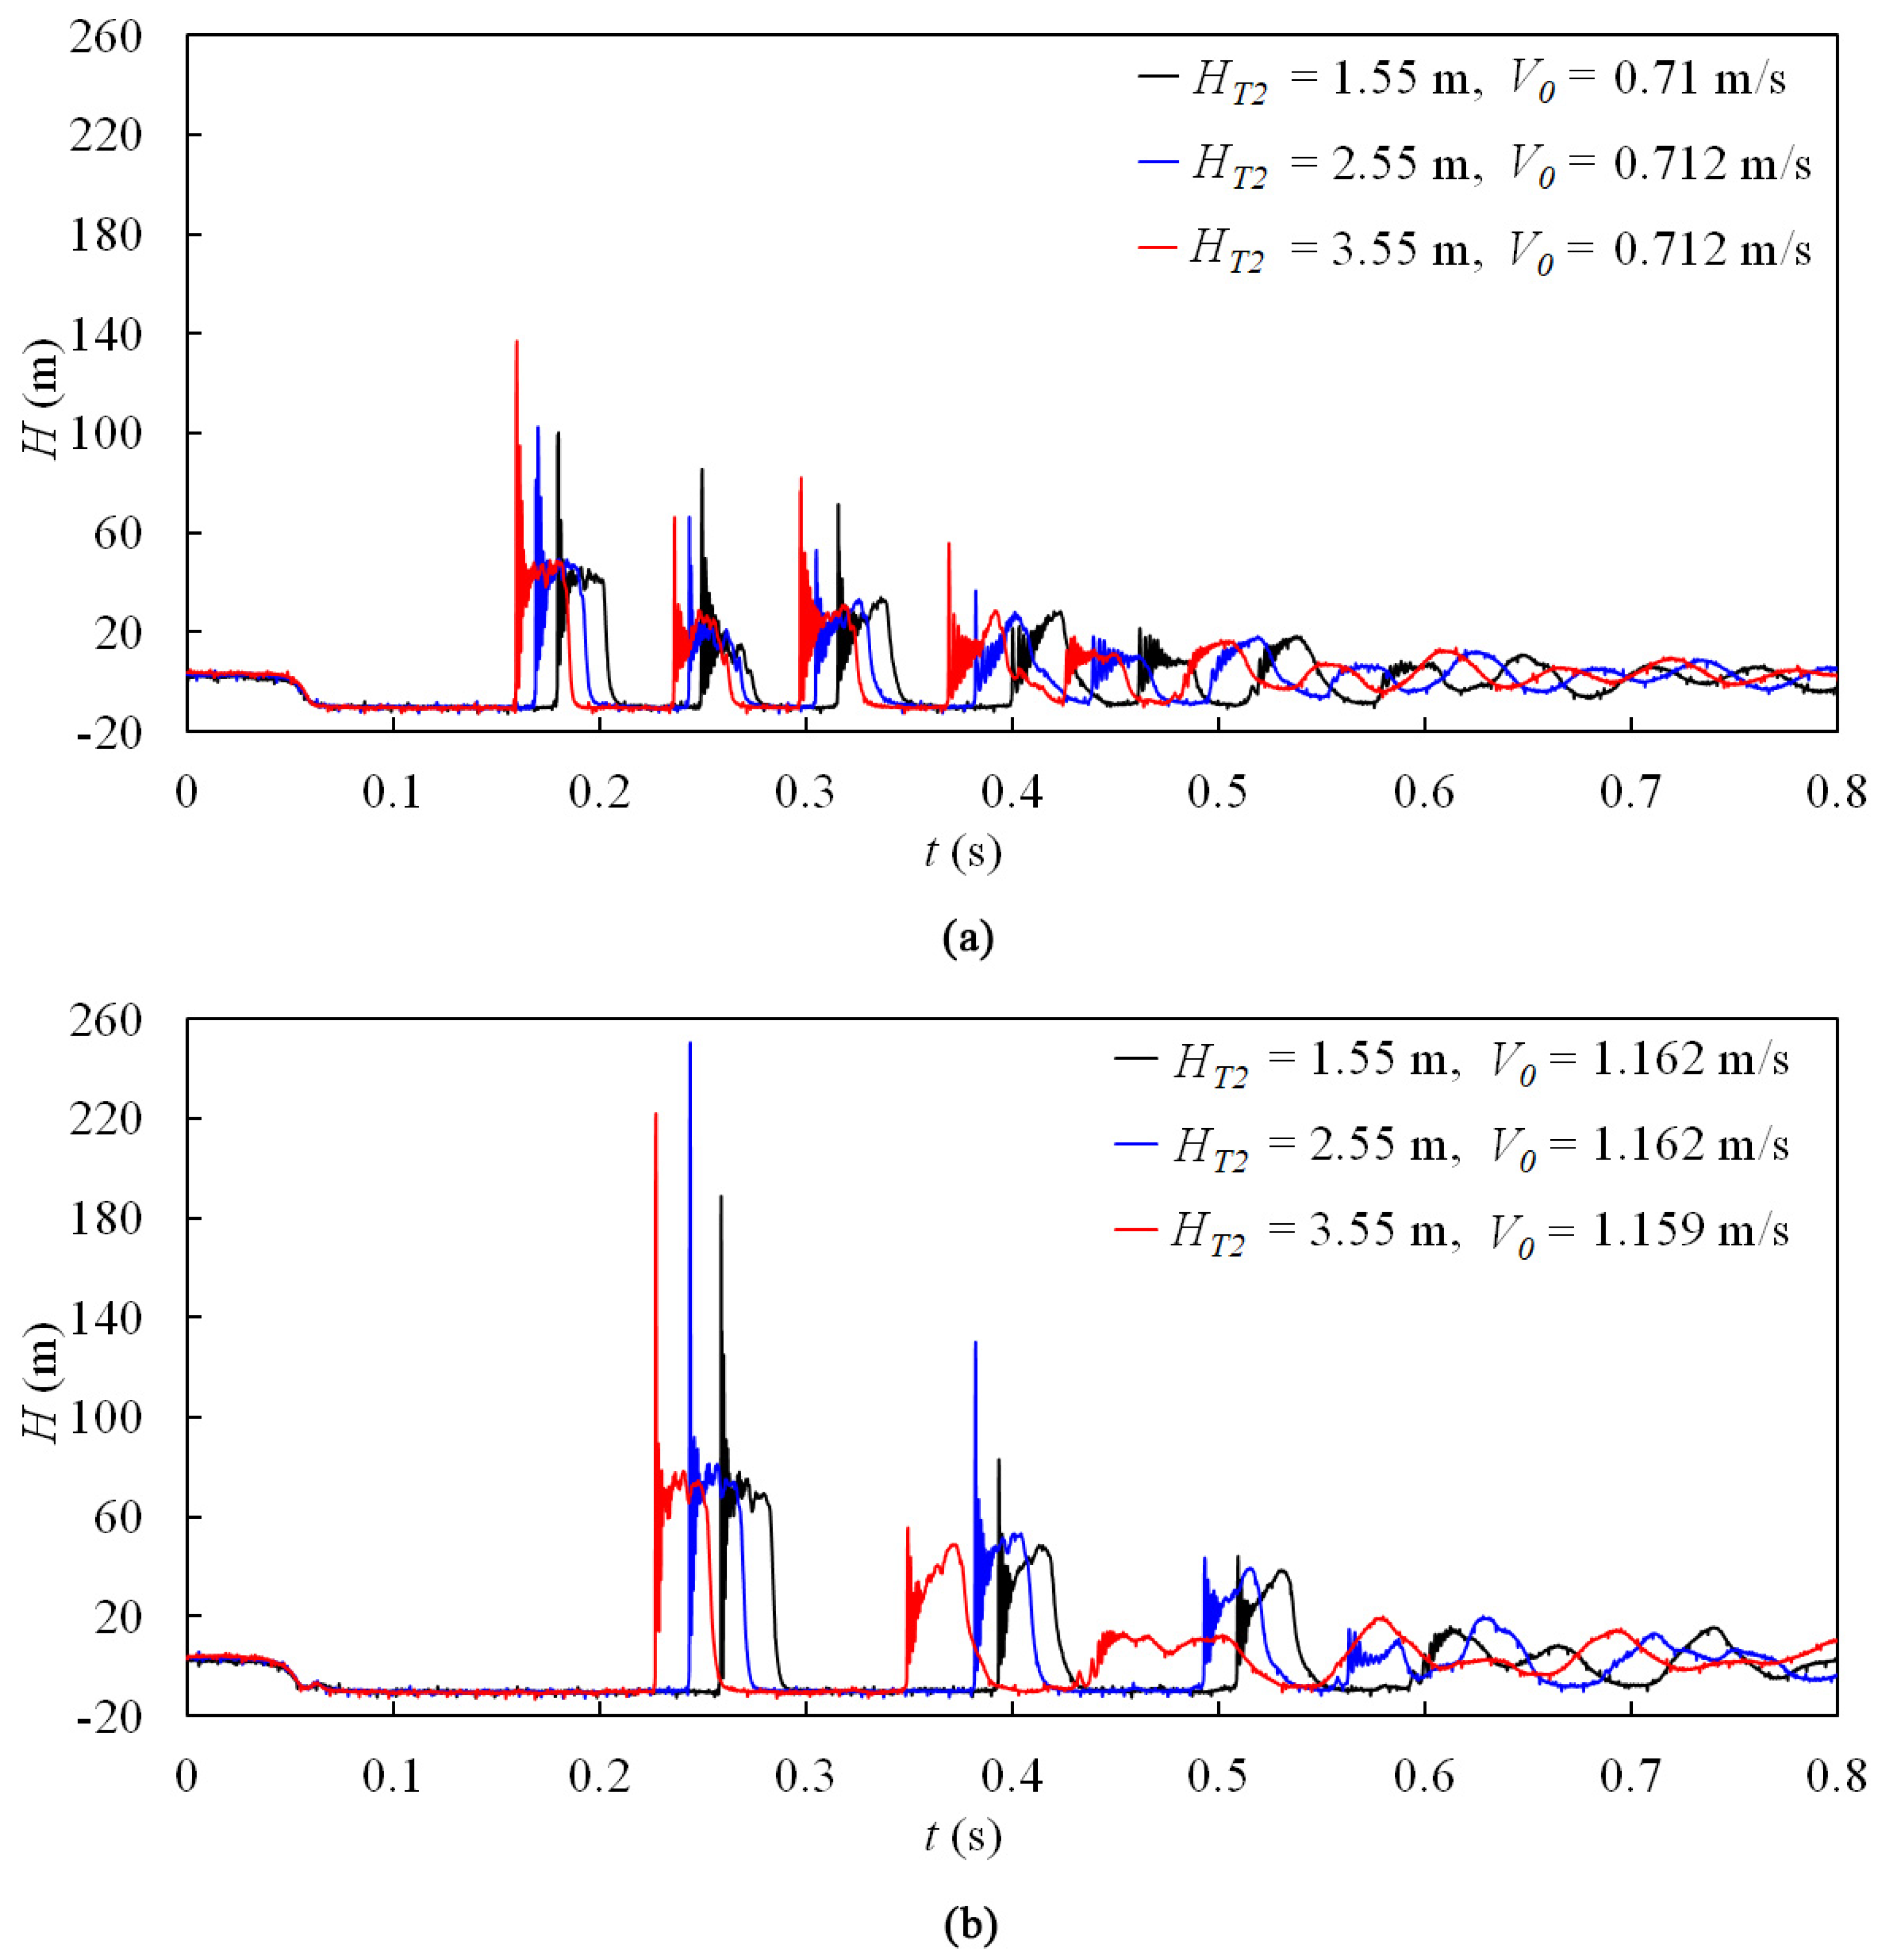
3.3.2. Effect of Reservoir Static Heads
The pressure histories at PT6# (BV2# closure) and PT3# (BV1# closure) for three different reservoir static heads with similar initial flow velocities are compared in Figure 9 and Figure 10, respectively. For conditions with similar initial flow velocities, the lower HT2 resulted in more severe column separation, but it was not necessarily the same for the pressure in the valve (Figure 9b and Figure 10). Additionally, under these conditions, there was little influence on the types of pressure oscillation patterns due to changes in reservoir static head.
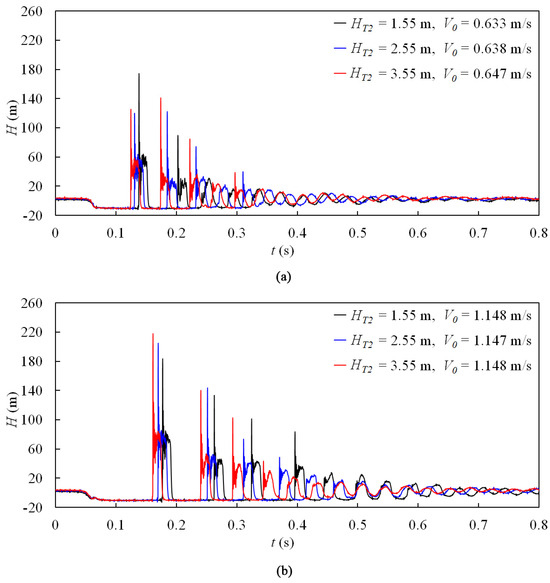
Figure 9.
Measured pressure head at PT6# in the case of closing BV2# for different reservoir static heads: (a) V0 ≈ 0.64 m/s; (b) V0 ≈ 1.15 m/s.
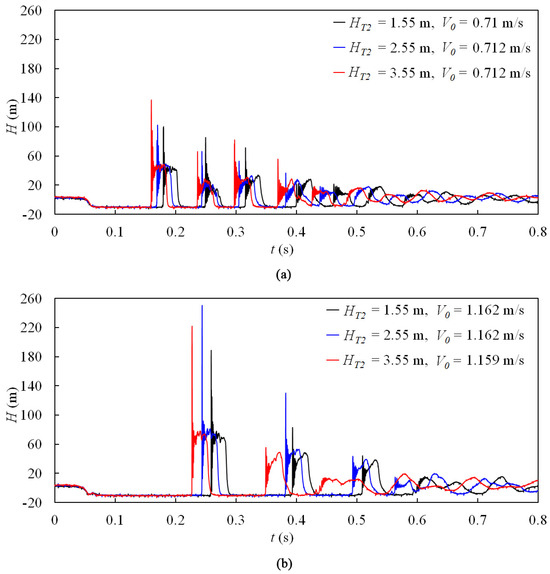
Figure 10.
Measured pressure head at PT3# in the case of closing BV1# for different reservoir static heads: (a) V0 ≈ 0.71 m/s; (b) V0 ≈ 1.16 m/s.
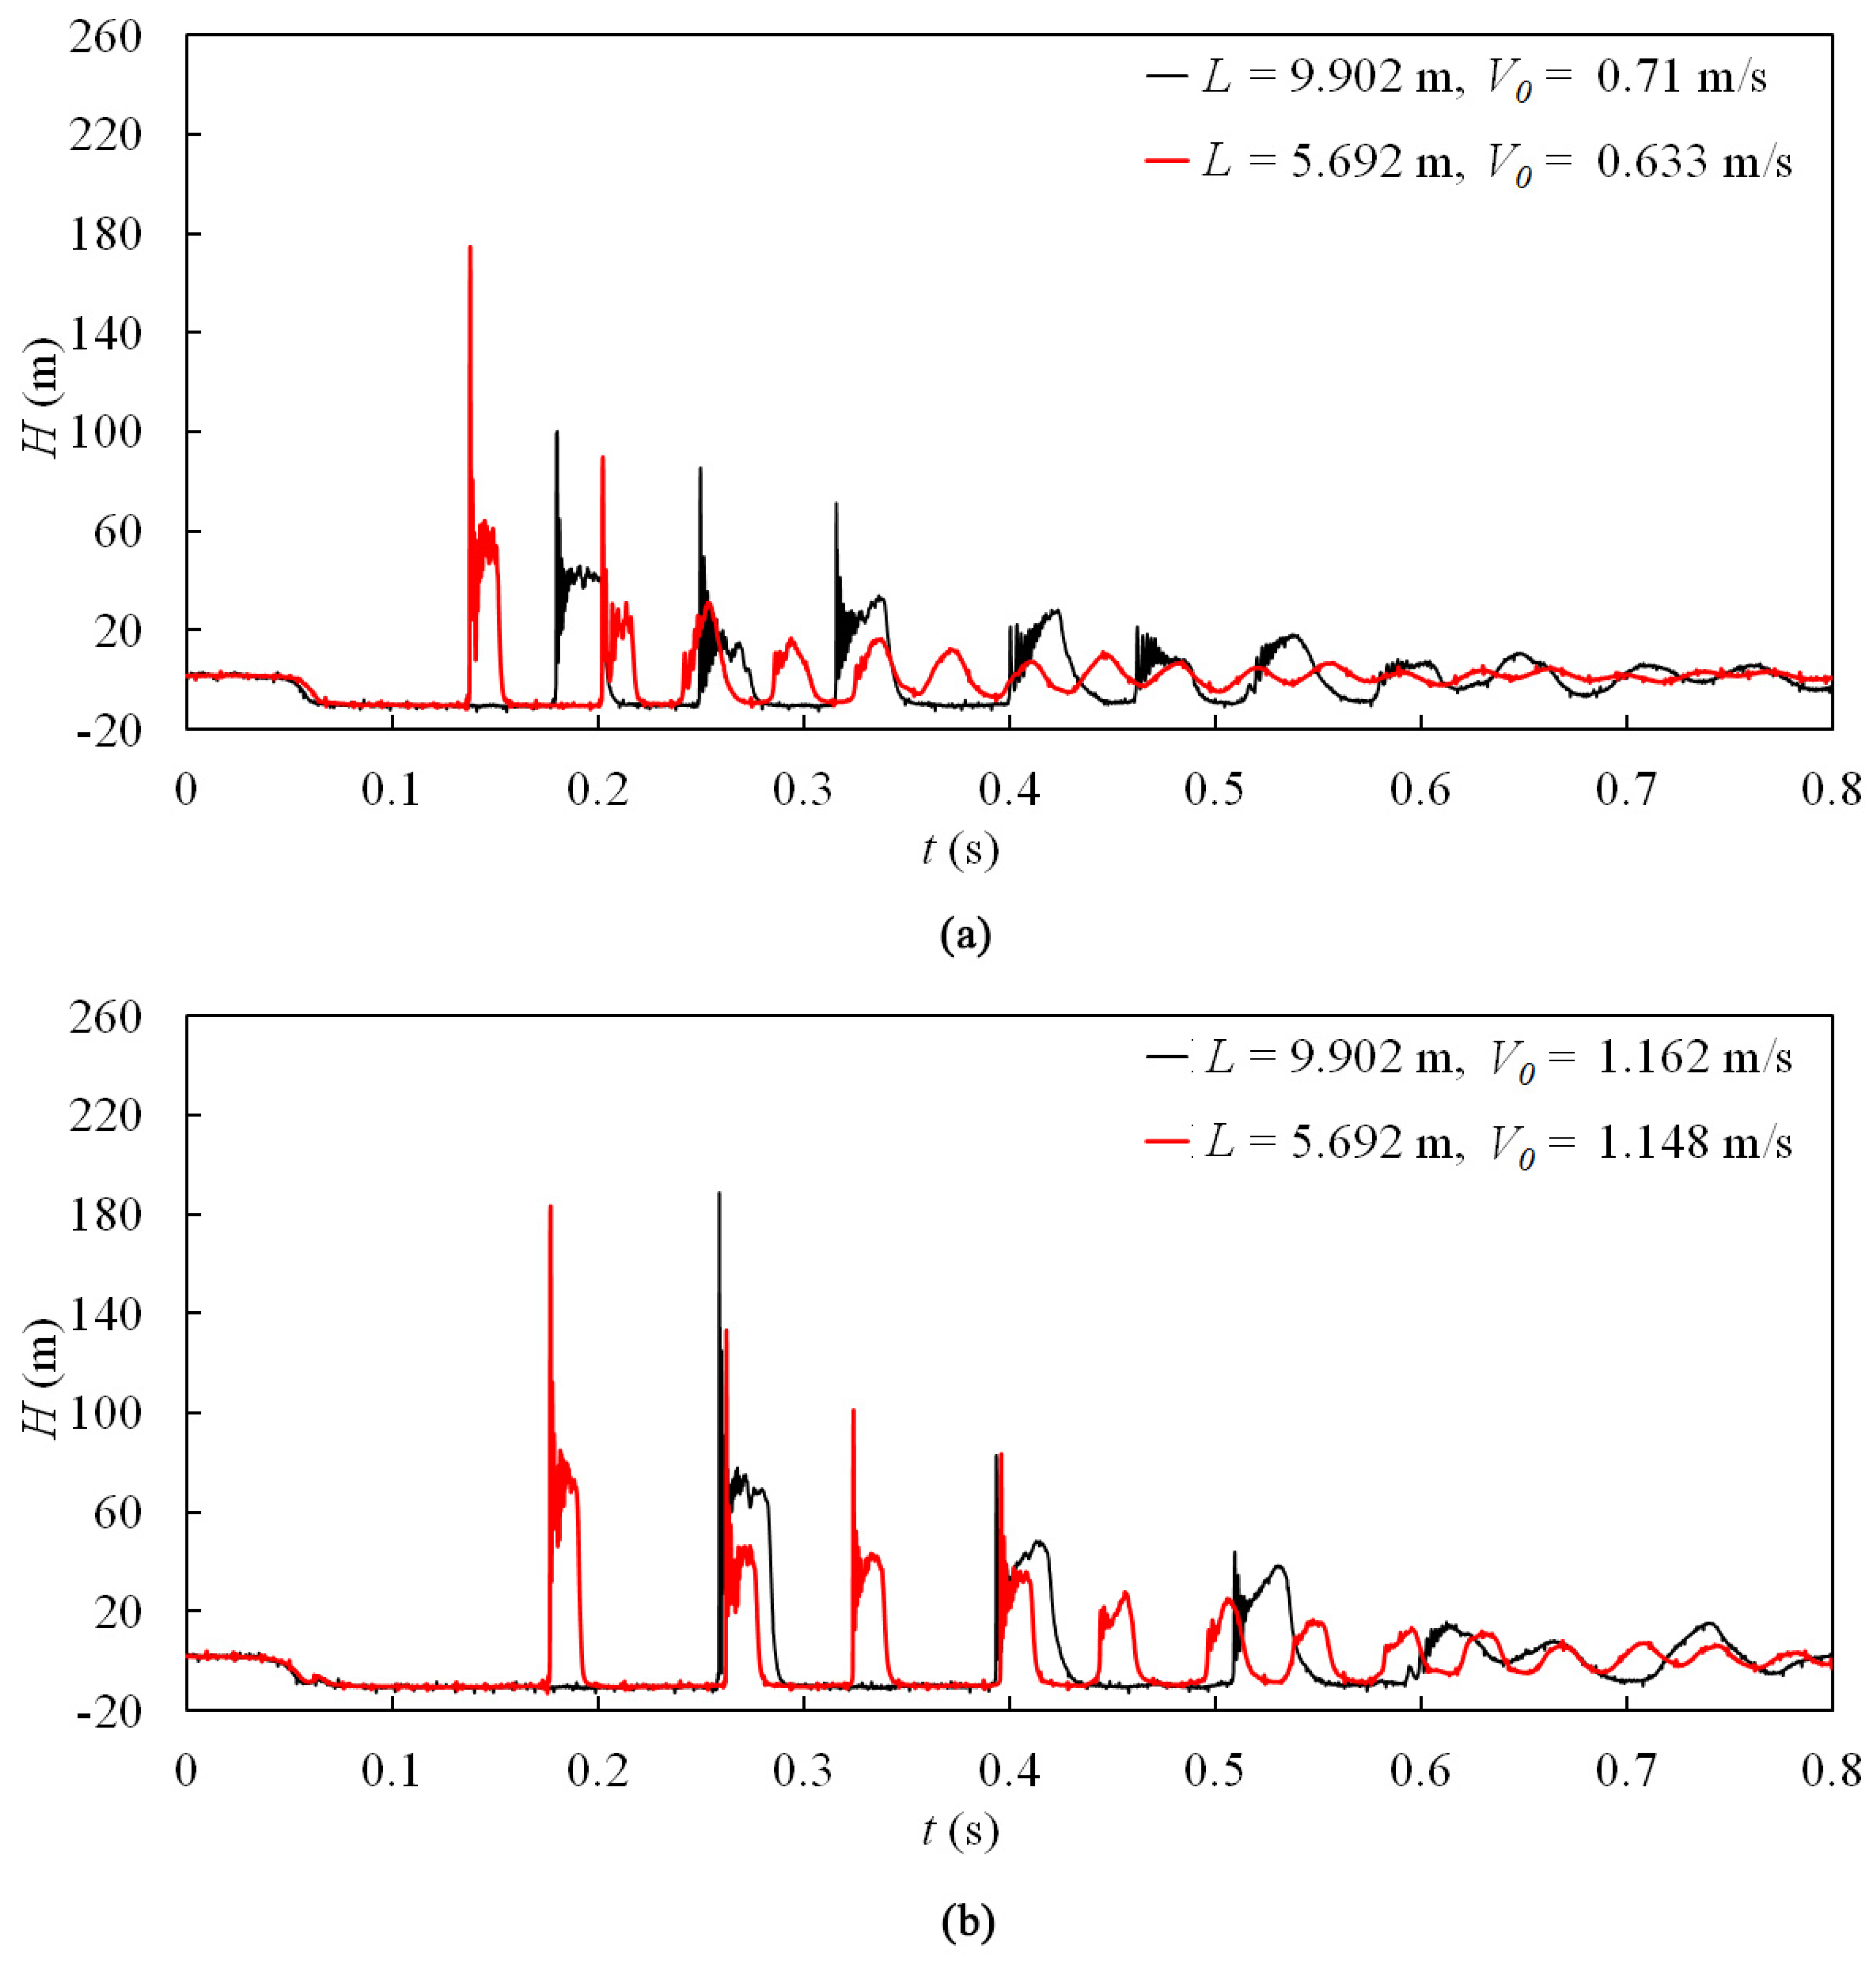
3.3.3. Effect of Pipe Length
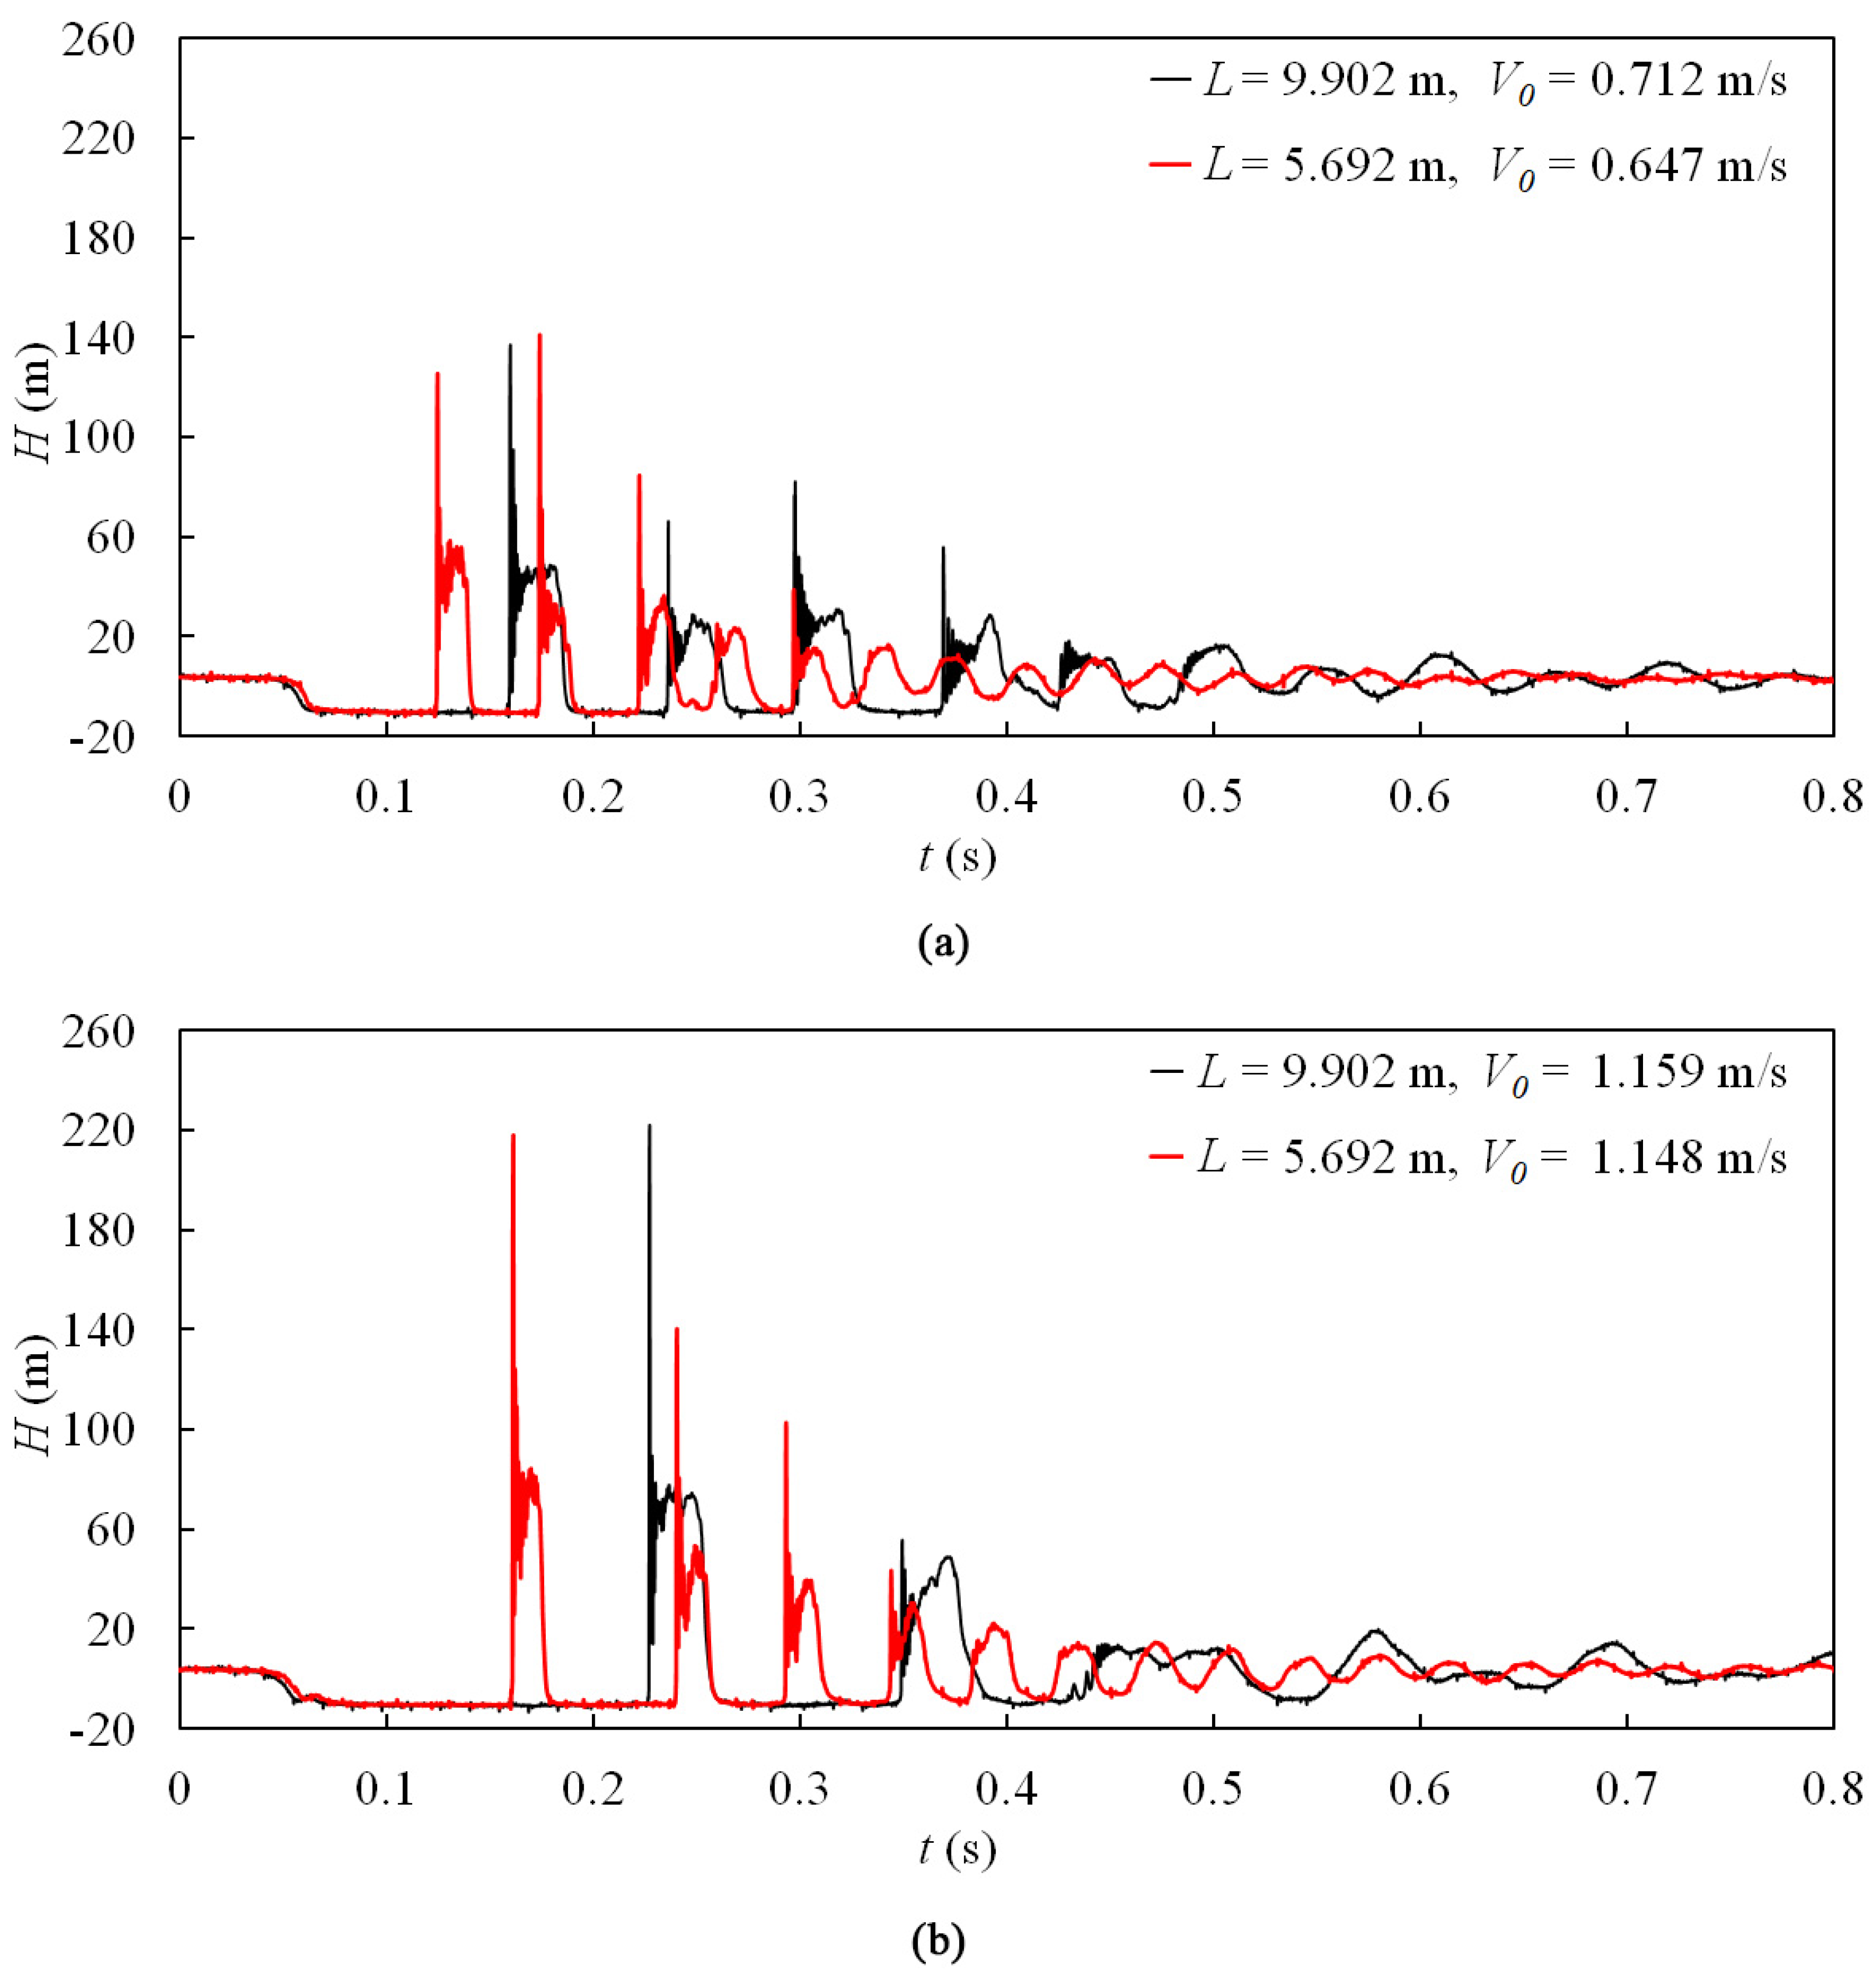
The pressure histories, measured at PT6# for the shorter pipeline and at PT3# for the longer pipeline, are presented in Figure 11, Figure 12 and Figure 13. It can be observed that under constant reservoir static pressure and initial flow velocity conditions, the duration of column separation for each phase in the shorter pipeline is shorter (approximately 40% for Phase-1) than that of the longer one. However, it should be noted that the maximum pipeline pressure in the valve may not necessarily be lower in the long piping system, as shown in Figure 11a, Figure 12a and Figure 13. One possible explanation for this phenomenon is that the short piping system exhibits a smaller number of water hammer cycles, which increases the likelihood of the superposition between the water hammer wave and the waves resulting from cavity collapse.

Figure 11.
Pressure histories for different pipeline lengths, HT2 = 1.55 m: (a) V0 is around 0.65 m/s; (b) V0 is around 1.15 m/s.
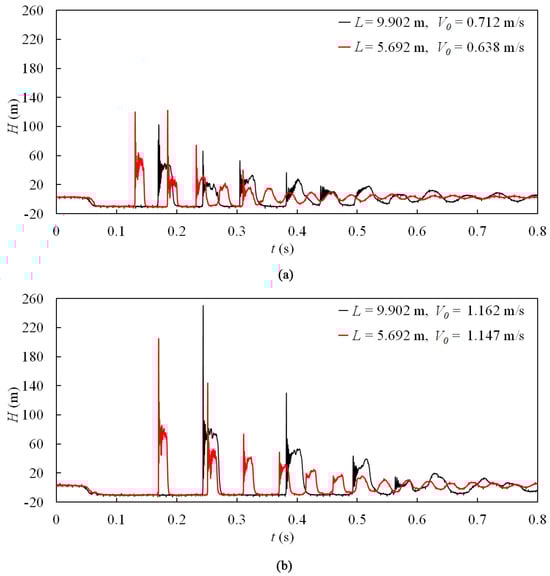
Figure 12.
Pressure histories for different pipeline lengths, HT2 = 2.55 m: (a) V0 is around 0.65 m/s; (b) V0 is around 1.15 m/s.
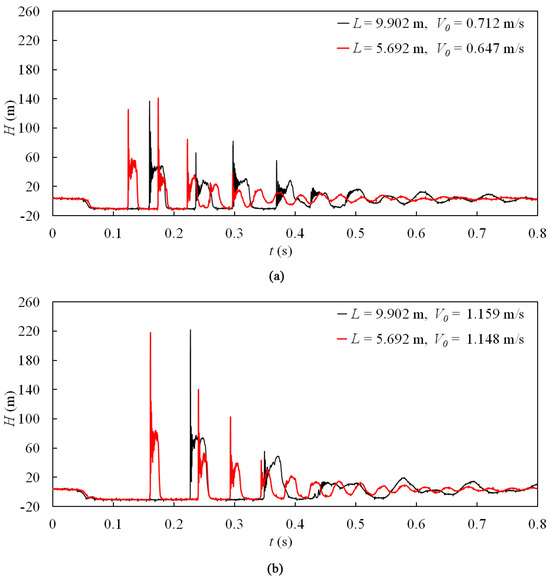
Figure 13.
Pressure histories for different pipeline lengths, HT2 = 3.55 m: (a) V0 is around 0.65 m/s; (b) V0 is around 1.15 m/s.
3.3.4. Changing Trends of Maximum Pipeline Pressure
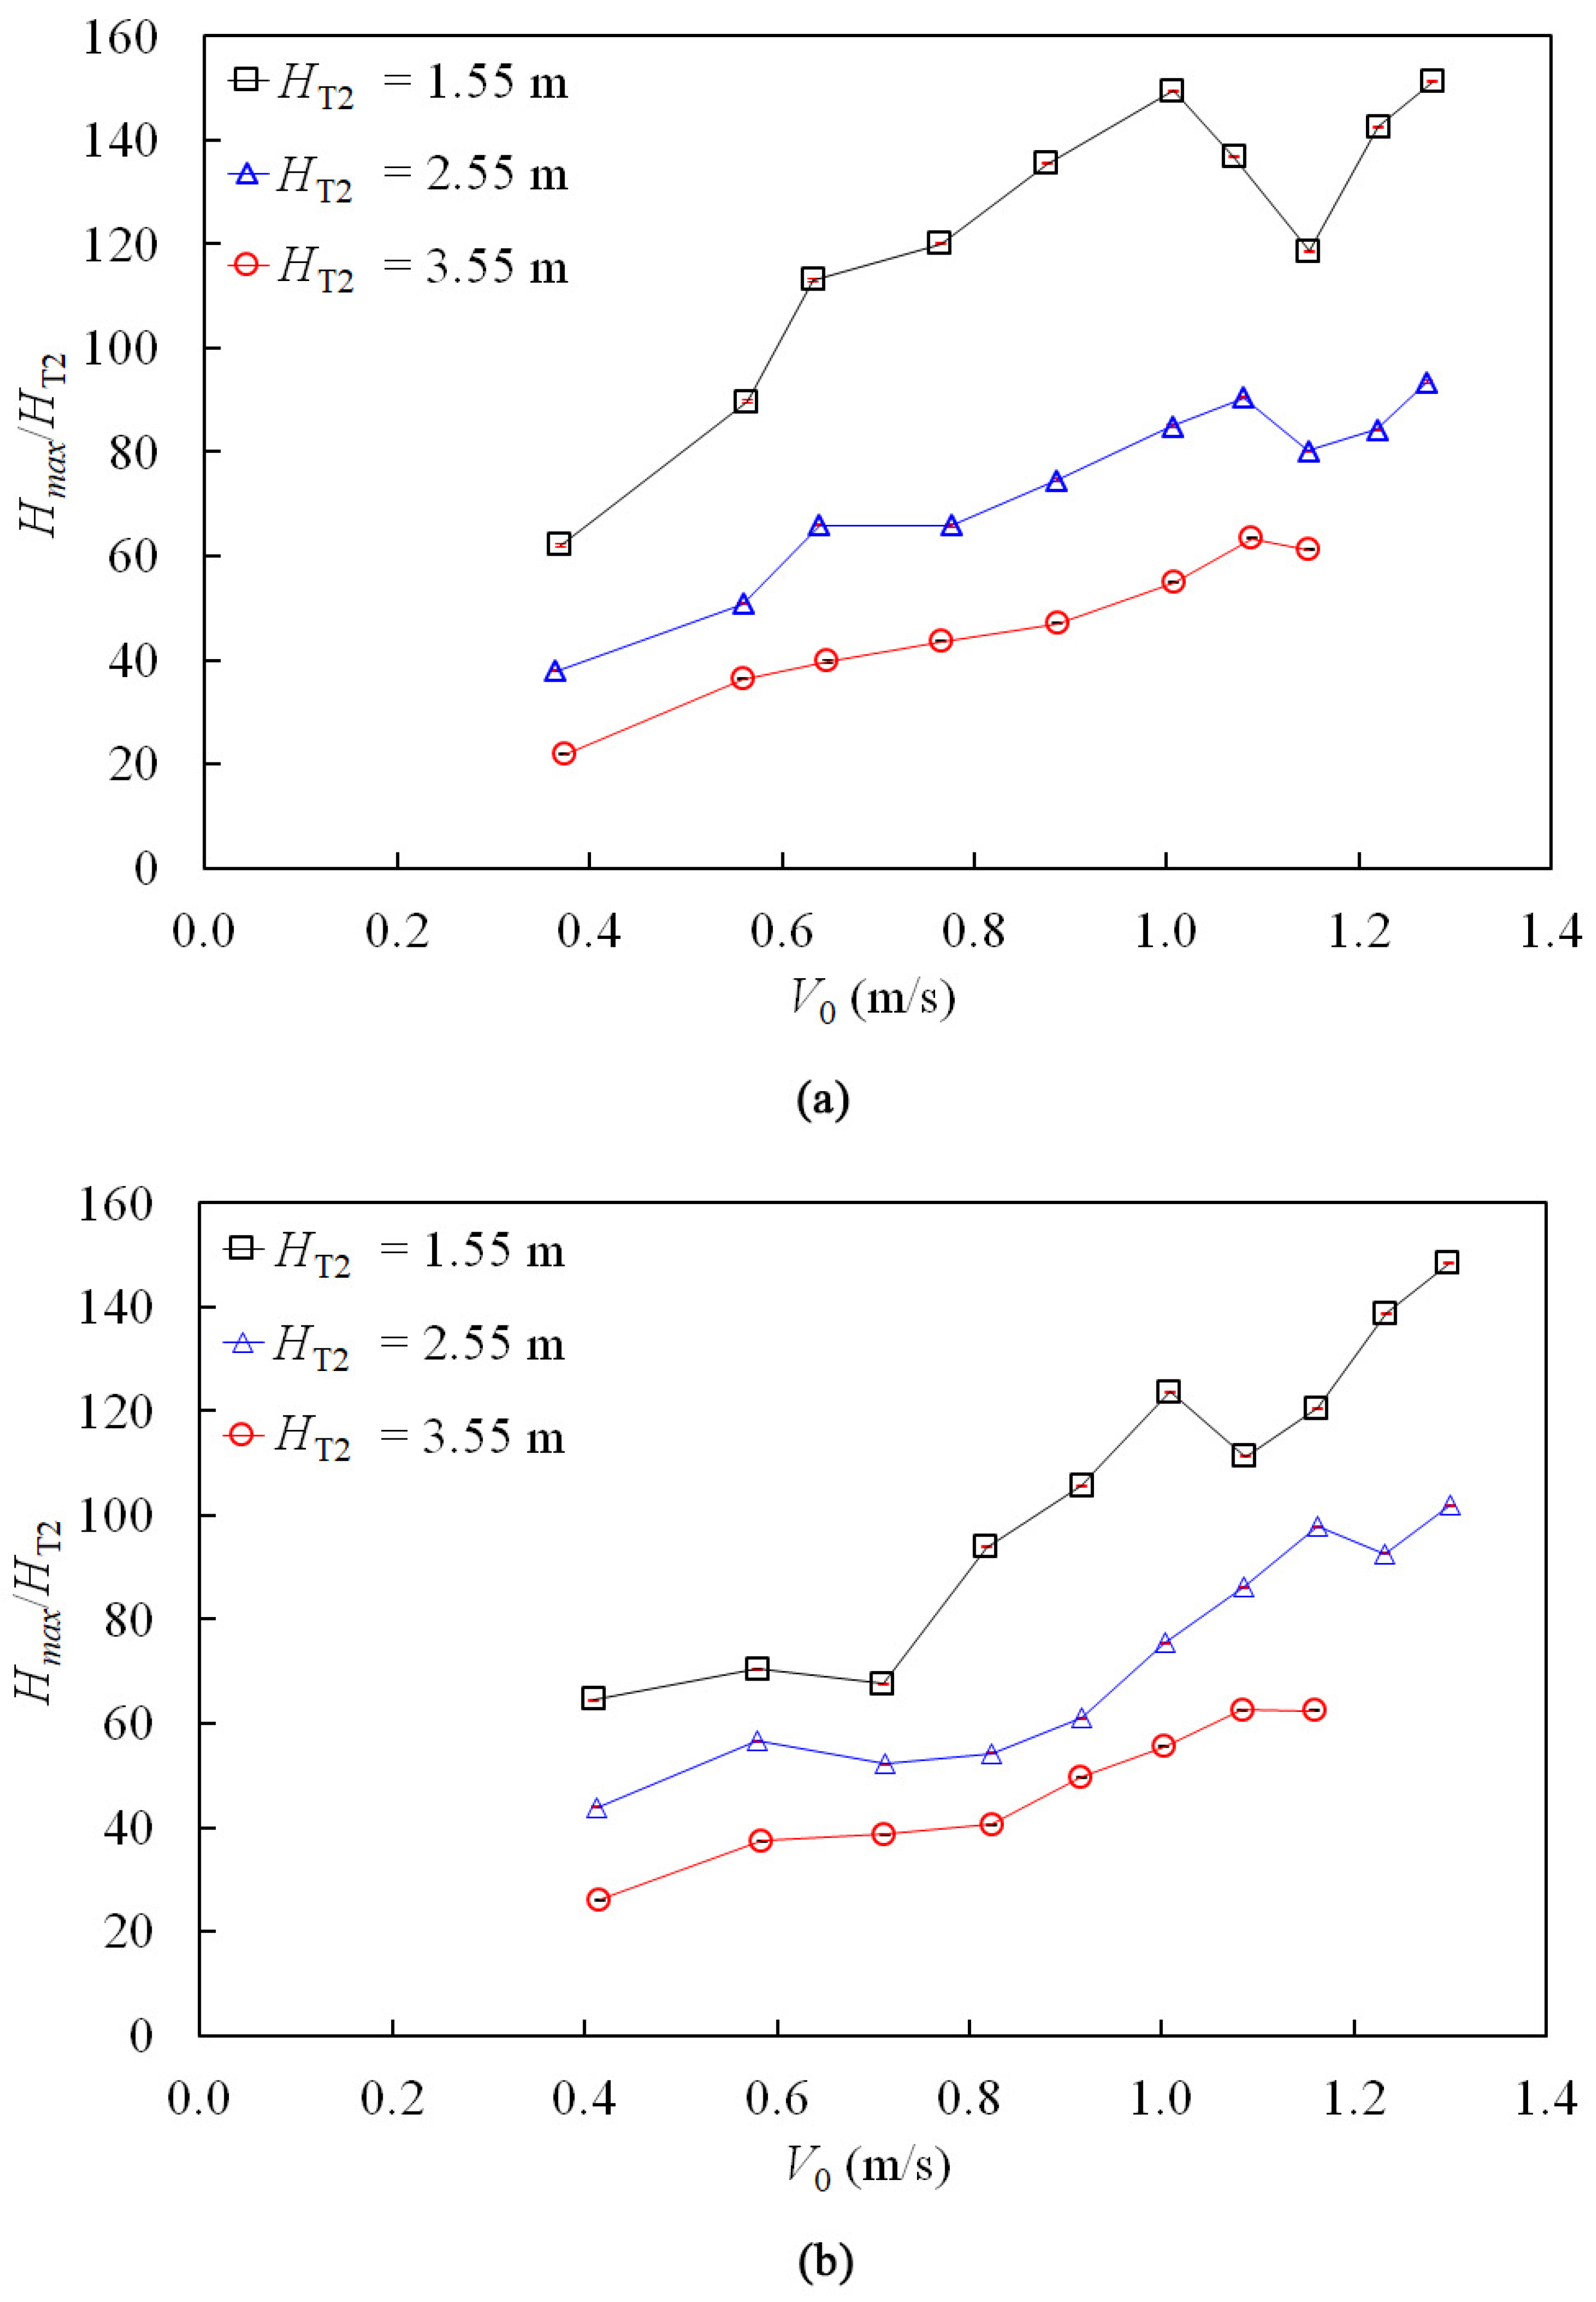
To summarize the relationship between the maximum pipeline pressure and the initial flow velocity, reservoir static pressure head, and pipeline length, a comparison was made regarding the ratio of maximum pipeline pressure to the static pressure in the downstream reservoir, Tank 2, as shown in Figure 14. In all test cases, the Hmax/HT2 ratio exceeded 150. With constant reservoir static pressure, an increase in initial flow velocity initially led to an increase in maximum pipeline pressure followed by a decrease and subsequent increase. This changing trend became more pronounced with decreasing reservoir static pressure. For nearly constant initial flow velocity, a lower reservoir static pressure resulted in a larger ratio of Hmax/HT2. Additionally, when comparing cases with constant reservoir static pressure and initial flow velocity, shorter pipelines exhibited greater changes in maximum pressure compared to longer pipelines.

Figure 14.
Maximum pipeline pressure measurements: (a) closure valve BV2#; (b) closure valve BV1#.
4. Conclusions
In this paper, a series of experimental studies on column separation events on the downstream side of a closure valve were conducted to reveal the dynamic behaviors of column separation and the effects of initial flow velocity, reservoir static pressure head, and pipeline length on the pressure surge. The main conclusions of this study are as follows:
- (1)
- The dynamic behaviors and transient regimes of column separation can be summarized as follows: (a) when the pressure drops to vapor pressure level, “mist clouds” initially appear near the valve and rapidly expand downstream until they occupy the entire pipe cross-section; (b) the cavitation structures can manifest as “mist clouds” with distinct gas–liquid interfaces, “bubble clouds” composed of numerous tiny bubbles with clear gas–liquid interfaces, or a combination thereof that can transform into each other; (c) the rate of expansion-condensation and the process of shape changes for bubbles at different positions within a cavitation structure are not the same, with several repeated expansion-condensation processes occurring before the cavitation structure vanishes completely; (d) following the collapse of a cavitation structure, an instantaneous sharp pressure oscillation with high frequency and amplitude propagates along the pipeline; (e) after the cavities collapse, gas release is observed, which increases over time in each phase, leading to reduced wave speeds.
- (2)
- Based on variations in the duration of column separation (sequential decrease or not) and the occurrence position of maximum pressure (following the first cavity collapse in the valve or not), four types of pressure oscillation pattern were identified in these experimental tests.
- (3)
- The influence of piping system quantities on pressure oscillation patterns can be summarized as follows: (a) under the condition of a constant downstream reservoir static head, when the initial velocity increases, the type of pressure oscillation pattern transitions from a nonsequential decrease in the duration of column separation (i.e., Type 3 or 4) to a sequential decrease in duration (i.e., Type 1 or 2); (b) for similar initial flow velocities, the types of pressure oscillation pattern remain consistent, indicating that the reservoir static head has a slight impact on the type of pressure oscillation pattern in the column separation event on the downstream side of the closure valve; (c) a shorter pipeline results in shorter cavitation duration (approximately 40% for Phase-1), but this is not necessarily the same for maximum pipeline pressure.
- (4)
- In all test cases, the maximum pipeline pressure exceeded 150 times the reservoir static pressure. For constant reservoir static pressure, increasing initial flow velocity initially raises and then lowers the maximum pipeline pressure before increasing it again. This trend becomes more pronounced with decreasing reservoir static pressure.
Author Contributions
Conceptualization, methodology, software, and writing—original draft preparation, H.W.; investigation, validation, formal analysis, H.W. and L.Z.; resources, writing—review and editing, project administration, L.Z.; supervision, and revision, D.L. All authors have read and agreed to the published version of the manuscript.
Funding
This research was funded by the National Natural Science Foundation of China, grant numbers 51839008 and 51679066, and the Fok Ying Tong Education Foundation grant number 161068.
Institutional Review Board Statement
Not applicable.
Informed Consent Statement
Not applicable.
Data Availability Statement
The data presented in this study are available from the corresponding author upon reasonable request. The data are not publicly available due to privacy.
Acknowledgments
The authors are grateful to Arris S. Tijsseling, Department of Mathematics and Computer Science, Eindhoven University of Technology, and Anton Bergant, The Academic and Research Network of Slovenia, for assistance with experimental data analysis.
Conflicts of Interest
The authors declare no conflict of interest.
Nomenclature
| a | wave speed (m/s) |
| L | pipeline length (m) |
| T | pipeline period of pressure wave reflection (s) |
| hf | total pressure head loss (m) |
| D | inner pipe diameter (m) |
| V | flow velocity (m/s) |
| g | gravitational acceleration (m/s2) |
| Hmax | maximum pipeline pressure (m) |
| HT1 | static pressure head at Tank 1 (m) |
| HT2 | static pressure head at Tank 2 (m) |
| Hv | vapor vaporization pressure head (m) |
| V0 | initial flow velocity (m/s) |
| t | time (s) |
| tc | valve closure time (s) |
References
- Bergant, A.; Simpson, A.R.; Tijsseling, A.S. Water hammer with column separation: A historical review. J. Fluid Struct. 2006, 22, 135–171. [Google Scholar] [CrossRef]
- Streeter, V.L. Water hammer Analysis. J. Hydraul. Div. 1969, 95, 1959–1972. [Google Scholar] [CrossRef]
- Bergant, A.; Simpson, A.R. Pipeline column separation flow regimes. J. Hydraul Eng. 1999, 125, 835–848. [Google Scholar] [CrossRef]
- Bergant, A.; Simpson, A.R. Estimating unsteady friction in transient cavitating pipe flow. In Proceedings of the Second International Conference on Water Pipeline Systems, Edinburgh, Scotland, UK, 24–26 May 1994. [Google Scholar]
- Zhou, L.; Wang, H.; Bergant, A.; Tijsseling, A.S.; Liu, D.; Guo, S. Godunov-Type Solutions with Discrete Gas Cavity Model for Transient Cavitating Pipe Flow. J. Hydraul. Eng. 2018, 144, 04018017. [Google Scholar] [CrossRef]
- Kranenburg, C. Transient Cavitation in Pipelines. Ph.D. Thesis, Delft University of Technology, Delft, The Netherlands, 1974. [Google Scholar]
- Shu, J.-J. Modelling vaporous cavitation on fluid transients. Int. J. Press. Vessel. Pip. 2003, 80, 187–195. [Google Scholar] [CrossRef]
- Simpson, A.R. Large Water Hammer Pressures Due to Column Separation in Sloping Pipes. Ph.D. Thesis, The University of Michigan, Ann Arbor, MI, USA, 1986. [Google Scholar]
- Sadafi, M.; Riasi, A.; Nourbakhsh, S.A. Cavitating flow during water hammer using a generalized interface vaporous cavitation model. J. Fluids Struct. 2012, 34, 190–201. [Google Scholar] [CrossRef]
- Wang, H.; Zhou, L.; Liu, D.; Karney, B.; Wang, P.; Xia, L.; Ma, J.; Xu, C. CFD Approach for Column Separation in Water Pipelines. J. Hydraul. Eng. 2016, 142, 04016036. [Google Scholar] [CrossRef]
- Warda, H.A.; Wahba, E.M.; Salah El-Din, M. Computational Fluid Dynamics (CFD) simulation of liquid column separation in pipe transients. Alex. Eng. J. 2020, 59, 3451–3462. [Google Scholar] [CrossRef]
- Khani, D.; Lim, Y.H.; Malekpour, A. Calculating Column Separation in Liquid Pipelines Using a 1D-CFD Coupled Model. Mathematics 2022, 10, 1960. [Google Scholar] [CrossRef]
- Martin, C.S. Experimental investigation of column separation with rapid closure of downstream valve. In Proceedings of the 4th International Conference on Pressure Surges, Bath, UK, 21–23 September 1983. [Google Scholar]
- Mitosek, M. Study of transient vapor cavitation in series pipe systems. J. Hydraul. Eng. 2000, 126, 904–911. [Google Scholar] [CrossRef]
- Arfaie, M. Pressure Transient Analysis Including Column Separation and Behaviour of Long Pipelines. Ph.D. Thesis, Newcastle University, Newcastle, UK, 1989. [Google Scholar]
- Adamkowski, A.; Lewandowski, M. Investigation of Hydraulic Transients in a Pipeline with Column Separation. J. Hydraul. Eng. 2012, 138, 935–944. [Google Scholar] [CrossRef]
- Kashada, M.A.M. Modelling of Unsteady Pipe Flow with “Liquid Column Separation” (Water Hammer Induced Transient Cavitation). Ph.D. Thesis, Newcastle University, Newcastle, UK, 2017. [Google Scholar]
- Safwat, H.H.; Van Den Polder, J. Experimental and Analytic Data Correlation Study of Water Column Separation. J. Fluids Eng. 1973, 95, 91–97. [Google Scholar] [CrossRef]
- Zheng, Y.; Suo, L.; Qu, B.; Zhang, J.; Liu, D. Youya shushui guandao xitong hanqi shuichui yanjiu [Study on water hammer with gas in pressurized water delivery pipeline system]. J. Hohai Univ. 2005, 33, 277–281. [Google Scholar] [CrossRef]
- Autrique, R.; Rodal, E.; Sánchez, A.; Carmona, L. Physical model studies of water column separation. IOP Conf. Ser. Earth Environ. Sci. 2012, 15, 022014. [Google Scholar] [CrossRef]
- Soares, A.K.; Covas, D.I.C.; Carrico, N.J.G. Transient vaporous cavitation in viscoelastic pipes. J. Hydraul. Res. 2012, 50, 228–235. [Google Scholar] [CrossRef]
- Soares, A.K.; Covas, D.I.C.; Ramos, H.M.; Reis, L.F.R. Unsteady Flow with Cavitation in Viscoelastic Pipes. Int. J. Fluid Mach. Syst. 2009, 2, 269–277. [Google Scholar] [CrossRef]
- Baltzer, R.A. Column Separation Accompanying Liquid Transients in Pipes. J. Basic. Eng. 1967, 89, 837–846. [Google Scholar] [CrossRef]
- Himr, D. Investigation and Numerical Simulation of a Water Hammer with Column Separation. J. Hydraul. Eng. 2015, 141, 04014080. [Google Scholar] [CrossRef]
- White, F.M. Fluid Mechanics, 7th ed.; Mcgraw-Hill: New York, NY, USA, 2011; p. 356. [Google Scholar]


Disclaimer/Publisher’s Note: The statements, opinions and data contained in all publications are solely those of the individual author(s) and contributor(s) and not of MDPI and/or the editor(s). MDPI and/or the editor(s) disclaim responsibility for any injury to people or property resulting from any ideas, methods, instructions or products referred to in the content. |
© 2023 by the authors. Licensee MDPI, Basel, Switzerland. This article is an open access article distributed under the terms and conditions of the Creative Commons Attribution (CC BY) license (https://creativecommons.org/licenses/by/4.0/).