Article

Experimental Evaluation of Surface Roughness, Burr Formation, and Tool Wear during Micro-Milling of Titanium Grade 9 (Ti-3Al-2.5V) Using Statistical Evaluation Methods

by
Muhammad Ayyaz Khan
1,
Muhammad Ali Khan
1,2,*,
Shahid Aziz
3,4,*,
Muhammad Iftikhar Faraz
5,
Abdul Malik Tahir
2,6,
Syed Husain Imran Jaffery
1 and
Dong-Won Jung
7,*
1
School of Mechanical and Manufacturing Engineering (SMME), National University of Sciences and Technology (NUST), Islamabad 44000, Pakistan
2
Department of Mechanical Engineering, College of Electrical and Mechanical Engineering (CEME), National University of Sciences and Technology (NUST), Islamabad 44000, Pakistan
3
Department of Mechanical Engineering, Jeju National University, 102 Jejudaehak-ro, Jeju-si 63243, Republic of Korea
4
Institute of Basic Sciences, Jeju National University, 102 Jejudaehak-ro, Jeju-si 63243, Republic of Korea
5
Department of Mechanical Engineering, College of Engineering, King Faisal University, Al-Ahsa 31982, Saudi Arabia
6
Department of Engineering Management, College of Electrical and Mechanical Engineering (CEME), National University of Sciences and Technology (NUST), Islamabad 44000, Pakistan
7
Faculty of Applied Energy System, Major of Mechanical Engineering, Jeju National University, 102 Jejudaehak-ro, Jeju-si 63243, Republic of Korea
*
Authors to whom correspondence should be addressed.
Appl. Sci. 2023, 13(23), 12875; https://doi.org/10.3390/app132312875
Submission received: 8 October 2023 / Revised: 24 November 2023 / Accepted: 27 November 2023 / Published: 30 November 2023
(This article belongs to the Section Aerospace Science and Engineering)

Abstract

:
Titanium grade 9 (Ti-3Al-2.5V) stands out as a preferred material in various industrial applications because of its suitable properties. Its applications span diverse sectors, including precision manufacturing, where it is utilized to produce honeycomb structures for advanced aeronautics, as well as for certain biomedical components. In parallel, micro-milling has gained widespread utilization across medical, aerospace, and electronic industries due to the increasing demand for miniature products in these domains. This current research study aims to explore the impact of various micro-milling process parameters—specifically, feed rate, cutting speed, and depth of cut—on the surface quality, burr formation, and tool flank wear of titanium grade 9. Research findings reveal that the feed rate plays a major role in influencing surface roughness (contribution ratio (CR): 62.96%) and burr formation (CR: 55.20%). Similarly, cutting speed and depth of cut significantly affect surface roughness, contributing 20.32% and 9.27%, respectively, but are insignificant factors for burr width. Tool flank wear is primarily influenced by cutting speed (CR: 54.02%), with feed rate contributing 33.18%. Additionally, the feed rate and cutting speed are significant factors in determining the length of the burr, with contribution ratios of 77.70% and 7.77%, respectively. Confirmatory tests conducted at optimum parameters selected from the main effects plot validated the experimental results.

1. Introduction

Titanium alloys are the optimal choice for aerospace applications, renowned for their high specific strength, particularly in elevated temperature environments, and outstanding resistance to corrosion. These attributes also make titanium an attractive candidate for biomedical purposes, including surgical implants, where its excellent biocompatibility and resilience to physiological fluids are highly advantageous. Micro-milling, as an essential manufacturing technology, plays a pivotal role in the production of micro-sized products of titanium alloys with intricate features and exceptional surface quality [1]. Although micro-milling offers numerous advantages, it also presents several challenges in the process of producing micro-devices [2]. Burr is a common byproduct in subtractive manufacturing processes like machining. In micro-milling, the burr size is significantly smaller than in macro-scale machining, making burr removal a more difficult task in this domain [3,4]. Micro-machining, in contrast to other micro-level techniques for producing micro products, provides greater flexibility in the production process. With no limitations on shape cutting, it can create intricate structures, including arbitrary curvatures, three-dimensional cavities, and high-aspect-ratio features like long shafts and micro-channels [5]. Micromachining techniques offer a competitive advantage due to their cost-effective setups and high material removal rates compared to nontraditional micro-machining processes. This makes them a viable option for producing customized items or small batches. However, micromachining is limited by the choice of suitable workpiece materials. Achieving fine surface finishes, particularly in finishing processes, is crucial for high-precision components. In the realm of surface roughness research, the primary focus has been on modeling and selecting appropriate parameters. The micro-level milling process presents various challenges, with the most significant being the characterization, reduction, and evaluation of burrs. Tool life is determined by tool flank wear, which results from the direct interaction between the tool face and the workpiece. This interaction also affects surface quality. In the micro domain, the stringent requirement for surface finish amplifies the importance of preventing tool failure [6]. Titanium alloys are known for their poor machinability due to low thermal conductivity. In micro-scale machining like micro-milling, cutting tools in titanium alloys quickly wear out [7]. Researchers conducted a study on optimizing machining processes to achieve sustainability, productivity, and efficiency simultaneously. They analyzed the effects of machining parameters and conditions, with a focus on specific cutting energy, tool wear, surface roughness, and material removal rate. The findings highlighted the significance of feed rate and cutting conditions, leading to a 30% reduction in tool wear, a 22% improvement in surface roughness, and a 4% decrease in specific cutting energy under the proposed optimal parameters [8].
In recent years, various empirical studies have explored metal micro-machining. Predominant techniques include EDM machining, laser micro-machining, ultrasonic micro-machining, and mechanical micro-machining. Mechanical machining, particularly micro-milling, has gained significant attention from researchers due to its flexibility and productivity in micro-level machining. From 2000 to 2020, research in micro-milling has primarily focused on size effects, cutting forces, vibrations, tool wear, burr formation, surface roughness, and process optimization. Akhtar et al. [9] conducted a study on process parameter optimization in turning aluminum alloy 7075. Using the Taguchi method with an L27 array, they investigated how cutting speed, feed rate, and depth of cut influenced material removal rate (MRR), surface roughness, and cutting force. Their findings revealed that a depth of cut of 2 mm, a cutting speed of 1600 rpm, and a feed rate of 0.25 mm/min resulted in optimal conditions for achieving high MRR while reducing cutting force and surface roughness. Wang et al. [10] conducted an experimental study on surface roughness during slot end milling of AL2014-T6. Their research aimed to investigate how surface roughness was affected by the cutting environment and tool geometry when milling slots in AL2014-T6. Input parameters included cutting-edge concavity, feed rate, depth of cut, and axial relief angles of the end mill. Surface roughness models were developed using experimental data and the response surface methodology (RSM) under both dry cutting and coolant conditions. Sooraj et al. [11] investigated the impact of machining parameters on force and surface quality during micro end milling of brass. They identified feed/tooth as a significant factor in micro-machining performance. A study was conducted on milling processes to investigate the impact of machining parameters on surface roughness, burr width, and energy consumption. Cutting speed significantly influenced specific cutting energy and burr width during down-milling, with contributions of 55% and 47.98%, respectively. Conversely, the number of inserts had a notable impact on surface roughness and burr width during up-milling, contributing 68.74% and 35%, respectively. Confirmation tests validated the findings [12]. Researchers conducted a study on machining titanium alloy Ti-6Al-4V using cryogenic cooling. They developed an energy consumption map, finding that cutting speed had a greater impact on energy consumption. This cryogenic energy map reduced energy consumption by up to 16% and increased productivity by up to 156% by optimizing machining parameters, thereby promoting sustainability and cleaner production [13].
Aslantas et al. [14] investigated the impact of cutting parameters on surface quality and burr width in micro-milling of Ti-6Al-4V alloy. Spindle speed, feed per tooth, and depth of cut were controlled factors. Taguchi-based gray relational analysis optimized these parameters for minimal burr width and surface roughness (Ra). ANOVA determined the contribution percentages of these factors. The results showed that a feed rate of 0.25 μm/tooth achieved the best surface quality, whereas an ap value of 0.1 mm and an n value of 10,000 rev/min minimized surface roughness (Ra). Zheng et al. [15] conducted an empirical study on burr formation during vibration-assisted micro-milling of titanium grade 5 (Ti-6Al-4V). Their findings indicated that burr size could be effectively reduced by optimizing the vibration parameters during the micro-milling process. Gupta et al. [16] conducted a study on hybrid cooling-assisted turning of titanium grade 9 (Ti-4Al-2.5V). They investigated tool wear under three different machining conditions: minimum quantity lubrication (MQL), hybrid (liquid nitrogen–MQL), and dry machining. Their research revealed that the hybrid cooling approach outperformed both dry machining and MQL conditions in terms of minimizing tool wear. In their study on titanium grade 5 (Ti-6Al-4V), Jaffery et al. [17] conducted a thorough investigation and employed ANOVA for statistical analysis. Their research focused on evaluating process outcomes such as surface roughness, top burr width, and tool flank wear. They systematically examined the impact of process input parameters, including feed rate, cutting speed, and depth of cut, on these process outcomes. Their experimental design involved two levels for each parameter. The results emphasized that feed rate played a crucial role as a major influencing factor for surface roughness. Additionally, they noted that machining below the edge radius led to improved surface quality, particularly concerning surface roughness.
Muhammad et al. [18] studied the effects of tool coating and cutting process parameters when micro-machining Inconel 718. Their research focused on surface roughness and burr formation. Statistical analysis revealed that cutting velocity had a significant influence on surface roughness, while cutting depth had the greatest impact on burr formation. Additionally, the study found that feed rate and depth of cut influenced the types of burrs formed. Furthermore, in another study on Inconel 718, Lu et al. [19] found that cutting parameters, tool condition, machine vibrations, and built-up edge (BUE) formation influenced surface roughness. They observed an initial decrease in surface roughness, followed by a gradual increase with cutting length. Researchers conducted a study on improving the sustainability of machining hard materials by investigating the influence of cooling conditions, including cryogenic cooling, on tool wear, specific cutting energy, and surface roughness. The findings showed that cryogenic cooling had a significant positive impact, improving tool wear by 33%, specific cutting energy by 10%, and surface roughness by 9% under optimized machining conditions [20]. Ahsan et al. [21] discussed two methods for determining tool life: (a) measuring the dimensional accuracy of machined parts and (b) measuring the tool flank wear. Cutting temperature is a critical factor when working with metals, as it significantly affects tool wear. Research has highlighted that cutting speed is the primary variable influencing tool wear in machining processes. Higher cutting speeds generate more heat, leading to accelerated tool wear [22]. Tool wear is the leading cause of accuracy problems and can manifest in various forms, such as increased cutting force, dimensional changes, or the necessity for a replacement tool. Numerous empirical studies have investigated tool wear in various materials, including titanium grade 5 and Ti555.3. Arrazola et al. [23] conducted a study on these materials, examining the influence of process parameters on tool wear, cutting forces, and chip geometry. Their research identified tool failure mechanisms related to diffusion and adhesion. Another study investigated the machinability of Ti-6Al-4V aerospace alloy using cryogenic conditions, addressing its challenging properties. By creating a tool wear map based on cutting speed and feed rate, the research identified distinct wear regions, including an avoidance zone. Cryogenic machining improved tool life by up to 100% and increased material removal rates (MRRs) by 36%, offering valuable insights for optimizing Ti-6Al-4V machining. In another study on titanium alloy, researchers focused on machining titanium alloy Ti-6Al-4V at high speeds and compared dry and cryogenic conditions. Cryogenic machining significantly extended tool life by up to 170% while also promoting a more consistent and slower tool wear rate. Additionally, cryogenic methods reduced energy consumption and improved wear characteristics, highlighting their sustainability advantages for titanium alloy machining [24]. Researchers conducted another study on micro-milling Inconel 600 super alloy, commonly used in aerospace and high-temperature applications. They found that cryogenic cooling yielded the best surface roughness and extended tool life, making it a valuable cooling method for machining super alloys [25]. Researchers conducted a study on milling Inconel 718 at conventional speeds, comparing uncoated and coated tools. Uncoated and AlTiN-coated tools had lower tool wear, while TiSiN-coated tools resulted in higher surface roughness and burr formation. The optimal conditions reduced surface roughness and tool wear by 18% and 20%, respectively, using an AlTiN-coated tool at specific machining parameters [26].
Recently, many studies have been carried out in the micro-milling domain. The study by Tian et al. [27] examined how microstructural anisotropy in Ti-6Al-4V alloy produced through selective laser melting (SLM) affects micro-milling. Orthogonal milling tests were performed on different surfaces of SLMed specimens, and various parameters were evaluated. The research revealed the influence of grain orientation on cutting forces, surface quality, and chip formation, highlighting the importance of selecting appropriate machining methods for precision processing. In another study, researchers explored micro-milling of tough cemented carbides with a focus on enhancing surface quality and dimensional accuracy. Their investigation delved into surface and chip formation, assessing the impact of cutting parameters and tool selection. The results unveiled various surface damage mechanisms and confirmed a ductile cutting regime for these hard materials, offering valuable insights for precise micro-milling [28]. In one study, researchers explore the micro-milling of FeCo-2V soft magnetic alloys to improve their magnetic properties and geometric finish. They optimize the process by varying machining parameters, and additionally describe a complementary electro polishing process to eliminate burrs and milling residuals. This work showcases the potential of micro-milling for fabricating precise micro-assemblies in MEMS, with a focus on improving surface quality and deburring [29]. In a related study, researchers aimed to improve tool wear measurement in micro-milling, especially in the presence of challenging burrs in Inconel 718. By employing abrasive deburring, they reduced burr heights by around 99%, leading to more accurate tool wear assessments based on slot geometry, which is a valuable alternative to direct measurements. This method enhances the precision of micromachining processes [30].
This research aims to target research goals of enhanced productivity and higher sustainability achieved by the improved machinability of titanium grade 9, which would benefit precision manufacturing, especially in aerospace, biomedical engineering, and electronics applications. Initially, the output responses are analyzed by drawing the main effects plots, which highlights the effects of input variables. Then, the significance and influence of each input is determined in terms of its p-value and contribution ratio. Validation of the work is conducted by confirmatory experiments at best and worst-state conditions, as identified from the main effects plots. The envisioned output of the current work is closely aligned with the United Nations’ Sustainable Development Goals (SDGs) [31,32]. Productivity is improved through optimizing vital indices, including surface roughness and burr formation, which represents product quality. Similarly, tool wear is minimized, which in turn improves process economy, thereby promoting sustainability. It is foreseen that the adoption of such practices will add to the optimization of manufacturing output while serving the globally applicable UN SDGs.

2. Materials and Methods

2.1. Experimental Setup and Material

In this study, micro slot milling was carried out using a CNC machining center (CNCMV-1060). The maximum spindle speed of the machining center was 8000 rpm, and the process parameters were configured to achieve a maximum machining speed of 48,000 rpm. To reach this high speed, an ultra-precision high-speed spindle (HES810-BT40) was employed that allowed for a maximum speed of 80,000 rpm. The spindle had a runout accuracy of 0.1 µm. The tool used in this experimental study was a two-flute tungsten carbide end mill (2F-⌀0.5 × ⌀4 × 50–60°). The cutting-edge radius and the diameter of the tool were measured at 4 µm and 500 µm, respectively, using an Olympus digital microscope (DSX1000; Olympus Corporation, Tokyo, Japan).
A titanium grade 9 workpiece was selected for the experiments. The workpiece was wire-cut from a 12 mm-thick disc, leading to dimensions of 168 × 12 × 12 (length × width × height). Grade 9 titanium, commonly referred to as Ti-3Al-2.5V, is classified as a nearly two-phase alloy containing both α and (α + β) phases. This alloy is specifically engineered for application in the hydraulic and fuel systems of aircraft. Grade 9 titanium demonstrates intermediate mechanical and corrosion resistance performance when juxtaposed with titanium grade 5 (Ti-6Al-4V) [33,34]. For more detailed information regarding its chemical composition and properties, please refer to Table 1 and Table 2. The workpiece’s chemical composition was determined using a metal analyzer (SPECTROMAXX LMX10, Spectro Analytical Instruments GmbH, Kleve, Germany).

2.2. Design of Experiment

Table 3 provides a comprehensive overview of the experimental parameters employed in the machining operations. The study utilized Taguchi’s robust design of experiments, specifically the L9 array, as detailed in Table 4. To ensure results consistency, two separate runs with new tools were conducted, and in cases where significant variations were observed, the tests were repeated up to five times. Positioning was carried out to ensure tool setting accuracy. The positioning reference between the workpiece surface and the tool was conducted by utilizing a BMD Messwell 410V tool pre-setter. Prior research by Jaffery et al. [16] suggests that maintaining feed rates below the tool’s edge radius can lead to reduced surface roughness. Therefore, this study adopted feed rates below this radius in contrast to titanium alloy Ti-6Al-4V, for which literature reports cutting speeds ranging from 10,000 rpm to 90,000 rpm [6,17,36,37], no previous investigations have been conducted on cutting speeds specific to titanium grade 9. Consequently, this study selected three cutting speed levels (25, 50, and 75 m/min) based on Jaffery et al. [16]’s work, where 25 and 50 Vc were chosen. Additionally, the recommended depth of cut guidelines provided by Niagra Tool [38] were considered. For tool diameters of 1/8” and smaller, the formula ap = Dx (minimum 0.25, maximum 0.05) suggests recommended depths of cut ranging from 25 to 125 µm. Accordingly, this study explored three levels of 30, 60, and 90 µm. The spindle speed (n) and feed velocity (Vf) were calculated using the following equations:
n = V c / ( π · D )
V f = f . n . z

2.3. Response Measurement

In the current work, titanium grade 9 was machined using the micro-milling process. The process outcome was assessed by measuring the surface roughness, burr size, and tool flank wear using an Olympus digital microscope (DSX1000; Olympus Corporation, Tokyo, Japan) with a repeatability of 1 µm. Slots were machined, as shown in Figure 1. The surface roughness was measured by taking multiple readings in the machined slot, as indicated by the yellow square. The black outgrowth visible on both sides of the machined slot, known as burr, is an unwanted and undesirable phenomenon. Burr is a sharp edge or ridge of material that forms along the edge of the workpiece. In the current research, the burr height and burr width were determined using microscopy images. Since the burr length could not be measured accurately owing to the curve of the burr, it was calculated using the Pythagorean theorem, incorporating the burr height and width, as illustrated in Figure 2. Although some previous researchers have used chip thickness and/or chip area calculations using imaging software for burr area measurements, the current study focused on directly measuring the burr height and burr width using an Olympus 3D digital microscope, which was then used to determine the novel burr length.
With regards to tool wear in micro-milling, ISO 8688 standards were followed, which encompass different forms of tool wear, including flank wear, chipping, face wear, outside edge wear, and catastrophic failure [39]. Flank wear is particularly significant, as it directly impacts product quality by increasing surface roughness. Consequently, this study concentrated on the analysis of flank wear, as depicted in Figure 3.

3. Results

After the experimentation phase, the outcomes were measured with precision and accuracy. The investigation evaluated parameters such as the surface roughness, the flank wear of the cutting tool, and the dimensions of burrs in down milling. A summary of these results is presented in Table 5. Burr width was selected as the primary measurement for quantifying burrs due to its ease of microscopic measurement, as depicted in Figure 4. Notably, the profile measurement inherently encompassed the burr’s height. Therefore, to determine the burr’s length, a calculation method based on the Pythagorean theorem was applied. It is worth noting that the literature has investigated three types of burrs: entry, exit, and top burrs [36]. This study focused solely on the top burr, using the worst-case scenario for all measured burr parameters. The DSX software employs line characteristics to identify the top burr width, with the blue segment on the red line indicating the measured burr width, as illustrated in Figure 4. Surface roughness was evaluated at the slot’s center, with three values recorded for each slot and their average utilized for analysis. The tool’s condition was assessed both before and after experimentation to ensure precise analysis of the tool flank wear. All of the results are presented in Table 5.

4. Discussion

The results were compiled, and statistical analysis, specifically ANOVA, was applied to calculate the contribution of each factor. Basic equations from reference [20] were used to determine the sum of squares and contribution ratios for each process parameter. These equations represent the fundamental principles behind ANOVA calculations, forming the basis for more advanced algorithms in statistical software. Although sophisticated methods are employed by the software, these basic equations underpin the accurate computation of ANOVA results.
S S = i = 1 n ( y i Y )
C R % = M S S   S S r e s S S t o t a l × 100
where SS: sum of squares, y i : observed values, Y : overall mean, CR: contribution ratio, MSS: mean sum of squares, S S r e s : sum of squares of residuals, and S S t o t a l : total sum of squares.
F-values in the analysis show the influence of the process parameter on the outcome and the p-value indicates the relationship with the outcome. Minitab® (https://www.minitab.com/en-us/) software was used for analysis and the generation of the main effects plot.

4.1. Surface Roughness

Ti-3Al-2.5V finds widespread application in the biomedical and aerospace fields, where stringent surface finish standards are imperative. Particularly in biomedical engineering, attaining minimal surface roughness in the micro-milling of titanium grade 9 is crucial. This not only diminishes the necessity for extensive post-milling procedures but also improves biocompatibility. Additionally, it extends the lifespan of devices by reducing friction and wear. Table 6 presents the results of the analysis of variance (ANOVA) for the surface roughness, evaluating the contributions and significance of different machining parameters. The contributions of three key parameters, namely, the feed rate (F) in µm/tooth, cutting speed (Vc) in m/min, and depth of cut (ap) in µm, are highlighted. These parameters had a substantial impact on the machining process. The feed rate parameter contributed the most, at 62.96%, followed by Vc at 20.32% and ap at 9.27%. The statistical significance is indicated by the associated p-values, where lower values suggest higher significance. All three parameters were considered significant, as their p-values were less than 0.05, signifying their influence on the machining outcomes.
Previous research in the field has identified key process variables crucial for achieving the desired surface finish in the micro-milling of titanium, which encompass tool coatings, cutting speed, tool edge radius, depth of cut, and feed rates [40,41]. Current research, as detailed in Table 6, corroborates the significance of these factors in influencing surface roughness. Among these variables, feed rate exerts the most substantial impact, contributing 62% to the overall outcome, and cutting speed and depth of cut also play significant roles. Notably, the feed rate’s influence is twice as pronounced as that of the other two factors. These factors demonstrated significance in the micro-milling of other titanium grades as well. These results emphasize the consistent importance of these parameters in optimizing surface quality in the micro-milling of titanium.
Figure 5 presents the main effects plot for surface roughness, highlighting the major influencing factors. The plot clearly illustrates that surface roughness tends to increase with higher feed rates and cutting velocities. This increase in surface roughness linked to higher feed rates can be attributed to increased heat generation due to a higher rate of material removal, resulting in a rougher surface. Conversely, an increase in the depth of cut tends to reduce surface roughness. Additionally, higher feed rates can lead to a larger contact area between the tool and the workpiece, resulting in greater cutting forces and, subsequently, an increase in surface roughness. Surface roughness is also influenced by cutting speed. However, as cutting speed rises, the temperature also increases, potentially promoting the formation of a built-up edge (BUE). BUE formation becomes more likely with materials that have higher ductility due to increased friction and interference with continuous chip formation, ultimately leading to a less favorable surface finish. In the current research, a decreasing trend in surface roughness was observed for titanium grade 9 as the depth of cut increased. A plausible reason for this trend can be found in the literature, which suggests that deeper cuts may yield a better surface finish due to the work hardening of the surface layer. Additionally, cutting forces tend to decrease with an increase in specific cutting energy and cutting forces, while specific cutting forces decrease as the depth of cut increases. These reduced cutting forces result in less elastoplastic deformation and ultimately lead to improved surface roughness. The standard deviation for surface roughness is displayed in Figure 6.

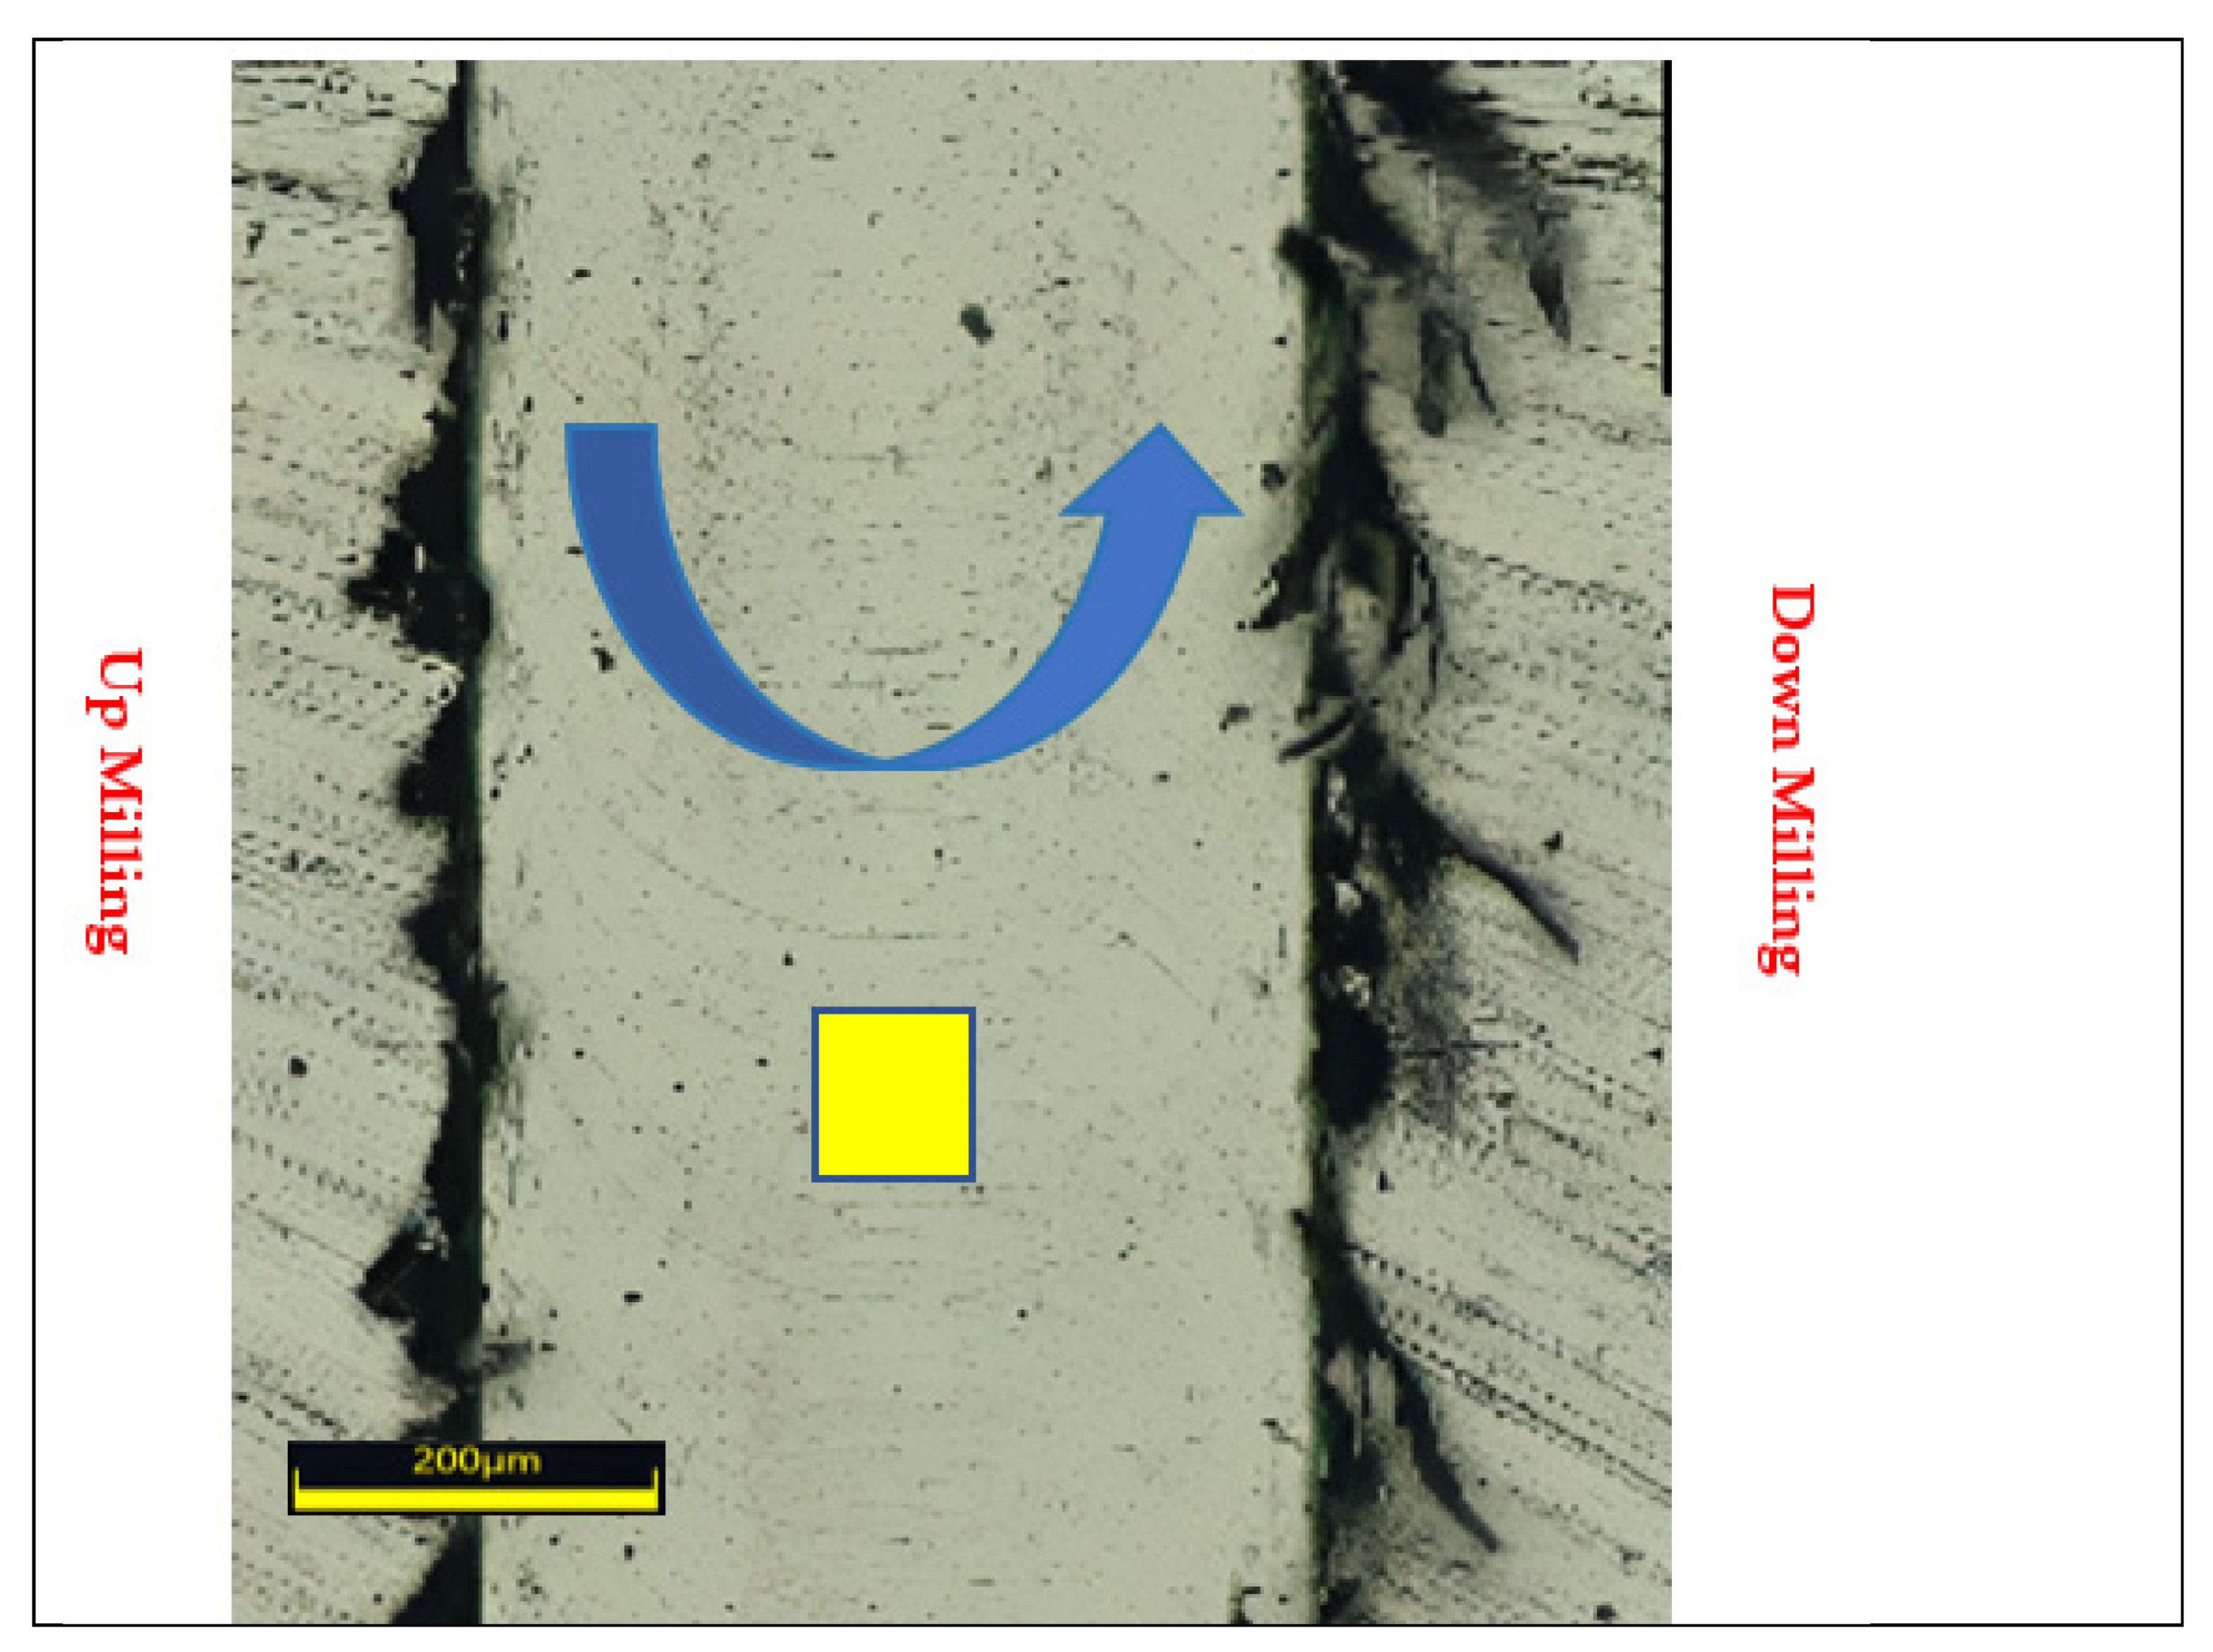
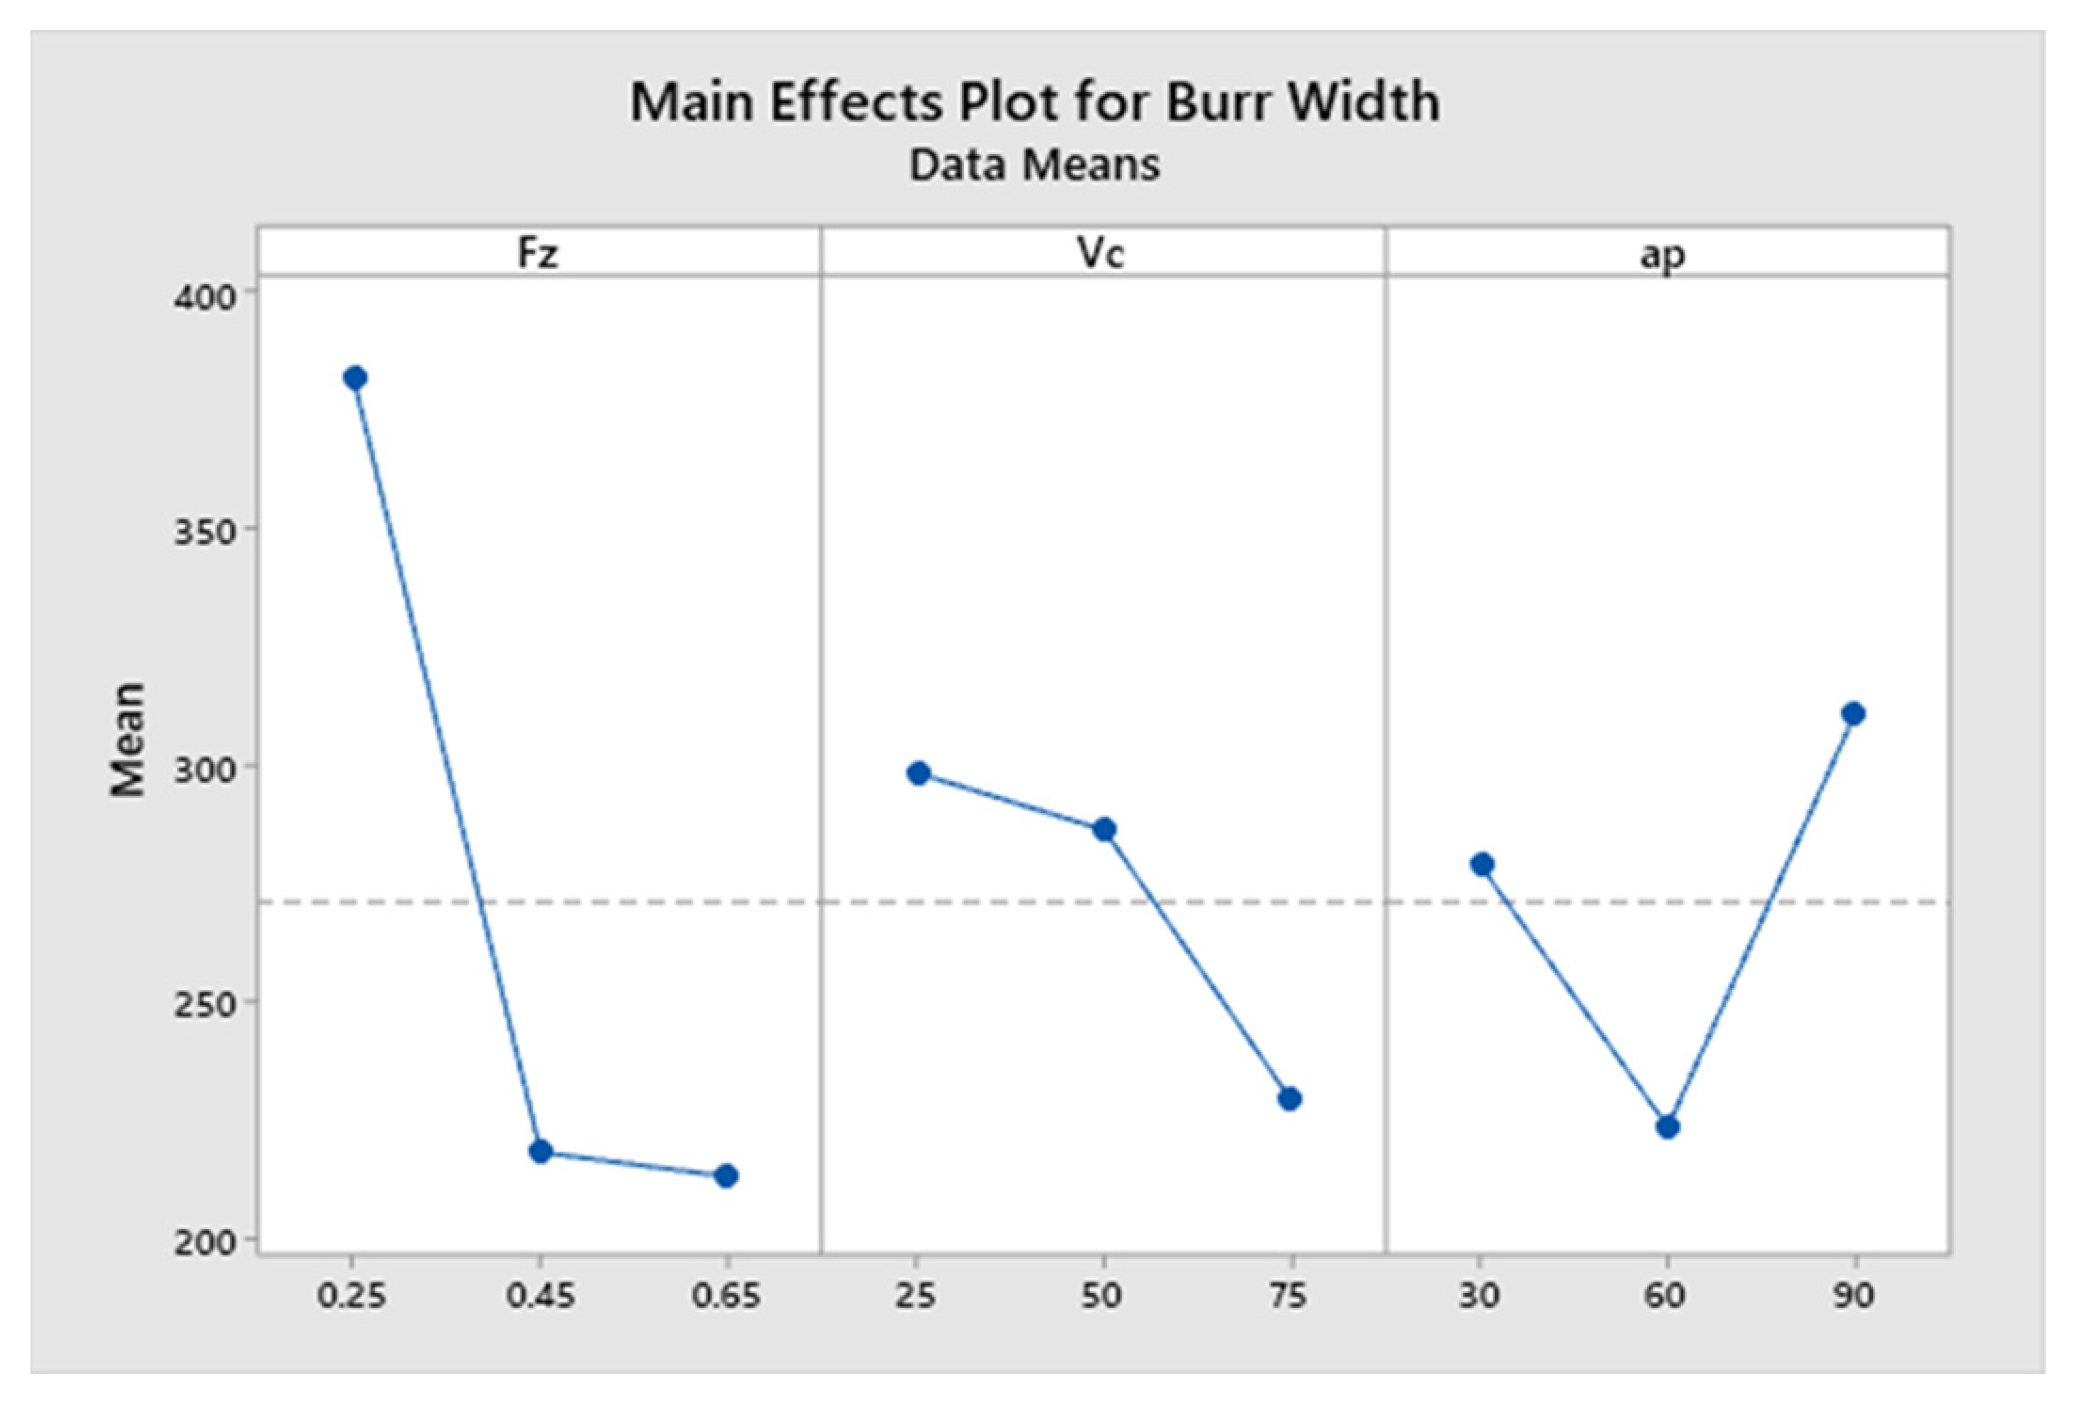
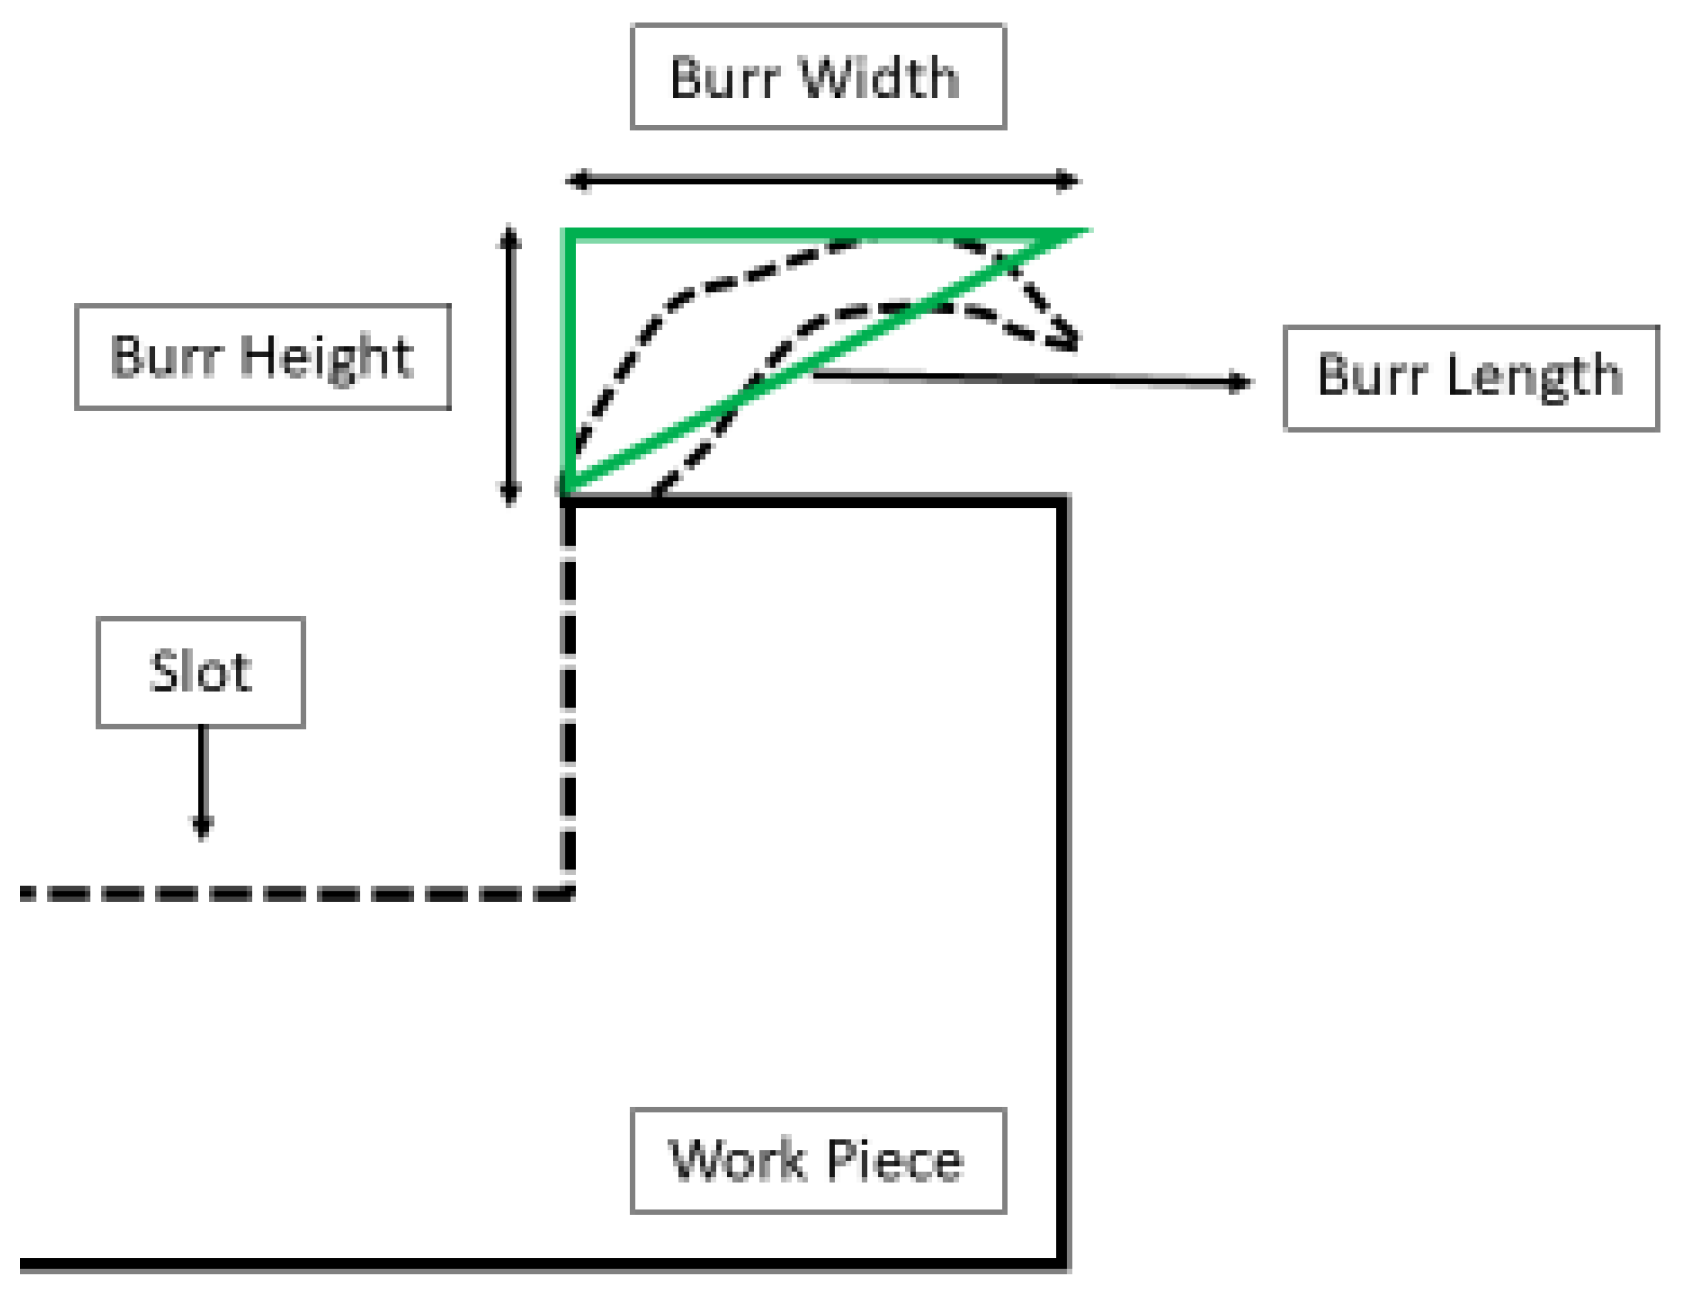
4.2. Burr Width (Down Milling)

In the context of micro-milling titanium alloys, achieving a minimized burr width bears profound implications for the biomedical and aerospace sectors, which formed a focal point in this research investigation. This reduction holds the promise of streamlining production processes by diminishing the necessity for intricate post-processing steps such as deburring and polishing. Beyond mere efficiency gains, the impact of low burr width extends to crucial domains, particularly in biomedical applications, where enhanced precision directly correlates with heightened biocompatibility. Similarly, within aerospace, the resulting smoother surfaces contribute to increased component reliability. The amalgamation of these outcomes underscores the direct and multifaceted contributions of low burr width, advancing not only manufacturing efficiency but also safety and performance within these critical industries. This research underscores the pivotal role of burr width optimization in enhancing the overall efficacy and reliability of micro-milled titanium components in biomedical and aerospace applications. Table 7 presents the ANOVA results for burr width in the context of down milling in micro-machining. The primary factor exerting a notable influence on the variability of burr width was identified as the feed rate (F µm/tooth), which contributed significantly with a substantial 55.20%. This was supported by a high F-value of 12.19 and a low p-value of 0.002, marking its statistical significance. This underscores the pivotal role of the feed rate in determining the width of burrs during down milling. In contrast, cutting speed (Vc m/min) exhibited a non-significant impact, contributing 8.94%, with an F-value of 1.97 and a p-value of 0.185. Similarly, the axial depth of cut (ap µm) was deemed non-significant, contributing 10.96%, with an F-value of 2.42 and a p-value of 0.135. The error term accounted for 24.91% of the variability, and the absence of a p-value indicated its contribution to be non-significant.
Figure 7 presents the main effects plot detailing the relationship between down milling burr width and chip load. Notably, a discernible inverse correlation was observed between burr width and the feed per tooth. As the feed per tooth increased, there was a concurrent decrease in burr width, reaching a minimum at a feed rate of 0.65 m/tooth. The trend of decreasing burr width with higher feed rates can be attributed to the influence of different material removal mechanisms. When feed rates were increased, the shearing mechanism became dominant, involving a cutting action that efficiently removed material and led to minimized burr formation. The cutting edges worked more effectively at higher feed rates, resulting in a cleaner cut and less plastic deformation, which is a key factor in burr formation. Conversely, lower feed rates favored the ploughing mechanism, where material is pushed aside rather than cleanly cut. This tended to induce more plastic deformation, contributing to the development of larger burrs. The interaction between the tool and the material became less effective at lower feed rates, promoting the formation of burrs. This observed trend aligns with previous studies, including high-speed micro-milling investigations, where an increase in feed rate led to a notable reduction in burr width. For instance, Bajpai et al. [2] reported a 4–35% decrease in burr width with an augmented feed rate. These trends align with research conducted on other titanium grades [42]. Cutting speed and depth of cut were insignificant factors for burr width. The standard deviation for burr width is displayed in Figure 8.

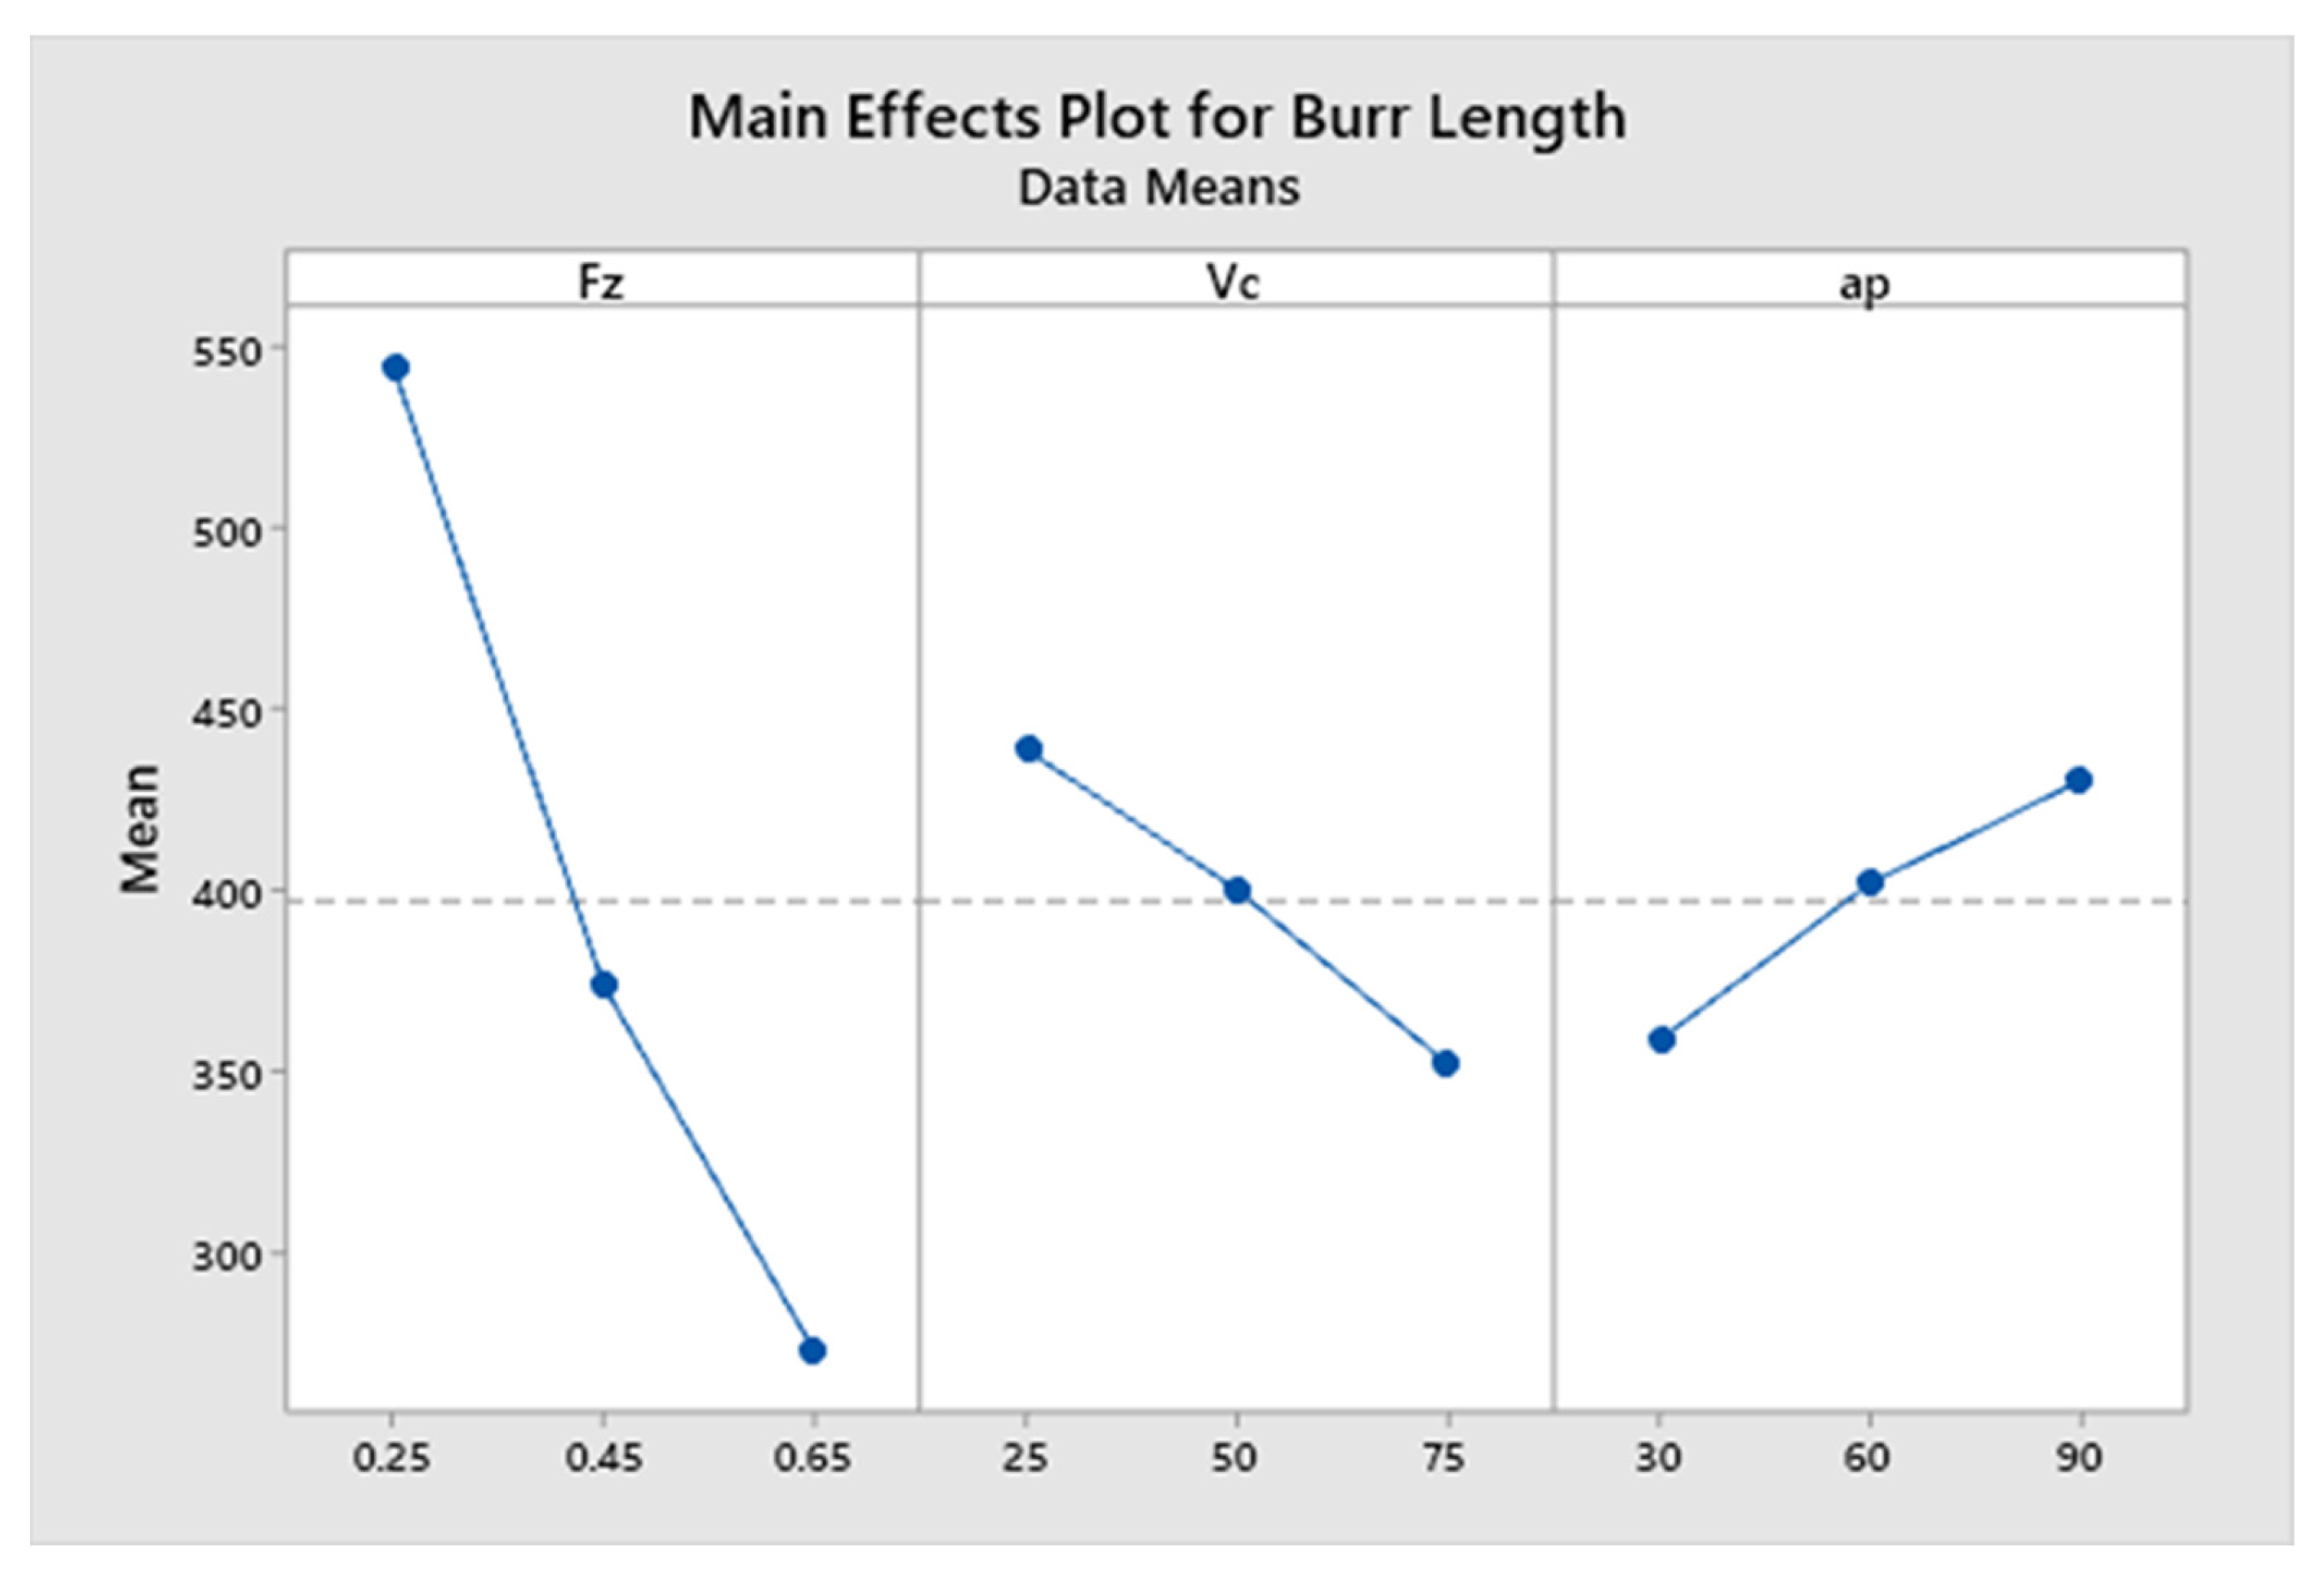
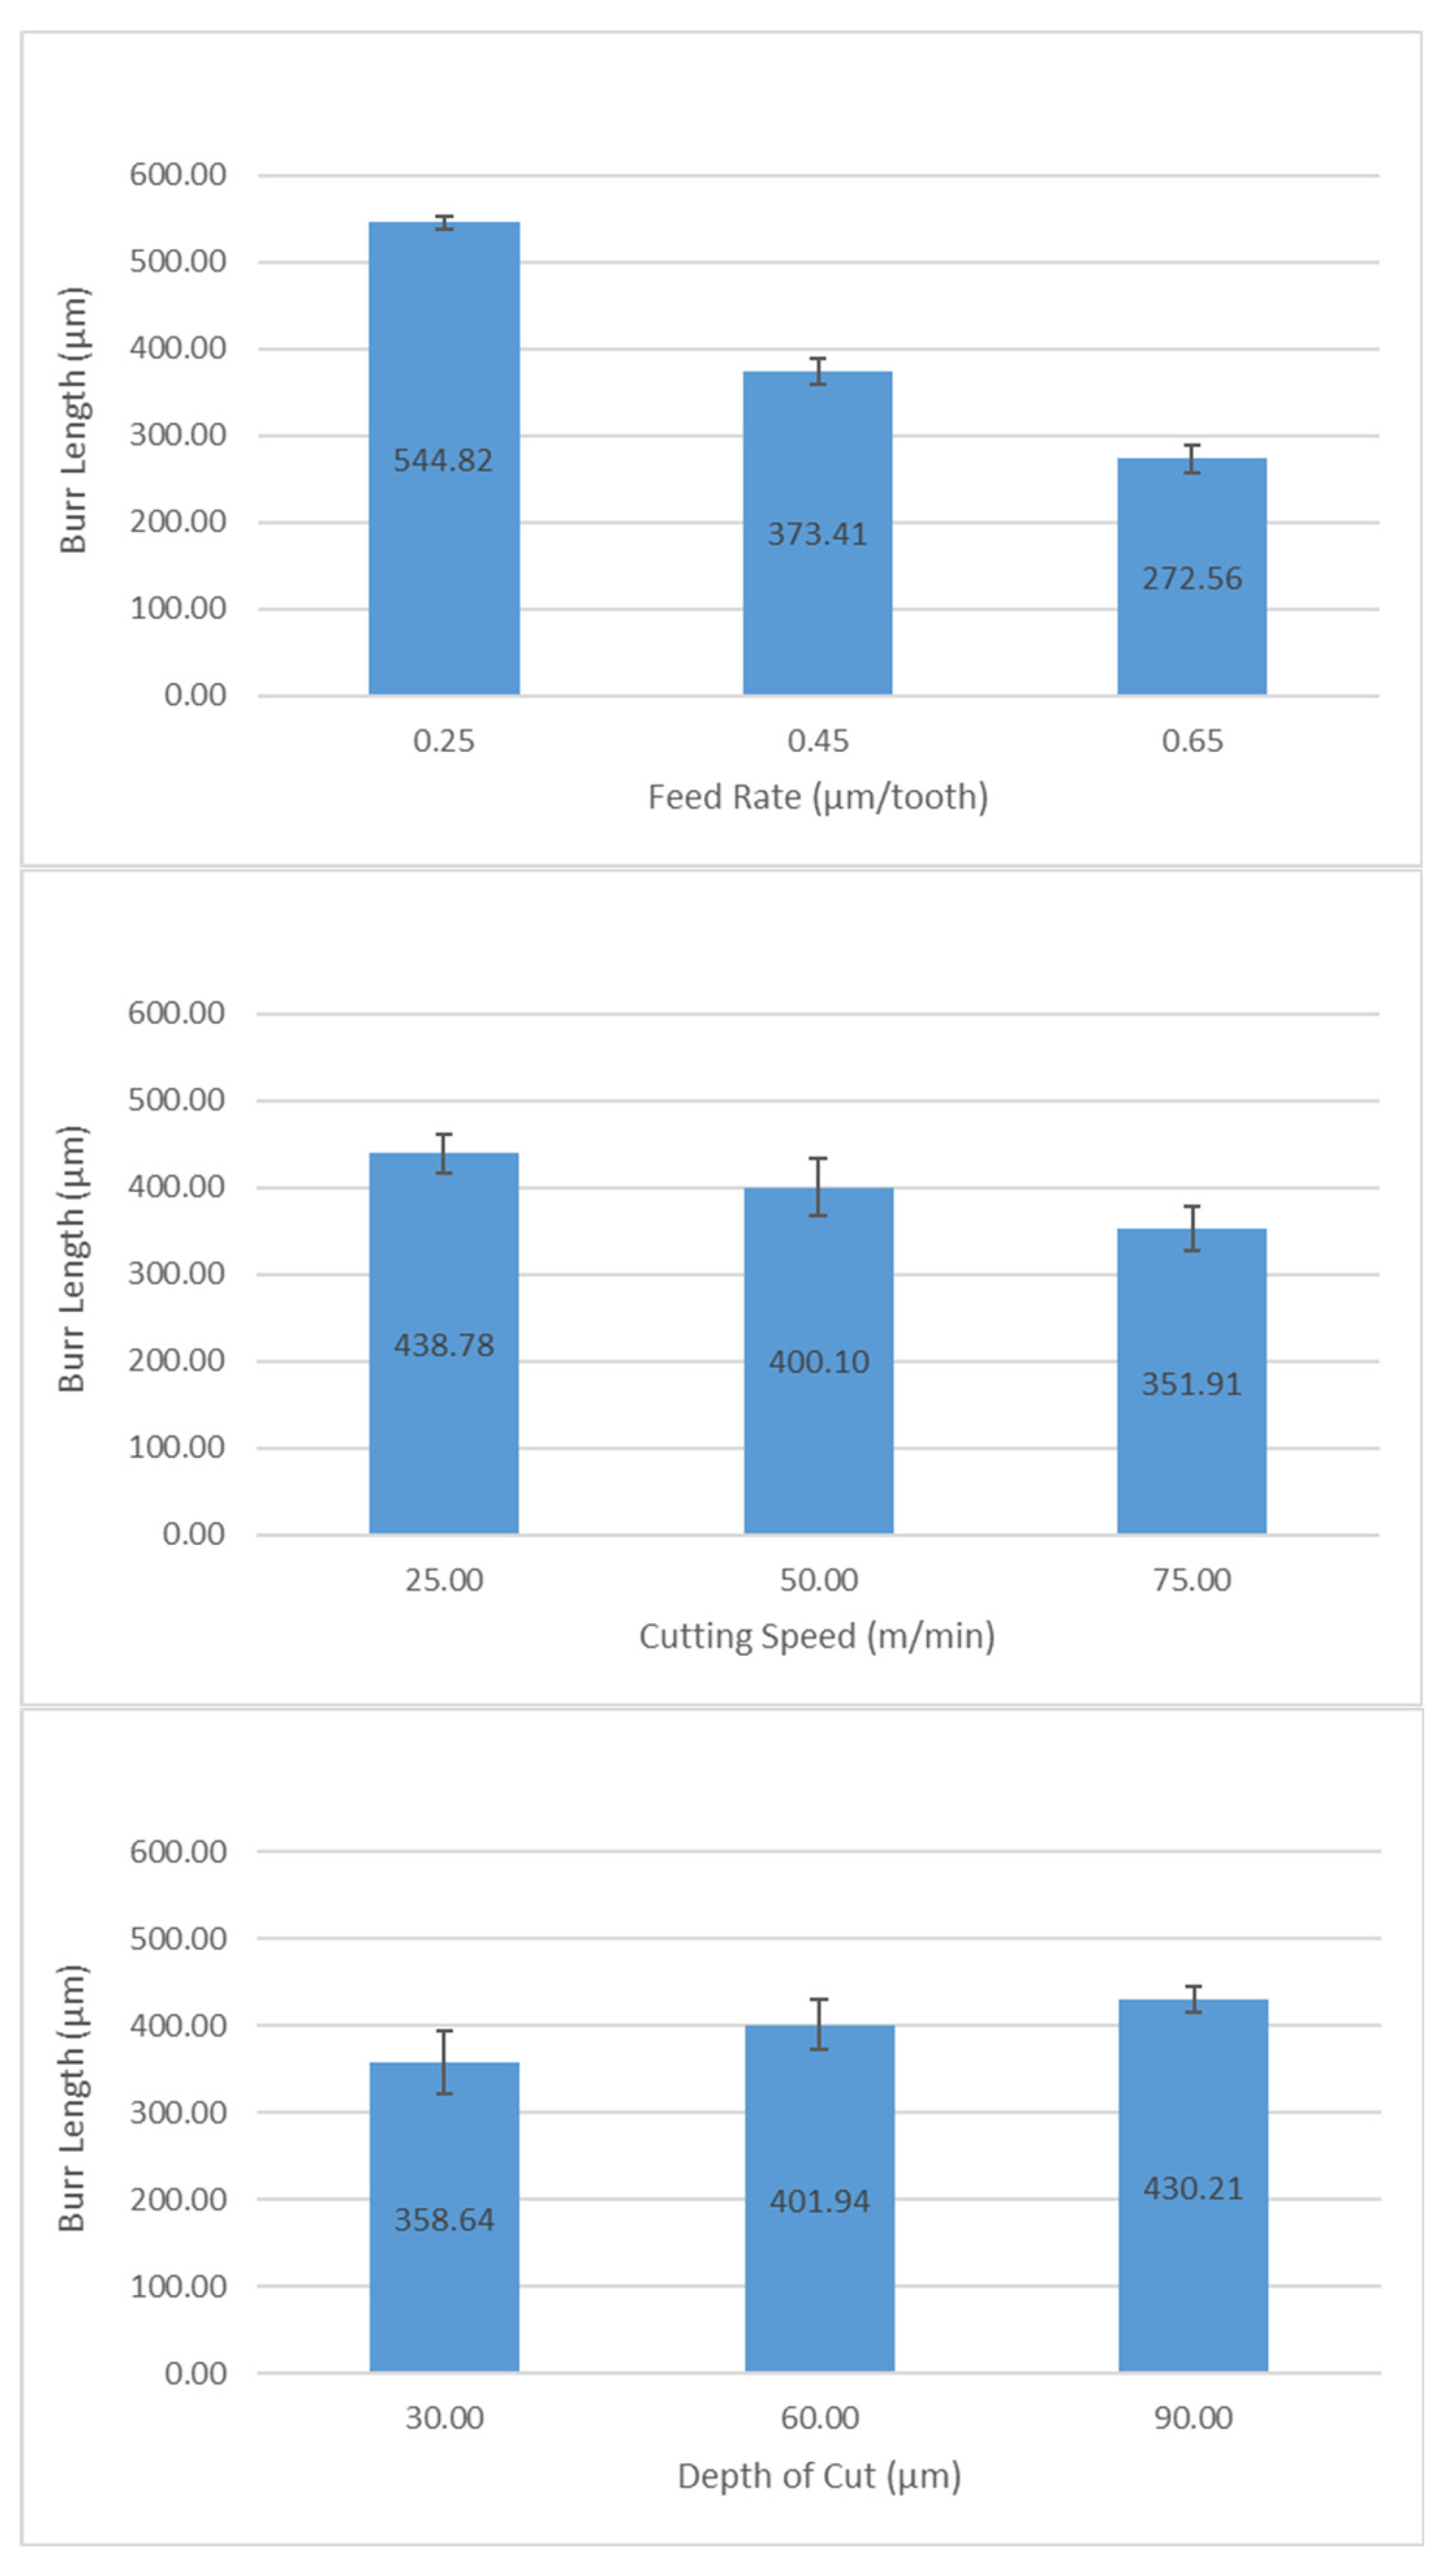
4.3. Burr Length (Down Milling)
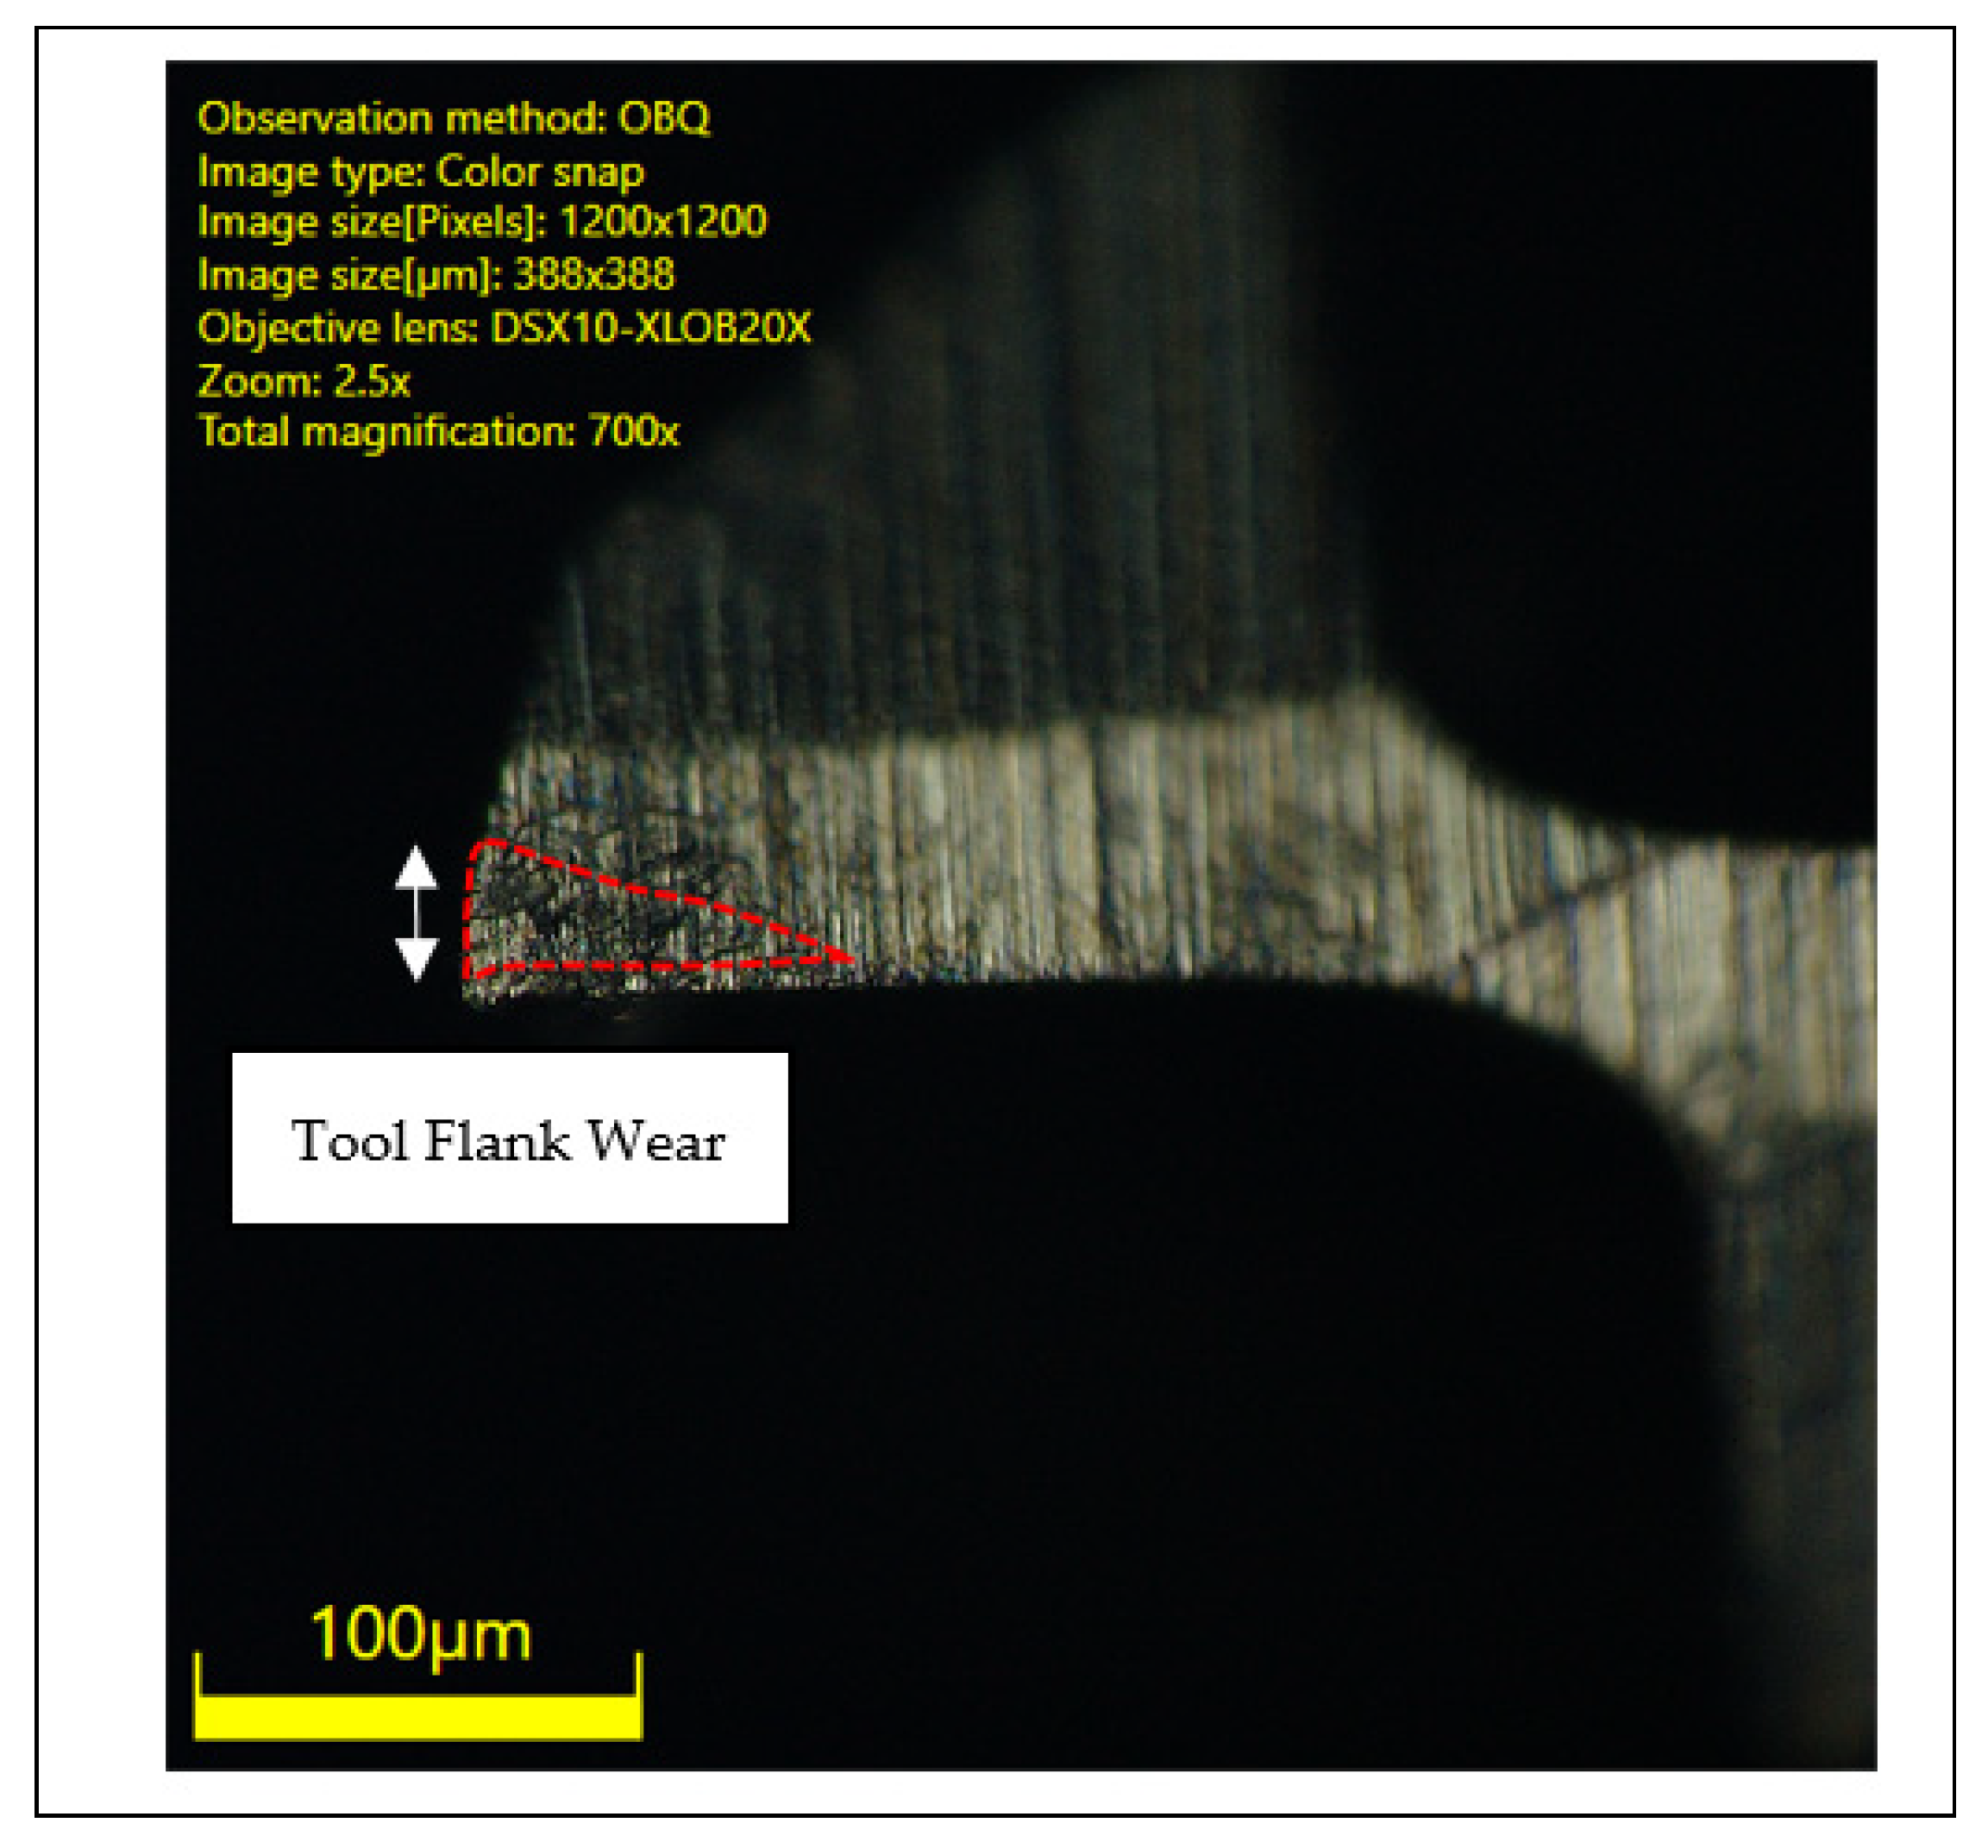
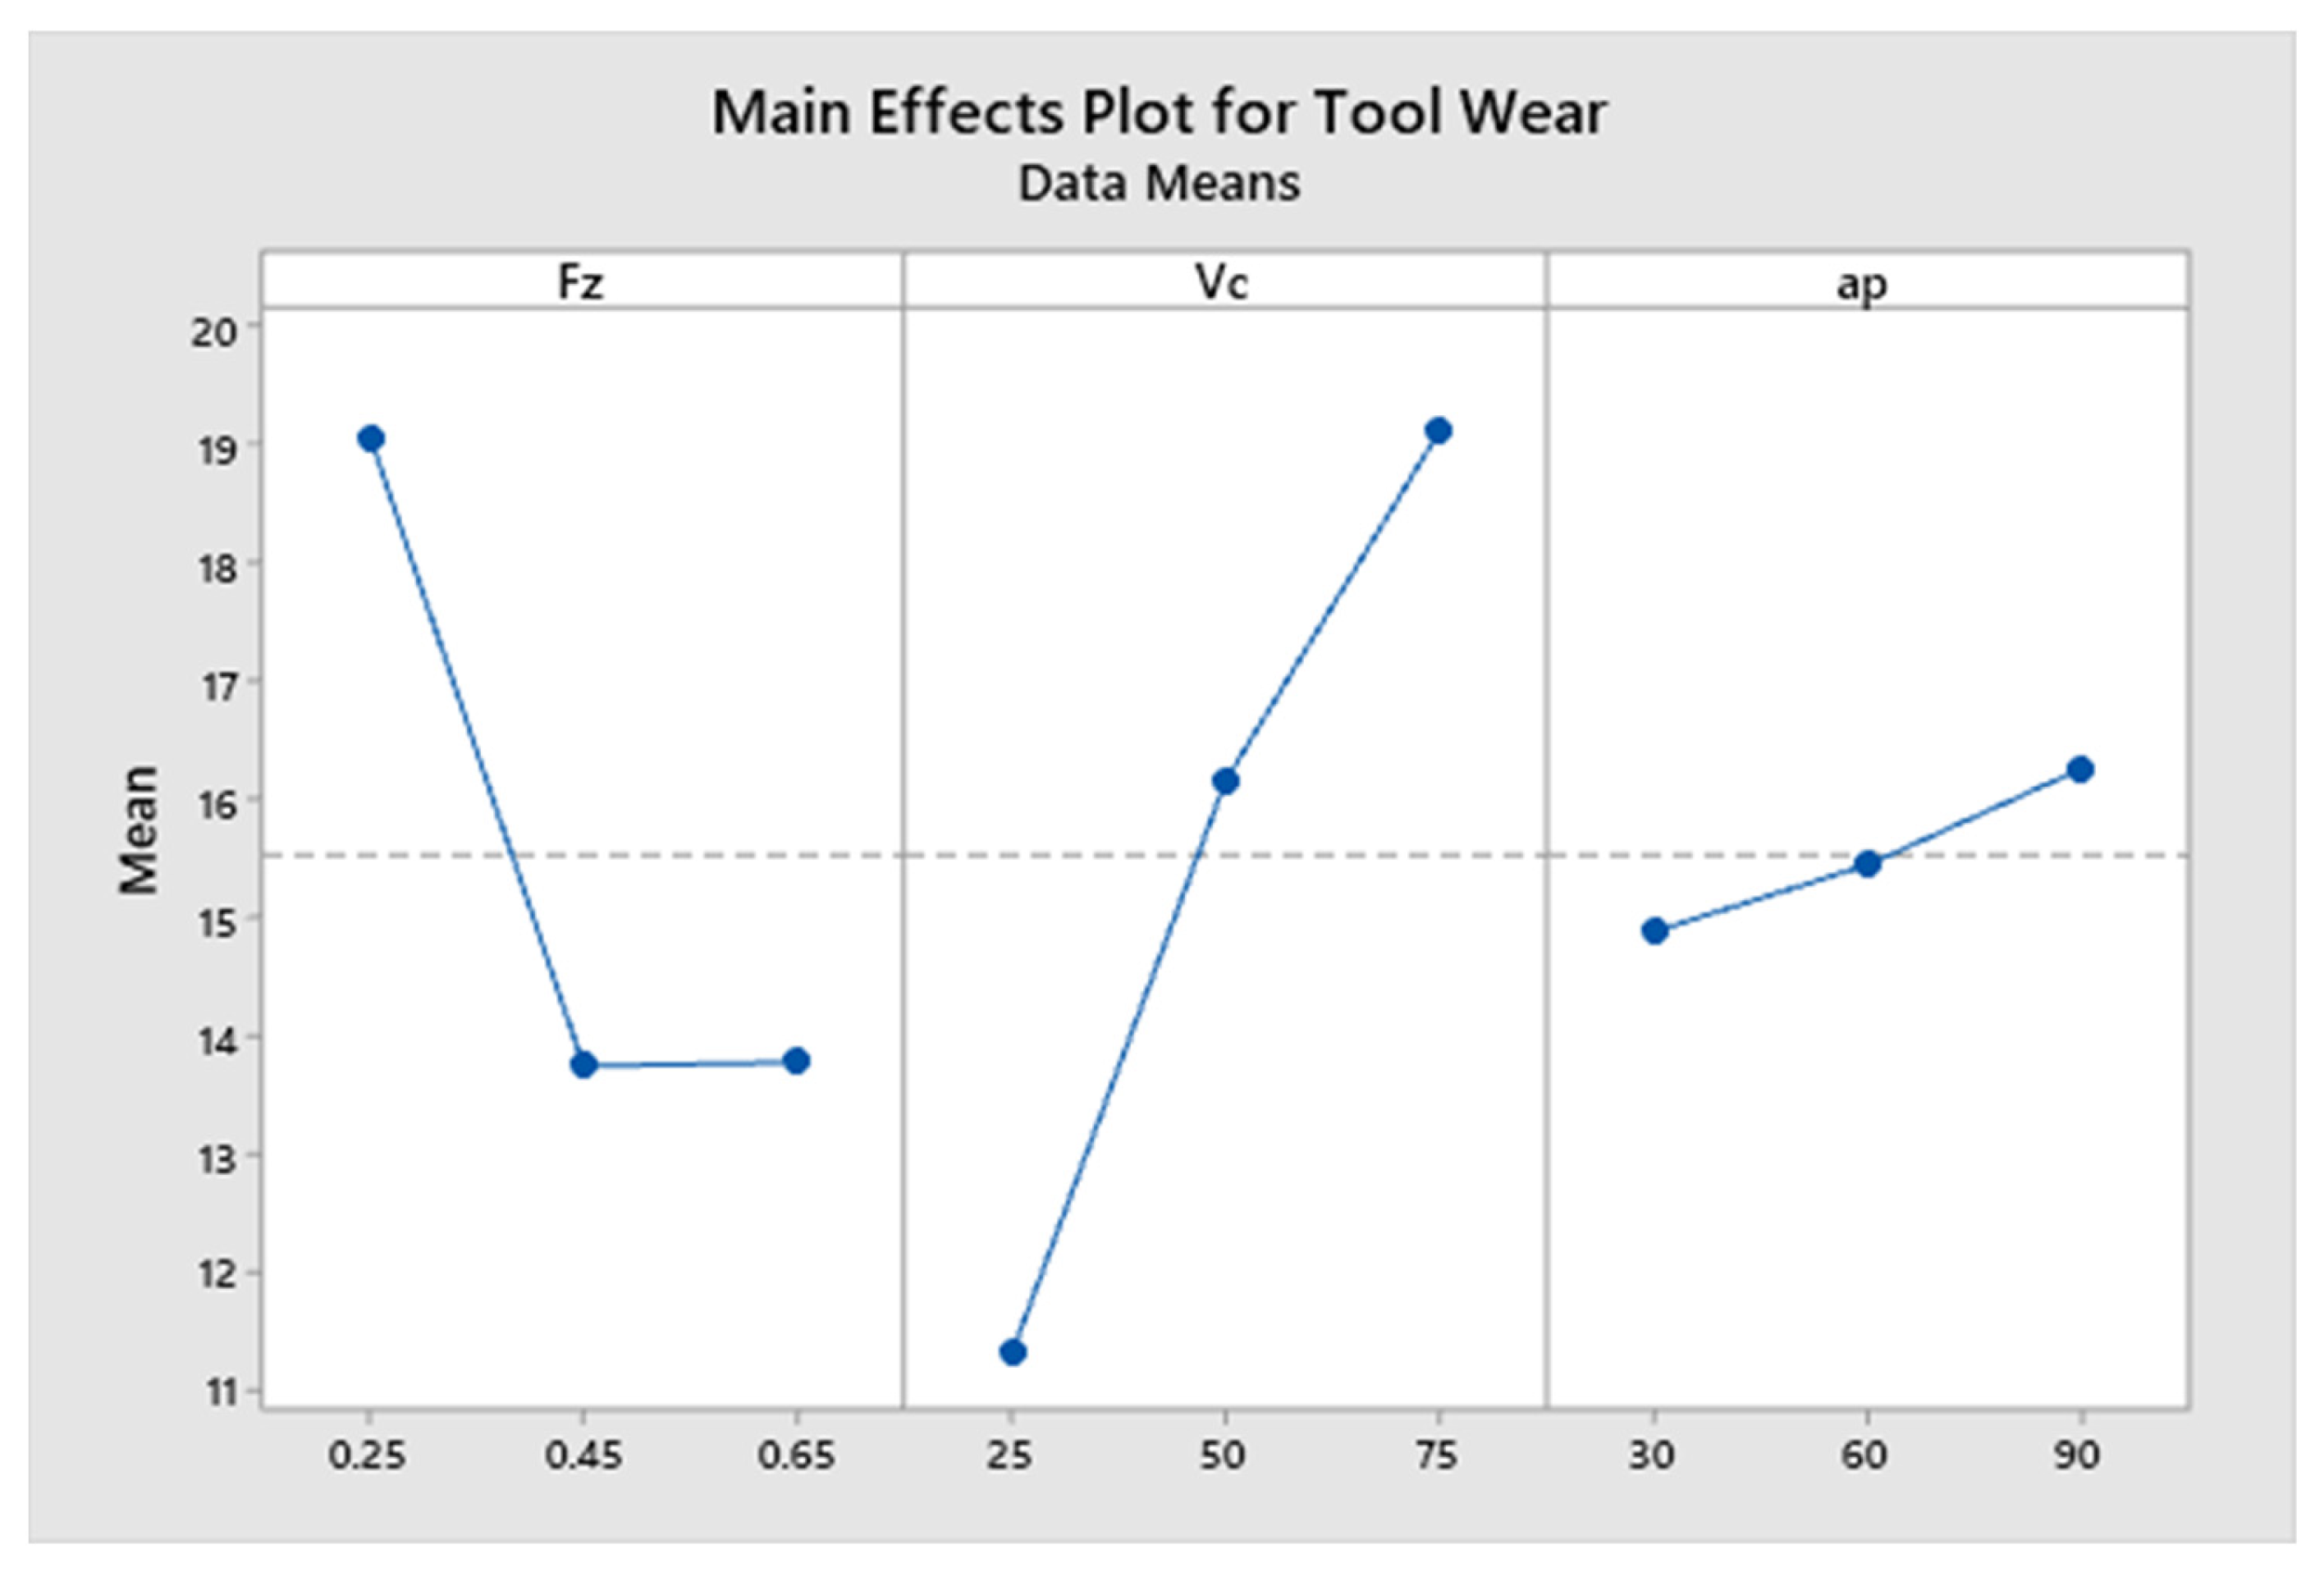
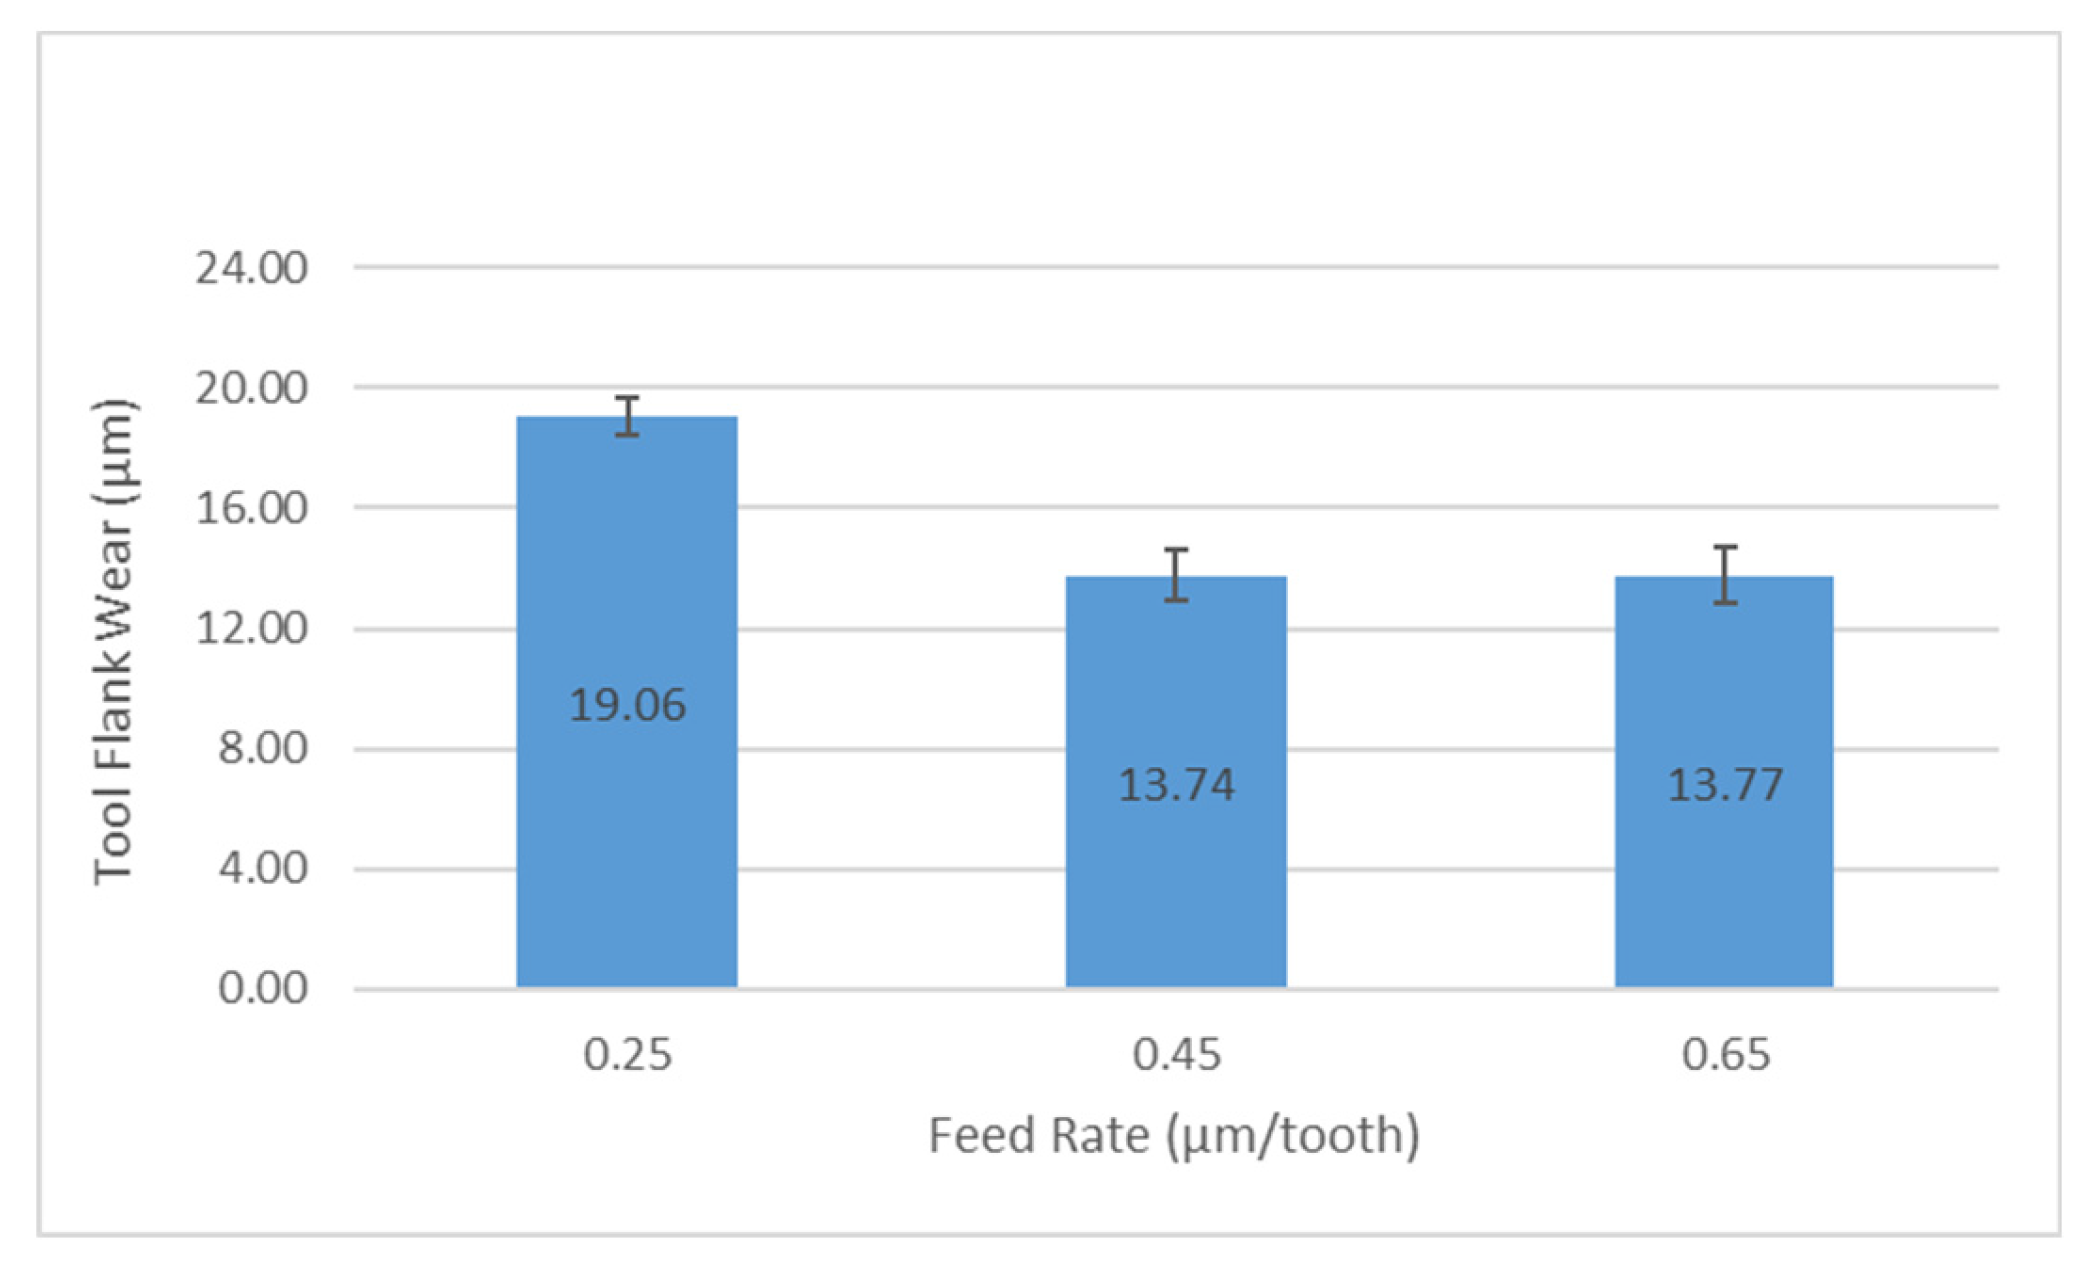
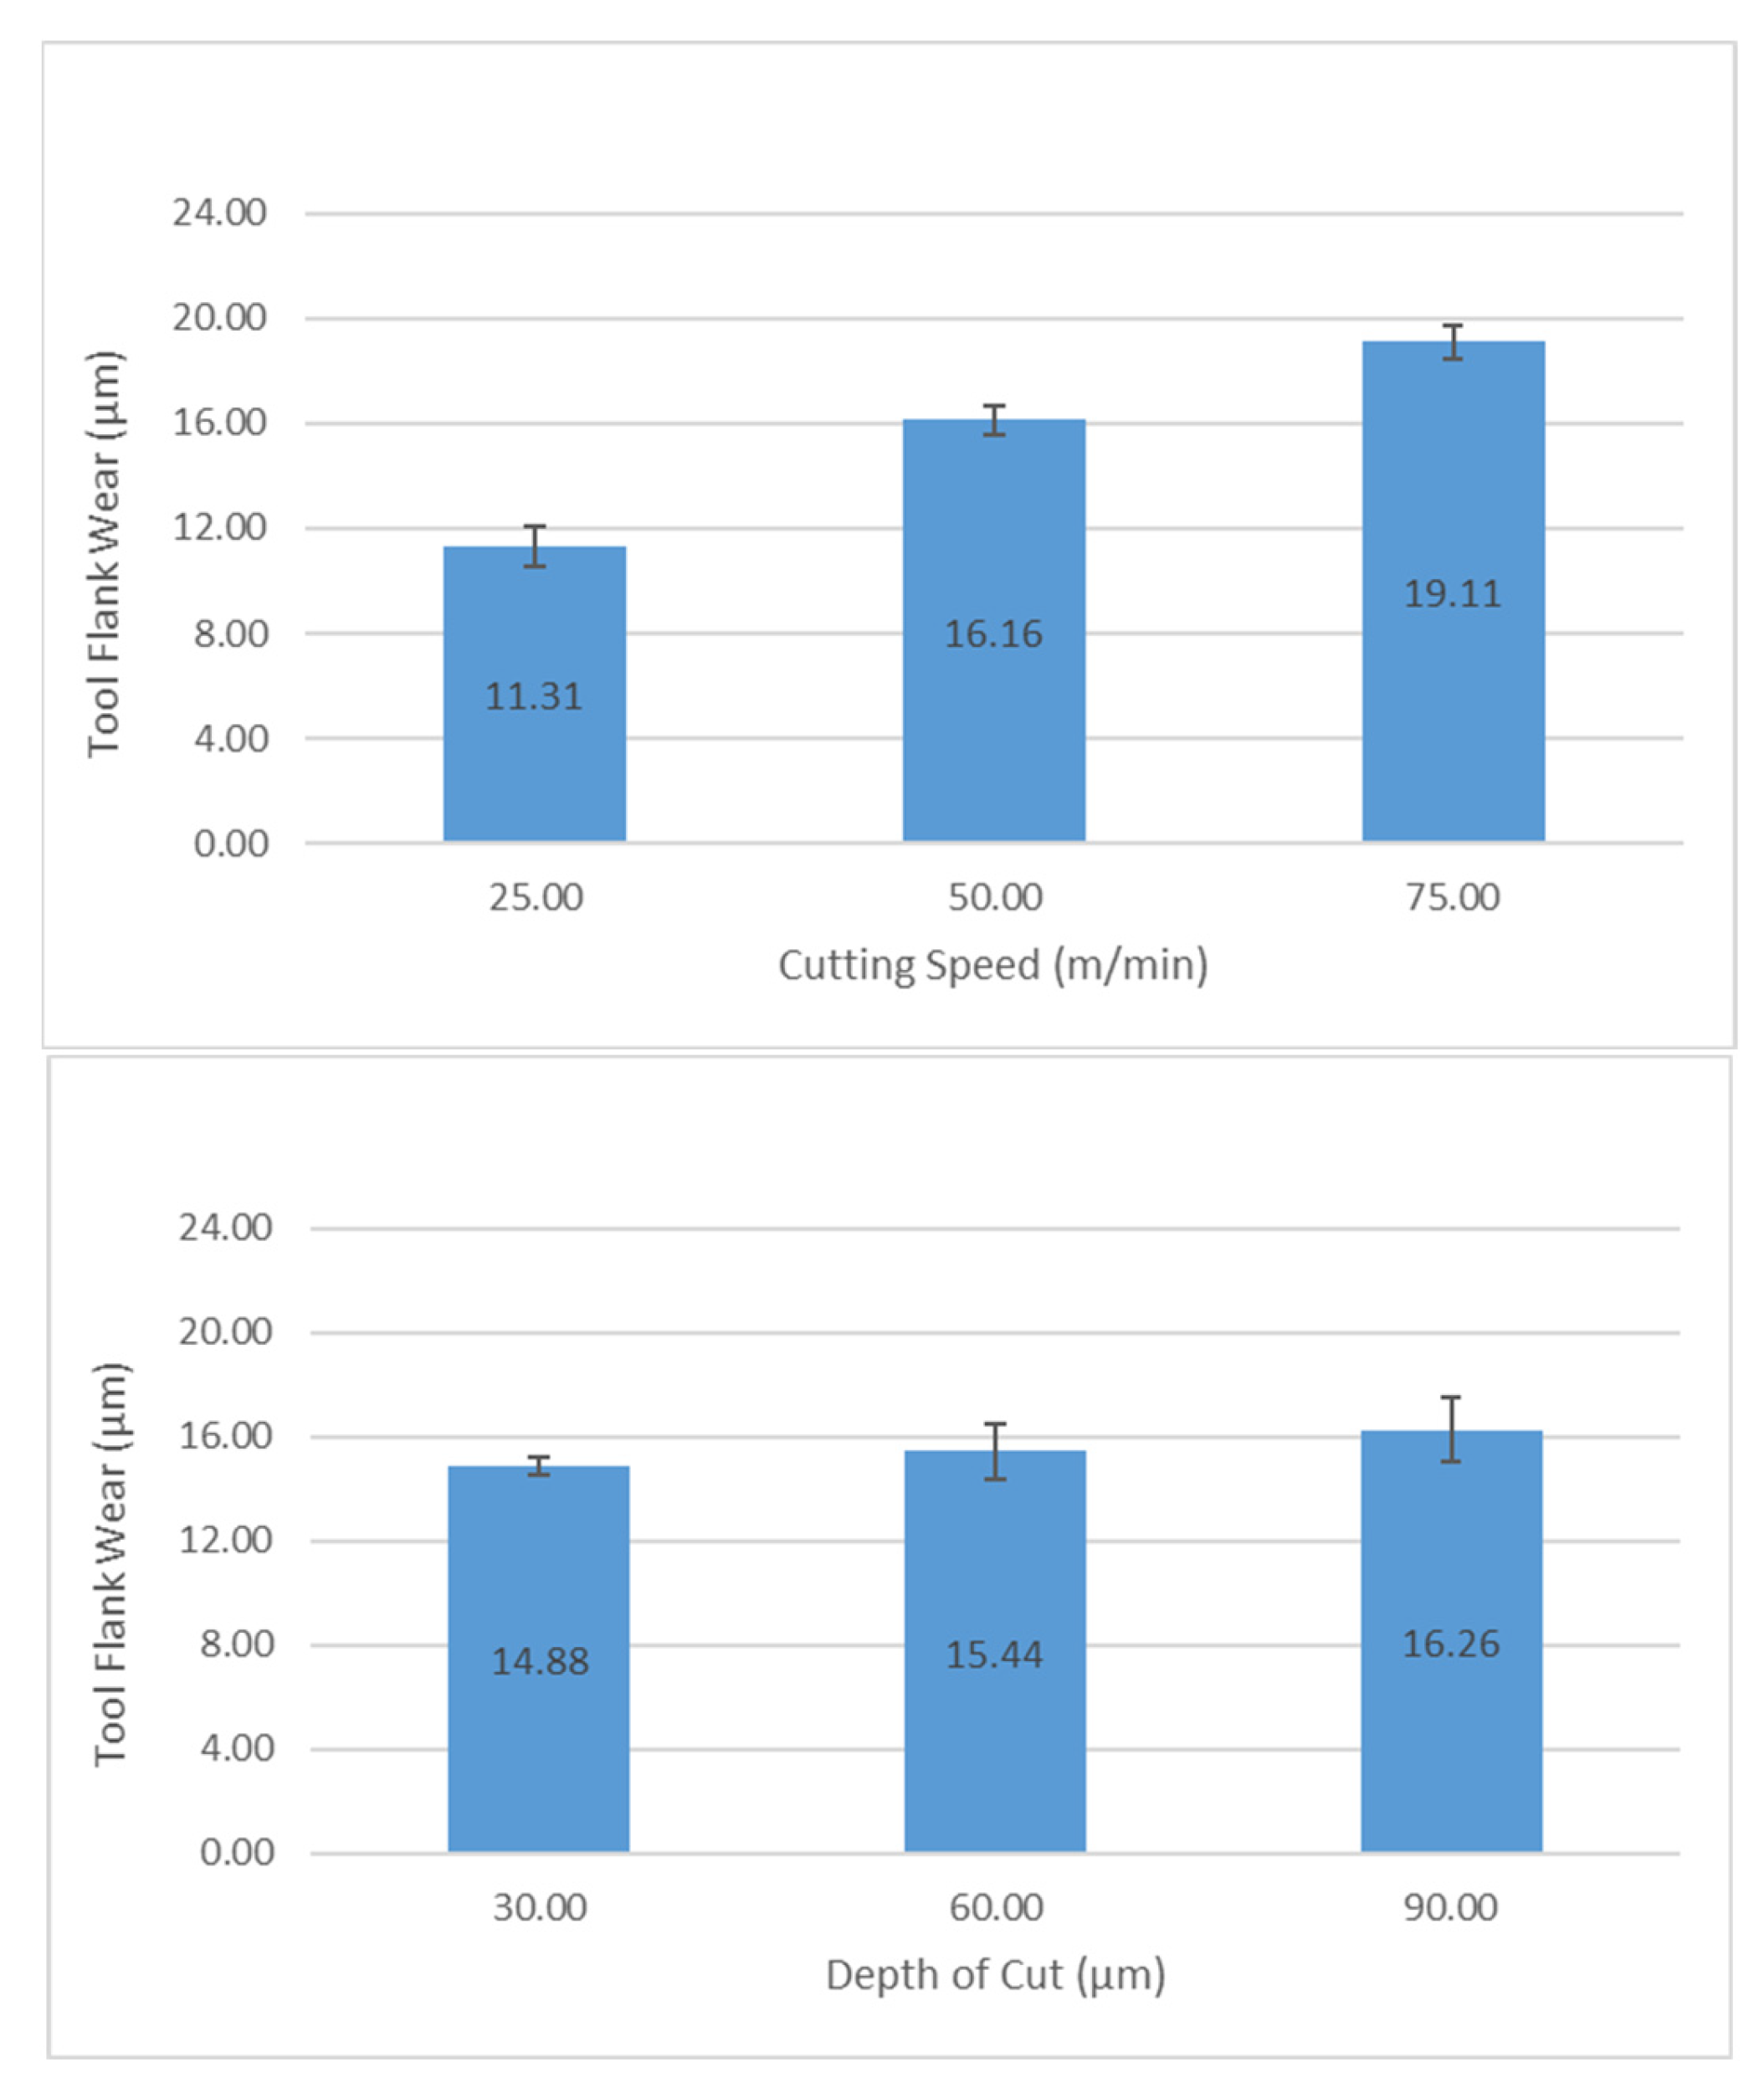
Table 8 provides the ANOVA results for burr length in the context of micro-milling. The foremost contributor to the variability in burr length was identified as the feed rate (F µm/tooth), contributing significantly with a substantial 77.70%. This was substantiated by a high F-value of 46.43 and an exceptionally low p-value of 0.000, underscoring its statistical significance. This emphasizes the crucial role of the feed rate in determining the length of burrs during micro-milling. Additionally, cutting speed (Vc m/min) was found to be a significant factor, contributing 7.77%, with an F-value of 4.64 and a p-value of 0.035. This suggests that variations in cutting speed have a discernible impact on burr length. In contrast, the axial depth of cut (ap µm) was deemed non-significant, contributing 5.33% and with a p-value of 0.081. The error term accounted for 9.20% of the variability.
Figure 9 illustrates the main effects plot for burr length. It is evident that burr length was inversely related to feed rate; as feed rate increased, burr length decreased. This phenomenon is explained by the dominance of the ploughing mechanism at lower feed rates, causing plastic deformation and resulting in larger burr size. Conversely, at higher feed rates, the shearing mechanism predominated, leading to smaller burr lengths due to burr chipping. It is also evident from Figure 8 that burr length decreased with increasing cutting speed. Higher cutting speeds generally resulted in reduced material deformation. As the cutting tool moved through the material at a faster rate, there was less time for the material to deform plastically. This reduction in plastic deformation contributed to a decrease in the formation of burrs. Moreover, higher cutting speeds promoted more efficient chip formation, which in turn optimized the burr length. The increased speed allowed the tool to cut through the material with a cleaner shearing action, resulting in well-defined chips instead of material being pushed or dragged, which is associated with burr formation. The standard deviation for burr length is displayed in Figure 10.

4.4. Tool Wear

Table 9 provides the results of the analysis of variance (ANOVA) for tool wear, which assessed the contributions and significance of specific machining parameters on tool wear. The table outlines the contributions of three key parameters: feed rate (F) in µm/tooth, cutting speed (Vc) in m/min, and depth of cut (ap) in µm. Among these parameters, both feed rate (F) and cutting speed (Vc) made substantial contributions, at 33.18% and 54.02%, respectively, indicating their significant impact on tool wear. This significance was further supported by the low p-values of 0.001 and 0.000 (both less than 0.05) for feed rate (F) and cutting speed (Vc), respectively, demonstrating their importance in influencing tool wear. In contrast, the depth of cut (ap) was considered non-significant, as its p-value was relatively high, at 0.466, suggesting that it had a limited effect on tool wear in the conducted experiments. This ANOVA analysis helps identify the primary parameters influencing tool wear, providing valuable insights into the research findings. Tool wear in the milling of titanium alloys typically initiates rapidly, which is primarily attributed to the elevated temperatures encountered and the strong adhesion of the material to the cutting tools, as outlined in previous research [43]. The main effects plots presented in Figure 11 visually illustrate the primary influences on tool flank wear. Notably, a clear and direct correlation emerged between the cutting velocity and the magnitude of tool wear. As cutting velocity increased, there was a simultaneous increase in tool flank wear. This observed phenomenon is attributed to the generation and accumulation of thermal energy during the cutting process, ultimately leading to elevated cutting temperatures. The direct relationship depicted in the main effects plots underscores the significance of cutting velocity as a determining factor in the extent of tool wear during the milling of titanium alloys. The standard deviation for tool wear is displayed in Figure 12.
Elevated cutting temperatures represent a significant contributing factor to the swift onset of tool wear when machining titanium alloys [44]. In addition, previous research has indicated that higher cutting speeds result in a rapid rubbing action between the cutting tool and the workpiece, which generates heat that softens the tool’s flank face, consequently leading to increased abrasive wear [45]. Moreover, the increase in cutting speed during milling operations not only amplifies the frequency of tool edge entry into the workpiece but also intensifies the energy of the impact between the cutting edge and the workpiece, underscoring the pivotal role of cutting speed, particularly as the tool nears the end of its operational life [46]. The main effects plot further demonstrates that tool wear decreased with an increase in feed rate. Lower feed rates tended to be dominated by the ploughing mechanism, resulting in elevated tool wear. This phenomenon is closely related to the cutting-edge radius and its impact on shear and ploughing forces, as elucidated in other studies. Below the minimum chip thickness, both ploughing force and specific cutting force exhibited significant increases, culminating in heightened forces during micro-milling. It is also worth noting that tool wear declined when the feed rate transitioned from 0.45 µm/tooth to 0.90 µm/tooth.

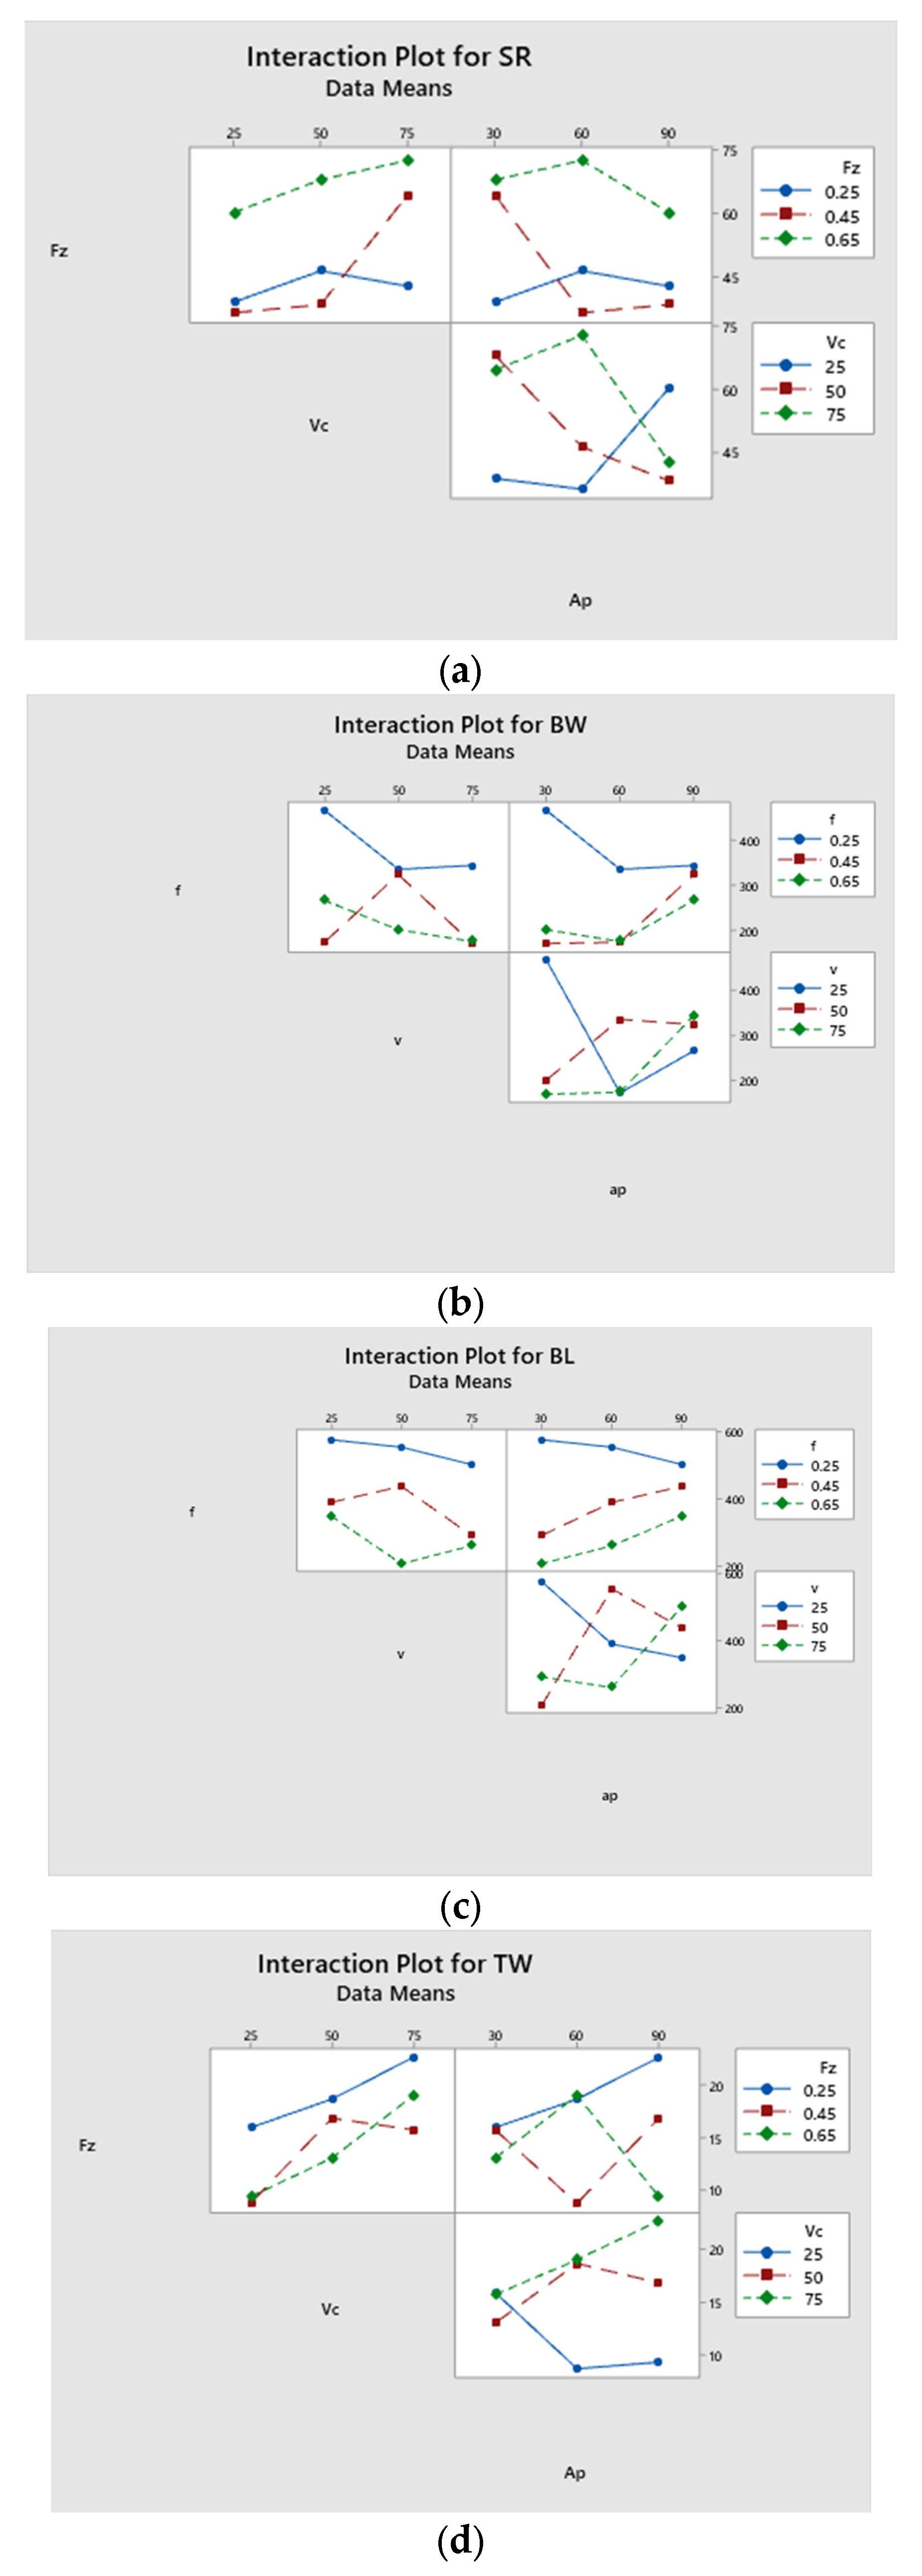
4.5. Parameter Interaction Analysis

In the next step, interaction plots were drawn among the input variables to analyze their interactional effect, contrary to their individual effects, as discussed for the main effects plot in Section 4.1, Section 4.2, Section 4.3 and Section 4.4. Figure 13 shows the graphical results in terms of output responses of the interacting terms, i.e., fz, Vc, and ap. The non-parallel lines representing input variables demonstrate the interaction between different combinations, including fz*Vc, fz*ap, and Vc*ap. The intensity of influence of each combination was different, as represented by their p-values, given in Table 10. The results of the interaction plot lead toward the goal of the optimization of process responses using the preferred combination of input variables, as covered in the next section.

4.6. Confirmatory Tests

Confirmatory tests were carried out on the Taguchi design of experimentation to validate the authenticity of the achieved results. In this research, tool wear, surface roughness, and burr size were analyzed using a “smaller is better” model. The desired values of these input parameters, as determined from the input parameters in the main effects plot in Section 4, are presented in Table 11. Subsequently, validation experiments were conducted under these conditions, as presented in Table 12. It can be seen that an experiment was already carried out on one out of the eight machining parameter combinations during the initial design of the experiment (L9 orthogonal array). The rest of the conditions were run three times each. It was observed that all best and worst output response conditions yielded corroborative results. Figure 14 depicts the burr width value obtained from the optimal confirmatory test conditions, specifically at a feed rate of 0.65, a cutting velocity of 75 m/min, and an axial depth of cut set at 30 µm. The burr width was measured at 154.47 µm, which happened to be the lowest (optimized) burr width value, as expected. In comparison with the previous lowest value obtained during initial experimentation (at 0.45 fz, 25 Vc, 60 ap), 3.4% improvement was recorded. In Figure 15, the depicted data illustrate that a surface roughness of 32 µm was acquired under specific machining conditions of a feed rate of 0.25, a cutting velocity of 25 m/min, and an axial depth of cut set at 90 µm, which was 8.5% less than the initial best surface roughness value obtained at 0.45 fz, 25 Vc, and 60 ap.

5. Conclusions

Identifying key process variables (KPVs) plays a crucial role in reducing production costs and enhancing product quality. The current work focused on investigating three primary process parameters in the context of micro-milling titanium grade 9. Although there is an abundance of literature on the application and investigation of titanium grade 5, there is a notable gap in the research regarding the optimization of micro-machining parameters for titanium grade 9. Given that titanium grade 9 exhibits advantages over grade 5 in certain applications, this research aimed to uncover the critical process parameters specific to this grade. Titanium grade 9 exhibited improved surface finish below the tool edge radius. The following are the conclusions based on the research findings.
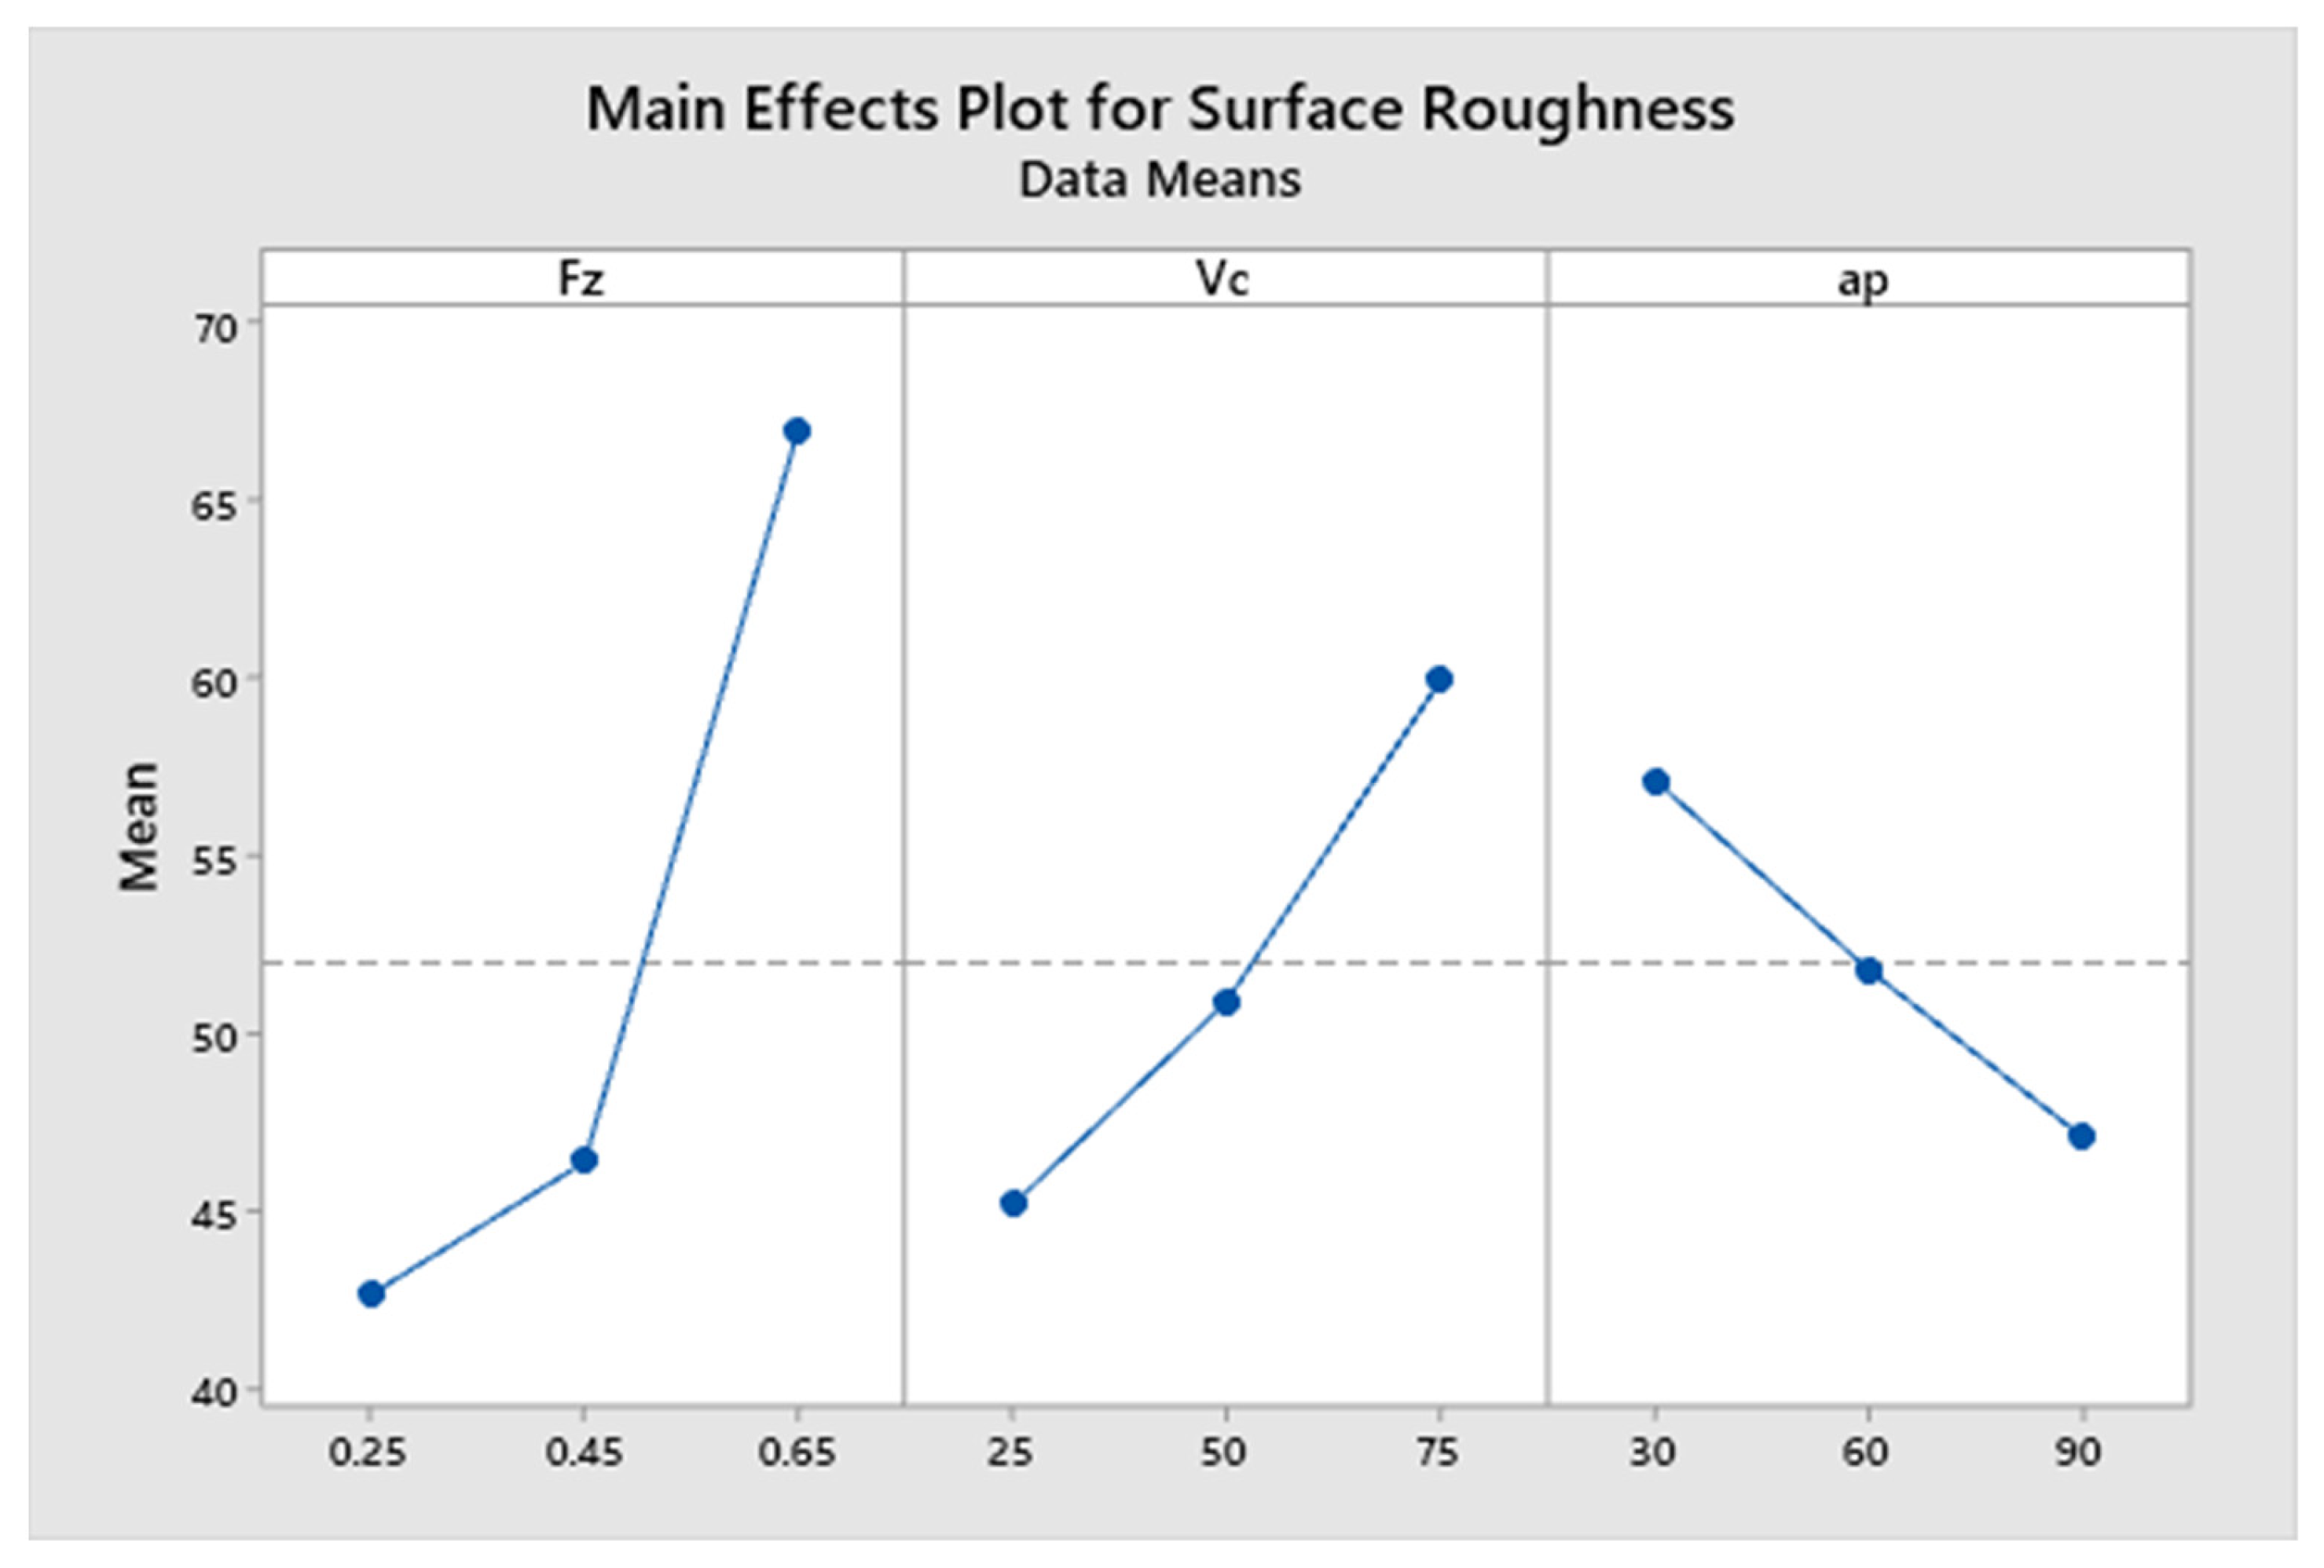
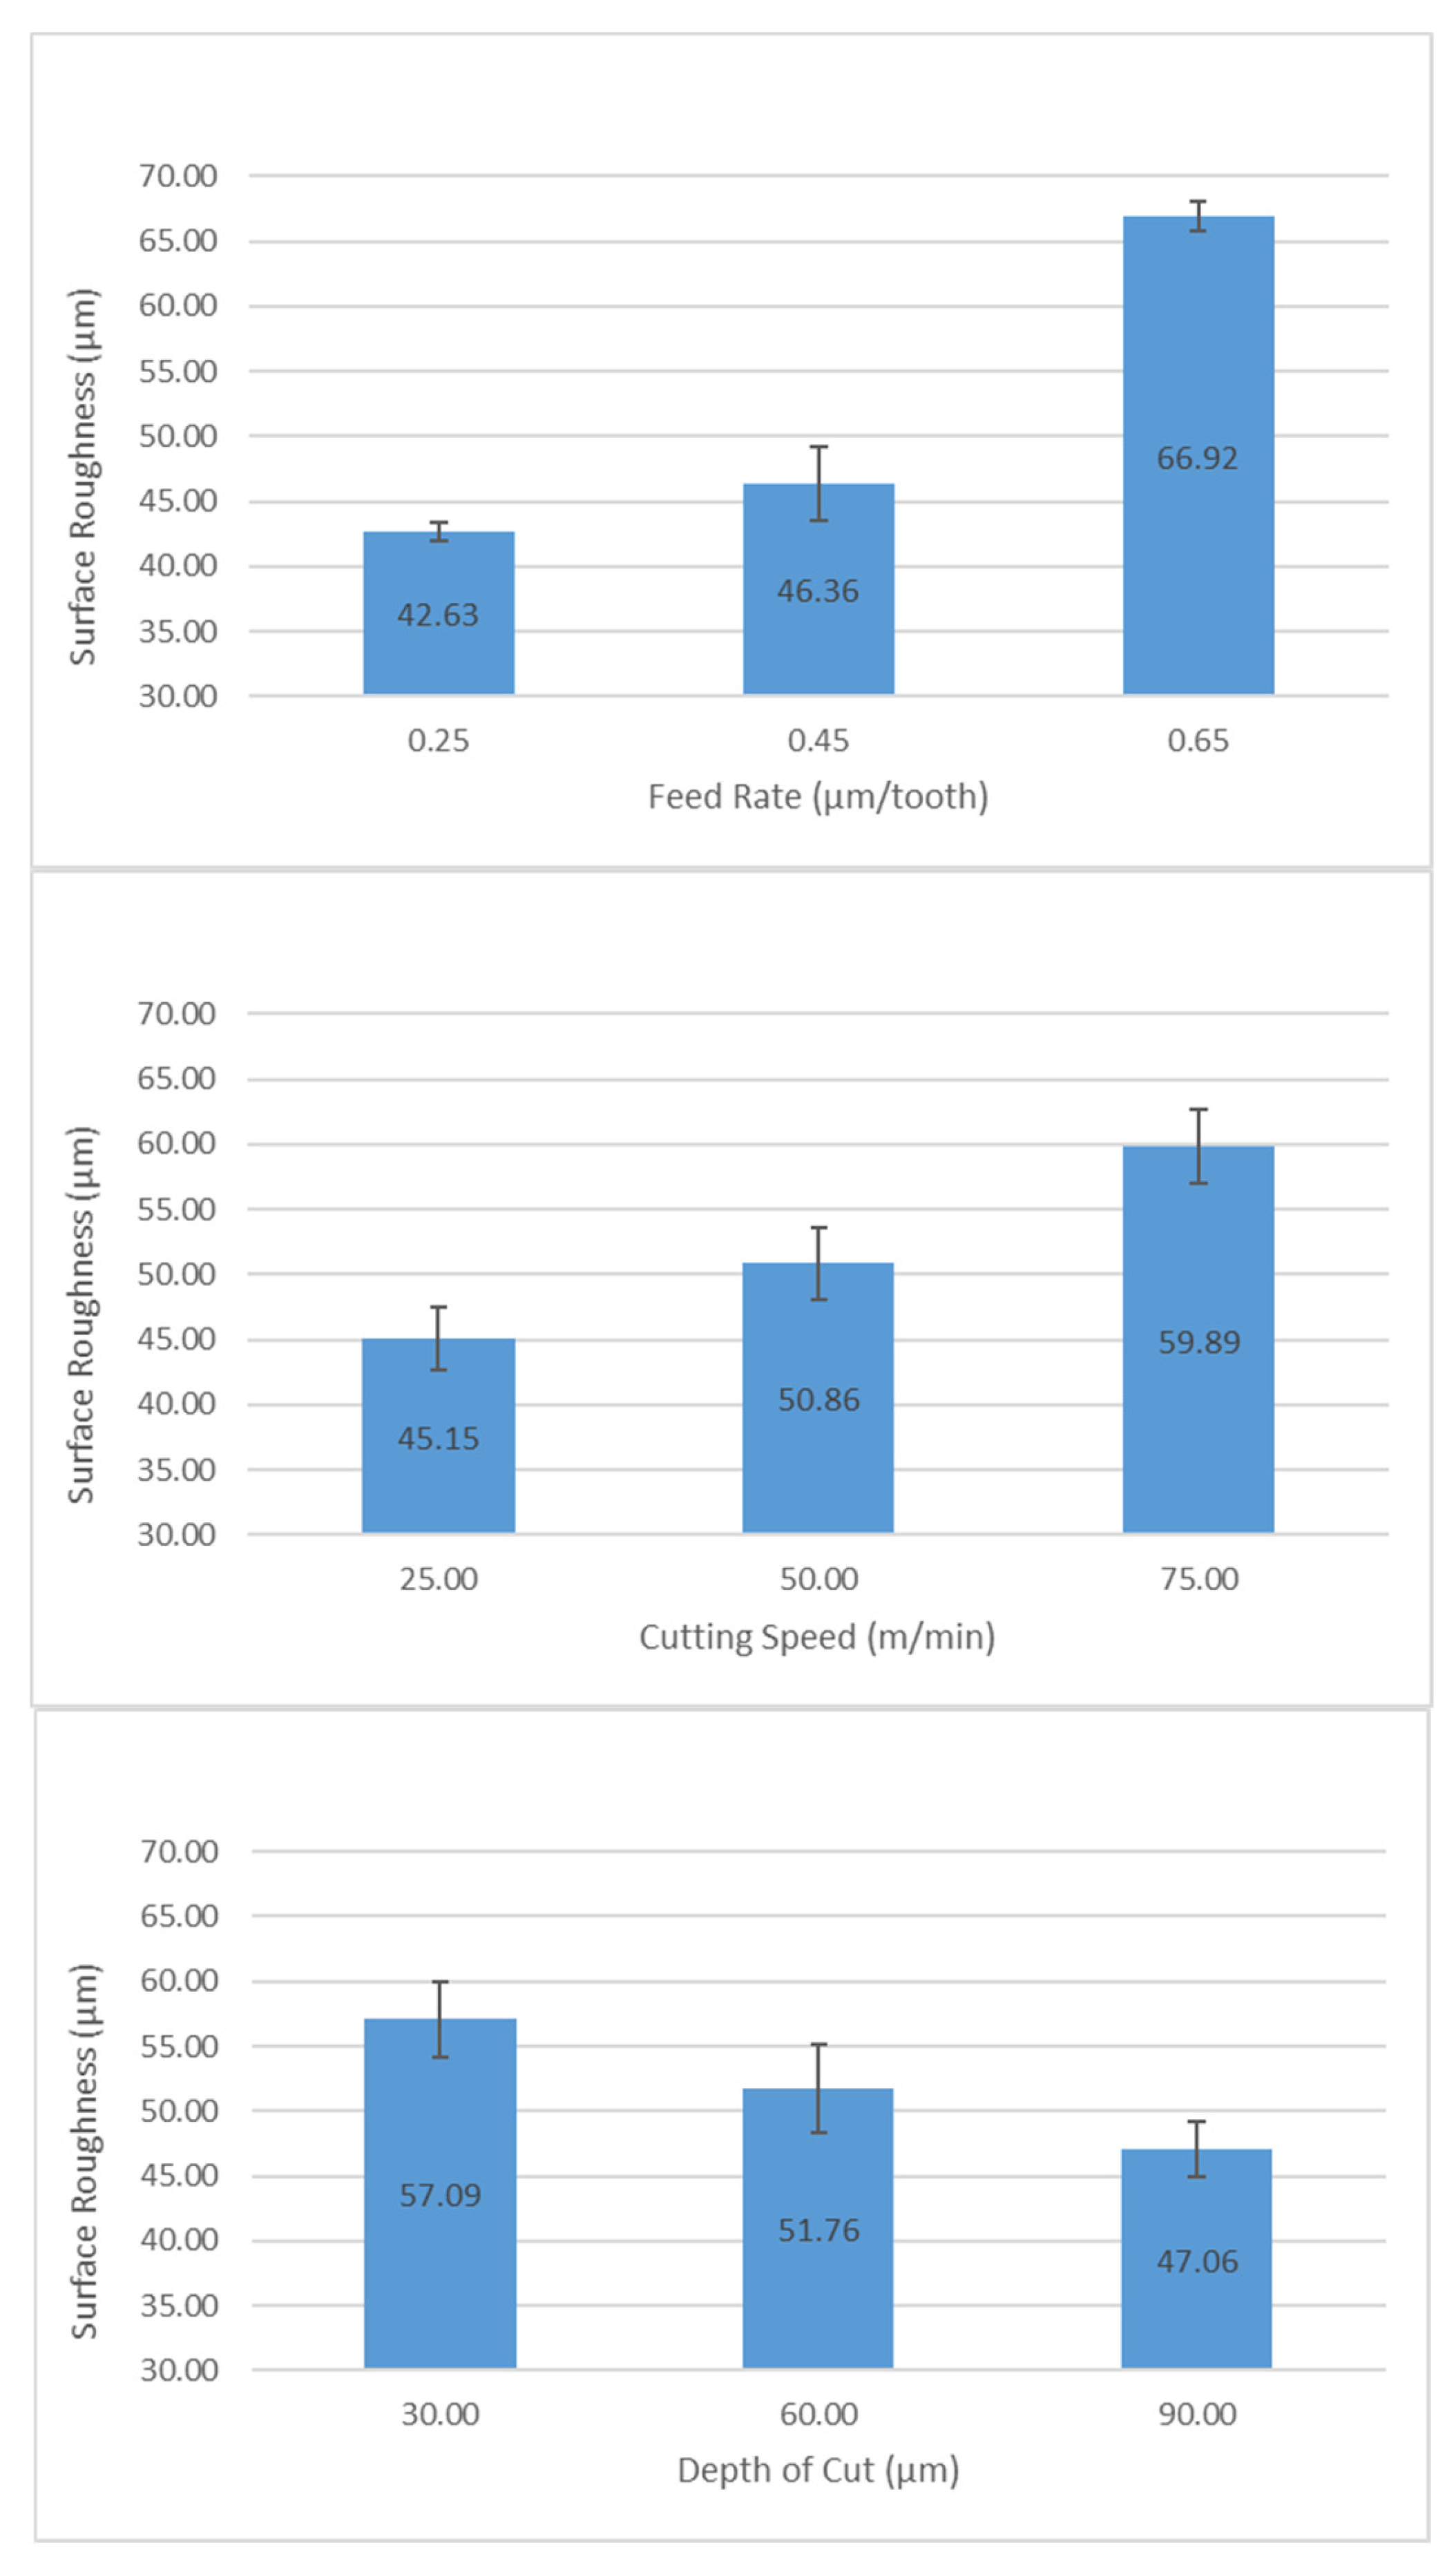
  • The surface integrity, which describes the product quality, was found to be dependent on all of the selected machining variables as identified in the analysis of variance. The feed rate was recognized to be the most significant member, with a contribution ratio of 62.69%.
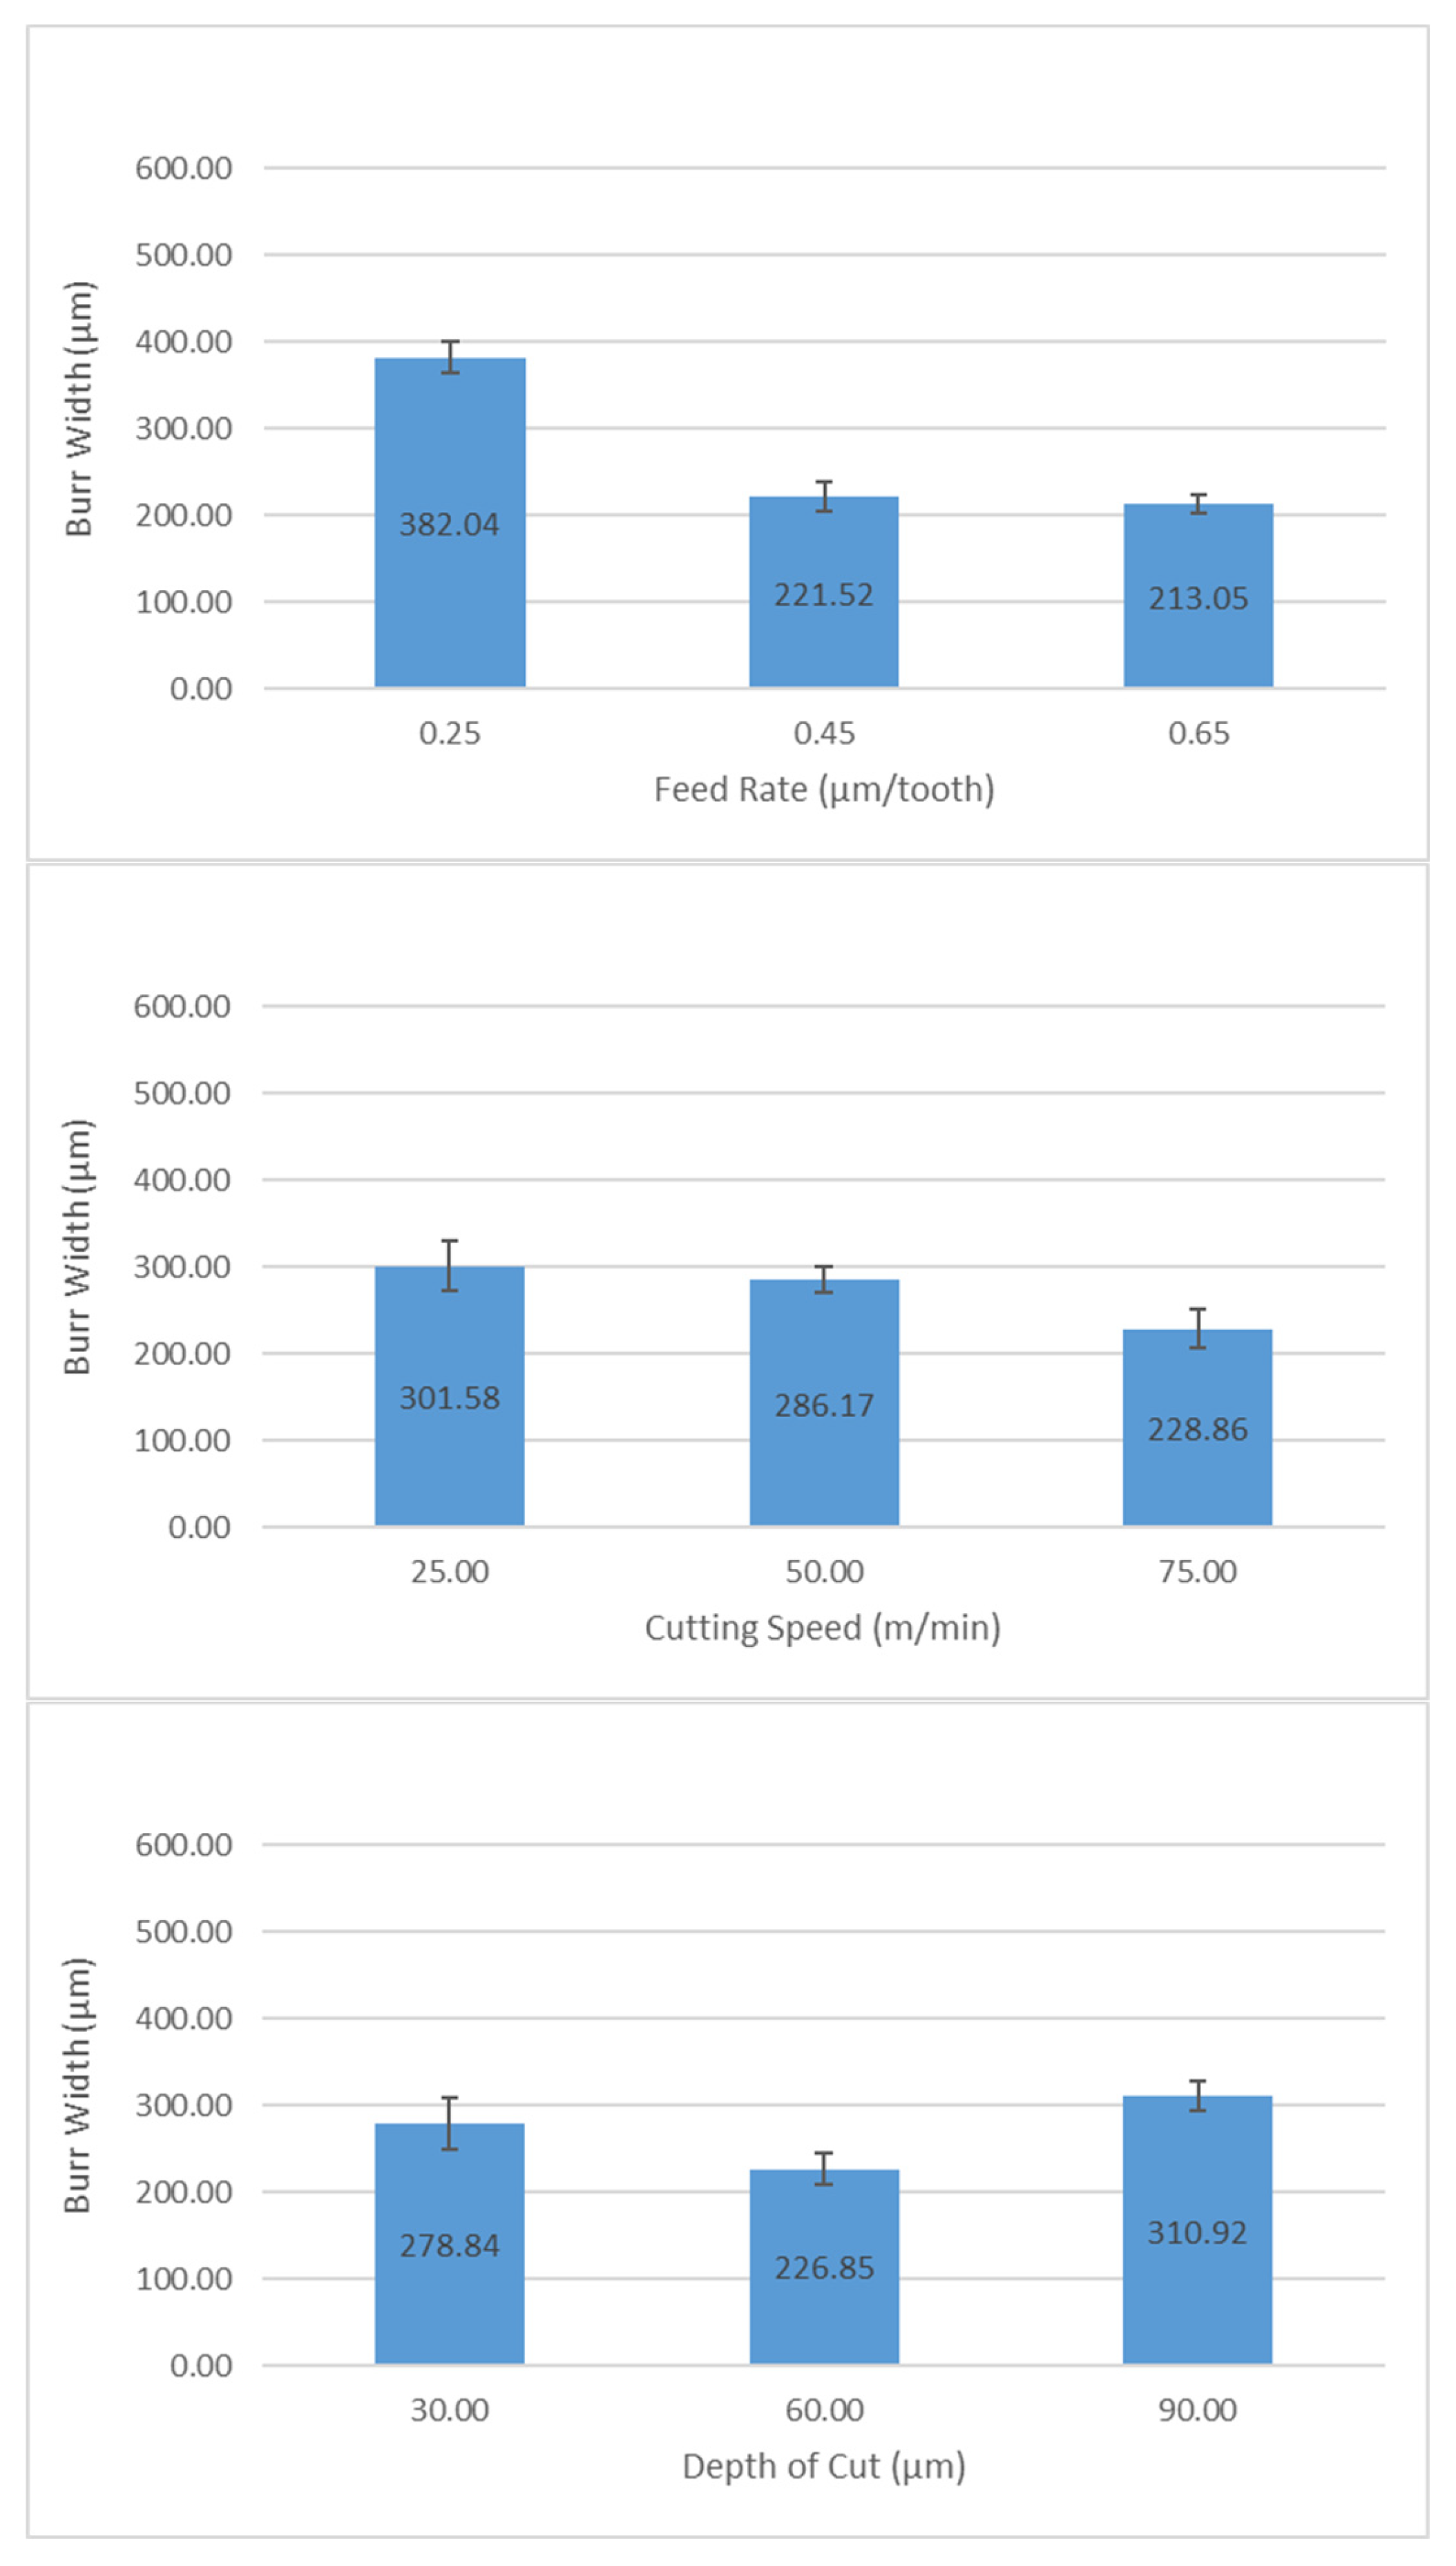
  • Burr width and burr length were determined to be mainly dependent on the feed rate, with contribution ratios of 55.20% and 77.70%, respectively. The reason for this occurrence was the shift of cutting mechanism from ploughing to shearing as the feed rate was increased, efficiently removing material and leading to minimized burr formation.
  • The collective contribution of cutting speed and feed rate, in the case of tool wear, was determined to be 87.20%, proving their relevance. Cutting speed determines the cutting zone temperature and thereby dictates the tool wear mechanisms, whereas feed rate controls the rate of heat dissipation, which is another vital aspect concerning tool wear.
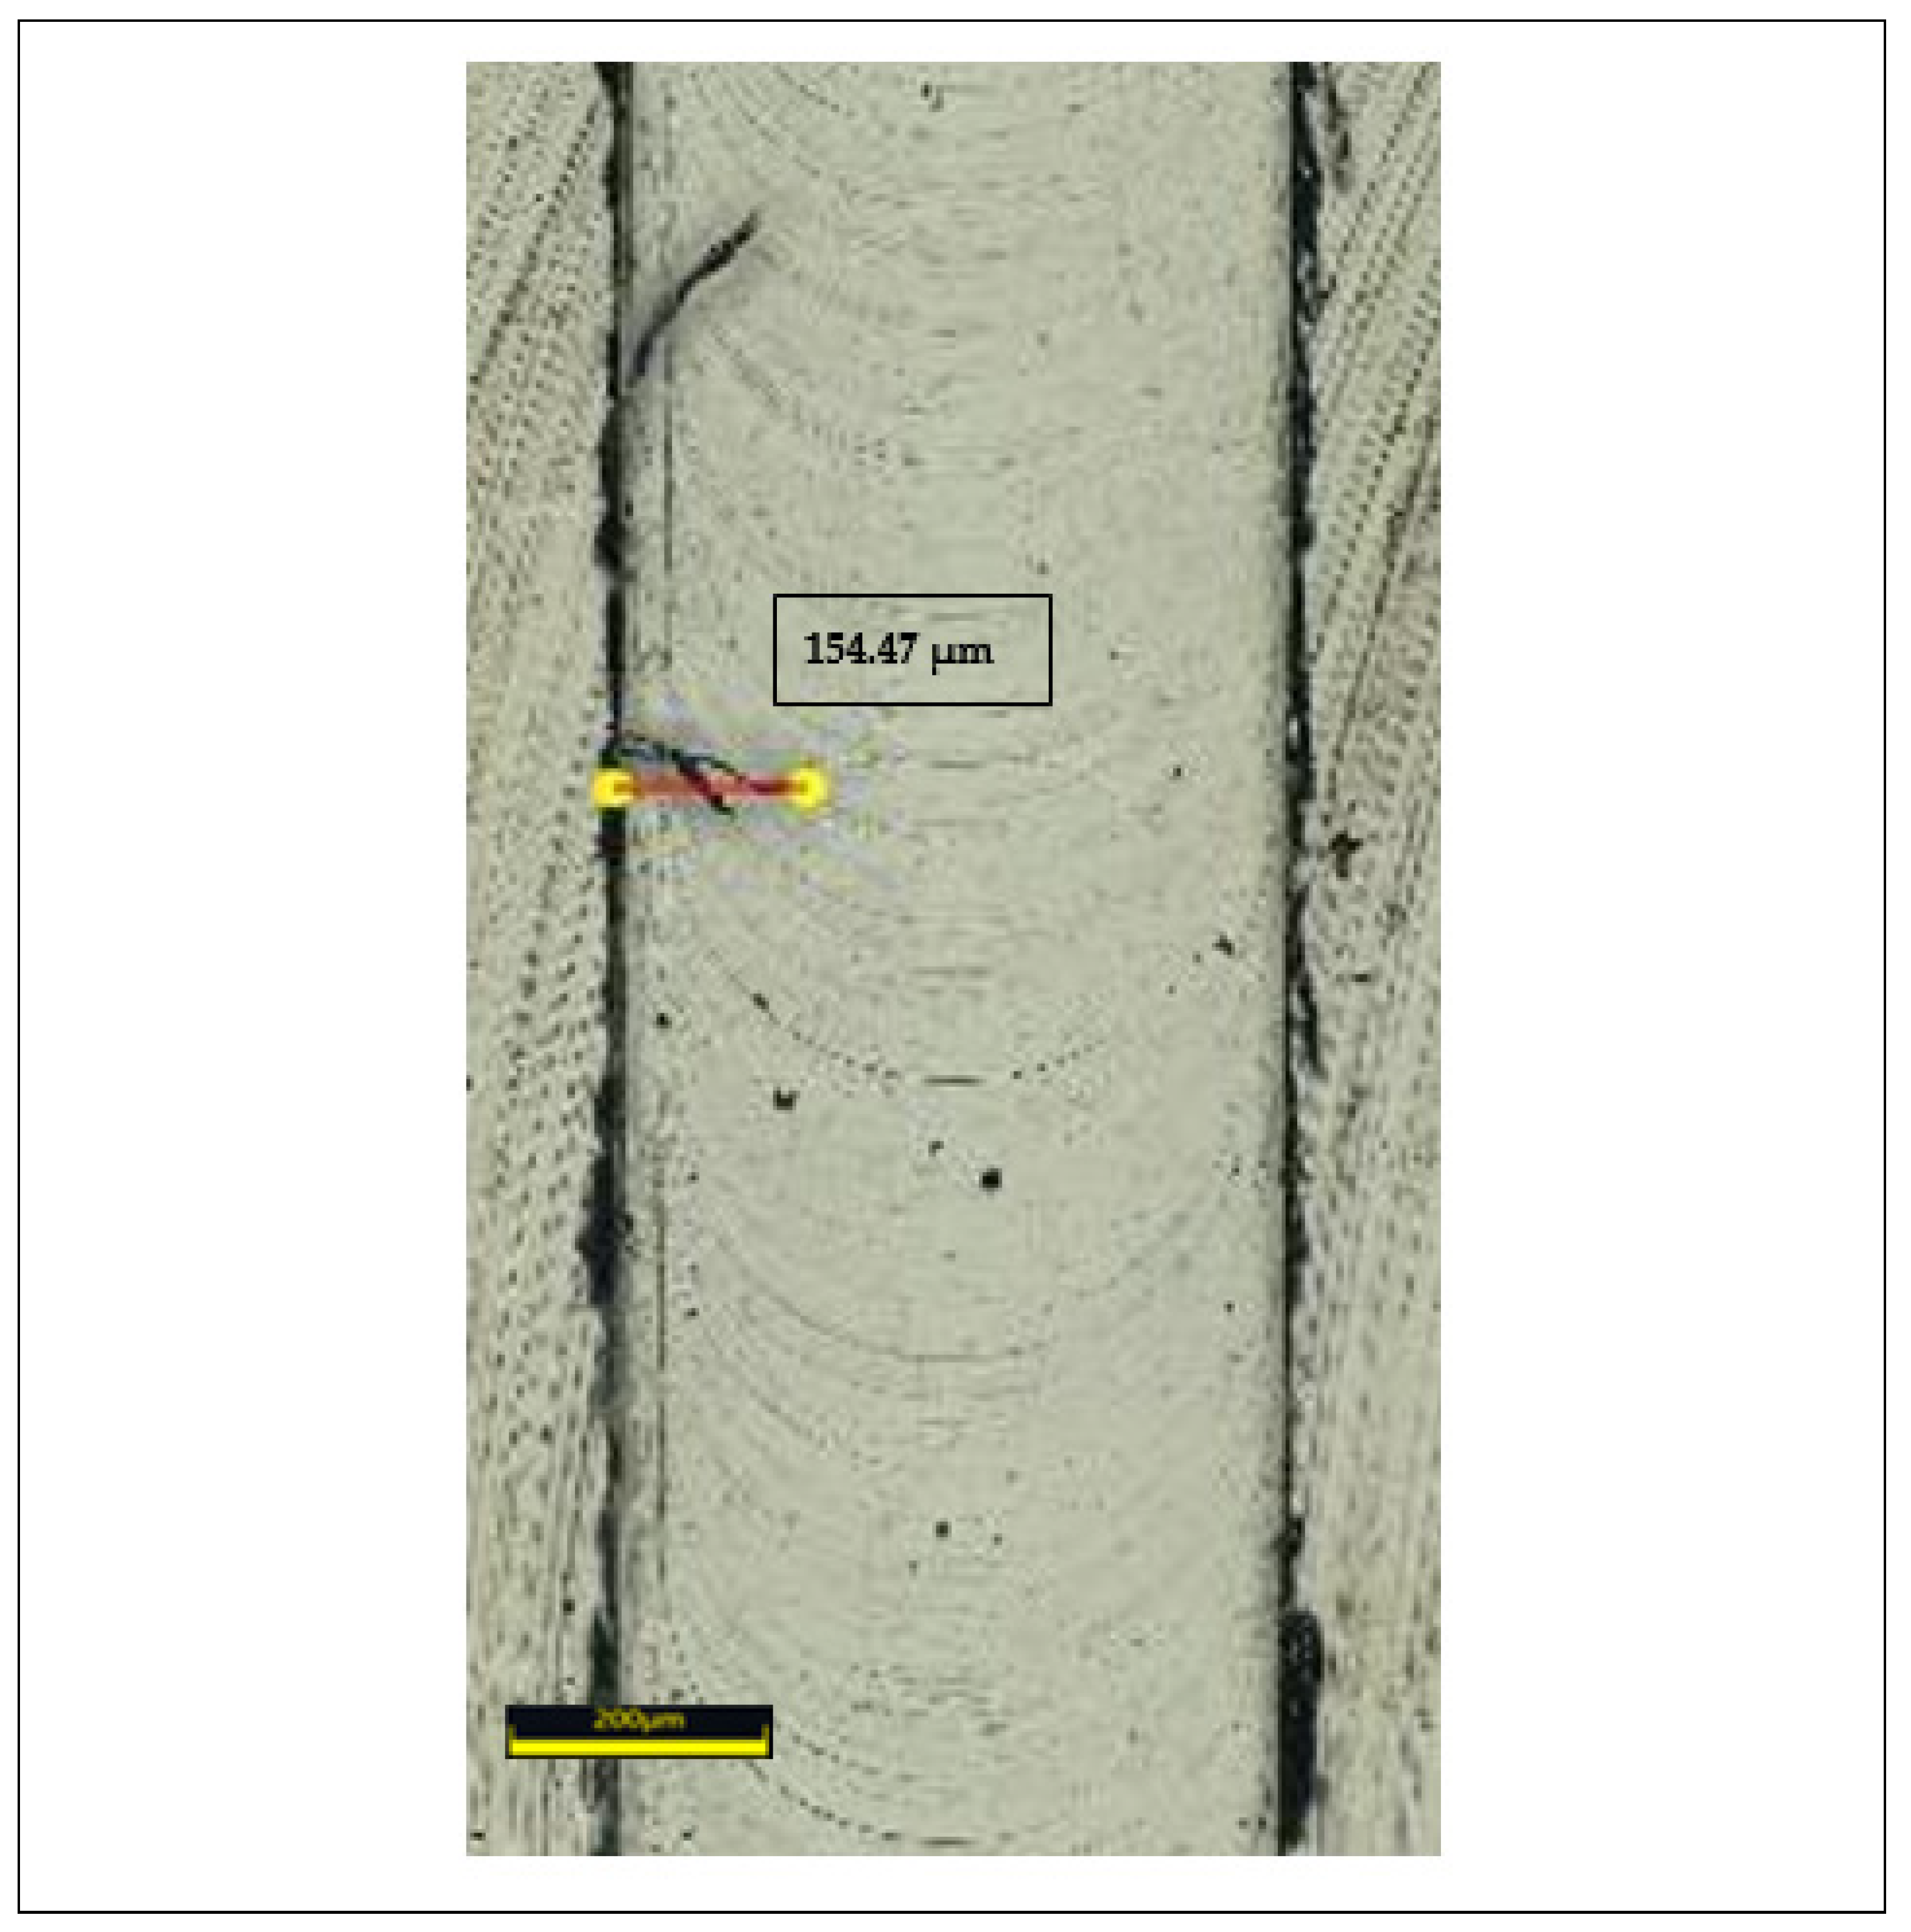
  • In comparison with initial experimentation (at 0.45 μm/tooth fz, 25 m/min Vc, 60 μm ap), a 3.4% improvement in burr width was recorded while machining at 0.65 μm/tooth fz, 75 m/min Vc, and 30 μm ap, as underlined in confirmatory tests.
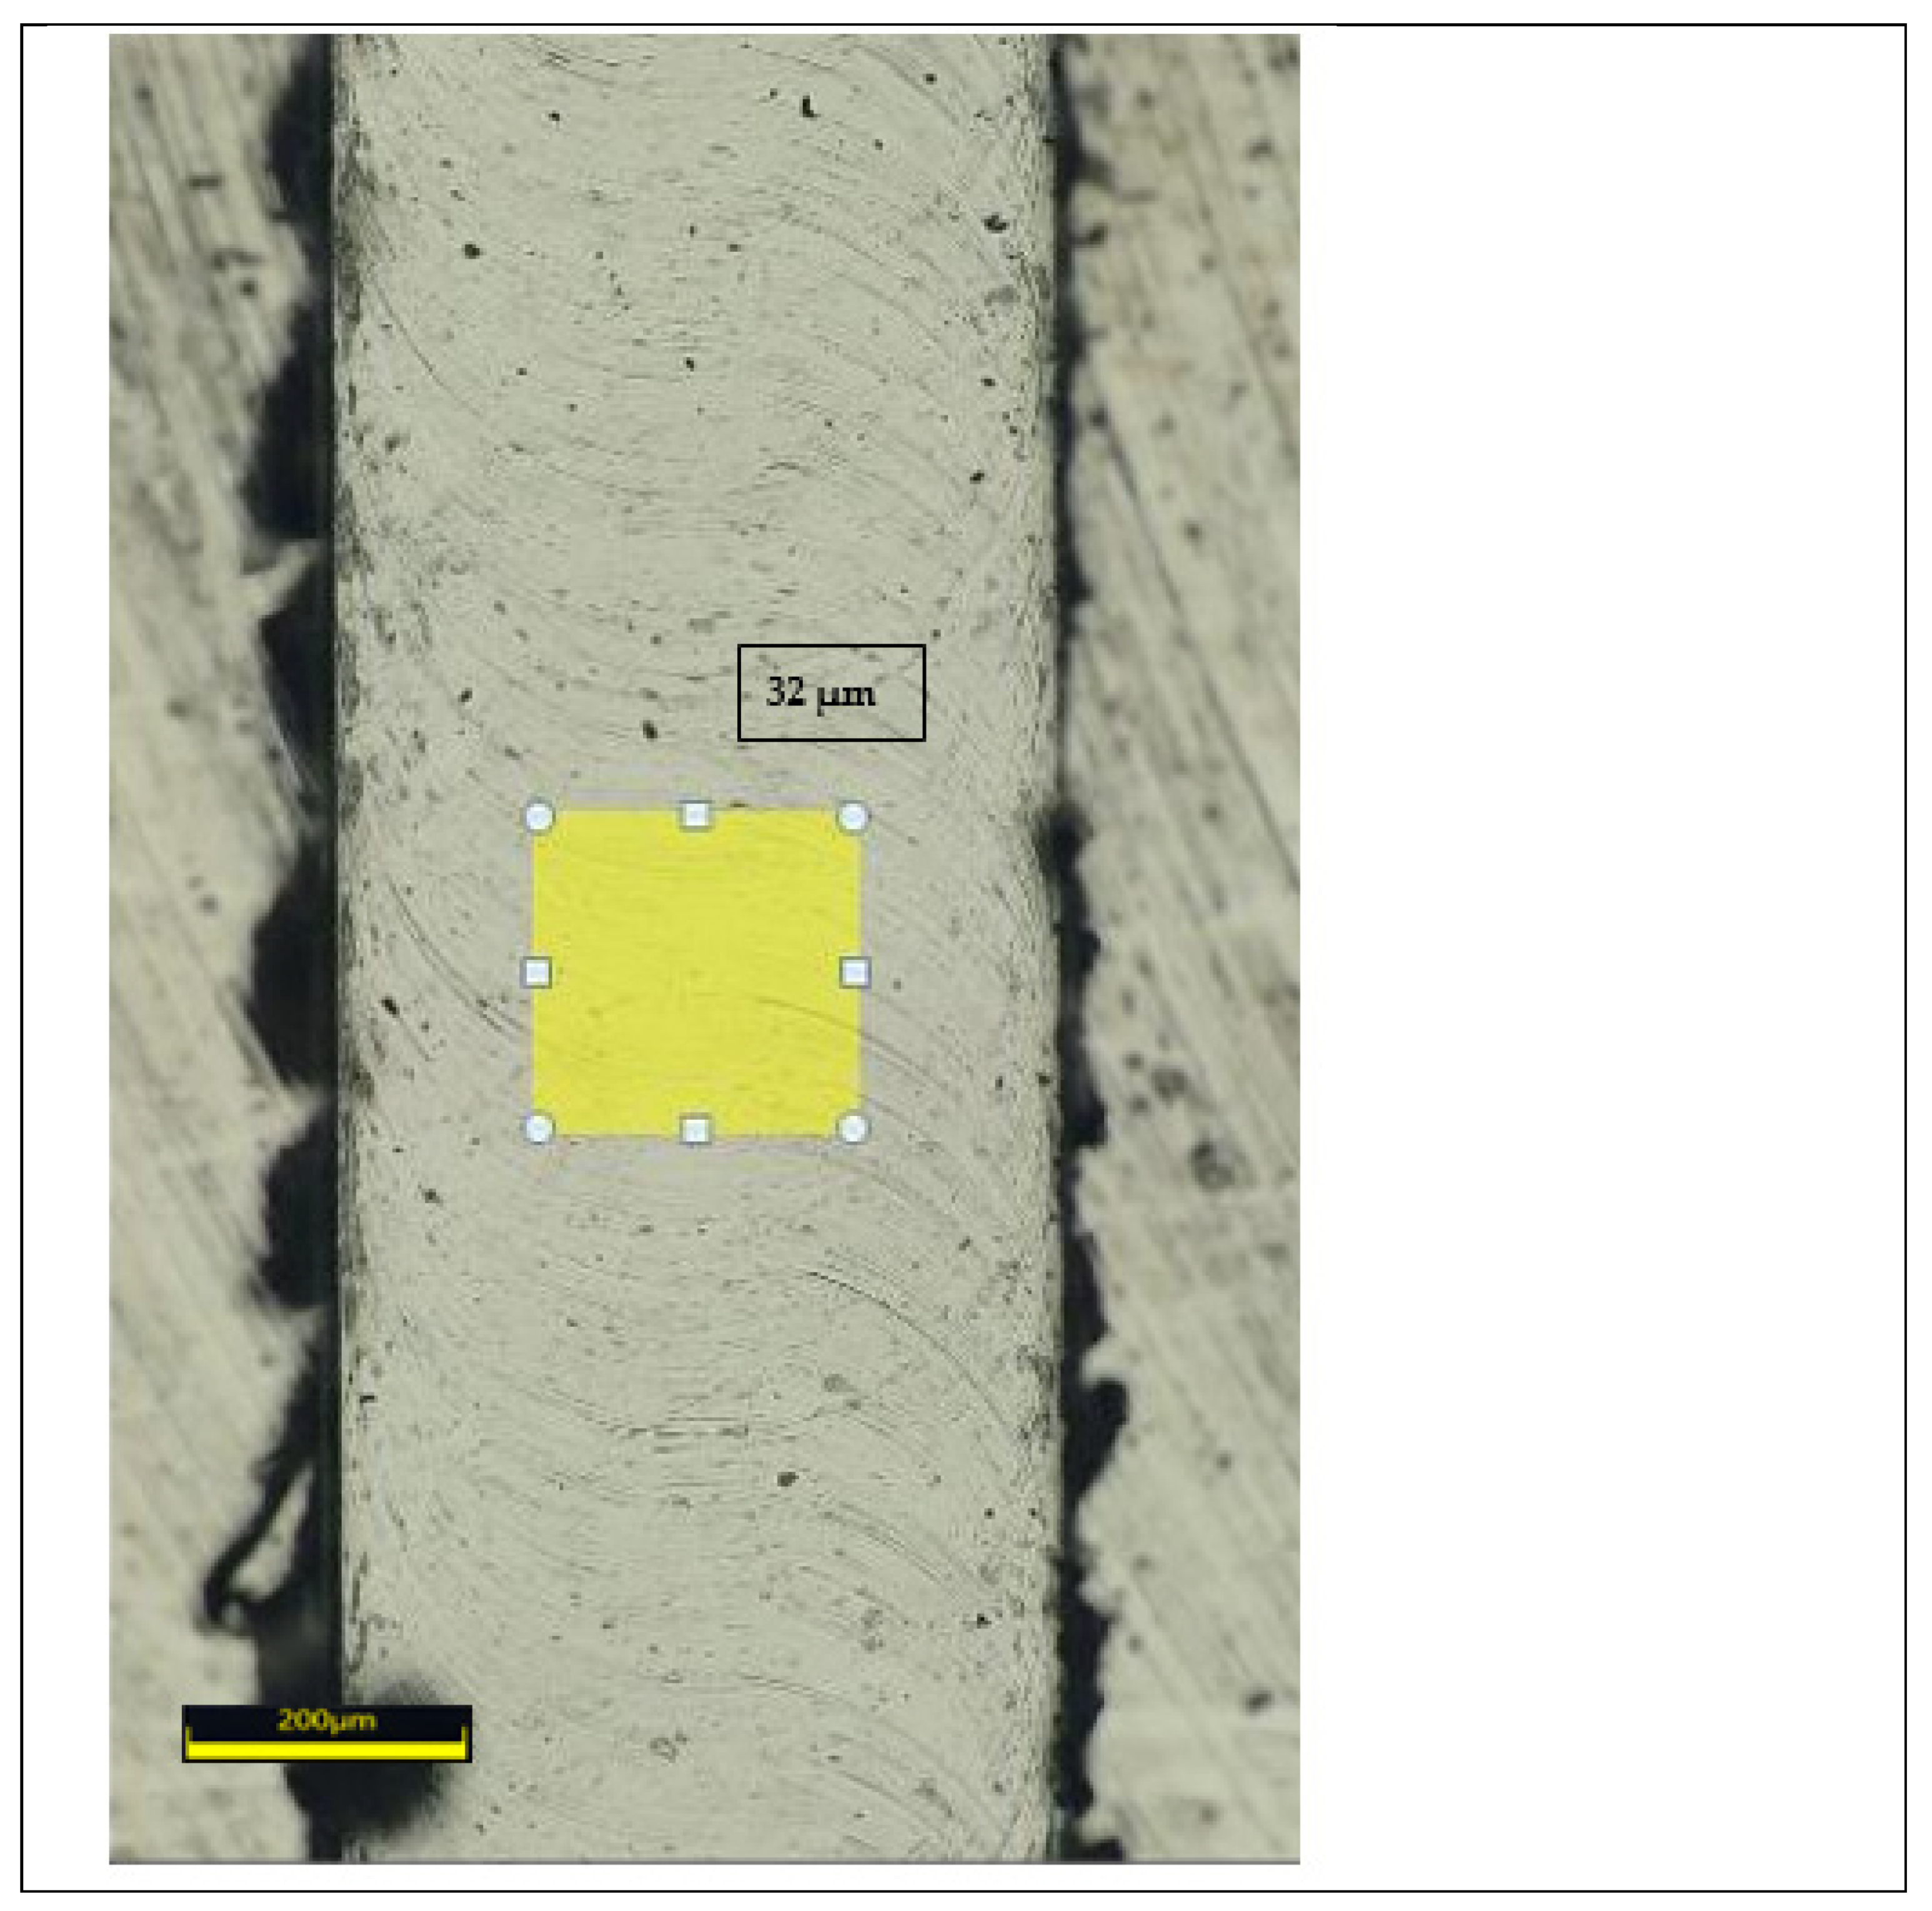
  • Similarly, a surface roughness of 32 μm was acquired under specific machining conditions under the best confirmatory conditions of a feed rate of 0.25 μm/tooth, a cutting velocity of 25 m/min, and an axial depth of cut set at 90 μm, which was 8.5% less than initial best surface roughness value obtained at 0.45 μm/tooth fz, 25 m/min m/min Vc, and 60 μm ap.

6. Future Research Direction

The current research was planned as part of the overall machinability analysis of aerospace alloy Ti-3Al-2.5V (titanium grade 9). Keeping in view the hard-to-cut status of such alloys plus the growing emphasis on green and clean manufacturing, an effort was made for economical manufacturing production through careful selection of optimum machining parameters. The results are encouraging and motivating for further attempts to ensure greater productivity while maintaining sustainability. In future works, transitional and high-speed machining ranges may be explored for hard-to-cut titanium and nickel alloys using MQL and cryogenic cooling conditions. In addition, the benefits of dry machining, working at conventional machining speeds, can be investigated in depth using the tool wear and energy consumption maps approach.

Author Contributions

Conceptualization, M.I.F. and M.A.K. (Muhammad Ali Khan); data curation, S.A. and S.H.I.J.; formal analysis, M.A.K. (Muhammad Ayyaz Khan), A.M.T., M.A.K. (Muhammad Ali Khan) and D.-W.J.; funding acquisition, M.I.F., S.A. and D.-W.J.; investigation, M.I.F.; methodology, M.A.K. (Muhammad Ayyaz Khan); project administration, S.A. and D.-W.J.; resources, A.M.T. and M.A.K. (Muhammad Ali Khan); software, S.A. and A.M.T.; supervision, M.A.K. (Muhammad Ali Khan) and S.H.I.J.; validation, S.H.I.J.; visualization, A.M.T.; writing—original draft, M.A.K. (Muhammad Ayyaz Khan) and M.A.K. (Muhammad Ali Khan); writing—review and editing, M.A.K. (Muhammad Ayyaz Khan), M.A.K. (Muhammad Ali Khan), and S.A. All authors have read and agreed to the published version of the manuscript.

Funding

This research was funded by the Brain Pool program of the Ministry of Science and by ICT through the National Research Foundation of Korea (RS-2023-00218940). This work was supported by the Deanship of Scientific Research, Vice Presidency for Graduate Studies and Scientific Research, King Faisal University, Saudi Arabia (Grant No. 5173).

Institutional Review Board Statement

Not applicable.

Informed Consent Statement

Not applicable.

Data Availability Statement

The data presented in this study are available upon request from the corresponding author. The data are not publicly available due to privacy and ongoing research.

Conflicts of Interest

The authors declare no conflict of interest.

References

  1. Myers, J.R.; Bomberger, H.B.; Froes, F.H. Corrosion Behavior and Use of Titanium and Its Alloys. JOM 1984, 36, 50–60. [Google Scholar] [CrossRef]
  2. Bajpai, V.; Kushwaha, A.K.; Singh, R.K. Burr Formation and Surface Quality in High Speed Micromilling of Titanium Alloy (Ti6Al4V). In Proceedings of the ASME 2013 International Manufacturing Science and Engineering Conference Collocated with the 41st North American Manufacturing Research Conference, Madison, WI, USA, 10–14 July 2013; American Society of Mechanical Engineers: New York, NY, USA, 2013. [Google Scholar] [CrossRef]
  3. Hashimura, M.; Dornfeld, D.A. Proposal of a Burr Classification Method Based on the Formation Mechanisms in Face Milling. (2nd Report). Application of the Proposed Method for Side, Top, Entrance and Entrance Side Burrs. J. Jpn. Soc. Precis. Eng. 1999, 65, 1002–1007. [Google Scholar] [CrossRef]
  4. Choi, G.H. Experimental investigations of sideward burr formation in rotary machining. KSME Int. J. 1997, 11, 20–28. [Google Scholar] [CrossRef]
  5. O’toole, L.; Kang, C.-W.; Fang, F.-Z. Precision micro-milling process: State of the art. Adv. Manuf. 2021, 9, 173–205. [Google Scholar] [CrossRef] [PubMed]
  6. Siddique, M.Z.; Faraz, M.I.; Butt, S.I.; Khan, R.; Petru, J.; Jaffery, S.H.; Khan, M.A.; Tahir, A.M. Parametric Analysis of Tool Wear, Surface Roughness and Energy Consumption during Turning of Inconel 718 under Dry, Wet and MQL Conditions. Machines 2023, 11, 1008. [Google Scholar] [CrossRef]
  7. Zoya, Z.A.; Krishnamurthy, R. The performance of CBN tools in the machining of titanium alloys. J. Mater. Process. Technol. 2000, 100, 80–86. [Google Scholar] [CrossRef]
  8. Khan, M.A.; Jaffery, S.H.I.; Khan, M.; Younas, M.; Butt, S.I.; Ahmad, R.; Warsi, S.S. Multi-objective optimization of turning titanium-based alloy Ti-6Al-4V under dry, wet, and cryogenic conditions using gray relational analysis (GRA). Int. J. Adv. Manuf. Technol. 2020, 106, 3897–3911. [Google Scholar] [CrossRef]
  9. Akhtar, M.N.; Sathish, T.; Mohanavel, V.; Afzal, A.; Arul, K.; Ravichandran, M.; Rahim, I.A.; Alhady, S.S.N.; Abu Bakar, E.; Saleh, B. Optimization of Process Parameters in CNC Turning of Aluminum 7075 Alloy Using L27 Array-Based Taguchi Method. Materials 2021, 14, 4470. [Google Scholar] [CrossRef]
  10. Wang, M.-Y.; Chang, H.-Y. Experimental study of surface roughness in slot end milling AL2014-T6. Int. J. Mach. Tools Manuf. 2004, 44, 51–57. [Google Scholar] [CrossRef]
  11. Sooraj, V.S.; Mathew, J. An experimental investigation on the machining characteristics of microscale end milling. Int. J. Adv. Manuf. Technol. 2011, 56, 951–958. [Google Scholar] [CrossRef]
  12. Zaidi, S.R.; Qadir, N.U.; Jaffery, S.H.I.; Khan, M.A.; Khan, M.; Petru, J. Statistical Analysis of Machining Parameters on Burr Formation, Surface Roughness and Energy Consumption during Milling of Aluminium Alloy Al 6061-T6. Materials 2022, 15, 8065. [Google Scholar] [CrossRef] [PubMed]
  13. Khan, M.A.; Jaffery, S.H.I.; Khan, M. Assessment of sustainability of machining Ti-6Al-4V under cryogenic condition using energy map approach. Eng. Sci. Technol. Int. J. 2023, 41, 101357. [Google Scholar] [CrossRef]
  14. Aslantas, K.; Ekici, E.; Çiçek, A. Optimization of process parameters for micro milling of Ti-6Al-4V alloy using Taguchi-based gray relational analysis. Measurement 2018, 128, 419–427. [Google Scholar] [CrossRef]
  15. Zheng, L.; Chen, W.; Huo, D. Experimental investigation on burr formation in vibration-assisted micro-milling of Ti-6Al-4V. Proc. Inst. Mech. Eng. Part C J. Mech. Eng. Sci. 2019, 233, 4112–4119. [Google Scholar] [CrossRef]
  16. Gupta, M.K.; Niesłony, P.; Sarikaya, M.; Korkmaz, M.E.; Kuntoğlu, M.; Królczyk, G.; Jamil, M. Tool wear patterns and their promoting mechanisms in hybrid cooling assisted machining of titanium Ti-3Al-2.5V/grade 9 alloy. Tribol. Int. 2022, 174, 107773. [Google Scholar] [CrossRef]
  17. Jaffery, S.H.I.; Khan, M.; Ali, L.; Mativenga, P.T. Statistical analysis of process parameters in micromachining of Ti-6Al-4V alloy. Proc. Inst. Mech. Eng. Part B J. Eng. Manuf. 2016, 230, 1017–1034. [Google Scholar] [CrossRef]
  18. Muhammad, A.; Gupta, M.K.; Mikołajczyk, T.; Pimenov, D.Y.; Giasin, K. Effect of Tool Coating and Cutting Parameters on Surface Roughness and Burr Formation during Micromilling of Inconel 718. Metals 2021, 11, 167. [Google Scholar] [CrossRef]
  19. Lu, X.; Jia, Z.; Wang, H.; Si, L.; Wang, X. Surface roughness prediction model of micro-milling Inconel 718 with consideration of tool wear. Int. J. Nanomanuf. 2016, 12, 93–108. [Google Scholar] [CrossRef]
  20. Khan, M.A.; Jaffery, S.H.I.; Khan, M.; Younas, M.; Butt, S.I.; Ahmad, R.; Warsi, S. Statistical analysis of energy consumption, tool wear and surface roughness in machining of Titanium alloy (Ti-6Al-4V) under dry, wet and cryogenic conditions. Mech. Sci. 2019, 10, 561–573. [Google Scholar] [CrossRef]
  21. Ahsan, K.B.; Mazid, A.M.; Clegg, R.E.; Pang, G.K.H. Study on Carbide Cutting Tool Life Using Various Cut-Ting Speeds for α-β Ti-Alloy Machining Analysis and Modelling. 2012. Available online: www.journalamme.org (accessed on 29 December 2021).
  22. Uriarte, L.; Herrero, A.; Zatarain, M.; Santiso, G.; de Lacalle, L.L.; Lamikiz, A.; Albizuri, J. Error budget and stiffness chain assessment in a micromilling machine equipped with tools less than 0.3mm in diameter. Precis. Eng. 2007, 31, 1–12. [Google Scholar] [CrossRef]
  23. Arrazola, P.-J.; Garay, A.; Iriarte, L.-M.; Armendia, M.; Marya, S.; Le Maître, F. Machinability of titanium alloys (Ti6Al4V and Ti555.3). J. Am. Acad. Dermatol. 2009, 209, 2223–2230. [Google Scholar] [CrossRef]
  24. Khan, M.A.; Jaffery, S.H.I.; Khan, M.; Alruqi, M. Machinability analysis of Ti-6Al-4V under cryogenic condition. J. Mater. Res. Technol. 2023, 25, 2204–2226. [Google Scholar] [CrossRef]
  25. Baig, A.; Jaffery, S.H.I.; Khan, M.A.; Alruqi, M. Statistical Analysis of Surface Roughness, Burr Formation and Tool Wear in High Speed Micro Milling of Inconel 600 Alloy under Cryogenic, Wet and Dry Conditions. Micromachines 2023, 14, 13. [Google Scholar] [CrossRef] [PubMed]
  26. Sheheryar, M.; Khan, M.A.; Jaffery, S.H.I.; Alruqi, M.; Khan, R.; Bashir, M.N.; Petru, J. Multi-Objective Optimization of Process Parameters during Micro-Milling of Nickel-Based Alloy Inconel 718 Using Taguchi-Grey Relation Integrated Approach. Materials 2022, 15, 8296. [Google Scholar] [CrossRef] [PubMed]
  27. Tian, S.; Wang, Z.; Wang, Z.; Luo, K.; Lu, J. The mechanism of anisotropic micro-milling properties in additively manufactured Ti-6Al-4V alloy. J. Am. Acad. Dermatol. 2023, 322, 118190. [Google Scholar] [CrossRef]
  28. Wang, P.; Bai, Q.; Cheng, K.; Zhao, L.; Zhang, Y. Multi-Objective Optimization of Micro-Milling Parameters—The Trade-Offs between Machining Quality, Efficiency, and Sustainability in the Fabrication of Thin-Walled Microstructures. Appl. Sci. 2023, 13, 9392. [Google Scholar] [CrossRef]
  29. Villalba-Alumbreros, G.; Lopez-Camara, E.; Martínez-Gómez, J.; Cobreces, S.; Valiente-Blanco, I.; Diez-Jimenez, E. Experimental study of micromilling process and deburring electropolishing process on FeCo-based soft magnetic alloys. Int. J. Adv. Manuf. Technol. 2023, 126, 3235–3248. [Google Scholar] [CrossRef]
  30. Silva, G.d.P.; da Silva, M.B.; de Oliveira, D. Influence of abrasive deburring in indirect tool wear measurement in micromilling of Inconel 718. J. Braz. Soc. Mech. Sci. Eng. 2023, 45, 262. [Google Scholar] [CrossRef]
  31. Pradhan, P.; Costa, L.; Rybski, D.; Lucht, W.; Kropp, J.P. A Systematic Study of Sustainable Development Goal (SDG) Interactions. Earth’s Future 2017, 5, 1169–1179. [Google Scholar] [CrossRef]
  32. Department of Economic and Social Affairs. Transforming Our World: The 2030 Agenda for Sustainable Development. Available online: https://sdgs.un.org/2030agenda (accessed on 6 October 2022).
  33. Singh, P.; Pungotra, H.; Kalsi, N.S. On the characteristics of titanium alloys for the aircraft applications. Mater. Today Proc. 2017, 4, 8971–8982. [Google Scholar] [CrossRef]
  34. Kulkarni, K.G.; Bhattacharya, N. Use of titanium and its alloy in aerospace and aircraft industries. Int. J. Creat. Res. Thoughts 2020, 8, 1383–1396. [Google Scholar]
  35. ASM Material Data Sheet. Available online: https://asm.matweb.com/search/SpecificMaterial.asp?bassnum=mta321 (accessed on 24 September 2023).
  36. Khan, M.A.; Jaffery, S.H.; Khan, M.A.; Faraz, M.I.; Mufti, S. Multi-Objective Optimization of Micro-Milling Titanium Alloy Ti-3Al-2.5 V (Grade 9) Using Taguchi-Grey Relation Integrated Approach. Metals 2023, 13, 1373. [Google Scholar] [CrossRef]
  37. Thepsonthi, T.; Özel, T. An integrated toolpath and process parameter optimization for high-performance micro-milling process of Ti–6Al–4V titanium alloy. Int. J. Adv. Manuf. Technol. 2014, 75, 57–75. [Google Scholar] [CrossRef]
  38. Niagara Cutter. Available online: https://www.niagaracutter.com/speedfeed?catalog=solidcarbide&category=speedfeed.html&cwd=/ (accessed on 21 June 2021).
  39. Alhadeff, L.; Marshall, M.; Curtis, D.; Slatter, T. Applying experimental micro-tool wear measurement techniques to industrial environments. Proc. Inst. Mech. Eng. Part B J. Eng. Manuf. 2021, 235, 1588–1601. [Google Scholar] [CrossRef]
  40. Ginting, A.; Nouari, M. Surface integrity of dry machined titanium alloys. Int. J. Mach. Tools Manuf. 2009, 49, 325–332. [Google Scholar] [CrossRef]
  41. Ulutan, D.; Ozel, T. Machining induced surface integrity in titanium and nickel alloys: A review. Int. J. Mach. Tools Manuf. 2011, 51, 250–280. [Google Scholar] [CrossRef]
  42. Zhang, Y.; Bai, Q.; Sun, Y.; Li, D. Burr formation mechanism and machining parameter effect in slot micro-milling titanium alloy Ti6Al4V. Int. J. Adv. Manuf. Technol. 2022, 123, 2073–2086. [Google Scholar] [CrossRef]
  43. Hou, J.; Zhou, W.; Duan, H.; Yang, G.; Xu, H.; Zhao, N. Influence of cutting speed on cutting force, flank temperature, and tool wear in end milling of Ti-6Al-4V alloy. Int. J. Adv. Manuf. Technol. 2014, 70, 1835–1845. [Google Scholar] [CrossRef]
  44. Suresh, R.; Basavarajappa, S.; Gaitonde, V. Experimental studies on the performance of multilayer coated carbide tool in hard turning of high strength low alloy steel. J. Mater. Res. 2015, 30, 3056–3064. [Google Scholar] [CrossRef]
  45. Filho, J.C.; Diniz, A.E. Influence of Cutting Conditions on Tool Life, Tool Wear and Surface Finish in the Face Milling Process. J. Braz. Soc. Mech. Sci. 2002, 24, 10–14. [Google Scholar] [CrossRef]
  46. Gao, S.; Pang, S.; Jiao, L.; Yan, P.; Luo, Z.; Yi, J.; Wang, X. Research on specific cutting energy and parameter optimization in micro-milling of heat-resistant stainless steel. Int. J. Adv. Manuf. Technol. 2017, 89, 191–205. [Google Scholar] [CrossRef]
Figure 1. Burr during up milling and down milling.
Applsci 13 12875 g001
Figure 2. Burr measurement (not to scale).
Applsci 13 12875 g002
Figure 3. Tool flank wear.
Applsci 13 12875 g003
Figure 4. Burr width measurement.
Applsci 13 12875 g004
Figure 5. Main effects plot for surface roughness.
Applsci 13 12875 g005
Figure 6. Standard deviation for surface roughness.
Applsci 13 12875 g006
Figure 7. Main effects plot for burr width (down milling).
Applsci 13 12875 g007
Figure 8. Standard deviation for burr width.
Applsci 13 12875 g008
Figure 9. Main effects plot for burr length.
Applsci 13 12875 g009
Figure 10. Standard deviation for burr length.
Applsci 13 12875 g010
Figure 11. Main effects plot for tool flank wear.
Applsci 13 12875 g011
Figure 12. Standard deviation for tool wear.
Applsci 13 12875 g012aApplsci 13 12875 g012b
Figure 13. Interaction plots among fz, Vc, and ap: (a) surface roughness, (b) burr width, (c) burr length, and (d) tool wear.
Applsci 13 12875 g013
Figure 14. Burr width at fz = 0.65 (µm/tooth), Vc = 75 (m/min), ap = 30 µm (best confirmatory).
Applsci 13 12875 g014
Figure 15. Surface roughness at fz = 0.25 (µm/tooth, Vc = 25 (m/min), ap = 90 µm. (best confirmatory).
Applsci 13 12875 g015
Table 1. Chemical composition of the Ti-3Al-2.5V workpiece.
Titanium
(Ti)
Aluminum
(Al)
Vanadium
(V)
Iron
(Fe)
Silicon
(Si)
Other
93.763.72.180.0480.040Balance
Table 2. Properties of titanium grade 9 (Ti-3Al-2.5V) [35].
Mechanical Properties
Tensile Strength (MPa)Yield Strength
(MPa)
Elastic Modulus
(GPa)
Shear Modulus
(GPa)
Poison’s RatioHardness Brinell
(HB) Max
620530100440.3256
Physical Properties
Density
(g/cm3)
Melting Point
(°C)
Specific Heat
Capacity (J/g °C)
Thermal Conductivity(W/m K)Thermal Coefficient
20.0–540 °C, µm/m °C
4.48≤17000.5258.309.97
Table 3. Experimental conditions.
ConditionSpecification
WorkpieceTi-3Al-2.5V
Cutting fluidDry cutting
Milling typeFull immersion
Cutting toolMicro end mill
Number of flutes2
Tool diameter500 µm
Cutting edge radius4 µm (measured)
Tool materialTungsten carbide
Length of cut12 mm
Table 4. Levels of parameters used in the experiments.
No. of Exp.Feed Below Edge Radius
(fz (µm tooth−1))
Cutting Speed
VC (m min−1)
Depth of Cut
ap (µm)
10.252530
20.255060
30.257590
40.455090
50.457530
60.452560
70.657560
80.652590
90.655030
Table 5. Experimental results.
FactorsSurface RoughnessBurr WidthBurr LengthTool Flank Wear
fz
(µm/tooth)
Vc
(m/min)
ap
(µm)
(nm)(µm)(µm)(µm)
0.25253039.12479.702580.75015.20
38.65455.000572.54916.63
0.25506047.34342.574527.5218.57
45.32327.43582.09718.71
0.25759041.63246.588501.0421.25
43.72440.96504.98424.00
0.45509039.03358.00483.26015.32
37.55289.015393.0018.31
0.45753065.09173.19259.48715.00
63.75165.13324.35216.42
0.45256037.61159.807405.379.20
35.12183.971375.008.20
0.65756072.06165.00198.45618.65
73.11182.31323.16819.32
0.65259061.08310.373367.008.65
59.34220.603332.0010.00
0.65503066.92195.00199.24212.62
69.02205.00215.47413.40
Table 6. ANOVA table for surface finish.
SourceContributionF-Valuep-ValueSignificance
F (µm/tooth)62.96%46.540.000Significant
Vc (m/min)20.32%15.020.001Significant
ap (µm)9.27%6.850.012Significant
Error7.44%
Total100.00%
Table 7. ANOVA table for burr width (down milling).
SourceContributionF-Valuep-ValueSignificance
F (µm/tooth)55.20%12.190.002Significant
Vc (m/min)8.94%1.970.185Non-Significant
ap (µm)10.96%2.420.135Non-Significant
Error24.91%
Total100.00%
Table 8. ANOVA table for burr length.
SourceContributionF-Valuep-ValueSignificance
F (µm/tooth)77.70%46.430.000Significant
Vc (m/min)7.77%4.640.035Significant
ap (µm)5.33%3.180.081Non-significant
Error9.20%
Total100.00%
Table 9. ANOVA for tool wear.
SourceContributionF-Valuep-ValueSignificance
F (µm/tooth)33.18%16.390.001Significant
Vc (m/min)54.02%26.680.000Significant
ap (µm)1.66%0.820.466Non-significant
Error11.14%
Total100.00%
Table 10. F-value and p-value for fz*Vc, fz*ap, and Vc*ap interaction factors.
SourceSurface Roughness (nm)Burr Width (µm)Burr Length (µm)Tool Wear (µm)
F-Valuep-ValueσF-Valuep-ValueσF-Valuep-ValueσF-Valuep-Valueσ
fz*Vc4.160.0642.130.940.35418.440.020.90319.980.100.7520.72
fz*ap3.830.0522.200.940.35418.231.900.19519.701.540.2400.84
Vc*ap1.390.2632.754.730.05221.390.560.47126.734.310.0570.77
Table 11. Best and worst condition for input parameters.
ResponsesConditionInput Parameters
Vc (m/min)fz (µm/tooth)ap (µm)
Surface roughness (µm)Best0.252590
Worst0.657530
Burr width (µm)Best0.657530
Worst0.252590
Burr length (µm)Best0.657560
Worst0.255030
Tool wear (µm)Best0.452530
Worst0.257590
Table 12. Confirmatory test results.
ResponsesConditionValidation TestInitial RunDifference
Surface roughness (µm)Best3235.12
(0.45 fz, 25 Vc, 60 ap)
8.5%
Worst96.573.11
(0.65 fz, 75 Vc, 60 ap)
24.2%
Burr width (µm)Best154.47159.81
(0.45 fz, 25 Vc, 60 ap)
3.4%
Worst680.51580.75
(0.25 fz, 25 Vc, 30 ap)
14.6%
Burr length (µm)Best102.7198.45
(0.75 fz, 65 Vc, 60 ap)
48.24%
Worst696.55582.09
(0.25 fz, 50 Vc, 60 ap)
16.3%
Tool wear (µm)Best7.958.20
(0.45 fz, 25 Vc, 60 ap)
4%
WorstAlready examined24.00
(0.25 fz, 75 Vc, 90 ap)
-*
* no change.
Disclaimer/Publisher’s Note: The statements, opinions and data contained in all publications are solely those of the individual author(s) and contributor(s) and not of MDPI and/or the editor(s). MDPI and/or the editor(s) disclaim responsibility for any injury to people or property resulting from any ideas, methods, instructions or products referred to in the content.

