1. Introduction
In a broad sense, Dataset-Based Learning (DBL) can be understood as a data-driven active teaching methodology that focuses on the use of real, existing, or generated datasets to promote the learning and understanding of specific concepts and skills. Instead of relying only on theory or abstract academic examples, DBL allows students to explore and analyse real or simulated data to extract insights, identify patterns, formulate hypotheses, and make decisions.
Working with datasets strongly contributes to the acquisition of soft skills, such as structural thinking [
1] and critical thinking [
2], and to the acquisition of other competences, such as data literacy skills. As stated in [
3] (p. 1) and [
4], “data literacy involves the ability to understand and evaluate the information that can be obtained from data”. For these authors, the strongest learning experiences may arise when the students work with real data from scientific research. Working with datasets also promotes computational thinking and data-driven thinking, being aware of the complexity and variability of real-world data. Computational thinking refers to the “thought process of formulating problems and their solutions so that they are represented in a form that can be effectively carried out by an information-processing agent” [
4] (p. 3). Similarly, data-driven thinking refers to “the thought process of addressing a problem and proposing solutions that can be efficiently formulated and backed by data” [
4] (p. 3) and [
5].
In the literature, it is possible to find scenarios where datasets are used in a teaching context. For example, the dataset presented in [
6] can be used for teaching qualitative methods in psychology [
7]. Datasets can be applied in situations where problem scenarios can be represented as datasets, such as in the teaching of statistics [
8] or machine learning [
9,
10]. In [
2], the authors create an exercise that, by working with real data, enhances the ecological knowledge and critical thinking skills of students, engages their interest in the subject, and instils in students an understanding of the value of publicly available archived data. There have also been projects focusing on the development of dataset resources for educational purposes. For instance, in [
11], the authors highlight three examples of the use of NASA’s space telescope and infrared sensor data into high-school and college classrooms. A special mention is deserved by Project EDDIE (European Distributed Data Infrastructure for Energy), “a pedagogical collaborative that develops and assesses flexible modules that use publicly available, large datasets that allow students to explore a range of concepts in the biological, earth, and environmental sciences” [
12].
In this work, DBL is understood as data-driven, student-centred pedagogy in which students learn about a subject through the experience of working directly with datasets taken from (or based on) real situations. It works on the basis that students, under the guidance of the teacher, should be able to find and characterise problems in the dataset and analyse the dataset provided to solve the proposed problems or to obtain behaviour patterns that can be useful for learning some topics in depth. In our judgment, DBL can be considered a subset of active learning [
13], because students are actively or experientially involved in the learning process. Active learning is defined as a method of learning in which students are actively or experientially involved in the learning process and where there are different levels of active learning, depending on students’ involvement [
13]. The published literature shows that active learning encourages students to be more open and committed to the learning process in a scientific and technological environment [
14] and that it boosts academic results [
15].
The bibliography provides several references to other active learning approaches, such as Problem-Based Learning [
16,
17], Scenario-Based Learning [
18], Inquiry-Based Learning [
19], Learning by Doing [
20], or Project-Based Learning [
21,
22]. There are also studies that compare them [
23]. As mentioned, in the literature, there is not a definition of DBL as an active learning approach; however, the bibliography refers to it as the base of how artificial intelligence techniques work, mainly machine learning or deep learning [
24]. In a broader sense, the process of transforming a dataset for teaching a lesson is similar to the process needed to prepare a dataset for training a machine learning algorithm.
In this paper, first, a systematic literature review (SLR) is performed to learn about the use of DBL as an active methodology in higher education. The SLR highlights the knowledge gap that exists in the definition of a methodology for designing DBL activities; thus, this paper aims to provide a reference for sharing the view and details about what DBL is in higher education, how to implement it, and the experiences of using it.
The remainder of the paper is structured as follows: First, an SLR is performed to analyse the presence of DBL in the literature. Then, based on the previous results, a common approach for DBL is established; next, a methodology for developing a DBL activity is proposed, and after that, this methodology is illustrated with three case studies in different engineering fields. Finally, some concluding remarks are extracted.
2. Dataset-Based Learning in the Literature
In order to analyse the presence of DBL in the literature, we conducted an SLR in line with Denyer’s suggested five-step process [
25]: question formulation; locating studies; study selection and evaluation; analysis and synthesis; reporting and using results. This section covers the first four steps, while the fifth step is addressed in the following sections of the paper. In addition, PRISMA guidelines were used as the basis of this SLR [
26].
2.1. Question Formulation
The objective of this paper is to define a common approach and establish a reference for using Dataset-Based Learning as an active learning methodology in higher education. Thus, this paper aims to answer the two following questions:
An exploratory search for the term “Dataset-Based Learning” yielded no results related to education in Web of Science (WOS) and Scopus. Thus, the research questions (RQs) were reformulated based on the two questions above. They were as follows:
RQ1: What are the benefits of using datasets in higher-education active learning activities?
RQ2: How are datasets used in higher-education active learning activities?
RQ3: How are the characteristics of datasets used in higher-education active learning activities?
By analysing the answers to those RQs, we will be able to define a common approach for Dataset-Based Learning as an active learning methodology in higher education.
2.2. Locating Studies, Selection, and Evaluation
Once the RQs were formulated, the keywords selected were the following: “data” and “active learning”. The bibliographical materials that were used were English language articles, review papers, proceeding papers, books, and book chapters, collected in the databases of WOS and Scopus, from 1990 to September 2023. The search settings were the following:
Keywords in the title: data AND (learning OR education).
Category/topic: education.
Search within all fields: “active learning”.
This search provided a total of 232 results in Scopus and 23 results in WOS. They were transferred to a spreadsheet, merged, and deduplicated, resulting in 236 unique results. Then, a first revision involving the reading of the titles resulted in the retention of 98 records. In a second revision, which involved reading the abstract of the remaining records, 37 records were retained. In a third revision, the remaining records were read, and only 16 were retained for further analysis. The screening process was conducted manually and independently by the first author. The systematic literature review process overview is shown in
Figure 1. The records that were removed in these revisions fit into these categories:
2.3. Results: Analysis and Synthesis
The authors independently reviewed the 16 documents, collecting data manually. The documents deal with the use of datasets in active learning activities and can be divided into three groups:
Documents that analyse the benefits of using datasets in higher education: [
31,
32,
33]. These documents were reviewed to answer RQ1.
Documents that present case studies of experiences of working with datasets in learning activities: [
34,
35,
36,
37,
38,
39,
40,
41,
42,
43,
44]. These documents were reviewed to answer RQ2 and RQ3.
Documents that present tools, such as software, that help in the development of active learning activities with datasets: [
45,
46]. These documents were reviewed to answer RQ2 and RQ3.
All the documents were analysed and synthesized to answer the three research questions formulated above. The low number of reviewed documents allowed the authors to perform exhaustive reading, and no automation tools were necessary. In addition, it should be noted that most of the documents present teaching experiences as case studies, which made it difficult to standardize the data. For this reason, when there was missing or unclear information, this was omitted in the review.
It is worth mentioning that all the documents are relatively new, the oldest being from the year 2002 but followed by one from the year 2013. The year in which most documents were published, 4, is 2023, and 7 out of 16 documents were published between 2021 and 2023 (see
Figure 2). This may be because active learning methodologies have proliferated in recent years, together with the use of datasets in education.
2.3.1. RQ1: What Are the Benefits of Using Datasets in Higher-Education Active Learning Activities?
As mentioned in
Section 1, working with datasets at all levels of education is strongly related to the acquisition of soft skills, such as structural thinking [
1] and critical thinking [
2], and to the acquisition of other competences, such as data literacy skills, computational thinking, and data-driven thinking [
4]. However, to answer RQ1, we only focus on the reviewed papers, which are contextualized in higher education and which, apart from using datasets in learning activities, use learning methodologies explicitly identified as active.
In this line, the work presented in [
31] aims to assess the impact of data-driven didactic sessions for anaesthesiology residents on metrics including fund of knowledge, resident confidence in clinical topics, and stress, in addition to American Board of Anaesthesiology In Training Examination percentiles. For this purpose, they conducted an observational, mixed-methods, multi-institutional study among anaesthesiology residents who received a data-driven didactic session consisting of an evidenced-based review focused on lifelong learning while using frequently asked/missed topics (based on publicly available data) as a vehicle to drive the education. As a result of their work, the authors associate data-driven didactics with improved resident confidence, stress, and factors related to wellness.
A similar study is presented in [
32], where the authors created two different groups for an undergraduate hydrology course, which received different lectures. The lecture component was identical for both laboratory groups, and the only instructional difference was whether the students received a data-driven simulation lab exercise or a paper laboratory module (control group). The results of the study demonstrate that learning was enhanced in the data-driven simulation group in nearly every content area and that data-driven simulation can effectively bring the “real world” into the classroom and make it accessible, especially in the case of students at lower levels and across the general curriculum. In addition, the authors highlight that their data-driven activity was not excessively complex in the way of computer modelling and programming, as they only used a simple spreadsheet, combined with readily available online hydrological data.
In another line, data visualization is an important aspect of DBL. The study presented in [
33] investigates how data visualization learning experiences enhanced students’ critical thinking and problem-solving skills. For that purpose, in an undergraduate course, the data visualization process was introduced as a seven-stage process. Students learned the key elements of each stage and demonstrated their understanding, competency, proficiency, and ultimately mastery of the process by completing visualization exercises that increased in difficulty to challenge their knowledge and skills. Data collected for the research included post-interviews with students who had enrolled in the course and their responses to class exercises. In simpler terms, the results of the research indicate that data visualization develops students’ critical thinking skills. However, the authors highlight that their study was limited by the small number of participants.
Two of the reviewed articles [
31,
32] present studies with quantitative data collection and analysis to investigate the impact of working with data-driven approaches on students with concrete case studies. The third article [
33] does not explicitly refer to data-driven approaches; in contrast, it studies how data visualization learning experiences enhance students’ critical thinking and problem-solving skills. This study was also considered in this review due to the fact that data visualization is intrinsic to working with datasets. Indeed, data visualization may be present in the statement of DBL activities; it may be necessary during the activity to interpret the results; and it is also the most common manner of presenting results based on data. These three studies ascertain the benefits of DBL: working with real data enhances student’s confidence, learning, and critical thinking skills. It is also worth mentioning that there are many other documents, such as the ones that are mentioned in the
Section 1 of this work [
1,
2], that refer to the positive effects of DBL activities on students’ structural thinking, critical thinking, and data literacy skills. These documents were not included in the SLR whether because they do not explicitly identify their approaches as “active learning” or because they are not contextualized in higher education. In any case, there is no reason not to believe that the benefits of working with data are maintained or even enhanced when it is performed within the context of active learning methodologies.
2.3.2. RQ2: How Are Datasets Used in Higher-Education Active Learning Activities?
The reviewed literature shows that datasets are used in higher education, presenting many benefits as detailed in the previous subsection. However, datasets can be used in different types of activities and for different purposes. To answer RQ2, we are going to analyse the reviewed papers that present experiences or case studies of active learning methodologies that use datasets in higher education.
The work presented in [
44] combines the active methodology of Team-Based Learning (TBL) with the use of datasets to teach data science. TBL represents a well-organized adaptation of the small-group cooperative learning models advocated in [
47,
48]. TBL transforms the traditional classroom experience by encouraging students to actively collaborate with their fellow classmates, applying the course material in practical data science applications to solve real-world problems. In the paper, the authors present an overview of the TBL pedagogical approach and its effectiveness. Although the aim of the paper is to promote the adoption of TBL within the data science education community, one of the intended learning outcomes of their case study is “becoming familiar with statistical thinking concepts in the context of doing interesting things with data, and doing all of this in a setting promoting the learning of communication, teamwork, and collaboration skills while considering and incorporating discussion of ethics” [
44] (p. 280). For this purpose, the students learn skills such as data visualization, transforming data, Exploratory Data Analysis, importing, and tidying data.
Similarly, in [
35], the authors explore the effectiveness of the Problem-Based Learning (Problem-BL) methodology with various sensor data in aviation technology courses on aircraft maintenance. The students started working with aircraft engine data collected using numerous sensors, and they analysed them to find a possible problem in the turbine engine, to find a possible solution for the effective maintenance of aircraft. Another example of the use of the methodology of Problem-BL with datasets can be found in [
43]. In the work, the authors present a series of DBL exercises that use Green Maps, a data-rich environment, as a tool to conduct inventory, frame analysis, and communicate environmental assets of a community, all within the frame of Problem-BL. They present two case studies, one of them in K-12 education, and the other in higher education. The case study contextualized in higher education consisted of four projects in which students had access to more data than they could consume but they also needed to develop new data to solve the problem assigned. To solve their problem, students needed to reflect critically on the aim of their project and find ways to use existing and new data. The activity ended with the creation of spatial data and maps, which are a method of data visualization.
In the same line, the work presented in [
34] combines the active methodology of Project-Based Learning (Project-BL) with the use of datasets to teach data science. The paper describes a new data science course designed to emphasize these analytical skills using individual Project-BL in a large-scale cohort. In the course, the students are required to develop a project consisting of interviewing experts, surveying existing data sources, developing a plan to analyse a dataset, cleaning a gathered dataset, and analyse it using visualization. The solution to the proposed project is a dataset cleaned and analysed, in addition to a report that represents the stages of the project. The authors state that with this activity the students develop the following skills: resourcefulness, pro-activity, creativity, abstract thinking, critical thinking, problem solving. A combination of Project-BL and the use of datasets is also presented in [
38], in which the authors present an undergraduate learning module that adopts a Project-BL approach to build students’ skills on how data analysis and numerical modelling can be used to analyse and design water resources engineering projects. It is worth mentioning that the module was developed using a web-based design where all the datasets, instructions, learning activities, and supporting materials are integrated and accessible via a publicly available web interface. The utilization of dedicated software in learning activities involving datasets is widespread. In [
45], the authors designed and implemented a web application to support active learning in data science. The application allows students to grasp individual knowledge discovery processes not just theoretically but also through practical experience. The app support students in analysing data, trying different models, solving problems, testing, and asking and discussing with others about the problem studied.
An important aspect of the combination of active methodologies and the use of datasets is that students can be responsible for obtaining their own data, as in the activity presented in [
37]. In this Inquiry-Guided Learning (IGL) activity, a research project was proposed to sociology students in which students generated the topics, questions, and data that were then used to complete a substantive research paper. The paper included an analysis of the data and a representation of them. As a novelty, in the activity, the students were responsible for collecting their own data, providing them with greater control over their research in comparison to traditional sociology activities, where the data are provided. The authors highlight that using pre-gathered data results in missing out on learning opportunities and skills associated with collecting data. The importance of having students gather their own data is also highlighted in [
36]. In [
36], the authors present a laboratory module in which students built their own spectrometer, collected data, and then proceeded to data analysis. The work highlights the relationships among instrument design, data acquisition, and data analysis. Learning activities involving datasets in which the students collect their own data can also take place as “in-class modules”, combined with theory lectures, as in [
39]. In the work, contextualized in a physics course, the modules were designed to be completed in the same class and required students to perform an experiment and analyse their data, to work through a set of calculations, or to perform some computer simulations. In addition, they also required the students to complete two mayor projects during the term, which involved measurements, data analysis, and discussion of results. In addition, the authors state that they found it successful to divide activities involving experiments to gather data in three parts: prediction of the results, measurement, comparison of the predicted results and the experimental results.
On the other hand, in the reviewed literature, we also found case studies that use active methodologies to teach data science, in which the students work with datasets. However, in some of these activities, datasets are used as a supplement for the activity; but the information they provide is not relevant, nor it is analysed. For instance, in [
41], the authors propose an intervention to develop divergent and convergent thinking skills through open problem solving in a data structures course. The students were presented with open-ended problems that were based on real-world problems, and they were asked to select appropriate data structure and operations for solving the problem. Similarly, the work presented in [
42] studies the use of gamification in data science, using a model that works as an interpreter that takes both the algorithm and generated data as input and then interprets each step of the algorithm. In [
41,
42], the datasets are only accessories, with the primary focus of the activities being on the algorithms, rather than the analysis of the data. Other examples of the use of datasets as accessories in an active learning activity are presented in [
40], where experiential learning methods are used to teach data science.
The reviewed documents present case studies in which the use of data in learning activities is combined with the use of active learning methodologies. However, there are differences in how data are used. Some of these case studies [
34,
35,
37,
38,
43,
44] implement well-known active methodologies, such as TBL, Problem-BL, Project-BL, or IGL. On the other hand, the case studies [
36,
39] present, as active learning activities, laboratory modules and in-class modules in which students work with data gathered by themselves. These and the previous case studies share the characteristic of keeping the focus of the activity on the data and the information that they contain. On the other hand, the case studies presented in [
40,
41,
42] use active methodologies to work with data; but the information of the datasets is not relevant or analysed, nor it is important how it was gathered. According to our understanding, using datasets in an active learning teaching approach does not make it a DBL activity. In contrast, a DBL activity should be data-centred and data-driven. For this reason, only the first cases are considered to have established a common approach to Dataset-Based Learning in the next section.
2.3.3. RQ3: How Are the Characteristics of Datasets Used in Higher-Education Active Learning Activities?
In the reviewed literature, there is a document that explores what aspects of an exercise database contribute to student engagement in database education [
46]. Their results indicate that although complex exercise databases may pose obstacles to learning, they also enhance student engagement, because they are perceived as more realistic. In their words, “students are engaged by highly diverse yet easily understood database business domains, relatively simple database structures, and conceivable yet seemingly realistic amounts of data” [
46] (p. 1). The importance of data authenticity is also highlighted in the reviewed documents: [
31,
32,
34,
35,
37,
38,
39]. As stated in [
32], real data contextualized within a specific example present an opportunity to apply the course concepts within a formally structured and valid situation, again consistent with professionals in the field. In addition, in [
38], it is stated that the appreciation of uncertainties and challenges imposed by data scarcity contributes to students’ learning and potential value for future careers.
The benefits of having students selecting their own data are also highlighted in [
34,
37,
39]. Students may select or gather their own data in different manners, such as consulting existing data sources, performing experiments, and taking measurements, or running their own surveys. Providing the dataset to the students may result in missing out on learning opportunities and skills associated with collecting data or researching databases.
2.4. Discussion
In this SLR, the documents that deal with the use of datasets in higher-education active learning activities were reviewed. The analysis of these documents allowed us to answer three research questions: RQ1, RQ2, and RQ3.
RQ1 speculated about the benefits of using datasets in higher-education active learning activities. Among the reviewed literature, only two documents answer this question with quantitative data collection and analysis [
31,
32], while a third study [
33] analyses the benefits of data visualization. The low number of documents that deal with this problematic is attributed to the fact that from our SLR, we excluded all the documents that do not include the term “active learning”. Nevertheless, in the next section of this work, to establish the benefits of DBL, we consider additional literature studies on the benefits of working with datasets even though they do not include the term “active learning”, since a DBL activity combines the benefits of active learning and working with datasets.
RQ2 speculated about how datasets are used in higher-education active learning activities. To answer this question, we differentiate between two types of learning activities: the first ones [
34,
35,
36,
37,
38,
39,
43,
44] are learning activities that are data-centred and data-driven, in which the data are analysed and the information that they provide is relevant to the development of the activity. The second ones [
40,
41,
42] are active learning activities that use datasets as auxiliary elements to work with. In our understanding, only the first type of learning activities is considered DBL.
RQ3 dealt with the characteristics of datasets used in higher-education active learning activities. The reviewed documents [
31,
32,
34,
35,
37,
38,
39,
46] highlight the importance of using real-world data that are perceived by the students as authentic. Having students selecting or collecting their own data is also considered beneficial for the students [
34,
37,
39].
The SLR also confirmed the absence of a definition of DBL. The published case studies are subject-specific, and as a result, there is not a well-established methodology for Dataset-Based Learning across a variety of domains. Consequently, we could not find, in the literature, basic guidelines to design a DBL activity in higher education or a reference to the common details and phases of this learning approach.
As mentioned, there are many case studies that combine the use of datasets and other active methodologies, such as TBL, Project-BL, Problem-BL, IGL, or open-ended problem solving. After reviewing these case studies, we conclude that DBL is an active learning methodology that can be combined with others while adding a differential approach: the use of datasets as the focus of the activity. Combining active learning methodologies is a practice that can be easily found in the literature; this practice is referred to, in [
49], as “embedded” methodologies. The authors of [
49] mention that the consequence of applying simultaneously educational strategies in a learning activity multiplies their impact on motivation and academic results. However, to either use DBL as a stand-alone methodology or properly “embed” it with other active methodologies, we believe that it is important to establish a common approach. The absence of a shared model makes it extremely difficult to compare experiences and approaches or even to learn about DBL in teacher training courses. This common approach is addressed in the following section of this paper, and it was developed considering the case studies analysed in this SLR and other documents from the literature.
After discussing the results of the SLR, it is also important to mention its limitations. The SLR resulted in only 16 reviewed documents. This is due to the fact that for locating studies, apart from the keyword “data”, the keyword “active learning” was also included, which limited the results. The term “active learning” was considered essential because, as previously stated, in a DBL activity, students are actively involved in the learning process; thus, according to our understanding, a DBL approach cannot be established without identifying it as active learning. Nevertheless, in the literature, it is also possible to find documents that deal with the topic of learning with data but do not explicitly identify it as “active learning”. Some of these articles contain relevant information that can contribute to the definition of the DBL approach. For this reason, in the remaining sections of this article, some documents that were not located in the SLR are referenced.
3. Establishing a Common Approach for Dataset-Based Learning
In this section, we aim to establish a common approach for DBL. For that purpose, we first clarify the definition of dataset and then propose a definition of DBL. Next, the characteristics of a dataset for a DBL methodology are presented. At the end of this section, the benefits and challenges provided by the DBL methodology are synthesized.
3.1. What Is a Dataset?
Before defining a common approach for DBL, it is important to establish a common definition of what a dataset is and where to find it or its availability. According to the dictionary provided in the IGI-Global editorial [
50], with over 218,000 information, science, and technology research definitions, a dataset (or dataset) can be one or more of the following items:
A set of data or collection of data.
A collection of information.
A collection of data or information.
A collection of data containing individual data units organized by a specific criterion that are accessed according to their own organization.
A set of data organized in a tabular form in which each column usually represents a variable or field.
According to these definitions, the most common types of datasets that are more likely to be found on the web are files that contain structured data, such as CSV files or spreadsheets (e.g., [
51]); files that contain non-structured data elements, such as XML or JSON files (e.g., [
52]); or documents such as PDF or HTML files that contain tables and/or lists with data and/or information (e.g., [
53]). In addition, it is also possible to find datasets that are represented graphically in figures (fixed or interactive) that present or compare data values, which may not be accessible in some cases. For instance, the “ICT specialists in employment” from Eurostat offers an HTML version [
54] as well as a PDF version [
55]. It also offers access to a spreadsheet file with data and figures [
56].
3.2. What Is Dataset-Based Learning?
As mentioned, in the literature, we could not find a definition of DBL applied to education. For this reason, in this work, as a common starting point, we define DBL as an active learning methodology whose learning process is built around a dataset to which the following apply:
The dataset provides “the context” of an activity where the concepts make sense; the dataset presents a view of a real scenario based on the values provided by the different variables that are part of the dataset. For instance, a dataset that reflects the opinion of a population about different topics structured considering age and gender presents the view of that population in relation to those topics.
The dataset provides “the blackboard” where the solution is developed; teachers and students work on the dataset, analysing it, and finding patterns, problems, and limitations, just like they would on a blackboard in a classic teaching approach. For instance, the different values of the dataset are organized and processed in different ways to provide additional values or obtain some evidence that shows limitations.
The dataset is “the solution” to the problem; the learning process ends with a new version or representation of the dataset that reflects the solution provided to the problem or the dataset analysis to identify possible solutions to the problem. This solution reflects a new view of the real scenario as a result of the work on the dataset performed during the learning process.
Therefore, DBL datasets are the core of this learning process, and all the lessons phases revolve around them: the dataset is the context, the blackboard, and the solution. That is, the dataset not only provides information and context in the activity statement but also provides the material to work with, and the solution to the activity is entirely extracted from the information contained in the dataset.
From the definition of DBL, it can be inferred whether DBL is an appropriate methodology for achieving the intended learning outcomes of a course. In this sense, the existence of available data related to the subject cannot be the only cause to justify the use of DBL. That is, before selecting DBL as the teaching methodology, teachers must assess whether the intended learning outcomes can be acquired with the use of datasets according to the definition. Active learning includes many other approaches that could be useful for making the acquisition process more interesting for students by using real data to provide context to the activity.
For instance, an activity related to the gender dimension and how to reduce the gap in the labour market could use Eurostat dataset-based information [
57] to describe the situation in European and European Free Trade Association (EFTA) countries. If the target of the activity is to work on “how to reduce the gap”, the dataset helps to identify “where to look for” to find experiences, initiatives, etc., that can guide the activity. Thus, the dataset provides the context to the activity, but it is not “the blackboard” where the solution is developed, nor the solution can be represented with a dataset. Thus, in this case, a scenario-based approach or a problem-based approach could be better methodologies. As a counterexample, in [
58], a series of Programming-Based Learning tasks were developed. In some of these activities, the students, led by the teachers, had to develop a program to generate a numerical output. In these cases, the dataset was the solution to the problem, but it did not provide context to the activity, neither it was the blackboard. Thus, these activities would not be considered DBL activities either.
On the other hand, the flexible definition of dataset presented above makes it possible for some concepts to be taught in a DBL manner. Tables and figures can also provide a reflection of reality that could be used as the base for creating new activities to improve the concept-acquisition process.
3.3. Considerations of a Dataset for DBL
As it has just been said, in a DBL learning activity, the learning process is built around a dataset. Thus, the characteristics of the dataset are crucial, and they are expected to affect activity development. The main characteristics of a dataset are the following: the size and complexity, the authenticity, how the students obtain it, and the format.
It is important to note that the dataset definitions do not refer to its size nor the complexity. That is, a DBL activity can use datasets of different sizes and complexities, but the teacher must consider that the size of the dataset may influence the learning outcomes. In [
12] (p. 1054), a large dataset is defined as a dataset “that cannot be viewed in a single screen of a spreadsheet program without scrolling”; in these cases, computational tasks such as summarizing and plotting the data are necessary. Thus, small datasets may be used when practising data management or the use of computing software [
59,
60] are not the intended learning outcomes. For this reason, the use of relatively small datasets is widespread across undergraduate classrooms. Working with small datasets allows students to ask their own questions, design experiments or manipulate equipment, and generate and analyse their own data. Although these are important learning outcomes, it must also be noted that working with datasets that are limited in size or complexity does not give students the opportunity to practice data management, spreadsheet navigation skills, or hypothesis testing based on data. On the other hand, although working with large and complex datasets promotes the acquisition of data management skills [
59], it also requires students to have some previous knowledge in computing. The lack of computing skills when working with datasets can result in student frustration, especially when dealing with extremely large datasets. For this reason, when designing a DBL activity, the students’ previous knowledge must be considered to assess whether the dimension of the dataset is within the students’ capabilities.
It is highly encouraged to use authentic data that help to contextualize the activity in a real-world scenario, which engages the student [
61,
62] and results in a more effective learning process [
63]. Authentic data may be disorganized and noisy, which may obscure the purpose of the lesson [
64]. For this reason, in some cases, the datasets may require previous work by the teacher to organize it and adapt it to the lesson. Nevertheless, messy data help students to think more deeply about data, making them work as detectives, arising discussion [
64]. In addition, data variability provides an opportunity for discussion about data collection and quality assurance or quality control [
12].
The students can obtain the dataset from different sources. One option is that the teacher provides the datasets. A second option is that the students must search for the data in selected databases or on the Internet. It also worth considering that another approach is to have students collect their own data or generate their own dataset, for example, using experimental measurements in a laboratory or numerical results from a simulation. Generating datasets using simulations provides the chance to participate in practical and genuine learning activities, all without having to deal with various logistical challenges typically associated with field research, such as time consumption or instrumentation management. Depending on the origin, the data can be found in different formats, such as CSV, PDF, or TXT files. In order not to delay the activity, it is recommended that the students are familiar with the format. This may require the teacher to translate the dataset into a more user-friendly format [
12].
3.4. Benefits and Challenges of DBL
In this subsection, we present the benefits of DBL as a synthesis of the SLR results, and the combination of the benefits of active learning methodologies, studying real situations, and working with data. In addition, DBL provides a good scenario for teamwork and collaborative learning, as students can work with the datasets in teams. In that case, the benefits of collaborative learning are also achieved. Thus, the authors define the following benefits as the main benefits of using a DBL approach:
As an active learning methodology, it enhances student-centred learning: students are actively involved because the lesson requires active participation on their end [
65] and they engage in the learning process [
13].
Active engagement in the learning process increases students’ interests in the topic to be learned [
66], which also enhances students’ motivation, which significantly improves their learning [
32].
Better understanding and adeptness: Placing more emphasis on the meaning, applicability, and relevance of learning materials provides a better understanding of the subjects learned. When students are given more challenging and meaningful problems, they become more proficient [
67].
In-depth learning and constructivist approach: DBL fosters learning by involving students with interaction with learning materials. They relate the concept they study to real situations and problems [
68].
Self-motivated attitude: As in the above point, the use of resources close to reality improves the utility of the lessons and motivates students to learn [
68].
Emphasis on comprehension instead of facts: students must be able to discover the problems and their nature and develop a solution to them. In this method, collaborative research through discussion forums takes the place of lecturing.
Augmenting self-learning: Datasets force students to confront new scenarios that they must resolve. This generates interest and responsibility in their learning.
The use of real-world data enhances students’ engagement [
32]. When close-to-reality data are not used, students perceive their lessons as theoretical concepts unlikely to be applied to the real world [
69]. This generates doubts in the utility of the lessons.
Providing research experience: The use of real datasets provides students with authentic/relevant research experience, helps teaching the process of science, and gives students a glimpse of how messy real data can be managed [
11].
Acquisition of data-related skills: Working with data enhances de acquisition of skills such as critical thinking [
2], structural thinking [
1], data literacy [
3], computational thinking [
4], and data-driven thinking [
5]. In addition, data visualization fosters the development of critical thinking skills [
33].
Reinforcing interpersonal skills and teamwork: Teams work with shared datasets in collaboration, which fosters and reinforces interactions among students, teamwork, and interpersonal skills [
70].
In addition, this methodology is a particularly useful approach for subjects related to data management because it makes it “easier” to empathize with the problem and to understand the effects of the data management concepts learned.
Immediate student feedback: In a DBL activity, the teacher assumes the role of a guide, talking with students and monitoring their progress. This approach enables quick and accurate assessment of the students’ learning [
39].
However, developing this learning approach requires time and skills from the teacher responsible for preparing the activity. The main challenges that the teacher and students could face are the following:
As every active learning methodology, DBL activities require more preparation time to cover concepts than expositive traditional lessons [
71]. However, active learning methodologies allow for a deeper understanding of the subject and the development of soft skills.
Discovering key dataset resources according to the topics of the subject may not be an easy task. In general, few subjects can be explained with this approach, because it is necessary for the dataset to be the key element of the problem to be managed.
The work performed by teachers to gather and adapt the dataset can be time-consuming [
34] and may require additional knowledge out of the scope of the field of the subject.
A DBL activity sometimes requires software to analyse the data. There may be restrictions in terms of the software options at disposal, the accessibility in school and home environments, and the varying usability of different software platforms. Additional time may also be required to adapt the dataset format to the selected software.
Another constraining aspect related to software is the learning time required. The utilization of software for data-based activities in the classroom requires an investment in time by both teachers and students. Teachers often need to invest additional time not only to familiarize themselves with software but also to attain a level of proficiency that enables them to assist students who encounter difficulties.
DBL exercises may take a long time for students to complete [
2]. If the students are not able to find a solution for the activity, they can get frustrated and abandon it.
This learning approach needs more active participation from students and a different approach to the learning process from teachers. Therefore, during the lesson, the student may also face difficulties that depend on their previous knowledge and how familiar they are with datasets.
An additional challenge is the need for students to recognize the quality of the data if they need to search for new data sources. If the students do not have the specific required skills to fulfil this task, the teacher should provide instructions and tools. For instance, in [
72], a Data Credibility Checklist was developed to help STEM students. The ethical obligations of providers and users of shared data should also be discussed with the students [
2].
It is worth mentioning that the methodology is not restricted to face-to-face lessons that take place in a physical place. A DBL lesson can also be performed remotely as an e-learning lesson if the students have access to the required software. However, it must be considered that in a synchronous e-learning course, in contrast to an in-person course, the teacher may not have remote access to the computer screens of the students to oversee how the students are progressing. Thus, it may be difficult for the teacher to guide the students, unless they ask for help. For this reason, in an e-learning course, it is more difficult for the teacher to control the lesson pace unless a remote monitoring program is installed on the computers of the students.
4. How to Design a Dataset-Based Learning Activity
This section aims to establish a common approach to designing a DBL lesson, describing the teaching process in three main phases: course scripting, lesson flow (during the lesson), and evaluation and optimization of the learning process (after the lesson).
Figure 3 shows a general flow chart to design a DBL activity.
4.1. Course Scripting (before the Lesson)
During the course-scripting phase, the teacher designs the activity and prepares the required material and resources. The design of the activity depends on three factors that are not always under the teacher’s control: the lesson duration, the group size, and the available resources. The most common length of a lesson in higher education is one to three hours. However, we recommend a minimum of two continuous hours for DBL to make it easier for students to focus on the dataset.
Concerning group size, if the teacher guides the learning process, DBL can be applied to both large and small groups. If DBL is to be student-led, we recommend small groups (six to nine students) to enable the teacher to monitor the progress of the students. In both scenarios, the students can be divided in teams or working groups of two or three students during the lesson.
A DBL lesson requires students to work with computers for dataset analysis, typically using spreadsheet programs [
73] or other subject-specific software. Software selection is an important part of this phase and should align with the size and complexity of the dataset and with the intended learning outcomes. The teacher should feel confident in using the chosen software. Consideration should also be given to the time the students might need to learn to use the given software, and if necessary, the teacher can provide software, spreadsheets, or pre-written code to assist them. This is recommended when the level of the students is not adequate to the task and could help them focus on analyses and results without getting frustrated [
74].
The course-scripting phase comprises the following steps, which can be iterative:
Establish the expected learning outcomes of the activity. Expected learning outcomes include the concepts of the subject that is taught as well as the acquisition of competences, such as soft skills.
Design the structure of the activity, and choose a topic to work on or to analyse, which can be contextualized using one or various datasets. When designing the activity, scaffold the activity to incorporate choice elements, encouraging diverse student results, which promotes discussion.
Search for datasets that best fit the intended learning outcomes. The datasets need to support authentic inquiry. If students gather the data, the teacher needs to ensure that the conditions for this are met.
Select software based on the intended learning outcomes and datasets selected. It could be necessary to prepare pre-written code for the students.
Adapt the dataset to the lesson objectives. In some cases, it may involve preliminary work by the teacher: establishing data collection relations, checking the quality data, manipulating the data format so that the students can work with the dataset more comfortably.
Prepare the activity statement explaining the activity and summarizing the topic concepts on which the students are going to work. The statement should include the context of the dataset and a compelling narrative that engages the students [
75]. The statement may start with an inquiry or a problem to be solved. Depending on the level of the students, data templates and technical help documents can also be developed to guide them.
4.2. Lesson Flow (during the Lesson)
The lesson can be taught synchronously and/or asynchronously, in-person or as an e-learning activity. In either case, the steps listed below can be followed:
The teacher presents the learning activity, describing the context and narrative behind it, explaining the data sources and the dataset, presenting the tools, and defining the work to be performed. Depending on the intended learning outcomes, datasets may be provided to the students as part of the activity statement, or students can be responsible for gathering their own data. In this step, it is crucial to arouse the students’ interest as they engage in initial data exploration and skill development.
The students, led by the teacher, perform “reverse engineering”, going from the dataset to the topic concepts. This forethought phase [
76] is an initial stage of planning or decision making where students engage in thinking, strategizing, and considering various factors before taking any action. This phase involves setting goals, identifying potential obstacles, and crafting a plan of action.
The students, led by the teacher, infer concepts from the dataset, analyse data, and understand the data. As mentioned above, the activity should be scaffolded, so that the analysis of the data entails multiple steps increasing in complexity, while the teacher provides support through them. This approach involves breaking down the resolution of the activity into discrete components that progressively build upon one another. In the performance phase [
76], students exercise self-control using various methods, such as specific task approaches, self-guidance, mental visualization, time management, seeking assistance, and assessing the consequences of their actions. Additionally, in this stage, students engage in self-monitoring through metacognitive evaluation and by keeping records of their progress.
The students, led by the teacher, extract conclusions, summarize the work performed, and establish relationships with the intended learning outcomes. The students capture the work that they have conducted and their results and conclusions in a report that they must present to the teacher. It is advisable that they also present their work to the rest of the class. As students are unlikely to arrive at identical solutions in the final section of the activity, this presents a chance for discussion that could prompt students to contemplate their answers and the methods they used to arrive at them. This is expected to encourage students to reflect on their answer and their method for generating it [
74]. During the self-reflection phase [
76], individuals go through various internal responses, like emotions and their level of contentment, and may react by adjusting or defending themselves based on their learning experiences and results. In this phase, self-reflection involves self-evaluation and attributing the causes of the outcomes.
The lesson may include an asynchronous part, allowing students to complete and improve their work in their own time. The teacher may provide additional datasets for further exercise on the concepts and for broadening the results and conclusions. Additionally, the students can look for new datasets from sites of their choosing. During asynchronous learning, the teacher must be available for feedback.
4.3. Evaluation and Optimization of the Learning Process (after the Lesson)
After conducting the lesson with students, the teacher evaluates if the intended learning outcomes have been achieved and at which level for the purpose of improving the effectiveness of the DBL activity. Evaluation involves collecting feedback from students and teachers on the quality of the learning activity, the DBL methodology, and the teacher’s performance. The teacher also evaluates the students’ performance through observation during the lesson and by reviewing the reports submitted by the students at the end of the lesson. At the same time, soft skills can also be evaluated. While there is extensive literature on evaluating teaching practices and methodologies, this article does not focus on that topic.
5. Case Studies
This section presents three DBL activities that were designed and implemented by the authors using the previously described approach. The three cases are contextualized in engineering courses of three different fields: information and communication technology, computer science, and fluid mechanics. The aim of this section is to prove the applicability of the proposed approach to different topics, to illustrate with examples what a DBL activity is, and to show the advantages of using a DBL approach compared with other methodologies.
5.1. DBL in a Course on Innovation Management in Information and Communication Technology
The first case study presents an activity guided by DBL in a cross-domain held during a course on innovation management in information and communication technology (ICT) within the Master’s degree in Informatics at University of Zaragoza. This exercise aimed at explaining the relevance of public investment in Research, Development, and Innovation (R&D&I) to improve the life standards of citizens. In a general way, most of the public, including ICT Bachelor’s students, see R&D&I as a way to improve knowledge and technology. Nevertheless, several studies [
77,
78,
79] relate the national level of investment in R&D&I and life standards, because there are implications that go beyond the results of an R&D&I activity: for R&D&I, more qualified people are required; more qualified people are usually more critical towards governments and their politics; this criticism has to be managed through the most advanced social politics; and so on. Traditional approaches to teaching this topic typically involve a master class featuring several charts that presents the public investment in R&D&I made by different countries. It is usual to include data of the local country and of other ones that correspond with well-known advanced countries that are references in its neighbourhood (for instance, in Spain, it is usual to include data from Germany, UK, or France). The main problem of this approach is that students just receive the information as a conclusion, without the opportunity of following the diagnosis process (or just viewing it in a slide). The relevance of being part of this diagnosis process must relate to understanding the role of R&D&I public funds in the growth of a country (the answer to the following question: Why do governments have to invest public money in R&D&I?). A DBL approach offers a solution by involving students in the diagnosis process, allowing them to contribute and understand the rationale behind the allocation of public funds to R&D&I.
This exercise tried to validate this hypothesis concerning the relation between the national level of investment in R&D&I of a country and its life standards by analysing, and not only visualizing, data related to R&D&I investment and life standards provided by Eurostat. For this purpose, reports from Eurostat containing relevant information and datasets about the topic provided the context of the activity. It was considered that the level as well as the maturity of the students, as part of a Master’s degree, should have guaranteed the understanding of the data and the concepts managed in these datasets. The students had to work with the datasets to find relations between public investment in R&D&I and life standards and extract conclusions. That is, the datasets were the blackboard to work on, and the solution to the activity was the information extracted from the datasets through analysis.
During the course-scripting phase, the teacher establishes the intended learning outcomes of the activity and prepares the material (documents and datasets) for it. In this case, the following reports from Eurostat were selected from their website: [
80,
81,
82,
83,
84,
85,
86]. The activity is defined, and the documents to be handed out to the students are prepared by the teacher. The teacher checks that they have enough data resources to use in the lesson; in this case, the teacher did not modify the datasets.
The activity lasted 2 h, and it was conducted in a computer room. During the lesson flow, the following steps were followed:
Description of activity context (presenting the learning activity). The teacher explained the hypothesis: “investment in R&D&I improves life standards”. The teacher proposed to the students the following scenario: The student was the minister responsible for research in a national government, and they were trying to convince the minister responsible for managing the national budget and the other ministers from the cabinet about the national interest in using the money for investing in research and innovation. Thus, they had to develop a report that presented the thesis and its validation by conducting a data analysis looking for relations between both concepts at the European Union (EU) level.
Description of the data sources. The teacher presented Eurostat and the reports used for this exercise. It was necessary to explain what Eurostat is, to justify the relevance of its reports.
Description of the process to be followed by the students and the results expected. The students had to develop a short report that validated (or not) the hypothesis. This report had to include data analysis from the documents provided. It could include data, tables, and figures from them, but with the corresponding citation. This corresponded to inferring concepts from the dataset.
Within the remaining time of the lesson (1 h and 40 min approximately), the students worked with the datasets and obtained results. The teacher supervised the students working and was available for guidance and feedback. The students extracted conclusions and wrote the final report. Due to the lack of time, in this case, the students did not present their results in front of the class.
In addition, the activity had the following asynchronous task that should have required 1 h of autonomous work by the students:
- 5.
After the lesson (asynchronous learning), at their own schedule and place, students could improve their qualifications and exercise on the concepts presented by making the same analysis in other geographic areas, by comparing different regional areas (regional level, not country level) inside the EU or comparing EU data with other countries’ data. They needed to look for other data sources and manage them. With this analysis, students extracted conclusions and wrote a report that they sent to the teacher. The teacher was available to answer the questions of the students via email or during office hours.
After finishing the activity, for the evaluation and optimization of the learning process, the students were requested to complete a questionnaire with inquiries about the methodology and the lesson. The teacher evaluated the course scripting (learning methodology evaluation), the course flow, and the performance of the students (learning activity evaluation). According to the evaluation results, the teacher improved the activity if necessary.
5.2. DBL in a Course on Basic Database Concepts
DBL can be applied to a scenario where the core problem to be addressed is the management of data itself and its structure, a common occurrence in many STEM subjects. One example of such application scenarios is the creation of database models in the basic database concepts course of a computer science degree. This course only requires students to have access to a computer and the necessary software, provided by the university. Thus, during the COVID-19 pandemic, the course was taught as an e-learning course.
This exercise aimed to explain how to model a database based on the characteristics of the dataset that will populate it. Studying real data collections allows students to understand data characteristics, relationships, redundancies, and limitations in a more practical way than a direct explanation of theoretical database concepts.
The scripting phase involved finding and selecting a suitable dataset with characteristics that made it suitable for analysis by students to create a dataset model. An example of such a dataset source is the website of the United States (US) Bureau of Transportation Statistics. It provides several datasets with thousands of records and dozens of fields related to earth, sea, and air transport operations. For instance, it includes the history of US flights, with information such as origin, destination, company, plane model, and weather incidents; all these are concepts easy to understand for students because they are near the students’ own experience of travelling by plane. The teacher reviewed the dataset to identify relevant characteristics and the target model that students needed to define from the data, allowing them to identify which learning objectives could be fulfilled. Additional datasets with different characteristics may be required to meet other learning objectives. In such cases, separate activities should be prepared for each dataset, focusing on the specific learning objectives they fulfil.
The activity lasted 2 h and took place in a computer room. The following steps were followed during the lesson:
Description of the learning activity: The teacher explained the objective of the activity, which was to review the dataset and its documentation to identify the structure and content.
Description of the process and expected results: The students proposed a database model that accurately represented the dataset. This required understanding the dataset’s characteristics and restrictions and inferring concepts from the dataset.
Within the remaining time of the lesson (approximately 1 h and 45 min), the students worked on the datasets to obtain results. The teacher supervised their work, providing guidance and feedback. The students defined the database model and created a document describing it.
Additionally, the activity included the following asynchronous work, requiring ten hours of independent work by students:
- 4.
After the lesson (asynchronous learning), the students completed the process of creating and populating the database in a selected database management system. This allowed them to understand the impact of their decisions on the database model during the construction phase. The teacher was available to answer the students’ questions via email or during office hours.
After completing the activity, in the same way as in the previous example, students were asked to complete a questionnaire for the evaluation and optimization of the learning process.
5.3. DBL in a Course of Fluid Mechanics
Another example of application of DBL could be oriented towards a real scenario scaled down to laboratory practice, in this case, for free surface flow, in line with [
32] but using experimental data instead of computational data. The activity is part of one of the practical sessions in the mandatory subject of fluid mechanics in the mechanical engineering degree program. Its goal is to enhance the understanding of concepts related to free surface flow. The use of data in this activity offers significant benefits in enhancing the educational experience. Incorporating data-driven approaches into the learning process provides students with practical hands-on experience to go beyond theoretical concepts in a faster and direct way. It is crucial to ensure that the size of the dataset is manageable and aligned with the students’ abilities. The complexity of the dataset should be adjusted to a level that is suitable for the students’ understanding and skills, enabling them to effectively address the collection, analysis, and interpretation of data within the context of the learning activity.
In a traditional experimental activity, students measure and collect data automatically, without thinking about the concepts they are handling; students are thus forced to carry out work after the laboratory session to analyse the data collected and find themselves disconnected from the master class, which often leads to them not always performing the task at hand. With this DBL approach and design of the activity, students gain a deeper understanding of these fundamental concepts during the session itself. Students develop essential data analysis and interpretation skills by working with the collected dataset in the laboratory. Identifying patterns, trends, and relationships in the data enables students to draw meaningful conclusions and extract relevant information to achieve the learning objectives. This DBL approach aims to enhance students’ critical thinking and teamwork skills, which a traditional activity does not allow to achieve. The variability in the collected datasets among different teams encourages students to think critically about the factors influencing the outcomes. Collaborative work in teams promotes effective communication and teamwork, essential skills in engineering and problem solving. The asynchronous activity, including conducting surveys and seeking feedback from students, contributes to continuous improvement. Understanding the effectiveness of the data-driven teaching process and the students’ learning experiences empowers the teacher to make informed decisions to enhance the methodology for future sessions. The DBL approach thus proves instrumental in improving the learning experience, addressing the limitations of traditional approaches.
During course scripting, the teacher identifies the learning outcomes to work on with the students during the activity. In this case, they were steady-flow conditions, uniform flow, classification of subcritical or supercritical flow, and detection of a hydraulic jump generation. Regarding the soft skills to be acquired, the aim was mainly to enhance students’ skills in critical thinking and teamwork. Once the learning outcomes are identified, the teacher designs the experimental conditions (in this case, bed slope of the channel, initial and boundary conditions) and establishes the real-world context on which the activity is based, adapting it to the available laboratory facility. As a final step in this process, the professor sets up the installation, prepares the measuring instruments, and creates a script for students detailing how to collect the experimental data they need to work on during the lesson. By proposing different conditions in the setup and flow, the discussion of student results in the activity is promoted, as the collected dataset may vary from one team to another.
During the synchronous lesson, in a 2 h session with nine students at the same time divided in three teams, the steps were the following:
The teacher explained how to collect the data from the experimental facility and how to use of the measurement instruments.
The students collected the experimental data by measuring water height and velocity at intervals of 0.5 cm in a rectangular channel that was 3 m long and 24 cm wide. The channel bottom could be changed during the lesson to make it either horizontal or with a constant slope in some sections. The flow rate could also be varied by adjusting the opening or closing of a valve that controlled the flow through the channel. In this way, the students generated their own dataset and registered the data in an Excel spreadsheet.
Under the guidance of the teacher, the students selected the data in the dataset that reflected the flow behaviour in terms of steady flow (constant discharge), uniform-gradually varied–rapidly varied flow (water depth longitudinal variation), subcritical–supercritical flow (calculating the dimensionless Froude parameter using water depth and velocity), and the presence of hydraulic jumps (detecting large variations in water depth in a small longitudinal displacement).
After that, students could extract results from the datasets according to the learning objectives and present them. In case they could not extract any result, it was necessary to go back to work with the data, guided by the teacher.
The lesson ended with the teacher guiding the discussion to achieve the proposed objectives.
During asynchronous learning (1 h approximately), the students relied on the materials provided by the teacher (books, lecture notes, references) to support their analysis, and complete and improve their work.
After the lesson, by conducting surveys on the methodology for learning these basic concepts in free surface flow and the concepts learned by the students themselves, the teacher sought feedback from the students. Based on the results obtained, the teacher considered possible improvements to be introduced in this data-driven teaching process, as well as extending this methodology to other laboratory practice sessions.
6. Conclusions
While it is common for students at higher-education levels to engage in activities involving dataset analysis, data visualization, and drawing conclusions from data, there is a lack of established models for DBL methodologies in the existing literature. Therefore, the purpose of this work is twofold: to present a clear definition of Dataset-Based Learning and to provide a comprehensive guide for designing activities using this approach.
This study begins with a systematic literature review that analyses the use of datasets in higher-education active learning activities. For this purpose, documents in the field of education from the databases of Scopus and WOS containing the words “data” and “active learning” were located. From a total of 236 located results, 16 documents were analysed for this SLR. Most of the reviewed documents present case studies that combine the use of datasets with other active methodologies [
34,
35,
37,
38,
43,
44] or that take place in laboratory modules [
36,
39]. The review articles also highlight the importance of using real-world data [
31,
32,
34,
35,
37,
38,
39,
46], which can be given to the students; obtained using simulations; or gathered by the students themselves using different methods, such as consulting data sources or running experiments. Some of the review papers also state that using datasets in active learning activities is associated with benefits such as improved confidence and enhance learning [
31,
32]. Upon examining the literature, we determine that DBL is an active learning approach that can be used as a stand-alone methodology or integrated with other methodologies, incorporating a distinctive element: placing datasets at the core of the activity.
The paper continues by establishing a clear definition of a DBL lesson. In this lesson, the dataset provides information and context to the activity, the material to work with, and the solution to the activity that can be extracted from the information contained in the dataset itself. The DBL approach emphasizes the acquisition of concepts through practical engagement with real-world situations. Concepts are presented as a formalization of the actions that are necessary to work with reality. In this sense, the teaching process is quite different from classical ones that usually present concepts as abstract elements that must be set down by concreting them in realistic scenarios. The main characteristics of a dataset, such as its size and complexity, were analysed, since they need to be considered when designing a DBL activity. Moreover, the benefits and challenges of DBL were deduced from the SLR and by combining the advantages of active learning methodologies, studying real-world situations, working with data, and engaging in collaborative learning.
Afterwards, a common approach to designing a DBL lesson is presented. The teaching process is divided into three main phases: course scripting, lesson flow, and evaluation and optimization of the learning process. The steps to be followed in each of these phases are described in detail. Next, we present three case studies contextualized in different engineering fields that were designed according to the proposed common approach, and we outline the benefits of using a DBL methodology as opposed to traditional approaches.
Then, the paper presents three case studies in which teachers used the proposed common approach for DBL to design their activities. These three case studies help to prove the application of the proposed approach in different fields of engineering and how using a DBL approach presents advantages compared with traditional methodologies. These case studies help to illustrate what a DBL activity is, which we consider essential in this article, because although we found examples of DBL in the SLR, none of them were explicitly identified as DBL. The three cases contribute, in different roles, to the design of DBL activities, each one emphasizing specific aspects of data analysis, interpretation, and application. In the first one, the activity serves as an introduction to data exploration, where students learn to navigate and extract relevant information, developing quantitative analysis skills, and encouraging critical thinking and discussion about the implications of the data in innovation policies, introducing students to the practical applications of data-driven decision making in innovation management. In the second one, the activity exposes students to handling complex datasets with numerous records and fields, preparing them for real-world scenarios where large datasets are common, identifying relevant characteristics, and improving their ability to discern key variables for analysis. Finally, in the third one, the activity provides a hands-on experience in data collection within an experimental setting, emphasizing the importance of accurate and meticulous data gathering; here, students bridge theoretical concepts and real-world data, reinforcing the integration of theoretical understanding and practical application. Altogether, these cases studies cover key aspects, such as data exploration, quantitative analysis, characteristic identification, predictive modelling, and the integration of theory and practice, present in the complexity and demands of data based on the real-world engineering professional scenarios that students will face and for which we are preparing them.
The use of real data coming from publicly available datasets or gathered directly by students, such as the ones used in the examples presented, facilitates the connection between the concepts presented and their application. In addition, DBL offers a good framework for multidisciplinary training, because a dataset can provide a context far from the concepts that the activity tries to teach. Also, DBL provides a dynamic approach to teaching concepts that students may consider “boring”. In many cases, employing an active methodology that requires student participation necessitates a careful scripting of the activity to ensure learning outcomes. However, developing a DBL lesson requires time and skills from the teacher responsible for preparing the activity. Developing an activity that follows this approach needs more effort and conceptualization than the use of classical methodologies. In this sense, teachers should evaluate advantages and disadvantages, their availability for the investment of the effort, and of course, their own belief in DBL, because if they do not believe in this approach, the results could be worse than those obtained using a traditional one. The presented approach could be considered a reference model for sharing the view and details about what Dataset-Based Learning is and the experiences of using it. This paper offers a “meeting point” for different active learning proposals to connect Dataset-Based Learning with teachers’ approaches and goals. The objective of the presented approach is to introduce a reference model to design DBL activities, sharing and showing three case studies in different disciplines, describing the details of their design.
The study has notable limitations that should be considered in the interpretation of the results. Firstly, the SLR resulted in only 16 documents that were finally reviewed. The number of documents could be increased by including documents that did not explicitly state their methodology as “active learning”. Moreover, three case studies were conducted using the proposed approach; these three cases are presented briefly in this article, but it has to be considered that they were carried out with a relatively small sample size, a total of approximately 60 students. Consequently, the ability to generalize the results to a broader population is restricted. The findings are context-specific and may not be universally applicable. It is imperative to acknowledge that the limited sample size constrains the statistical robustness of the results. Future work should aim to expand the study to include a larger and more diverse sample, facilitating a comprehensive statistical analysis. By doing so, this research could enhance its external validity and offer insights that are more representative of a broader DBL application.


 ,
, 

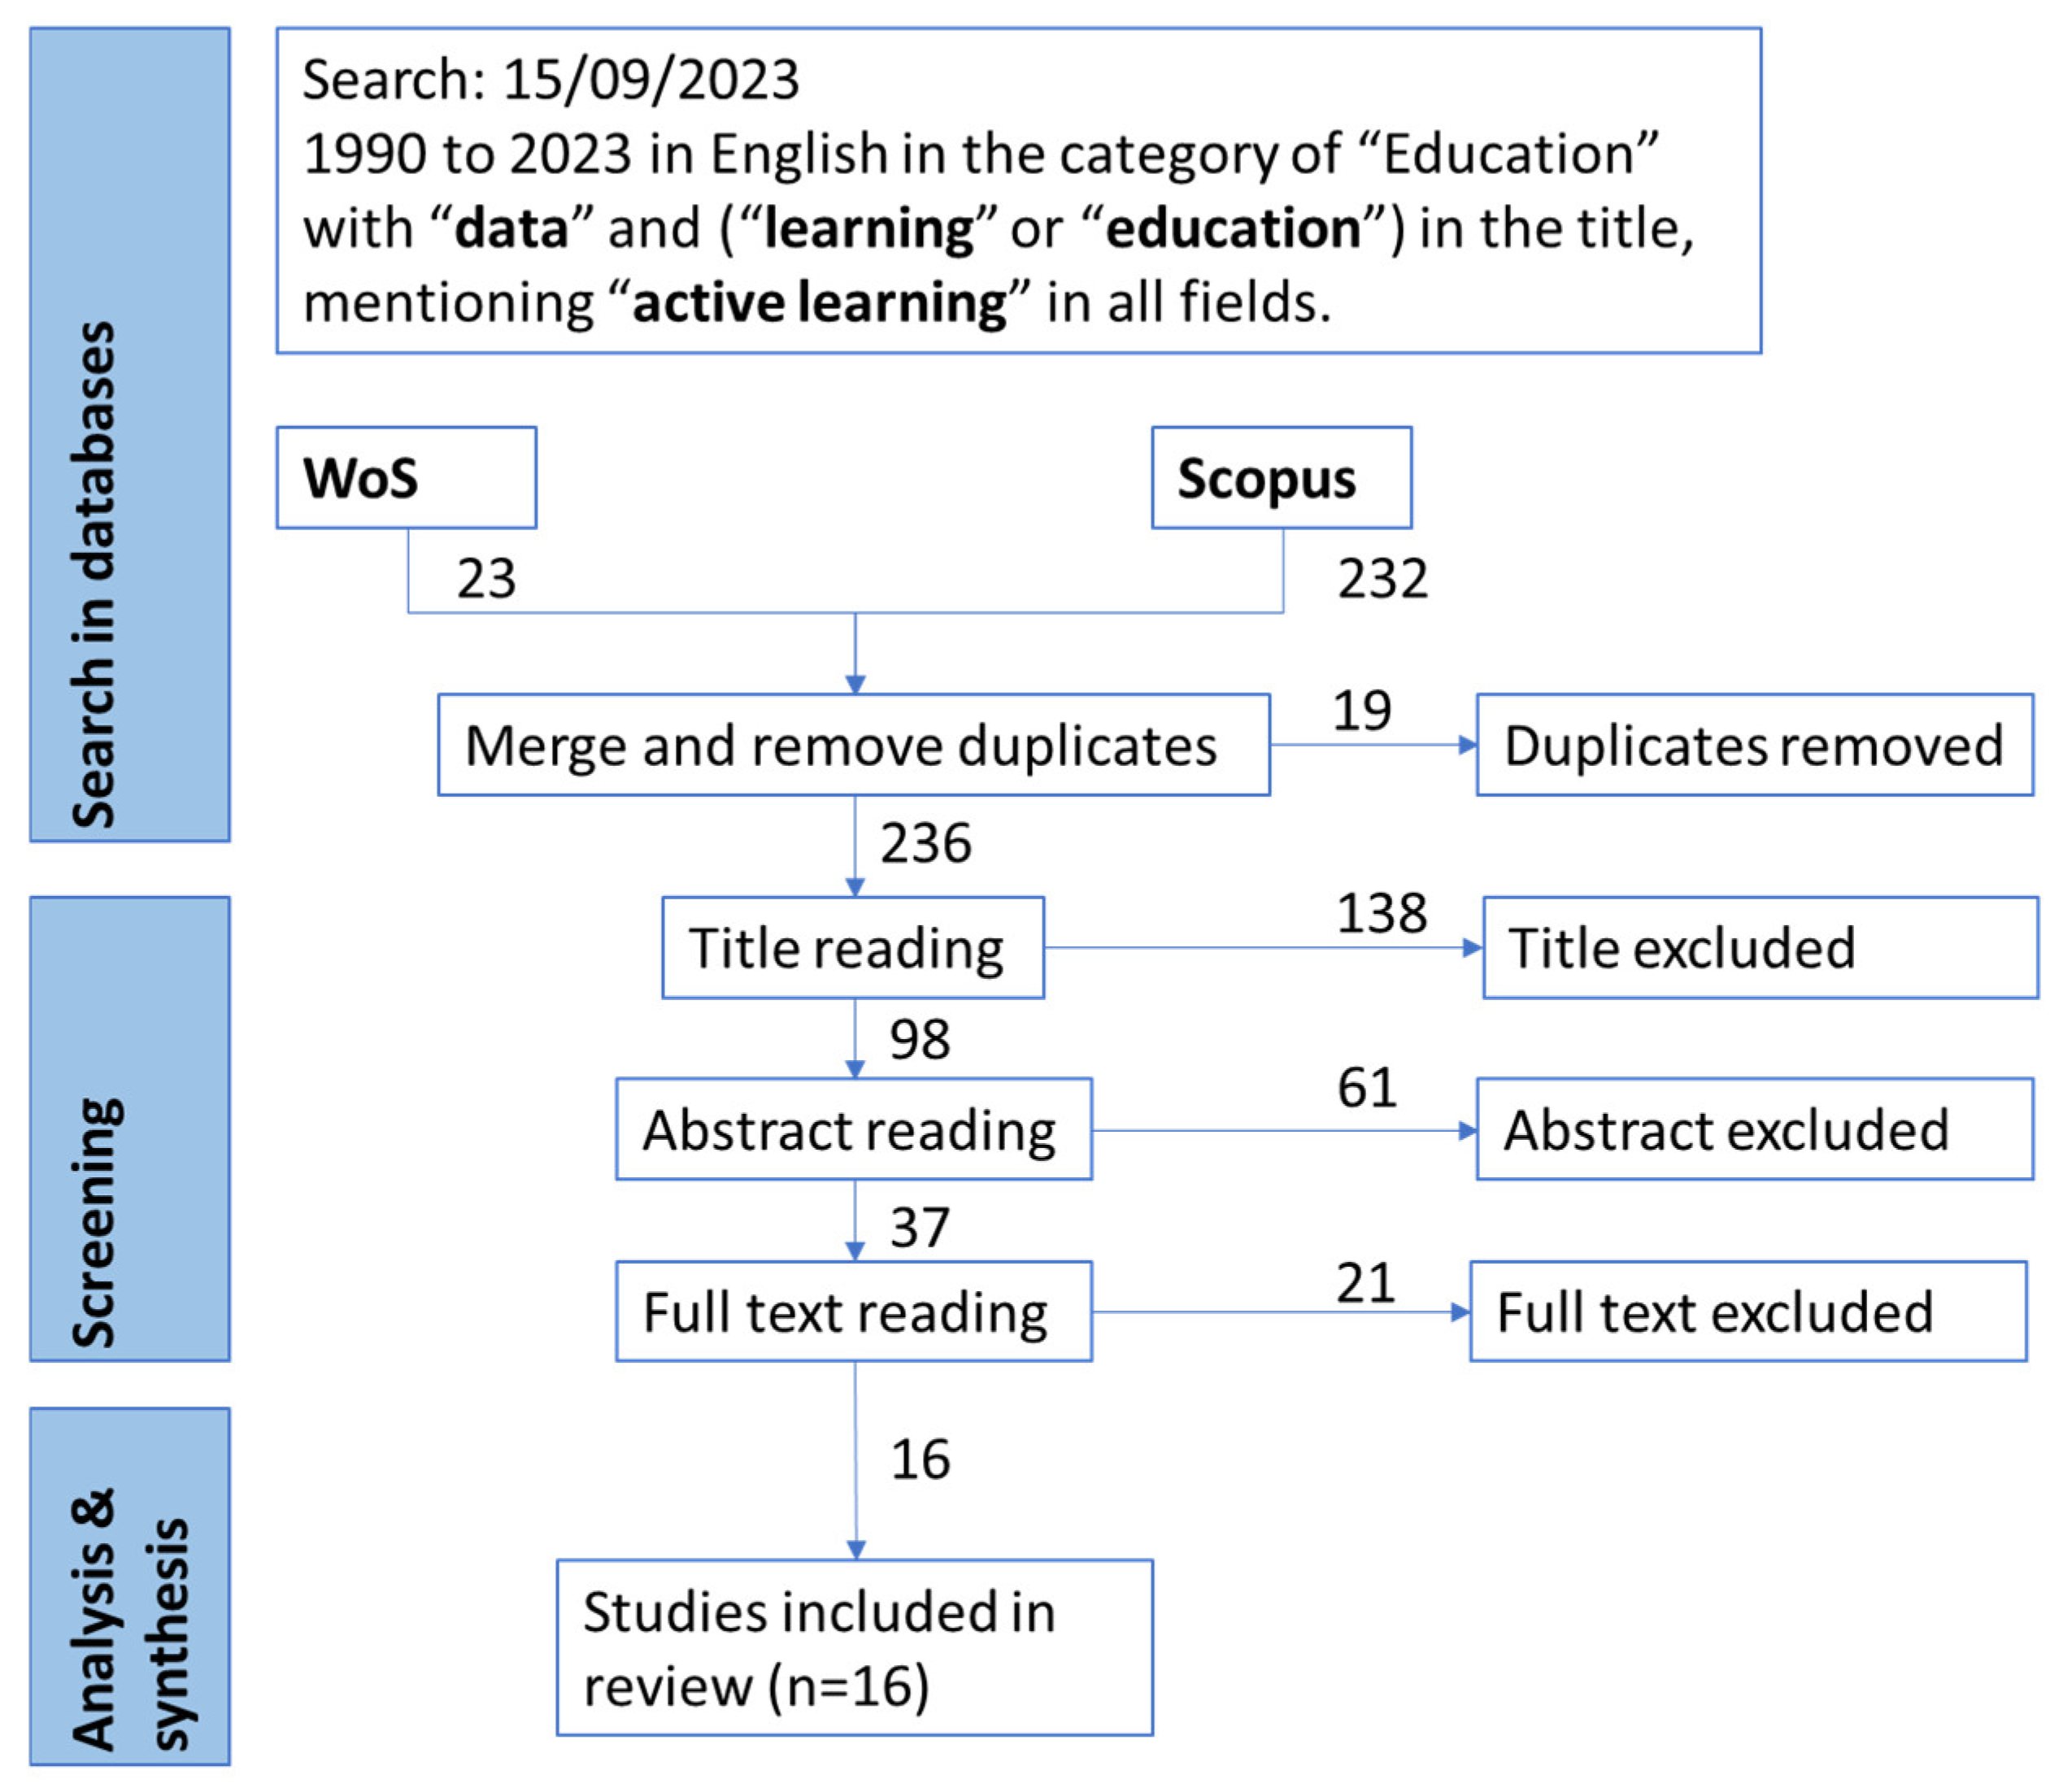
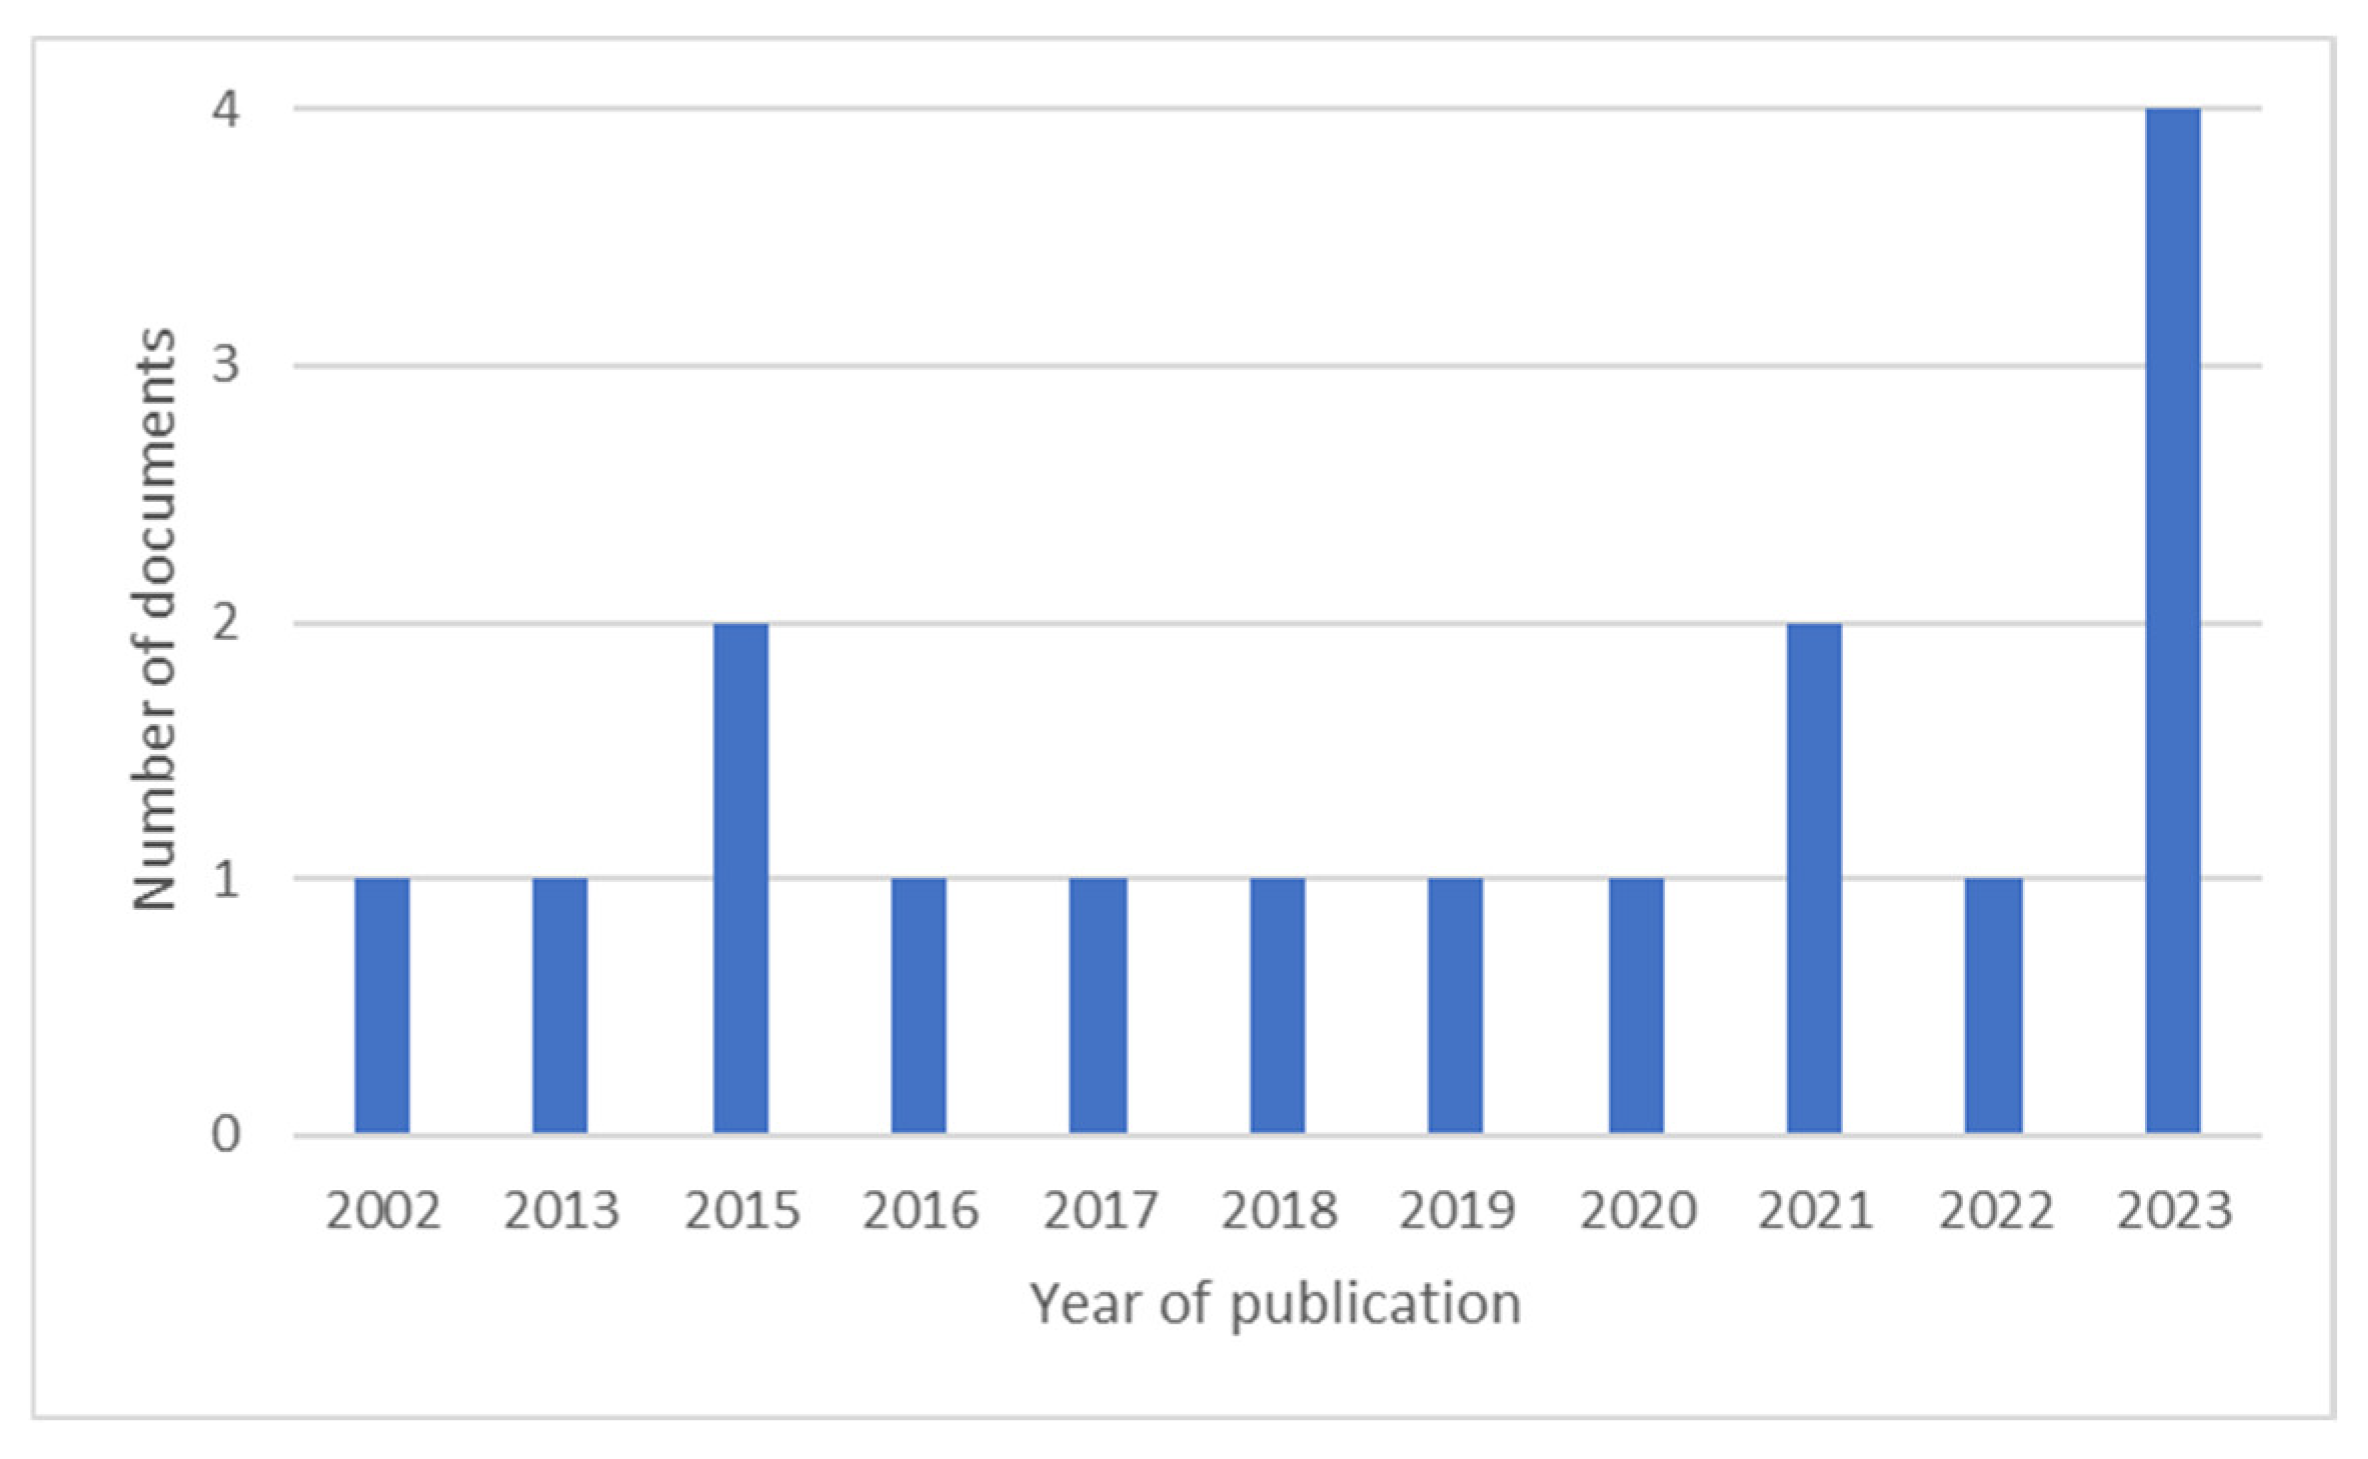
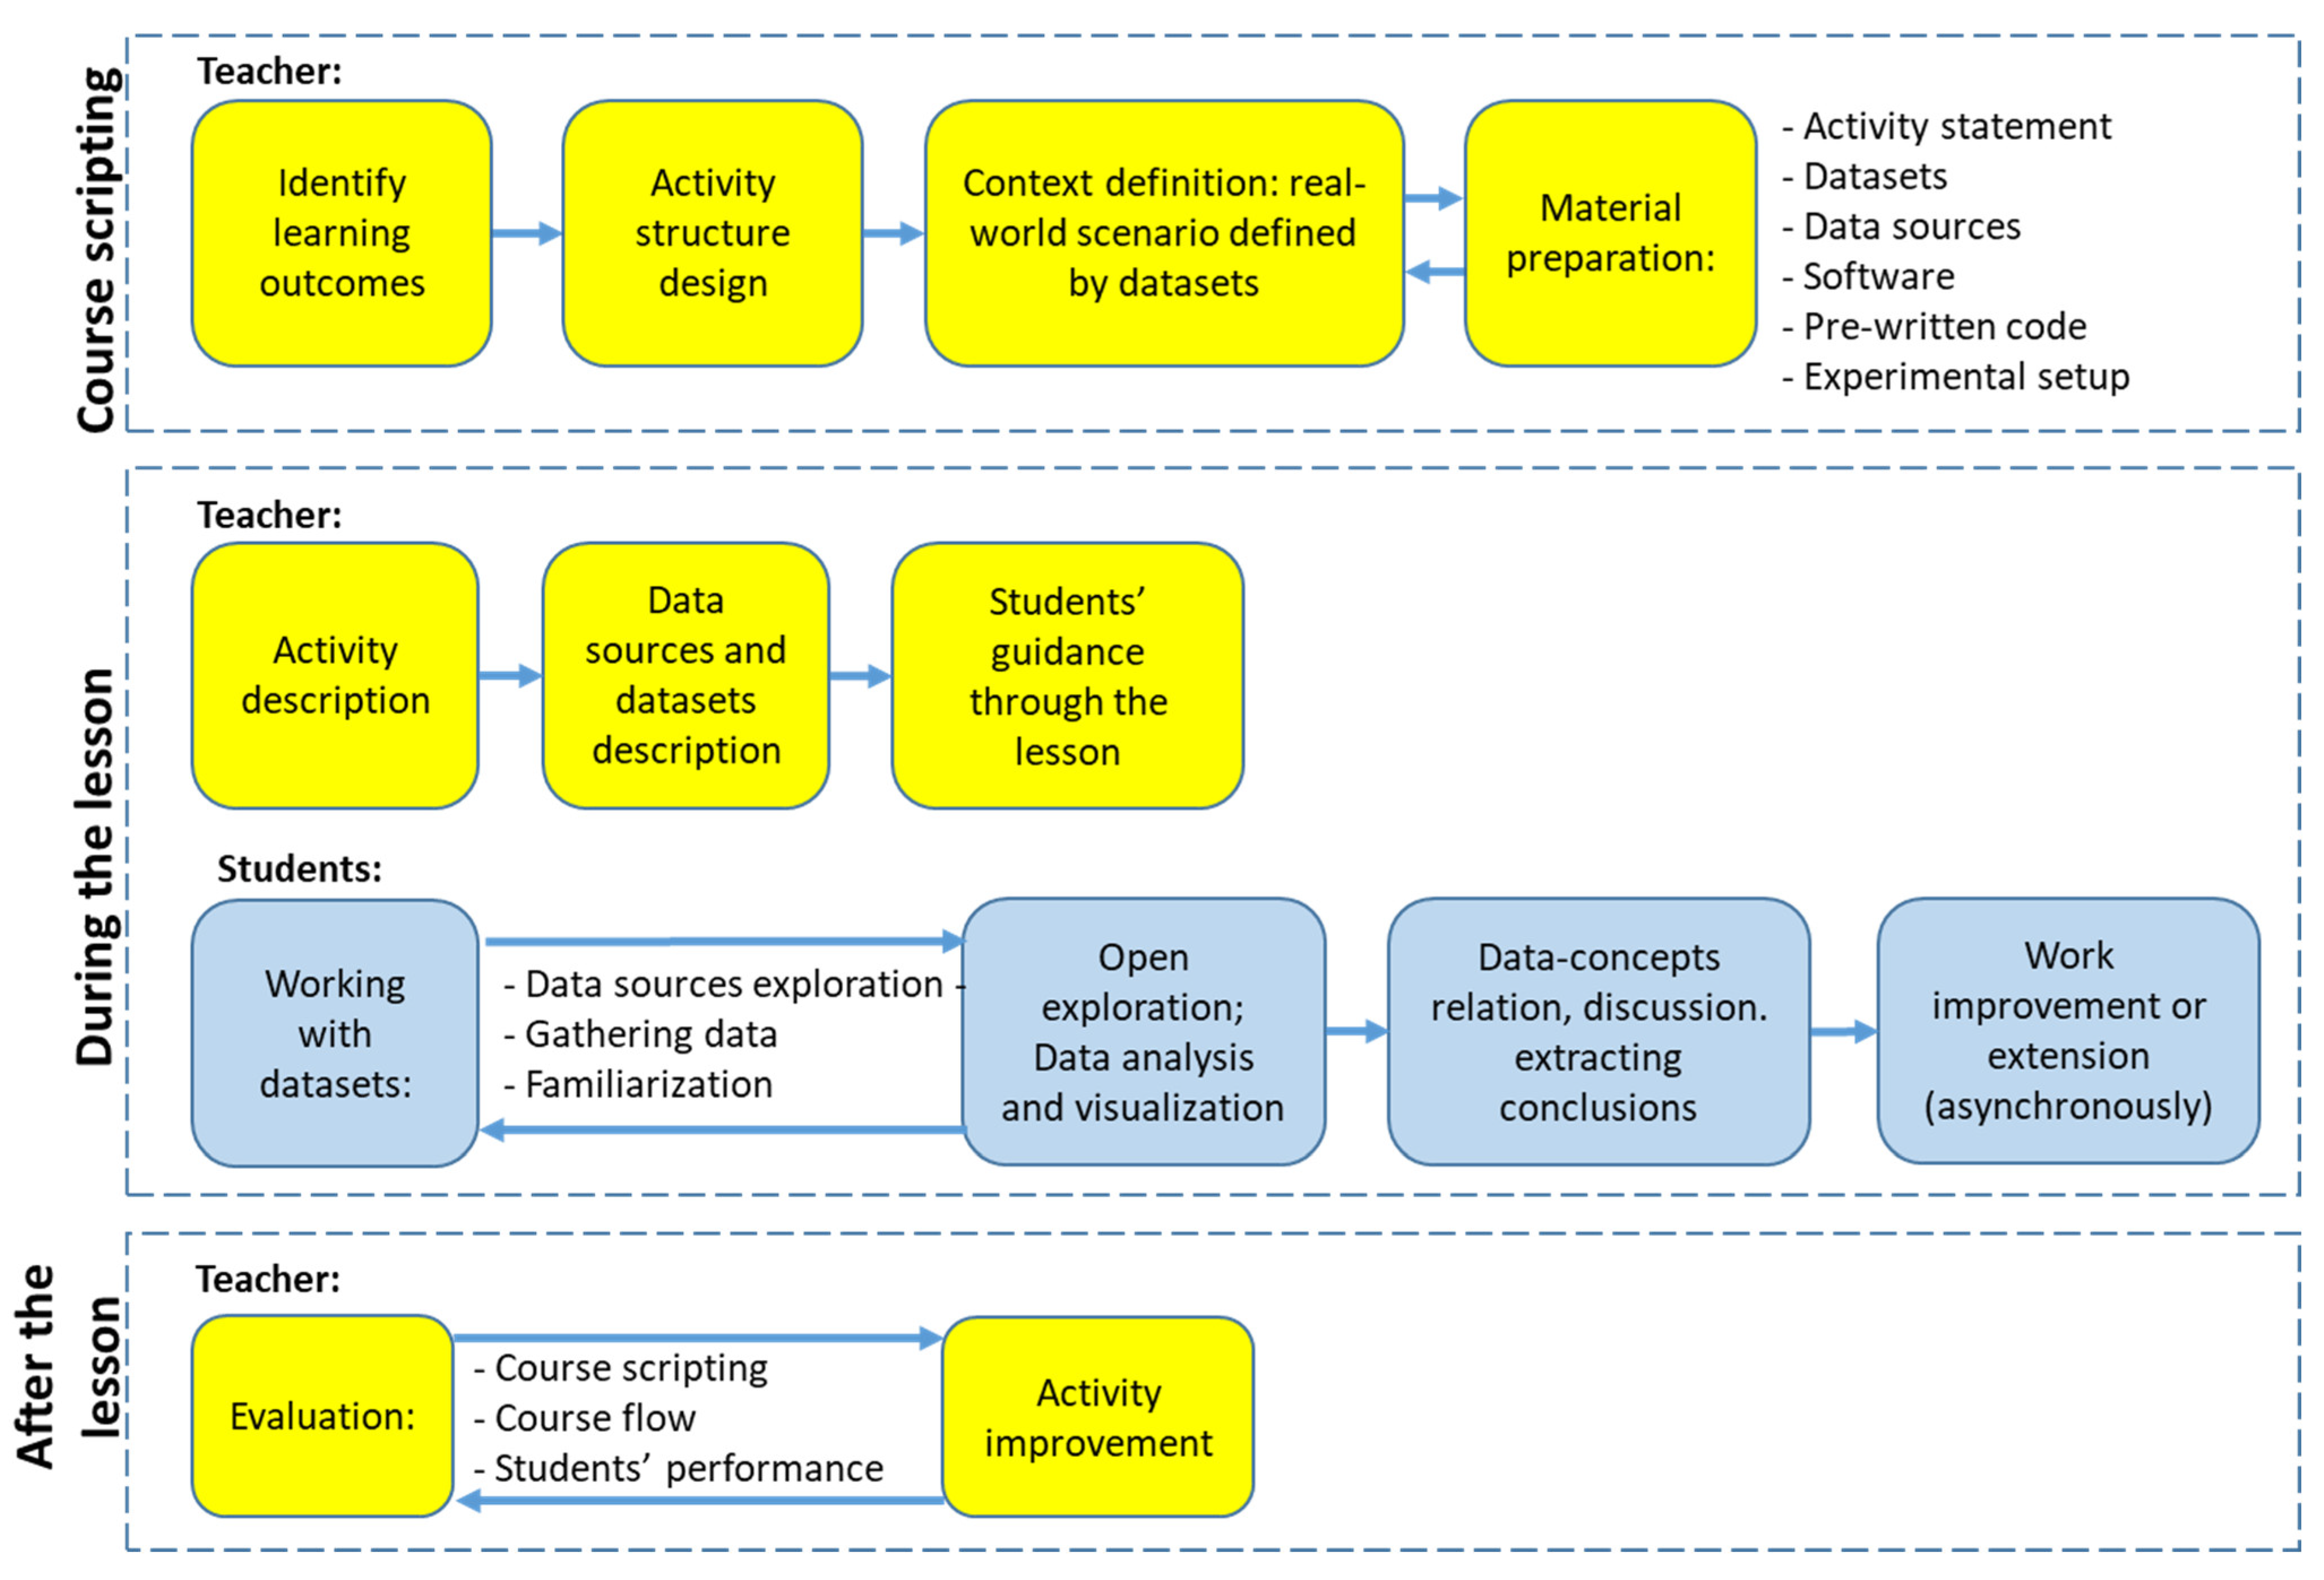


