Article

Temporal and Spatial Variations in the Normalized Difference Vegetation Index in Shanxi Section of the Yellow River Basin and Coal Mines and Their Response to Climatic Factors

School of Surveying and Land Information Engineering, Henan Polytechnic University, Jiaozuo 454000, China
*
Author to whom correspondence should be addressed.
Appl. Sci. 2023, 13(23), 12596; https://doi.org/10.3390/app132312596
Submission received: 7 October 2023 / Revised: 9 November 2023 / Accepted: 20 November 2023 / Published: 22 November 2023
(This article belongs to the Section Ecology Science and Engineering)

Abstract

:
Investigating the spatiotemporal variations in the Normalized Difference Vegetation Index (NDVI) in the Shanxi section of the Yellow River Basin and its coal mining areas holds significant importance for dynamic vegetation monitoring and mining area management. This study employs MODIS NDVI data and combines various analytical methods, including trend analysis and coefficient of variation analysis, to reveal the characteristics of NDVI spatiotemporal variations and their response to climatic factors in the study area. The results indicate the following: (1) The overall NDVI in the Shanxi section of the Yellow River Basin exhibits a growth trend with an annual growth rate of 1.82% and a 36% increase. Among the mining areas, the NDVI increase is most prominent in the Hebaopian mining area with a 100% growth, while the QinYuan mining area shows the lowest increase at 21%; (2) The NDVI in the Shanxi section of the Yellow River Basin displays high fluctuations, with areas of moderate and high fluctuations accounting for 54.39% of the total. The Hebaopian mining area has a substantial portion of high-fluctuation areas at 38.85%; (3) According to the Hurst index analysis, future vegetation changes in the Shanxi section of the Yellow River Basin are uncertain, with approximately 9.77% of areas expected to continue improving; (4) The variations in the NDVI and climatic factors across the Shanxi section of the Yellow River Basin display spatial heterogeneity. The NDVI exhibits a positive correlation with both temperature and precipitation, with the correlation with precipitation being more pronounced than that with temperature. Precipitation exerts a more significant influence on the NDVI than temperature. These findings not only provide scientific guidance for vegetation restoration and area management in the Shanxi section of the Yellow River Basin and its mining areas but also serve as a scientific basis for decision making regarding vegetation management under the influence of climate change and human activities.

1. Introduction

As a vital component of terrestrial ecosystems, vegetation plays a pivotal role in indicating the quality of the surrounding ecological environment [1]. Consequently, the long-term monitoring of vegetation dynamics holds significant importance in various domains, including global climate change [2], climate regulation [3,4], soil and water conservation [5,6] and other aspects. The Normalized Difference Vegetation Index (NDVI), being one of the commonly employed indicators in the study of vegetation cover changes, effectively captures the growth status of regional vegetation [7].
Coal mining can result in varying degrees of surface subsidence, surface cracks, land damage [8], and groundwater pollution [9], factors that contribute to vegetation damage in different ways. Research utilizing MODIS NDVI data has found that the analysis of NDVI time-series trends is suitable for detecting changes in vegetation areas and identifying land degradation [10]. By analyzing NDVI time series and comparing the changes in the NDVI between mining and non-mining areas, it becomes evident that mining activities have a very noticeable negative impact on ecosystem vegetation [11]. Studies conducted on several large mining areas have shown that 40% of these areas exhibit reduced vegetation trends following mining, with 8.34% of them significantly impacted by human activities, leading to vegetation degradation [12]. Vegetation degradation can further lead to a decline in the ability of vegetation to absorb carbon [13]. Furthermore, existing research has indicated that there are still risks of overall vegetation degradation in reclaimed coal mining areas. All of the above discussions collectively emphasize the effectiveness of using the NDVI time series to monitor changes in vegetation conditions caused by mining activities [14,15].
The Yellow River Basin serves as a crucial ecological barrier in China and is also a significant economic region, often referred to as the “energy basin” [16]. Among China’s 14 major coal bases, nine are situated within the Yellow River Basin [17]. Shanxi province holds a prominent position in the Yellow River Basin and is one of the country’s most critical coal production areas, playing a vital role in ensuring China’s energy security [18]. While large-scale coal mining has driven national and local economic and social development, it has also brought about a series of issues, including surface water and soil erosion, vegetation degradation, and damage to arable land. These problems have severely harmed the originally fragile ecological environment of the basin. According to relevant survey data, Shanxi province has witnessed the formation of a coal mining subsidence area covering 6500 square kilometers, which accounts for 4.20% of the province’s total area. Within this subsidence area, the portion within the Yellow River Basin amounts to 4100 square kilometers, constituting 63.07% of the total coal mining subsidence area in the Shanxi province. Furthermore, the coal-mining subsidence area continues to expand at an annual rate of 50 square kilometers, significantly affecting the livelihoods and productivity of the local population [19].
Among the many scholars’ studies, a considerable focus has been placed on monitoring the ecological environment across the entire Yellow River Basin [20,21]. Numerous research findings indicate favorable improvements in the vegetation conditions within the Yellow River Basin, with the most pronounced enhancements occurring in the central region. Overall, the changes have exhibited a degree of stability and sustainability. An analysis of the driving factors reveals that precipitation, humidity, and sunlight exert the most significant influence on vegetation cover. The relationship between these factors and changes in runoff and runoff coefficients is relatively complex, lacking clear correlations. With increased national attention on ecological governance in the Yellow River Basin, experts and scholars have gradually expanded their research to encompass various provinces within the basin [22]. Existing research indicates that the vegetation cover in the Shanxi section of the Yellow River Basin has experienced a highly significant increase. The variations in the NDVI are influenced by climate changes, human activities, and the combined effects of both [23]. In the Henan section of the Yellow River Basin, there has been a significant improvement in vegetation cover from 2001 to 2020, with noticeable spatial disparities. Land-use type emerges as a primary influencing factor [24]. Through an examination of the NDVI changes across different land-use types in the Shanxi section of the Yellow River Basin, researcher Fu Jianxin has determined that forested areas exhibit superior vegetation cover compared to cultivated land and grasslands. Furthermore, there are significant spatial variations in the NDVI values among different land-use types [25].
In previous research, there has been a predominant focus on studying the long-term NDVI trends and influencing factors across the entire Yellow River Basin, with relatively limited attention given to ecological research within the mining areas of the Shanxi section of the Yellow River Basin. Shanxi province, known for its significant coal mining activities and numerous mining areas, serves as the backdrop for this study. Based on this, the study focuses on the Shanxi section of the Yellow River Basin and eight coal mining areas within this region. Given the multitude of mining activities within the study area that may potentially result in vegetation damage, the research aims to investigate the temporal changes in vegetation cover. By monitoring the dynamic changes in vegetation cover, the study intends to provide scientific guidance for the ecological restoration and management of vegetation in both the Shanxi section of the Yellow River Basin and the mining areas.

2. Materials and Methods

2.1. Study Area

The Shanxi section of the Yellow River Basin is situated in the western region of Shanxi Province, within the middle reaches of the Yellow River Basin (34°34′–40°17′ N, 110°13′–113°32′ E) (Figure 1) [26]. It spans across four cities, namely Xinzhou, Lüliang, Linfen, and Yuncheng, encompassing a total of 19 counties. The Yellow River’s course within the Shanxi segment extends approximately 965 km, accounting for nearly one-fifth of the river’s total length. Furthermore, the drainage basin in this region covers an extensive area of 97,100 square kilometers, representing 62.2% of the total land area of Shanxi Province [27]. The topography within the study area is characterized by significant undulations, and it belongs to the eastern part of the Loess Plateau. The predominant soil types found in this region are primarily loess and brown soil. The study area is located in the inland region of the mid-latitude zone and is characterized by a temperate continental monsoon climate. Influenced by factors such as solar radiation, monsoon circulation, and topography, the climate in the study area exhibits four distinct seasons, concurrent rainfall and warmth, ample sunshine, and significant north–south climate variations. The annual average temperature in the study area ranges between 10.1 °C and 11.5 °C. Generally, there is a trend of increasing temperatures from north to south and decreasing temperatures from basin areas to highlands. Meanwhile, the annual cumulative precipitation in the study area varies between 391 mm and 679 mm, with notable influence from the local topography [28]. Notably, the Shanxi section of the Yellow River Basin is home to eight mining areas, including the Jincheng, Qinyuan, and Huozhou mining areas, which are designated as the initial batch of state-planned mining areas within this specific segment of the Yellow River Basin.

2.2. Data Sources and Preprocessing

The NDVI data utilized in this study were sourced from the MOD13Q1 dataset provided by the National Aeronautics and Space Administration (NASA) of the United States (https://www.earthdata.nasa.gov/, accessed on 18 February 2023). This dataset has a spatial resolution of 250 m and a temporal resolution of 16 days. Using Google Earth Engine (GEE), a total of 460 NDVI images from 1 January 2001 to 2020 were stitched together, subjected to coordinate transformation, and then cropped. Afterward, the mean value method was used to obtain annual NDVI images for the study area. The boundary data for the mining areas were extracted from the “Planning for the Construction of Large Coal Bases” issued by the National Development and Reform Commission (NDRC) of China (Fa Gai Energy [2006] No. 352), which includes eight nationally planned coal mining areas within the Shanxi section of the Yellow River Basin. The study boundaries were adjusted based on the boundary data of the Shanxi section of the Yellow River Basin. Digital Elevation Model (DEM) data were obtained from the Geographic Spatial Data Cloud (https://www.gscloud.cn/search, accessed on 18 February 2023). Meteorological data, including daily temperature and precipitation records from meteorological stations within the Shanxi section of the Yellow River Basin, were sourced from the China Meteorological Data Network (http://data.cma.cn, accessed on 14 March 2023). Interpolation and resampling processes were performed using ArcGIS 10.2 software to match the resolution of the NDVI data.

2.3. Research Methods

2.3.1. Trend Analysis Method

To investigate the spatial changes in vegetation cover within the Shanxi section of the Yellow River Basin from 2001 to 2020, a univariate linear trend analysis method was employed. This involved calculating trends for each pixel in the NDVI data on an annual basis [29]. The results provide insights into the spatiotemporal characteristics of vegetation cover changes across the entire study area [30]. The formula for this analysis is as follows:
s l o p e = n × i n i × N D V I i i n i × i = 1 n N D V I i n × i = 1 n i 2 ( i = 1 n i ) 2
where slope represents the slope of the NDVI change trend for each pixel, where a positive slope (slope > 0) indicates a growth trend and a negative slope (slope < 0) indicates a degradation trend; n denotes the number of years during the study period, n = 20 in this study; and N D V I i is the NDVI value of the ith year of the cell. The significance of the change trend is determined using the F-test method, with the significance level indicating the confidence associated with the trend rather than the speed or magnitude of the change. The formula for calculating the F-test is as follows:
F = U × N 2 Q ,
U = i = 1 n ( y ^ i y ¯ ) 2 ,
Q = i = 1 n ( y i y ^ i ) 2
where U represents the sum of squared errors for the time series; Q signifies the sum of squared errors for the time series; y i is the NDVI value of the ith year; y ^ i is its regression value; y ¯ is the average of the NDVI; n is the number of years of study. Based on the results of the F-test and trend analysis, this paper categorizes the trends in vegetation cover changes as follows: extremely significant improvement (slope > 0, p ≤ 0.01), significant improvement (slope > 0, 0.01 < p ≤ 0.05), insignificant improvement (slope > 0, p > 0.05), insignificant degradation (slope < 0, p > 0.05), significant degradation (slope < 0, 0.01 < p ≤ 0.05), and extremely significant degradation (slope < 0, p ≤ 0.01).

2.3.2. Stability Analysis

The Coefficient of Variation (CV), also known as the “Coefficient of Dispersion”, is the ratio of the standard deviation to the mean. It serves as a measure that can, to some extent, reflect the spatial distribution characteristics of the interannual stability of vegetation indices [31]. By utilizing 20 years of NDVI data in the study area, the coefficient of variation for each pixel was calculated. This process enabled the assessment of the extent of NDVI variation over the course of these two decades in the Shanxi segment of the Yellow River Basin. Its calculation formula is as follows:
C V = S D N D V I N D V I ¯ ,
S D N D V I = i = 1 n N i 2 ( i = 1 n N i ) 2 / n n
where CV represents the NDVI coefficient of variation, S D N D V I is the standard deviation of the NDVI, N D V I ¯ is the mean of the NDVI, N i is the NDVI value of the ith year, and n is the length of the time series of the study period (here n = 20).

2.3.3. Hurst Index Analysis

The Hurst Index, originally proposed by British hydrologist Hurst, is a quantitative measure used to describe the future trends in long time-series data [32]. It is a commonly employed method for characterizing the persistence of trends in time-series data [33]. The computational principles of the Hurst Index are as follows.
The NDVI time series N D V I i , i = 1, 2, 3, 4, …, n, for any positive integer m, define this time series:
(1)
Differential Sequence:
Δ N D V I i = N D V I i N D V I i 1 ;
(2)
Mean Sequence:
Δ N D V I ( m ) ¯ = 1 m i = 1 n Δ N D V I i ( m = 1 , 2 , , n ) ;
(3)
Cumulative Difference:
X ( t ) = i = 1 m ( Δ N D V I i Δ N D V I ( m ) ¯ )   ( 1 t m ) ,
(4)
Range:
R ( m ) = max X ( t ) 1 m n min X ( t ) 1 m n ( m = 1 , 2 , , n ) ,
(5)
Standard Deviation:
S ( m ) = [ 1 m i = 1 m ( Δ N D V I i Δ N D V I ( m ) ¯ ) 2 ] 1 2 ( m = 1 , 2 , , n ) .
Regarding the ratio R(m)/S(m) ≅ R/S, if R / S m H , it indicates the presence of the Hurst phenomenon in the analyzed NDVI time series [34]. In a double-logarithmic coordinate system, the value of H is obtained by fitting the equation using the least squares method. H is referred to as the Hurst Index [35]. The magnitude of H can be used to assess the persistence of the NDVI sequence. The calculation mentioned above was applied to the pixel values for each pixel in the study area over a span of 20 years. This process resulted in the Hurst index values for all the pixels in the study area, providing data on the sustainability of the changing trends in the region.
The Hurst Index can assume three different values: if 0.5 < H < 1, it indicates that the time series is a persistent sequence, characterized by long-term correlations; if H = 0.5, it signifies that the NDVI time series is a random sequence, lacking long-term correlations; if 0 < H < 0.5, it suggests that the NDVI time series exhibits anti-persistence [36]. The closer the H value is to 0, the stronger its anti-persistence; the closer to 1, the more persistent it is. According to Table 1, the trends in the NDVI and the results of the Hurst Index are combined to analyze and predict the future trends in the NDVI.

2.3.4. Partial Correlation Analysis

Partial correlation analysis is a method used to analyze the correlation between two variables while controlling for the linear influence of other variables [37]. It has been widely employed in studies examining the correlation between the NDVI and climatic factors [38]. Typically, one of the precipitation or temperature factors is treated as a constant and the partial correlation relationship between the other factor and the NDVI is studied [39]. The correlation coefficients were calculated for each pixel by using the temperature and precipitation data from 2001 to 2020 in conjunction with the corresponding NDVI data. This process ultimately yielded information about the correlation between temperature, precipitation, and NDVI changes across the entire study area. Its calculation formula is as follows:
r x y , z = R x y R x z R y z ( 1 R 2 x y ) ( 1 R 2 y z )
where r x y , z is the partial correlation coefficient and R x y , Ryz, and R x z are the correlation coefficients between the NDVI, precipitation, and temperature. The significance test of the biased correlation coefficient adopts the t-test method, and its calculation formula is as follows:
t = r n m 1 1 r 2
where t is the statistic, r is the partial correlation coefficient, n is the number of samples, and m is the number of independent variables.

3. Results and Analysis

3.1. Analysis of NDVI Trends from 2001 to 2020

Examining the annual interannual variation trends of NDVI means in the Shanxi section of the Yellow River Basin and various mining areas from 2001 to 2020 (Figure 2), it is evident that both the Shanxi section of the Yellow River Basin and the individual mining areas have shown an overall increasing trend during this period. Specifically, the multi-year NDVI mean in the Shanxi section of the Yellow River Basin has increased from 0.54 in 2001 to 0.73 in 2020, with an annual growth rate of 1.82%. Among the eight mining areas, the Xiangning, Liulin, Hebaopian, Lishi, and Huozhou mining areas have all exhibited higher annual growth rates than the Shanxi section of the Yellow River Basin, with rates of 1.92%, 2.79%, 4.93%, 1.95%, and 2.39%, respectively. Notably, the Hebaopian mining area has seen a remarkable doubling in NDVI mean values, rising from 0.21 to 0.42, while the Qin Yuan mining area had a relatively lower annual growth rate of 0.97%. Overall, the NDVI trends in the mining areas are generally consistent with the overall trend in the Shanxi section of the Yellow River Basin. From 2001 to 2013, they all exhibited increasing trends, while from 2014 to 2020, they showed fluctuating trends. In 2015, there was a significant decrease in NDVI values in both the Shanxi section of the Yellow River Basin and the various mining areas. This decline may be attributed to an increase in geological disasters such as landslides and ground collapses. The NDVI in the Shanxi section of the Yellow River Basin varied between 0.54 and 0.73, with an annual mean of 0.68, reaching its highest value in 2013. In contrast, the NDVI in the various mining areas ranged from 0.2 to 0.5, with an annual mean falling between 0.2 and 0.4, consistently lower than that of the Shanxi section of the Yellow River Basin. These results collectively indicate a year-on-year improvement in vegetation cover in the Shanxi section of the Yellow River Basin and the various mining areas.
This paper quantitatively examines the trends in the NDVI within the study area using trend analysis. It calculates the proportion of areas falling into each trend category and, based on the results of significance tests, categorizes the NDVI trends into five levels. According to Table 2 and Figure 3, in the Shanxi section of the Yellow River Basin, the proportions of areas with increased, relatively stable, and decreased NDVI are 80.56%, 17.51%, and 1.93%, respectively. This indicates a significant increase in vegetation cover in the Shanxi section of the Yellow River Basin, with 71.25% of the area experiencing a significant increase and only 1.93% of the area showing a slight decrease in vegetation cover. Among the eight mining areas, Jincheng Mining Area has the lowest proportion of areas with increased vegetation cover, at 56.24%, while the other mining areas have proportions exceeding 80%. The research findings demonstrate that over the nearly 20-year period from 2001 to 2020, there has been a significant overall increase in vegetation cover in the Shanxi section of the Yellow River Basin, and significant improvements in vegetation cover have been observed in all mining areas.

3.2. Stability Analysis of the NDVI in the Shanxi Section of the Yellow River Basin

The coefficient of variation is calculated on a cell-by-cell basis and is divided into five levels based on the magnitude of the CV: low fluctuation change (CV ≤ 0.05), lower fluctuation change (0.05 < CV ≤ 0.10), medium fluctuation change (0.10 < CV ≤ 0.15), higher change (0.15 < CV ≤ 0.20), and high volatility change (0.20 < CV) (Table 3 and Figure 4). From 2001 to 2020, the NDVI variation in the Shanxi section of the Yellow River Basin has exhibited relatively high levels of variability, with areas having moderate to high variability accounting for 54.39% of the total area. High variability areas are primarily concentrated in the southern cities of Yuncheng and Linfen, as well as the northwestern city of Lvliang. When analyzing the variability in mining areas, the Huozhou mining area and Hebaopian mining area have a significant proportion of high variability areas, accounting for 17.87% and 38.85%, respectively. The remaining mining areas mostly fall into the category of moderate variability.

3.3. Sustainability Analysis of the NDVI in the Future

Based on the NDVI data from the Shanxi section of the Yellow River Basin for the years 2001 to 2020, Hurst Indices were calculated pixel by pixel. Referring to previous research, the Hurst Index is classified into five categories: strong anti-persistence (0 < H ≤ 0.2), weak anti-persistence (0.2 < H ≤ 0.4), random uncertainty (0.4 < H ≤ 0.6), weak persistence (0.6 < H ≤ 0.8), and strong persistence (0.8 < H ≤ 1). The spatial distribution of the Hurst Index for the Shanxi section of the Yellow River Basin is illustrated in Figure 5. The results indicate that the overall change in the study area exhibits uncertainty and relatively low sustainability. Approximately 17.56% of the area is expected to show a weak anti-persistence trend, while 10.77% of the area is projected to display weak persistence. Based on the analysis of NDVI trends and the Hurst Index results, further analysis of the future NDVI changes in the Shanxi section of the Yellow River Basin was conducted. The future NDVI changes in the Shanxi section of the Yellow River Basin are generally random in spatial distribution. Areas showing continuous improvement account for 9.77% of the total area, primarily located in the northwestern part of Xinzhou City and the central–western part of Yuncheng City. Areas transitioning from improvement to degradation make up 16.67% of the total area, mainly concentrated in the western part of Lvliang City.

3.4. Response of the NDVI in Shanxi Section of the Yellow River Basin to Climatic Factors

Figure 6 illustrates the interannual variations in the NDVI, annual mean temperature, and annual cumulative precipitation in the Shanxi section of the Yellow River Basin. From 2001 to 2020, the highest annual mean temperature reached 11.46 °C, while the lowest was 10.09 °C, showing relatively little variation. In contrast, the annual cumulative precipitation ranged from a maximum of 679.37 mm to a minimum of 391.24 mm, with a significant difference of 288.13 mm between the maximum and minimum values. Overall, precipitation showed an increasing trend, while the annual mean temperature remained relatively stable. By calculating the correlation coefficients between the NDVI and these two climate variables, it was observed that the NDVI exhibited a significant positive correlation with annual cumulative precipitation (r = 0.464; p = 0.039 < 0.05), whereas the correlation between NDVI and annual mean temperature was positive but not statistically significant (R = 0.185, p > 0.05). Comparing the correlation coefficients, it was evident that the NDVI had a stronger correlation with annual cumulative precipitation in the study area. Furthermore, from Figure 6, it can be observed that in the years 2007, 2013, and 2016, when the annual cumulative precipitation reached a small peak, the NDVI also exhibited a corresponding small peak. Therefore, increased precipitation in the study area had a more significant impact on vegetation cover.
To further investigate the intrinsic connection between the NDVI and climate factors in the study area, this paper conducted a quantitative study on the relationship between climate factors and the NDVI. It calculated the partial correlation coefficients between the NDVI and annual mean temperature, as well as between the NDVI and annual cumulative precipitation at the pixel level. Significance tests were also performed and, based on the magnitude of the partial correlation coefficients and their significance, the results were categorized, leading to the generation of Figure 7 and Figure 8.
The research results indicate that, in the Shanxi section of the Yellow River Basin, 66.01% of the region shows a positive correlation between the NDVI and annual mean temperature, while 27.84% of the region exhibits a negative correlation. The areas with a positive correlation are widespread, primarily concentrated in the southern and eastern parts, whereas the regions with a negative correlation are mainly found in the central areas of the hilly terrain in the western part of the Shanxi Plateau, the city area of Taiyuan, and near the Yuncheng Basin. From the perspective of the distribution within mining areas, each mining area has certain regions with a negative correlation, primarily located in the southeastern parts of the Liulin mining area, the Hebopiao mining area, and the southeastern part of the Jincheng mining area. From Figure 6a, it can be observed that the proportion of significantly positive correlated regions is minimal, mainly located in the southeastern part of the Linfen Basin.
The partial correlation coefficients between the NDVI and annual cumulative precipitation in the Shanxi section of the Yellow River Basin range from −0.67 to 0.88. The graded statistical results indicate that the relationship between the NDVI and annual cumulative precipitation in the Shanxi section of the Yellow River Basin is primarily positive, accounting for 94.52% of the total. Among these, the areas with no significant positive correlation, significantly positive correlation, and highly significant positive correlation account for 63.24%, 18.93%, and 12.35%, respectively. Spatially, they are mainly distributed in the southern, northwestern, and central–western regions. The negative correlation regions only make up 5.48% of the total. Within the Liulin mining area and the Hebopiao mining area, there is a significant proportion of highly significant positive correlation areas, and the Xishangujiao mining area also has a considerable presence of significantly positive correlation areas.

4. Discussion

This study utilized various methods, including trend analysis, coefficient of variation (CV), and Hurst Index, to analyze NDVI data in the Shanxi section of the Yellow River Basin. Through this analysis, the study identified the NDVI trends in the Shanxi section of the Yellow River Basin from 2001 to 2020. Additionally, by incorporating meteorological data and information about mining areas, the study investigated the impact of climatic factors on the NDVI variations within the mining regions.
The temporal variations in the NDVI in the Shanxi section of the Yellow River Basin exhibit spatial heterogeneity, showing an overall improving trend. These research findings align with conclusions about the gradual increase in vegetation cover in [40] and the Yellow River Basin [41,42]. The annual growth rate of the NDVI in the Shanxi section of the Yellow River Basin is 1.82% per year. Over the course of 20 years, the NDVI decreased compared to the previous year in only 6 years, while in the remaining years, the NDVI increased compared to the previous year. Moreover, there was a continuous growth trend from 2008 to 2013. Areas with higher vegetation cover in the Shanxi section of the Yellow River Basin are primarily located along the sides of the Lvliang Mountains and Taihang Mountains [43]. This is attributed to ecological comprehensive management projects, such as large-scale afforestation and ecosystem conservation efforts. In contrast, the western highland hilly regions exhibit significant topographical variations, receive less precipitation, and have poorer hydrothermal conditions, resulting in relatively lower vegetation cover.
In the areas surrounding mining zones, it can be considered that they are subject to the same climatic influences as the mining areas. The fluctuation in the NDVI within the mining zones is higher than in other regions. To some extent, this suggests that, in accordance with national ecological conservation requirements, improvements in vegetation management within mining areas have led to a relatively higher increase in the NDVI compared to other regions. The NDVI values in the mining areas are lower than the overall NDVI value in the Shanxi section of the Yellow River Basin, which is closely associated with mining activities. Coal-mining activities can lead to land subsidence and surface deformation, which, in turn, affect vegetation growth [44]. Additionally, previous studies have shown that mining activities can impact surface and groundwater, reducing water absorption by vegetation roots and leading to a decrease in vegetation cover [45].
According to government reports, starting from 2006, the national government initiated the first batch of national planning mining zones. These regulations imposed minimum mining scales on various mining areas, with coal mines not allowed to produce less than 1.2 million tons per year. With the implementation of national economic development and ecological environmental governance policies, various mining areas have further reduced their impact on the surrounding ecological environment through policies such as mineral resource integration and the closure and elimination of non-compliant mines [46]. Taking the Jincheng mining zone as an example, according to the Jincheng mining zone’s environmental impact report, mining land has decreased by 6.28% over a 10–20 year period, and the average vegetation coverage has increased from 57% to 61%. This indicates that, with the introduction of various environmental protection policies and the construction of ecological conservation projects, the ecological conditions in mining areas are gradually improving.
Numerous studies have indicated that meteorological factors play a significant role in influencing NDVI [47,48,49]. When analyzing the impact of these two factors in the Shanxi section of the Yellow River Basin, it becomes evident that precipitation has a greater influence compared to temperature. In over 90% of the study area, vegetation cover exhibits a positive correlation with precipitation. This correlation is especially pronounced in mountainous and hilly regions, where the impact of precipitation on vegetation change is more significant. On the other hand, vegetation cover shows a lower response to temperature variations. In the Shanxi section of the Yellow River Basin, the relationship between vegetation cover and temperature change is not significant, with only 1% of the area exhibiting an extremely significant positive/negative correlation. The Shanxi section of the Yellow River Basin is located in the middle-latitude region and is geographically shielded by the Taihang Mountains to the east [50]. The climate is characterized as a temperate continental monsoon climate, with annual average temperature variations within 1 °C from 2001 to 2020. This may explain the relatively weak correlation between the NDVI and temperature in the study area.
This study has analyzed the overall trends in vegetation cover changes in the Shanxi section of the Yellow River Basin, including planned mining areas. It holds significant implications for ecological monitoring and management in the Yellow River Basin and the mining areas. However, there are some limitations in this research: (1) The study lacks a detailed analysis of the impacts of human activities, such as changes in population, ecological conservation policies, and coal mining activities within the mining areas, on vegetation cover. (2) The research has focused primarily on climate factors as drivers of vegetation cover changes in mining areas, and it has not extensively examined other factors such as land use changes and alterations in groundwater patterns resulting from mining activities. Future research should address these gaps, with a particular focus on delving into the patterns of surface disruption and mechanisms driving vegetation damage in mining areas. This will provide essential theoretical support for sustainable coal mining and ecological preservation in the Shanxi section of the Yellow River Basin.

5. Conclusions

(1)
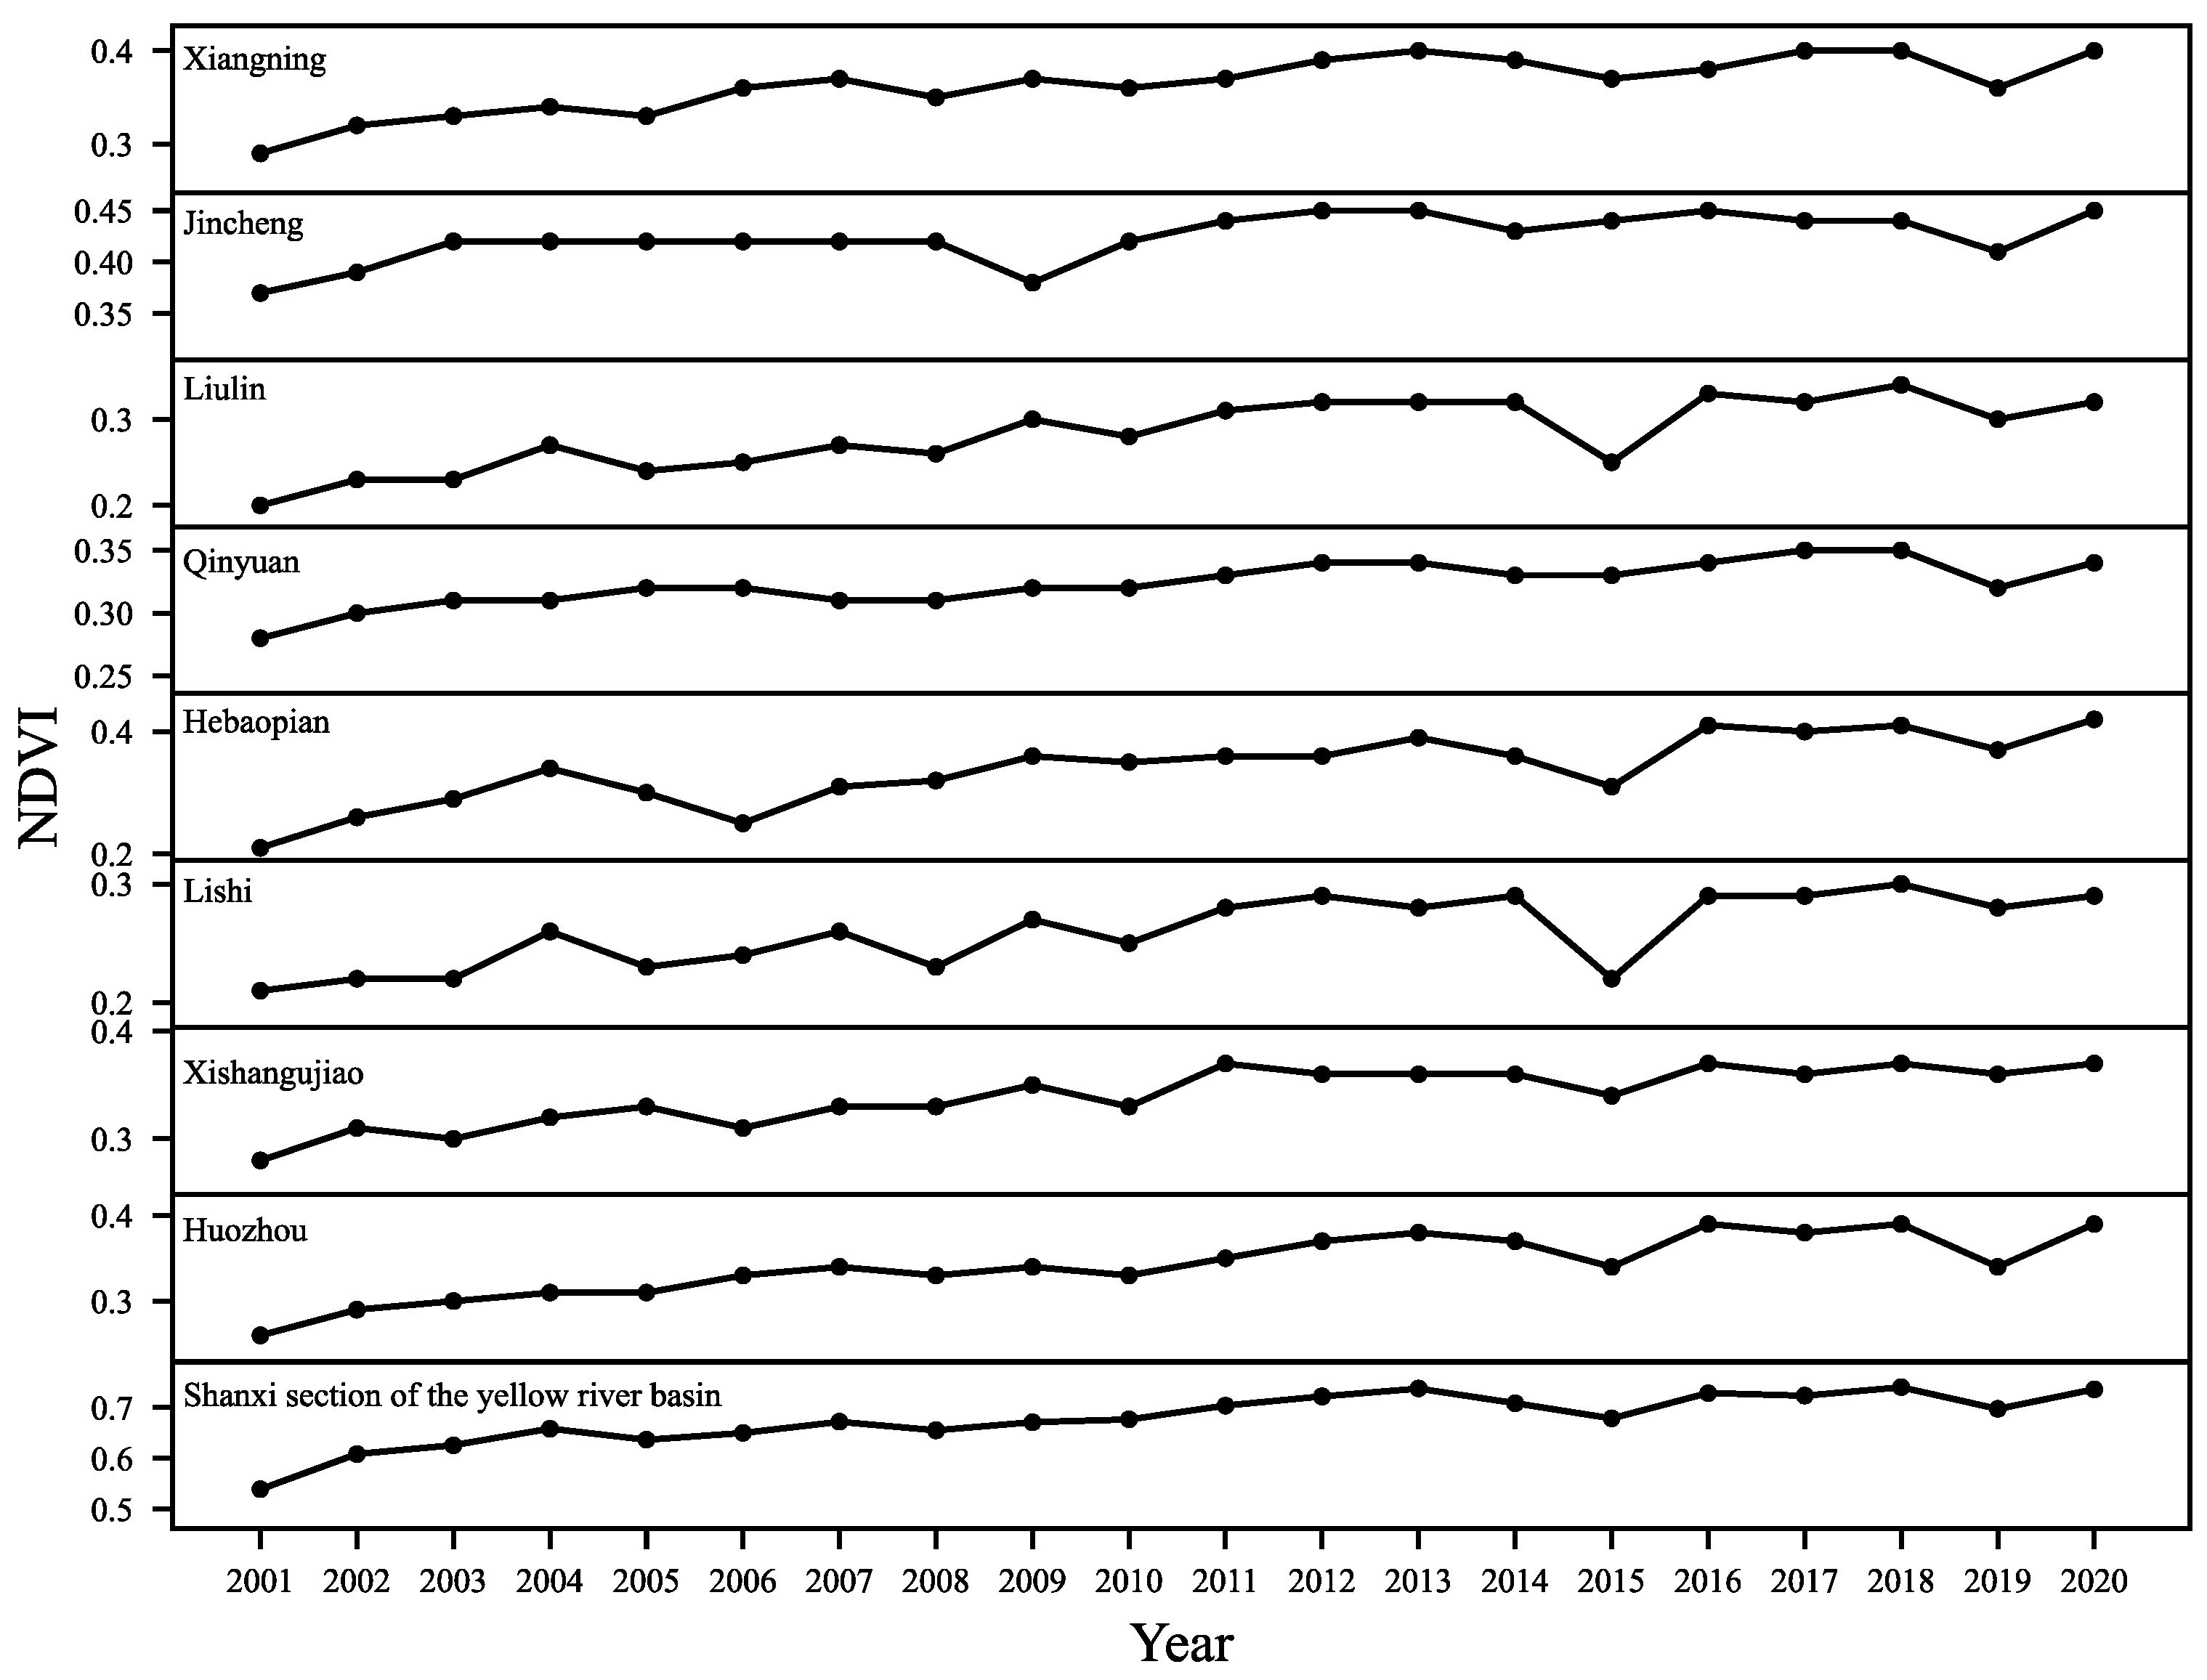
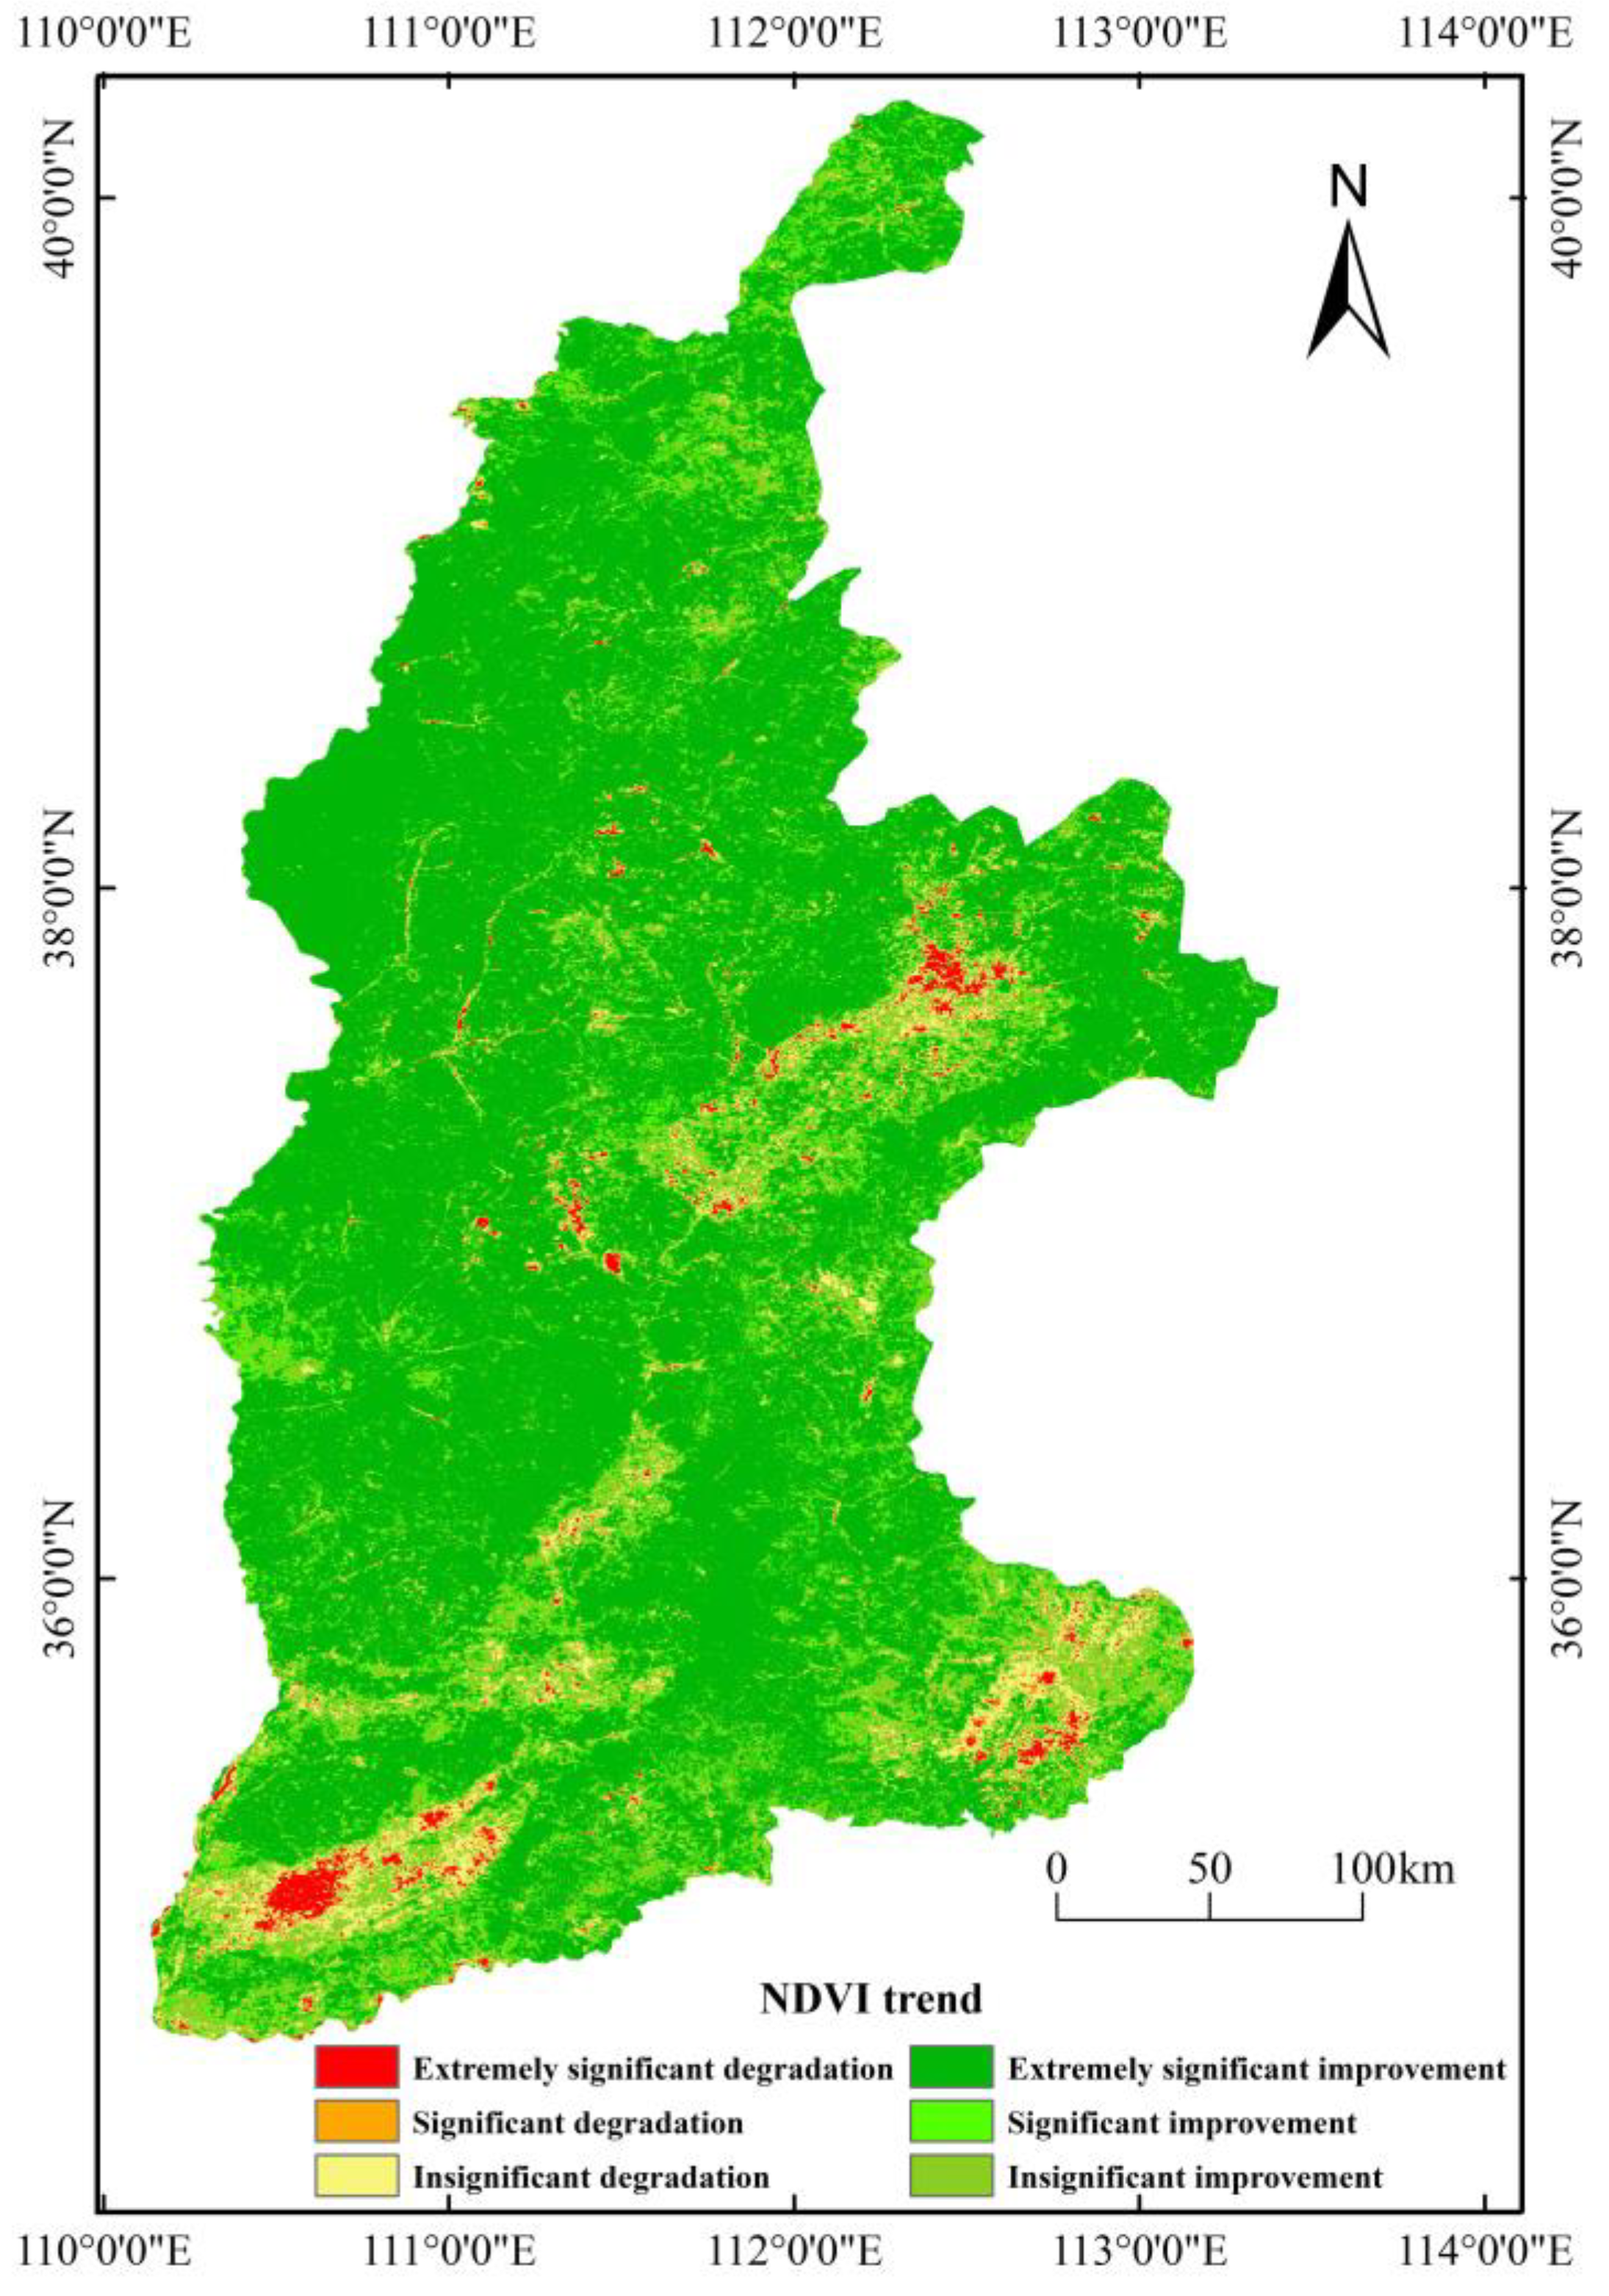
From 2001 to 2020, the vegetation cover in the Shanxi section of the Yellow River Basin has consistently improved, with a spatial distribution showing higher values in the central and eastern regions and lower values in the western and southern regions. The trends in average NDVI values in the mining areas are generally in line with the overall trend in the Shanxi section of the Yellow River Basin. All eight mining areas have experienced an increasing trend in vegetation cover. Notably, the NDVI values in the Hebaopian mining area have increased by 100% over the 20-year period. The Xiangning, Liulin, Lishi, and Huozhou mining areas have also exhibited NDVI increases greater than the overall increase in the Shanxi section of the Yellow River Basin, with the QinYuan mining area showing the lowest increase at 21%.
(2)
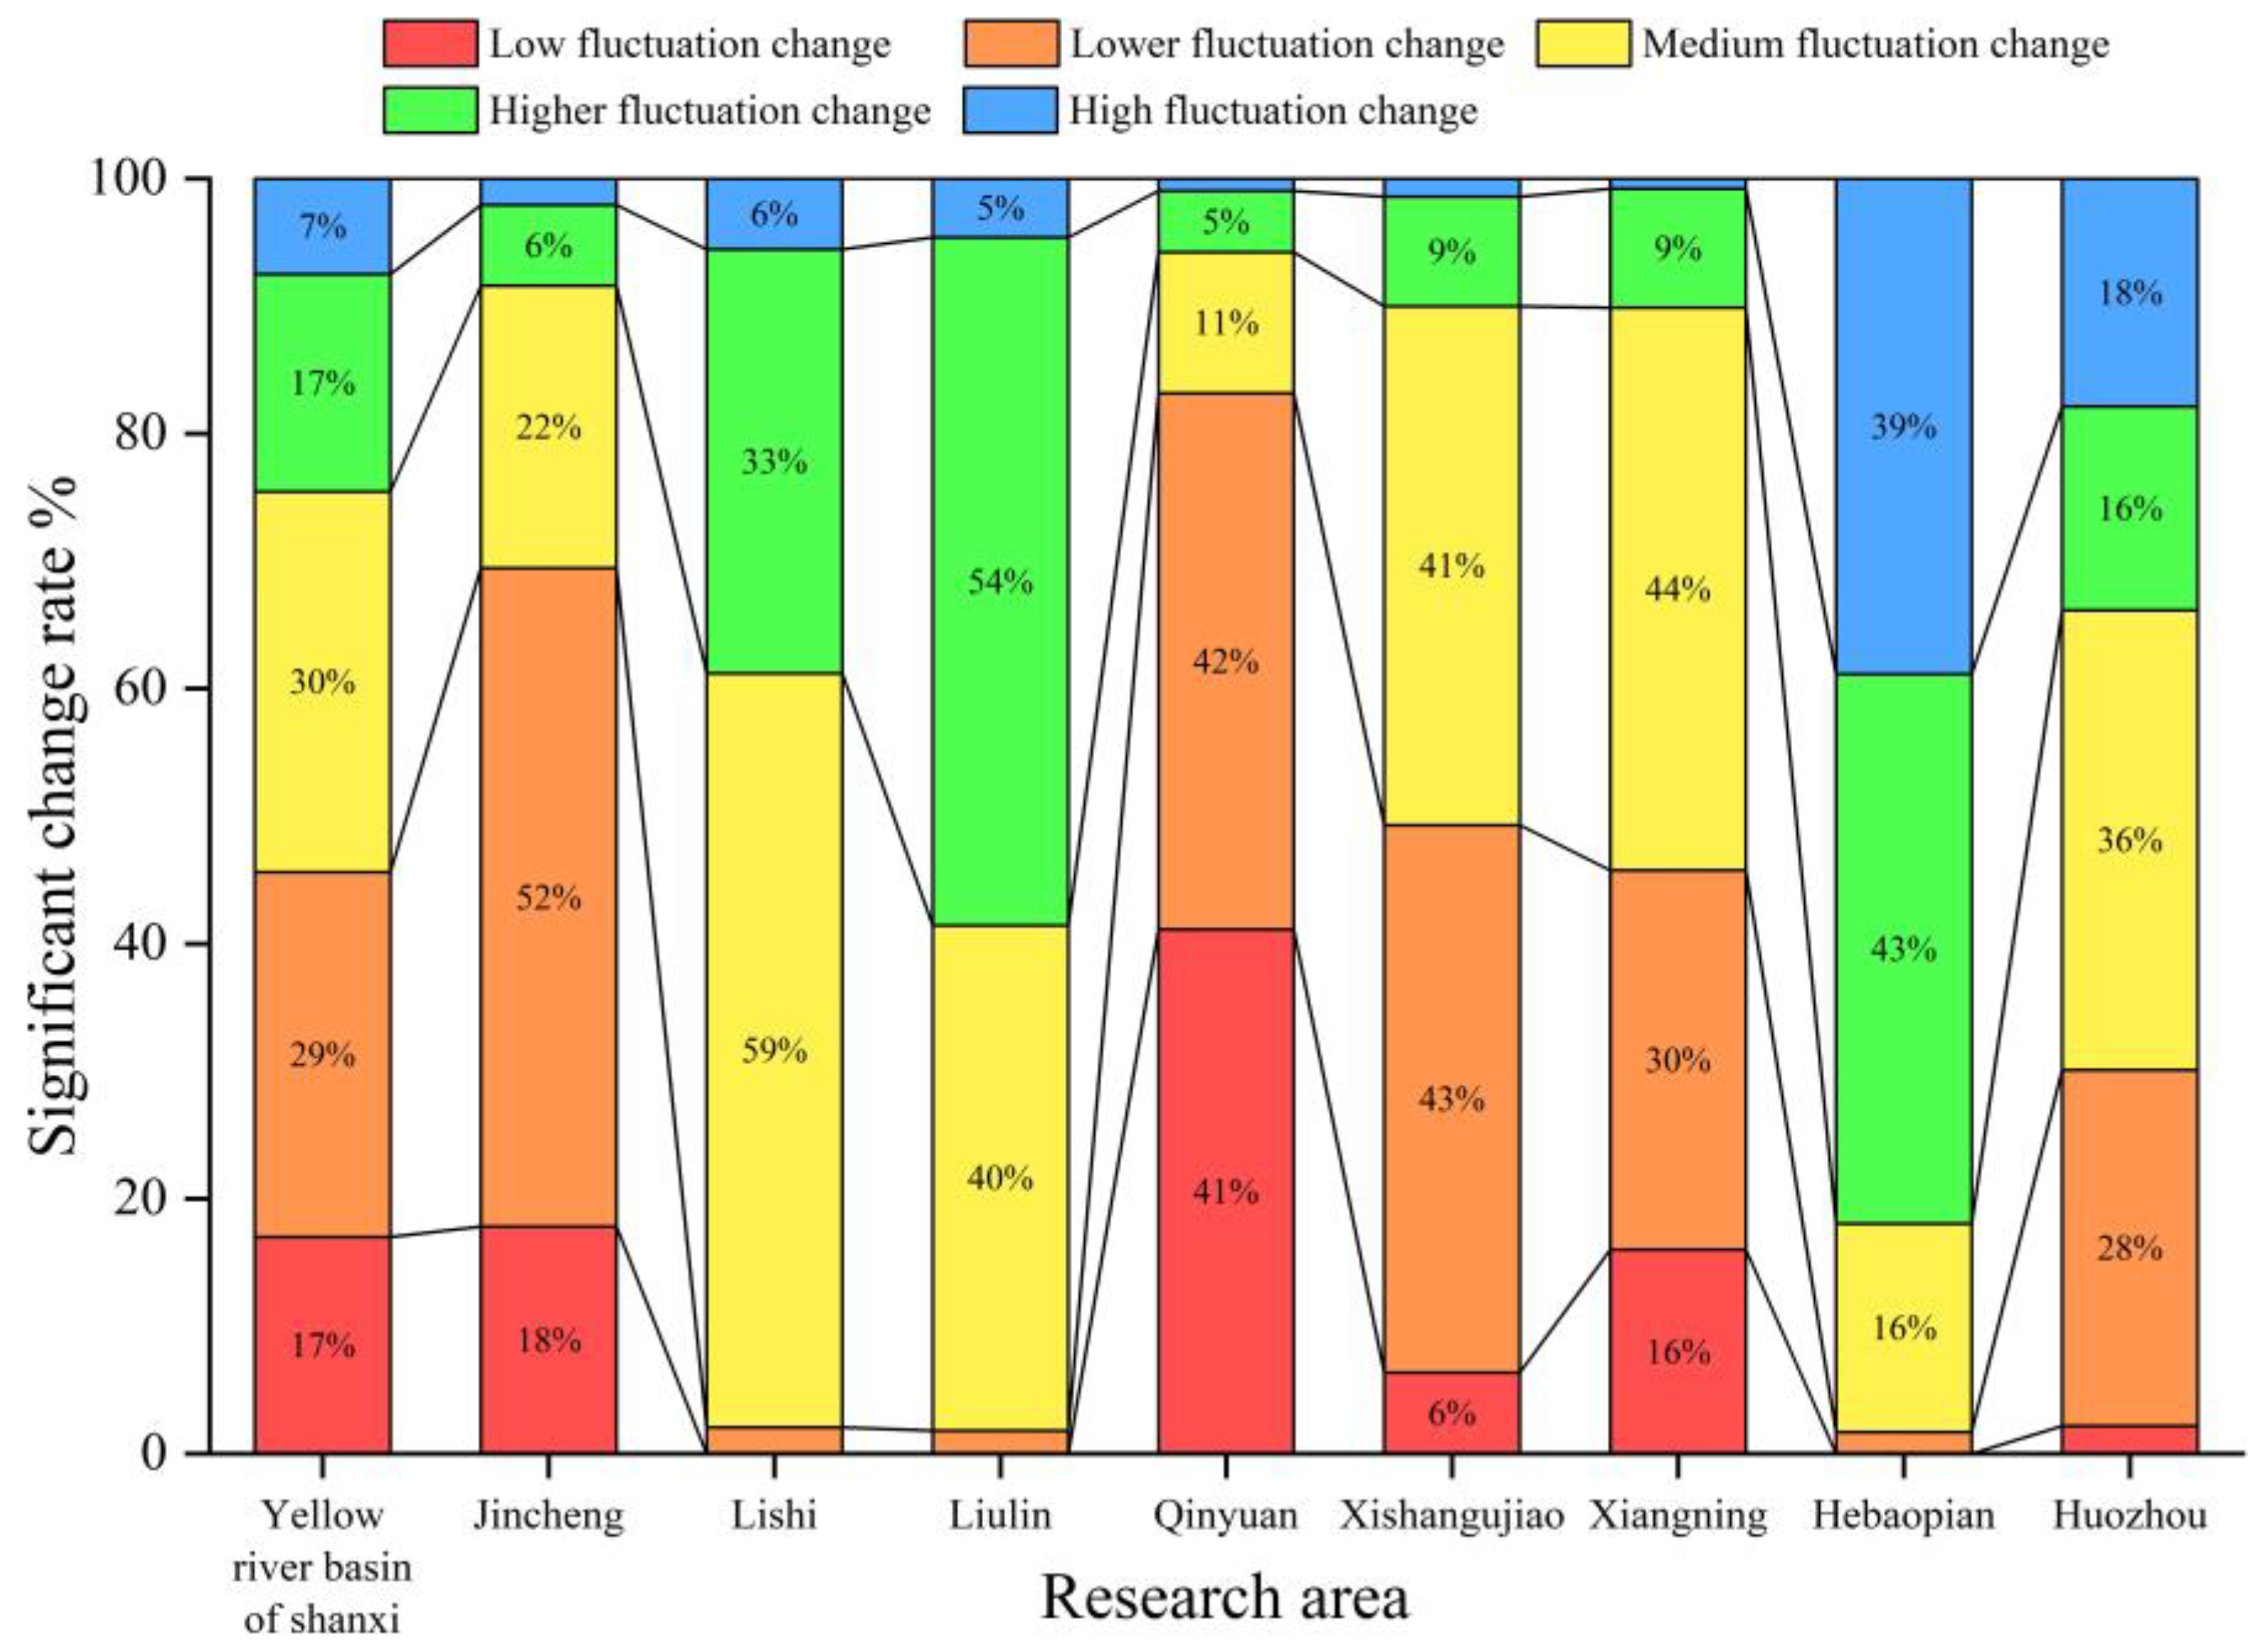
The NDVI variation in the Shanxi section of the Yellow River Basin exhibits significant fluctuations, with an overall positive trend. Areas with moderate to high levels of fluctuation account for 54.39% of the total. The Hebaopian mining area has a high proportion of areas with significant fluctuations, accounting for 38.85%, which aligns with the previously mentioned doubling of NDVI values. The Lishi and Xiangning mining areas generally experience moderate fluctuations, while the remaining mining areas exhibit low to relatively low levels of fluctuation.
(3)
In the Shanxi section of the Yellow River Basin, the changes in vegetation cover are positively correlated with both temperature and precipitation, with a higher correlation observed with precipitation. The NDVI shows a positive correlation with precipitation and temperature, accounting for 94.52% and 70.67% of the total area, respectively. Precipitation is the primary driver behind the increase in the NDVI. The changes in the NDVI and precipitation/temperature exhibit significant spatial heterogeneity.

Author Contributions

Methodology, H.C. and M.X.; Software, Y.Z. and H.X.; Resources, P.G. and M.X.; Data curation, P.G. and Y.Z.; Writing—original draft, P.G.; Writing—review and editing, H.C., J.H., S.G. and Y.D.; Supervision, H.C. All authors have read and agreed to the published version of the manuscript.

Funding

This work was supported by the National Natural Science Foundation of China (Grant No. U22A20620).

Institutional Review Board Statement

Not applicable.

Informed Consent Statement

Not applicable.

Data Availability Statement

The data used in this study can be obtained from the second author at [email protected] with a reasonable request. The data are not publicly available due to ongoing study.

Conflicts of Interest

The authors declare no conflict of interest.

References

  1. Mu, B.; Zhao, X.; Wu, D.; Wang, X.; Zhao, J.; Wang, H.; Zhou, Q.; Du, X.; Liu, N. Vegetation Cover Change and Its Attribution in China from 2001 to 2018. Remote Sens. 2021, 13, 496. [Google Scholar] [CrossRef]
  2. Verrall, B.; Pickering, C.M. Alpine vegetation in the context of climate change: A global review of past research and future directions. Sci. Total Environ. 2020, 748, 141344. [Google Scholar] [CrossRef] [PubMed]
  3. Han, H.; Bai, J.; Ma, G.; Yan, J. Vegetation Phenological Changes in Multiple Landforms and Responses to Climate Change. ISPRS Int. J. Geo-Inf. 2020, 9, 111. [Google Scholar] [CrossRef]
  4. Liu, M.; Bai, X.; Tan, Q.; Luo, G.; Zhao, C.; Wu, L.; Luo, X.; Ran, C.; Zhang, S. Climate change enhances the positive contribution of human activities to vegetation restoration in China. Geocarto Int. 2022, 37, 13479–13499. [Google Scholar] [CrossRef]
  5. Tang, Z.; Zhou, Z.; Wang, D.; Luo, F.; Bai, J.; Fu, Y. Impact of vegetation restoration on ecosystem services in the Loess plateau, a case study in the Jinghe Watershed, China. Ecol. Indic. 2022, 142, 109183. [Google Scholar] [CrossRef]
  6. Han, Y.; Zuo, D.; Xu, Z.; Wang, G.; Peng, D.; Pang, B.; Yang, H. Attributing the Impacts of Vegetation and Climate Changes on the Spatial Heterogeneity of Terrestrial Water Storage over the Tibetan Plateau. Remote Sens. 2022, 15, 117. [Google Scholar] [CrossRef]
  7. Cao, W.; Xu, H.; Zhang, Z. Vegetation Growth Dynamic and Sensitivity to Changing Climate in a Watershed in Northern China. Remote Sens. 2022, 14, 4198. [Google Scholar] [CrossRef]
  8. Kuzevic, S.; Bobikova, D.; Kuzevicova, Z. Land cover and vegetation coverage changes in the mining area—A case study from Slovakia. Sustainability 2022, 14, 1180. [Google Scholar] [CrossRef]
  9. Padmanaban, R.; Bhowmik, A.K.; Cabral, P. A remote sensing approach to environmental monitoring in a reclaimed mine area. ISPRS Int. J. Geo-Inf. 2017, 6, 401. [Google Scholar] [CrossRef]
  10. Eckert, S.; Hüsler, F.; Liniger, H.; Hodel, E. Trend analysis of MODIS NDVI time series for detecting land degradation and regeneration in Mongolia. J. Arid Environ. 2015, 113, 16–28. [Google Scholar] [CrossRef]
  11. Liu, S.; Li, W.; Qiao, W.; Wang, Q.; Hu, Y.; Wang, Z. Effect of natural conditions and mining activities on vegetation variations in arid and semiarid mining regions. Ecol. Indic. 2019, 103, 331–345. [Google Scholar] [CrossRef]
  12. Fang, A.; Dong, J.; Cao, Z.; Zhang, F.; Li, Y. Tempo-spatial variation of vegetation coverage and influencing factors of large-scale mining areas in Eastern Inner Mongolia, China. Int. J. Environ. Res. Public Health 2020, 17, 47. [Google Scholar] [CrossRef] [PubMed]
  13. Huang, Y.; Tian, F.; Wang, Y.; Wang, M.; Hu, Z. Effect of coal mining on vegetation disturbance and associated carbon loss. Environ. Earth Sci. 2015, 73, 2329–2342. [Google Scholar] [CrossRef]
  14. Cetin, M.; Isik Pekkan, O.; Bilge Ozturk, G.; Senyel Kurkcuoglu, M.A.; Kucukpehlivan, T.; Cabuk, A. Examination of the change in the vegetation around the Kirka Boron mine site by using remote sensing techniques. Water Air Soil Pollut. 2022, 233, 254. [Google Scholar] [CrossRef]
  15. Musa, H.D.; Jiya, S.N. An assessment of mining activities impact on vegetation in Bukuru Jos Plateau state Nigeria using Normalized Differential Vegetation Index (NDVI). J. Sustain. Dev. 2011, 4, 150–159. [Google Scholar]
  16. Jian, S.; Zhang, Q.; Wang, H. Spatial–Temporal Trends in and Attribution Analysis of Vegetation Change in the Yellow River Basin, China. Remote Sens. 2022, 14, 4607. [Google Scholar] [CrossRef]
  17. Xia, Y.; Shi, J.; Zhao, Z.; Liu, Z.; Liu, X.; Zhang, C. Mapping the coal-water nexus in the Yellow River Basin. J. Clean. Prod. 2023, 411, 137249. [Google Scholar] [CrossRef]
  18. Yuan, X.; Sheng, X.; Chen, L.; Tang, Y.; Li, Y.; Jia, Y.; Qu, D.; Wang, Q.; Ma, Q.; Zuo, J. Carbon footprint and embodied carbon transfer at the provincial level of the Yellow River Basin. Sci. Total Environ. 2022, 803, 149993. [Google Scholar] [CrossRef]
  19. Li, S.; Yang, B.; Wu, D. Community Succession Analysis of Naturally Colonized Plants on Coal Gob Piles in Shanxi Mining Areas, China. Water Air Soil Pollut. 2008, 193, 211–228. [Google Scholar] [CrossRef]
  20. Liu, C.; Zhang, X.; Wang, T.; Chen, G.; Zhu, K.; Wang, Q.; Wang, J. Detection of vegetation coverage changes in the Yellow River Basin from 2003 to 2020. Ecol. Indic. 2022, 138, 108818. [Google Scholar] [CrossRef]
  21. Deng, X.; Hu, S.; Zhan, C. Attribution of vegetation coverage change to climate change and human activities based on the geographic detectors in the Yellow River Basin, China. Environ. Sci. Pollut. Res. 2022, 29, 44693–44708. [Google Scholar] [CrossRef]
  22. Lu, C.; Hou, M.; Liu, Z.; Li, H.; Lu, C. Variation Characteristic of NDVI and its Response to Climate Change in the Middle and Upper Reaches of Yellow River Basin, China. IEEE J. Sel. Top. Appl. Earth Obs. Remote Sens. 2021, 14, 8484–8496. [Google Scholar] [CrossRef]
  23. Yue, M.; Geng, G.; Wang, T.; Yang, R.; Gu, Q. Spatiotemporal variation of Vegetation NDVl and lts Driving Factors in the Shaanxi Section of the Yellow River Basin from 2000 to 2019. Res. Soil Water Conserv. 2023, 30, 238–246+255. [Google Scholar]
  24. Wang, L.; Li, N.; Wen, G.; Yang, Y. Analysis of Vegetation Coverage Change and Driving Force in Henan Section of Yellow River Basin. Bull. Soil Water Conserv. 2022, 42, 393–399. [Google Scholar]
  25. Fu, J. Temporal and Spatial Changes of NDMVl of Different Lland Covers and Their Responses to Temperture and Precipitation in the Yellow River Basin of Shanxi. Res. Soil Water Conserv. 2023, 30, 364–372. [Google Scholar]
  26. Zhao, L.; Chen, M.-n.; Yang, C.-h.; Zhang, R.-z.; Zhang, Q.-p.; Wang, Q. Characteristics of spatial and temporal carbon emissions from different land uses in Shanxi section of the Yellow River, China. Environ. Dev. Sustain. 2023. [Google Scholar] [CrossRef]
  27. Xu, M.; Feng, Q.; Zhang, S.; Lv, M.; Duan, B. Ecosystem Services Supply–Demand Matching and Its Driving Factors: A Case Study of the Shanxi Section of the Yellow River Basin, China. Sustainability 2023, 15, 11016. [Google Scholar] [CrossRef]
  28. Fan, X.-h.; Wang, M.-b. Change trends of air temperature and precipitation over Shanxi Province, China. Theor. Appl. Climatol. 2011, 103, 519–531. [Google Scholar] [CrossRef]
  29. Zhang, H.; Guo, J.; Li, X.; Liu, Y.; Wang, T. Spatiotemporal Variation in and Responses of the NDVI to Climate in Western Ordos and Eastern Alxa. Sustainability 2023, 15, 4375. [Google Scholar] [CrossRef]
  30. Han, J.; Zhang, X.; Wang, J.; Zhai, J. Geographic Exploration of the Driving Forces of the NDVI Spatial Differentiation in the Upper Yellow River Basin from 2000 to 2020. Sustainability 2023, 15, 1922. [Google Scholar] [CrossRef]
  31. Liu, H.; Li, X.; Mao, F.; Zhang, M.; Zhu, D.; He, S.; Huang, Z.; Du, H. Spatiotemporal Evolution of Fractional Vegetation Cover and Its Response to Climate Change Based on MODIS Data in the Subtropical Region of China. Remote Sens. 2021, 13, 913. [Google Scholar] [CrossRef]
  32. Feng, X.; Tian, J.; Wang, Y.; Wu, J.; Liu, J.; Ya, Q.; Li, Z. Spatio-Temporal Variation and Climatic Driving Factors of Vegetation Coverage in the Yellow River Basin from 2001 to 2020 Based on kNDVI. Forests 2023, 14, 620. [Google Scholar] [CrossRef]
  33. Zhang, X.; Wang, G.; Xue, B.; A, Y. Changes in vegetation cover and its influencing factors in the inner Mongolia reach of the yellow river basin from 2001 to 2018. Environ. Res. 2022, 215, 114253. [Google Scholar] [CrossRef] [PubMed]
  34. Deng, X.; Wu, L.; He, C.; Shao, H. Study on Spatiotemporal Variation Pattern of Vegetation Coverage on Qinghai–Tibet Plateau and the Analysis of Its Climate Driving Factors. Int. J. Environ. Res. Public Health 2022, 19, 8836. [Google Scholar] [CrossRef] [PubMed]
  35. Li, C.; Jia, X.; Zhu, R.; Mei, X.; Wang, D.; Zhang, X. Seasonal Spatiotemporal Changes in the NDVI and Its Driving Forces in Wuliangsu Lake Basin, Northern China from 1990 to 2020. Remote Sens. 2023, 15, 2965. [Google Scholar] [CrossRef]
  36. Li, X.; Yu, K.; Zhang, X.; Zhang, G.; Li, Z.; Li, P.; Zhang, X.; Zhao, Y.; Ma, W. Spatial and Temporal Evolutionary Characteristics of Vegetation in Different Geomorphic Zones of Loess Plateau and Its Driving Factor Analysis. Sustainability 2023, 15, 12200. [Google Scholar] [CrossRef]
  37. Ren, Y.; Liu, J.; Liu, S.; Wang, Z.; Liu, T.; Shalamzari, M.J. Effects of Climate Change on Vegetation Growth in the Yellow River Basin from 2000 to 2019. Remote Sens. 2022, 14, 687. [Google Scholar] [CrossRef]
  38. Wang, M.; Fu, J.; Wu, Z.; Pang, Z. Spatiotemporal Variation of NDVI in the Vegetation Growing Season in the Source Region of the Yellow River, China. ISPRS Int. J. Geo-Inf. 2020, 9, 282. [Google Scholar] [CrossRef]
  39. Chen, T.; Xia, J.; Zou, L.; Hong, S. Quantifying the Influences of Natural Factors and Human Activities on NDVI Changes in the Hanjiang River Basin, China. Remote Sens. 2020, 12, 3780. [Google Scholar] [CrossRef]
  40. Jiang, L.; Liu, Y.; Wu, S.; Yang, C. Analyzing ecological environment change and associated driving factors in China based on NDVI time series data. Ecol. Indic. 2021, 129, 107933. [Google Scholar] [CrossRef]
  41. Jiang, W.; Yuan, L.; Wang, W.; Cao, R.; Zhang, Y.; Shen, W. Spatio-temporal analysis of vegetation variation in the Yellow River Basin. Ecol. Indic. 2015, 51, 117–126. [Google Scholar] [CrossRef]
  42. Ya-shan, S.; Chong, D.; Chao, Y.; Chao, Q. Ecological Environmental Quality Evaluation of Yellow River Basin. Procedia Eng. 2012, 28, 754–758. [Google Scholar] [CrossRef]
  43. Ren, Z.; Tian, Z.; Wei, H.; Liu, Y.; Yu, Y. Spatiotemporal evolution and driving mechanisms of vegetation in the Yellow River Basin, China during 2000–2020. Ecol. Indic. 2022, 138, 108832. [Google Scholar] [CrossRef]
  44. Lei, S.; Ren, L.; Bian, Z. Time–space characterization of vegetation in a semiarid mining area using empirical orthogonal function decomposition of MODIS NDVI time series. Environ. Earth Sci. 2016, 75, 516. [Google Scholar] [CrossRef]
  45. Fu, B.; Burgher, I. Riparian vegetation NDVI dynamics and its relationship with climate, surface water and groundwater. J. Arid Environ. 2015, 113, 59–68. [Google Scholar] [CrossRef]
  46. Li, L.; Lei, Y.; Wu, S.; He, C.; Yan, D. Study on the coordinated development of economy, environment and resource in coal-based areas in Shanxi Province in China: Based on the multi-objective optimization model. Resour. Policy 2018, 55, 80–86. [Google Scholar] [CrossRef]
  47. Wang, J.; Fan, Y.; Yang, Y.; Zhang, L.; Zhang, Y.; Li, S.; Wei, Y. Spatial-Temporal Evolution Characteristics and Driving Force Analysis of NDVI in the Minjiang River Basin, China, from 2001 to 2020. Water 2022, 14, 2923. [Google Scholar] [CrossRef]
  48. Afuye, G.A.; Kalumba, A.M.; Orimoloye, I.R. Characterisation of Vegetation Response to Climate Change: A Review. Sustainability 2021, 13, 7265. [Google Scholar] [CrossRef]
  49. Li, J.; Zhang, J.; Wang, X.; Wang, G. Long Term Observation of Fractional Vegetation Cover in Qingyang of Gansu Province and Its Response to Climate Change. Atmosphere 2022, 13, 288. [Google Scholar] [CrossRef]
  50. Shen, R.; Yu, P.; Yan, J.; Wang, Y. Retrieving Soil Moisture by TVDI Based on Different Vegetation Index: A Case Study of Shanxi Province. In Proceedings of the 2012 International Conference on Computer Science and Electronics Engineering, Hangzhou, China, 23–25 March 2012; pp. 418–422. [Google Scholar]
Figure 1. Geographical location and altitude of study area.
Applsci 13 12596 g001
Figure 2. Changes in the annual mean value of the NDVI in the Shanxi section of the Yellow River Basin and mining areas.
Applsci 13 12596 g002
Figure 3. NDVI variation trends in the Shanxi Section of the Yellow River Basin. (Extremely significant improvement (slope > 0, p ≤ 0.01), significant improvement (slope > 0, 0.01 < p ≤ 0.05), insignificant improvement (slope > 0, p > 0.05), insignificant degradation (slope < 0, p > 0.05), significant degradation (slope < 0, 0.01 < p ≤ 0.05), and extremely significant degradation (slope < 0, p ≤ 0.01)).
Applsci 13 12596 g003
Figure 4. NDVI fluctuation changes in the Shanxi Section of the Yellow River Basin and mining areas. It is divided into five levels based on the magnitude of the CV: low fluctuation change (CV ≤ 0.05), lower fluctuation change (0.05 < CV ≤ 0.10), medium fluctuation change (0.10 < CV ≤ 0.15), higher change (0.15 < CV ≤ 0.20), and high volatility change (0.20 < CV).
Applsci 13 12596 g004
Figure 5. The Hurst Index and change trend forecast of Shanxi Section of the Yellow River Basin: (a) Spatial distribution of the Hurst Index; it is classified into five categories: strong anti-persistence (0 < H ≤ 0.2), weak anti-persistence (0.2 < H ≤ 0.4), random uncertainty (0.4 < H ≤ 0.6), weak persistence (0.6 < H ≤ 0.8), and strong persistence (0.8 < H ≤ 1). (b) Variation trend prediction of the Hurst index. The classification criteria are shown in Table 1.
Applsci 13 12596 g005
Figure 6. Annual cumulative precipitation (a) and annual average temperature (b) in the Shanxi section of the Yellow River Basin.
Applsci 13 12596 g006
Figure 7. Partial correlation coefficient between the NDVI and temperature and distribution of its significance level: (a) Partial correlation coefficient between the NDVI and temperature; (b) Distribution of significance level, divided into 6 grades by significance test using the t statistic: extremely significant positive correlation (r > 0, p ≤ 0.01), significant positive correlation (r > 0, 0.01 < p ≤ 0.05), insignificant positive correlation (r > 0, p > 0.05), insignificant negative correlation (r < 0, p > 0.05), significant negative correlation (r < 0, 0.01 < p ≤ 0.05), and extremely significant negative correlation (r < 0, p ≤ 0.01).
Applsci 13 12596 g007
Figure 8. Partial correlation coefficient between the NDVI and annual cumulative precipitation and distribution of its significance level: (a) Partial correlation coefficient between the NDVI and annual cumulative precipitation; (b) Distribution of the significance level, divided into 6 grades by significance test using the t statistic: extremely significant positive correlation (r > 0, p ≤ 0.01), significant positive correlation (r > 0, 0.01 < p ≤ 0.05), insignificant positive correlation (r > 0, p > 0.05), insignificant negative correlation (r < 0, p > 0.05), significant negative correlation (r < 0, 0.01 < p ≤ 0.05), and extremely significant negative correlation (r < 0, p ≤ 0.01).
Applsci 13 12596 g008
Table 1. Sustainable Prediction of the NDVI Variation Trend in Shanxi Section of the Yellow River Basin.
NDVI Variation TrendSustainabilityForecast Trend
slope > 0H > 0.6Continuous improvement
slope > 0H ≤ 0.4From improvement to degradation
slope > 00.4 < H ≤ 0.6Random change
slope < 0H ≤ 0.4From degradation to improvement
slope < 0H > 0.6Continuous degradation
slope < 00.4 < H ≤ 0.6Random change
Table 2. Statistics on the changing trend of the NDVI in the Shanxi section of the Yellow River Basin and various mining areas.
Variation
Trend
Extremely
Significant
Degradation
Significant
Degradation
Insignificant
Improvement/
Degradation
Significant
Improvement
Extremely
Significant
Improvement
Study AreaPixel NumbersPercentage/%Pixel NumbersPercentage/%Pixel NumbersPercentage/%Pixel NumbersPercentage/%Pixel NumbersPercentage/%
Shanxi section of the yellow river basin24,3281.2413,5670.69343,71117.511,398,68171.25182,7469.31
Jincheng 27572.5122482.0543,01639.2050,24745.7911,46710.45
Lishi 1482.02560.76112215.31545774.455477.46
Liulin 470.11490.1119724.5839,28691.2516973.94
Qinyuan 1040.301050.30607417.3725,58173.1331148.90
Xishangujiao 4090.992680.65475211.4533,55180.8425216.07
Xiangning 570.08610.0939615.6261,30286.9451287.27
Hebaopian 520.20250.107923.1123,96994.156202.44
Huozhou 16341.507710.7113,94912.7985,93878.7867906.22
Note: extremely significant degradation (slope < 0, p ≤ 0.01), significant degradation (slope < 0, 0.01 < p ≤ 0.05), insignificant improvement/degradation (slope > 0, p > 0.05/slope < 0, p > 0.05), significant improvement (slope > 0, 0.01 < p ≤ 0.05), and extremely significant improvement (slope > 0, p ≤ 0.01).
Table 3. Statistics of NDVI fluctuations in the Shanxi section of the Yellow River Basin and mining areas.
Variation TrendLow Fluctuation ChangeLower Fluctuation ChangeMedium Fluctuation ChangeHigher Fluctuation ChangeHigh Fluctuation Change

Study Area
Pixel NumbersArea Percentage/%Pixel NumbersArea Percentage/%Pixel NumbersArea Percentage/%Pixel NumbersArea Percentage/%Pixel NumbersArea Percentage/%
Shanxi section of the yellow river basin333,54316.99561,70628.62585,44729.83335,15117.07147,0917.49
Jincheng 19,54617.8156,69351.6624,27222.1269546.3422702.07
Lishi 001512.06433459.13243933.274065.54
Liulin 110.027711.7917,06039.6323,23053.9619794.60
Qinyuan 14,38341.1214,70742.05387311.0716804.803350.96
Xishangujiao 26416.3617,82042.9416,88440.6835688.605881.42
Xiangning 11,28116.0020,99229.7731,10344.1165869.345470.78
Hebaopian 004331.70416016.3410,97443.11989138.85
Huozhou 23622.1730,44127.9139,36136.0817,42315.9719,49517.87
Disclaimer/Publisher’s Note: The statements, opinions and data contained in all publications are solely those of the individual author(s) and contributor(s) and not of MDPI and/or the editor(s). MDPI and/or the editor(s) disclaim responsibility for any injury to people or property resulting from any ideas, methods, instructions or products referred to in the content.

