Article

A Damage Index for Assessing Seismic-Resistant Designs of Masonry Wall Buildings Reinforced with X-Bracing Concrete Frames

by
Yossakorn Chonratana
and
Vuttichai Chatpattananan
*
School of Engineering, King Mongkut’s Institute of Technology Ladkrabang, Bangkok 10520, Thailand
*
Author to whom correspondence should be addressed.
Appl. Sci. 2023, 13(23), 12566; https://doi.org/10.3390/app132312566
Submission received: 14 September 2023 / Revised: 23 October 2023 / Accepted: 17 November 2023 / Published: 21 November 2023
(This article belongs to the Special Issue Structural Seismic Design and Evaluation)

Abstract

:
In this paper, a suitable damage index is demonstrated to assess the seismic-resistant design of masonry wall buildings reinforced with double x-bracing concrete frames. As a criterion indicative of the damage level that might occur after an earthquake, the damage index can be calculated by using analytic results, by using the Park–Ang formula on masonry wall buildings reinforced with concrete structures, and by adjusting the index values in accordance with the results of the analysed models. The data used in this study are collected from the results of four-storey concrete structures with masonry walls under cyclical lateral forces. To simulate the masonry walls’ structural behaviours for damage assessment, x-bracings placed as crosses on each bracing are used to support the compressive strength. Then, the analysis results are used to assess the damage that occurs to the masonry wall building structure by considering deformation and energy decay; additionally, a suitable damage index is calculated for each damage level. The damage index can be considered in the seismic-resistant design of masonry walls reinforced with x-bracing concrete frames.

1. Introduction

An earthquake is a force that occurs in the horizontal direction and spreads to every floor of a structure. Moreover, earthquakes damage the masonry walls of reinforced concrete buildings. This damage affects the safety of the people in the building. For that reason, there are many studies on the evaluation of the damage levels of structures under earthquake forces to reduce disaster losses. In Thailand, there is a risk of earthquakes. The most damaged buildings are small- and medium-sized buildings, such as residential houses, commercial buildings, and school buildings. In addition, masonry is used to build partition walls in these buildings [1].
Masonry walls are parts of buildings that are essential for their behaviours under active forces from earthquakes. Most structural masonry buildings in Thailand feature walls built using antique masonry and block masonry. These techniques are used to support the weight of the beams, floors, and roofs, which are constructed with other materials, such as wood and steel. Most of the destruction to structural masonry buildings in Thailand results from the buildings leaning away from the masonry walls’ planes. The damage in the beginning appears as diagonal cracking of the wall caused by the initial vibration force. If the force is severe, the cracking of the wall occurs. Finally, the wall cannot stand as usual, and it is destroyed. In brief, the damage that occurs to the wall interacts with the building frame when the building moves under an earthquake force. The level of damage can be evaluated using a structural analysis if appropriate models and criteria are used.
This research shows an appropriate damage index definition for the damage assessment of masonry wall buildings reinforced with x-bracing concrete frames; these frames are used as indicative criteria of the damage level that might occur under an earthquake force. The damage index can be calculated by using analytical results, by using the Park–Ang formula on models of masonry wall buildings reinforced with concrete structures, and by adjusting the index values in accordance with the results of the analysed models [2].

2. Literature Review

2.1. Park–Ang Damage Index

The damage index is a criterion for quantitatively measuring damage. Additionally, the index suggests that a structure has an external force acting on it that leads to damage, such as earthquake and lateral forces. The index can be used to assess the damage by determining the level of damage. Generally, the damage index is defined as a value. If the value is equal to 0, no damage occurs. If the value is equal 1, high-to-extreme damage occurs. In this research, the Park–Ang damage index is used to evaluate the damage levels of masonry wall buildings. The total damage caused by inelastic deflection and the damage due to energy collapse in the structure from back-and-forth responses are shown. The damage index is written as the following equation [2]:
D I = δ M δ u + β Q y δ u E
where
δ M is the deformation value after alternating the building force.
δ u is the maximum deformation capacity value under unidirectional force before a disaster.
β is a coefficient in the relationship between the damage level and accumulated energy, with its value depending on the type of building being analysed.
Q y is the strength at the yield point of the building.
E is the accumulated energy under the reverse action force.
The displacement value δ M and accumulated energy value under the reverse action force E can be analysed by using this model under an earthquake force; the model considers the maximum deformation capacity value δ u , and the coefficient β depends on the type of building being analysed. This coefficient is calibrated with values from laboratory experiments.

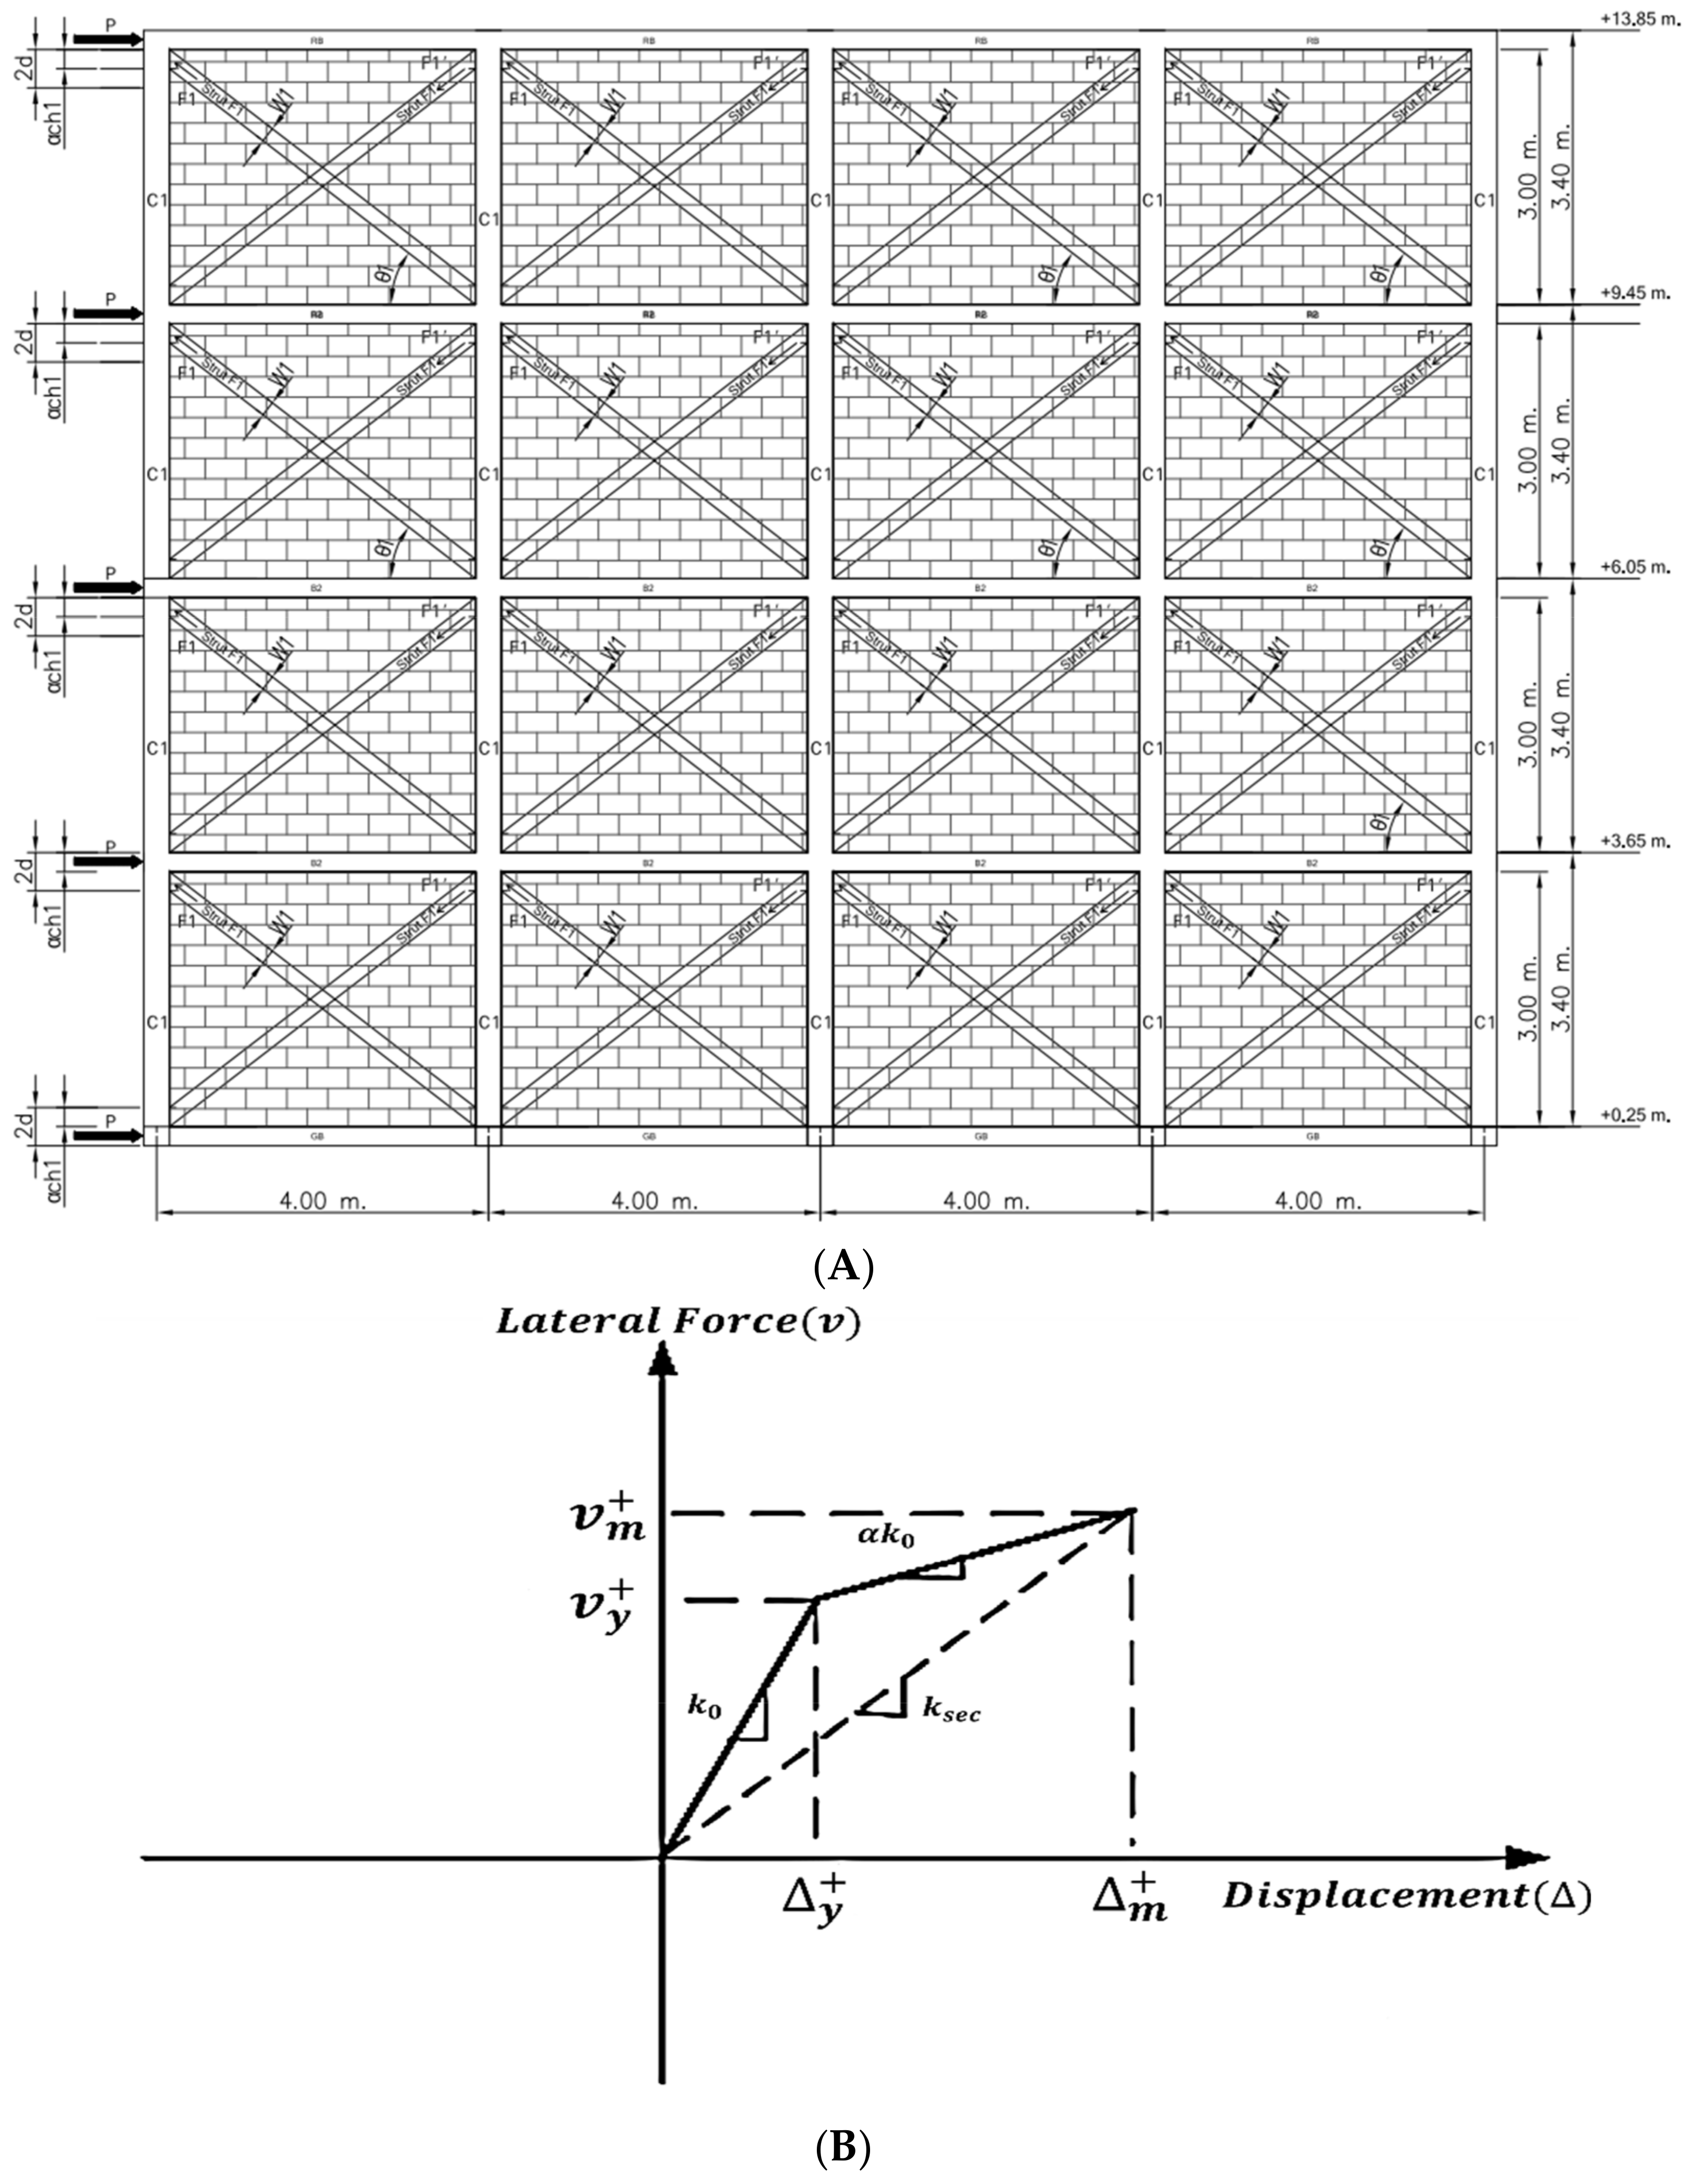
2.2. Structural Analysis of Model of Masonry Wall Building Reinforced with X-Bracing Concrete Frame

The deformation value and accumulated energy value under the reverse action force in Equation (1) can be determined by analysing the building structure under an earthquake force, which is examined by using an appropriate model. A masonry wall is modelled by using a multiple-strut model. For masonry walls within reinforced concrete building frames with an equivalent x-bracing form; the diagonal compressive strength is obtained as shown in Figure 1A. This paper investigates the response of masonry wall buildings subjected to horizontal forces. The structural behaviour of the walls is represented through x-braces, modelled according to the approach proposed by Saneinejad and Hobbs (1995). The damage index proposed by Park and Ang is adopted to examine the damage level of the masonry walls, and an infilled RC frame is designed and used as a case study. The cross symbol on the first bracing is between the corner of the beam and the column. Furthermore, the bracing model is defined by concrete section elements, with relational values between the stress and strain, reducing the lateral force, as shown in Figure 1B.
The stress–strain relationship of the model is defined by four parameters: peak strength ( f m i ) , peak strain ( ε m i ) , residual strength ( f m r i ) , and residual strain ( ε m r i ) . These parameters can be obtained from equations calibrated with values from laboratory experiments. The cross-sectional size of the bracing that determines whether the thickness is equal to the actual thickness of the original wall ( t w ) and the effective width is equal to 0.7 a in Equation (2) or W1 in Equation (4). According to α , the regulation from the DPT standard 1301/1302-61 [3] is as follows:
a = 0.175 ( γ 1 h c o l ) 0.4 + γ i n f
where h c o l is the height of the column measured from the base of the pole to the centre point of the beam, r i n f is the diagonal length of the masonry wall, and γ 1 is a coefficient used to find the equivalent bracing width of the masonry wall. Then, the equation can be written as follows:
γ 1 = [ E m e t i n f sin ( 2 θ ) 4 E f e I c o l h i n f ] 0.25
where
E f e is the modulus of elasticity of the rigid frame material.
E m e is the modulus of elasticity of the masonry wall material.
I c o l is the moment of inertia of the column’s cross-sectional area.
h i n f is the height of the masonry wall.
t i n f is the thickness of the masonry wall.
θ is the angle between the height and length of the masonry wall.
In addition, the compressive strength of the reinforced masonry wall f m is proportional to the specific surface area of the masonry walls S r and can be calculated from the relationship between f m and S r [4]. The width of the compressive strength W 1 is calculated from the touch surface length of the force unit, which can spread between the column and masonry wall [5], as follows:
W 1 = α c l m h 1 . 2 + l m . 2 = α c h 1 cos θ 1
α c = 1 h 2 M p j + 2 β c M p c σ c . t
σ c = α c f m 1 + 3 μ 2 r 4
where
μ is the friction coefficient between the building frame and brick wall;
r is the ratio between the height and width of the building frame ( r = h / l ) ;
β c is the reduction factor of the pole ( β c = 0.2 ) .

2.3. Coefficient Calibration of the Relationship between the Damage Level and Energy Decay

As mentioned above, the coefficient is featured in the relationship between the damage level and accumulated energy. β depends on the type of building analysed, and it is calibrated with values from experiments with the analysis models. Moreover, an appropriate coefficient for masonry walls is found that samples the testing results from several previous studies and creates a model sample for testing by simulating x-bracing characteristics, as mentioned before.
Then, the analysis results are taken to assess the damage to the wall structure by considering the deformation value and energy decay and by adjusting the coefficient that relates the damage level to the accumulated energy to obtain a value that corresponds with the testing results.

2.4. Damage Index of Study Sample to Assess Seismic-Resistant Design of Masonry Wall Buildings

In this research, previous testing results are selected from various sources for study. Furthermore, these previous experimental results have a variety of designs. Some designs consider earthquake resistance and others do not. However, the various structural systems from the eight testing samples are as follows: Mehrabi’s sample is a rigid frame and hollow block concrete brick wall [6], Wararuksajja’s sample is an anti-bending frame and hollow block concrete brick wall [7], Jiang’s sample is a lightweight brick anti-bending rigid frame [8], Morandi’s sample is a hollow brick wall rigid frame [9], and Huang’s sample is a brick wall and hollow block concrete rigid frame [10]. The size and detail characteristics of the model samples are shown in Figure 1 and Table 1 and Table 2.

3. Structural Analysis of Reinforcement X-Bracing Concrete Frames Used in the Model Samples from the Literature Review

A masonry wall building is simulated according to an analysis of the models in each study by using the SeismoStruct 2023 program 3D model [11]. By simulating a masonry wall building reinforced with x-bracing concrete frames at the head of the columns with shear spring failure, each bracing property is determined regarding the masonry wall building failure behaviours from the experimental results of the analysed models. Then, the monotonic loading and cyclic loading characteristics of the deformed samples are analysed by defining displacement control according to the force pattern used to test each sample. Figure 2 shows a sample that defines the displacement value in the model [12,13,14,15,16,17,18,19,20,21,22,23,24,25,26,27,28,29]. Then, the analysis results are used to calculate and determine a suitable coefficient and damage index.
The results of the analysis of the deformation behaviour are modelled. The results are shown in Figure 3 and Figure 4, which show the relationship between the relative lateral displacement and lateral force of each model sample. In the figure, the lateral force continuously increases until structural failure occurs, and the maximum lateral force from the analysis is consistent with the testing results of the analysed models, as shown in Table 3.

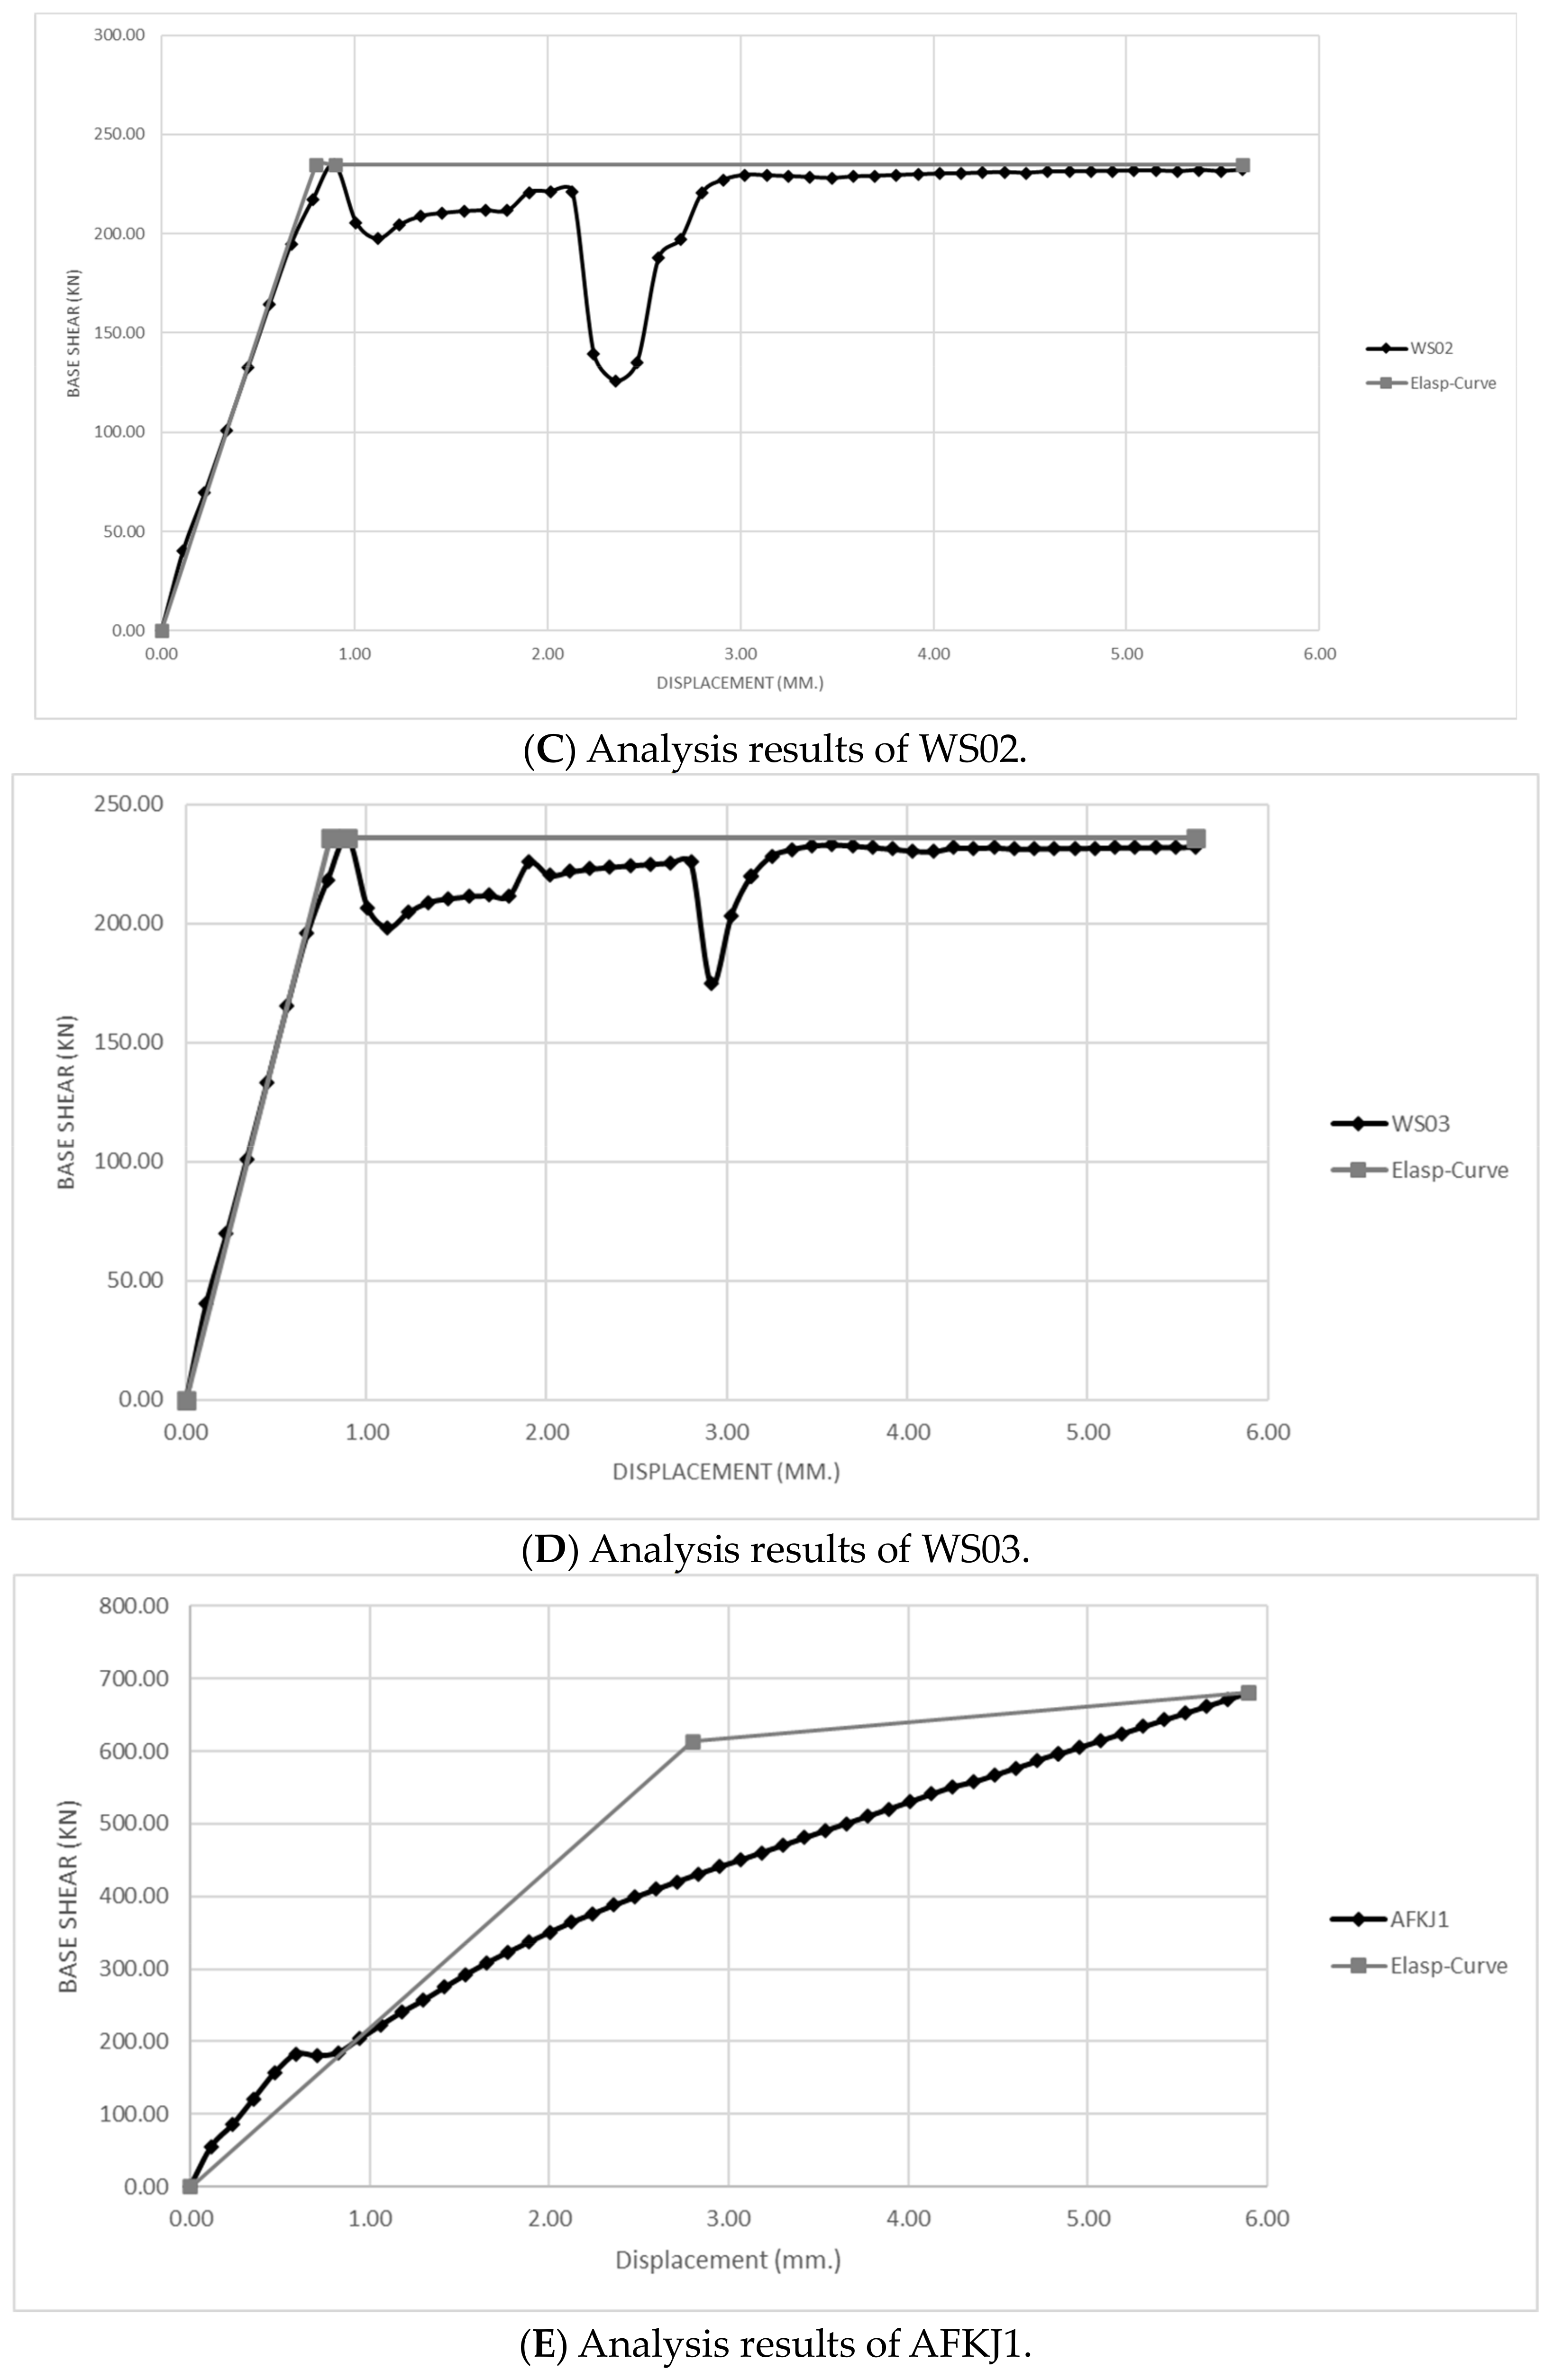
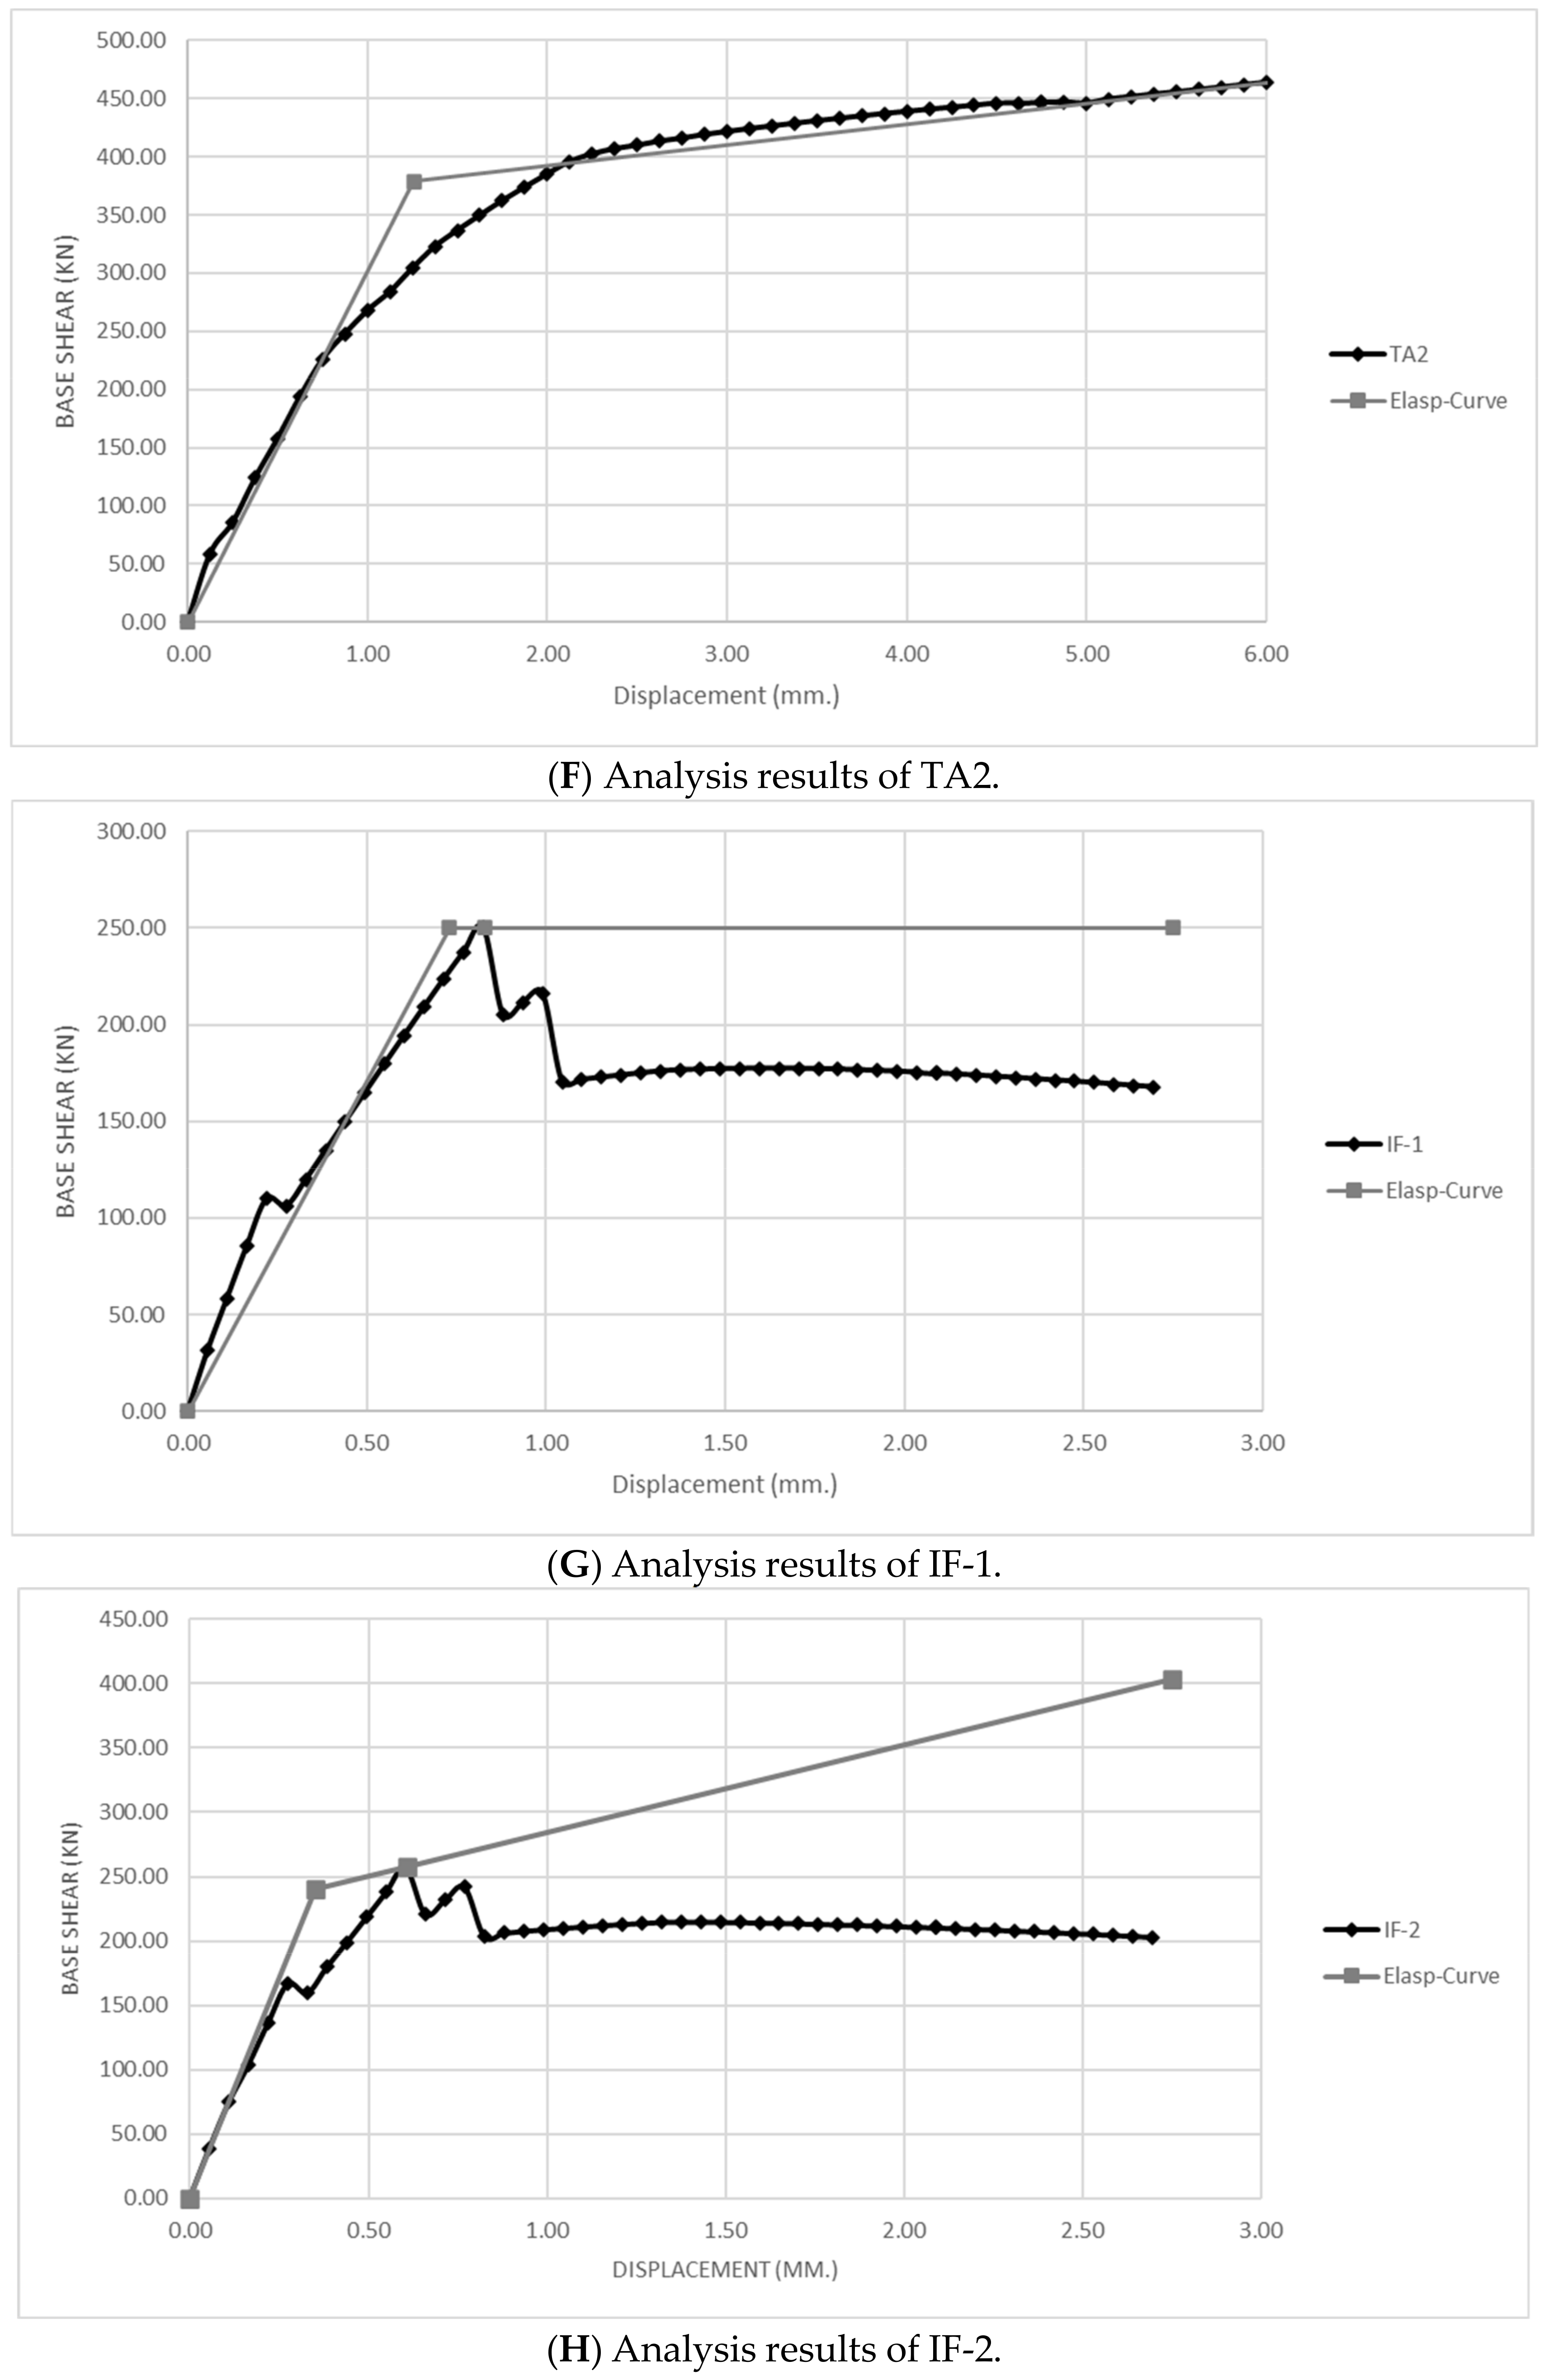
3.1. Damage Index Calculation Used in the Structural Analysis of Model Samples from the Literature Review

The calculation of the damage index must involve variables obtained from the model’s analysis. The variable values can be found as detailed below.
The accumulated energy under cyclic loading ( E ) calculated from the relationship between the lateral force and bracing axis deformation can be obtained from the area under compressive strength loading conditions, with two instances of bracing deformation under cyclic loading conditions. The energy is used to calculate the total accumulated energy of the masonry wall. The stress strength at yield point ( Q y ) is found from the lateral resistance of the x-bracing, and it is determined to be 70% of the maximum total resistance. The maximum deformation capacities under cyclic loading ( δ M ) conditions from the analysis of structural deformation are found; the elements have two bracings under cyclic loading conditions at the maximum lateral displacement of each cycle. The value is defined as the damage index in the positive direction.
The maximum deformation capacity under monotonic loading ( δ u ) has a value set to 1.25 times the deformation value at the destruction point, according to the model structure analysis results. The deformation value at the structural destruction point is defined as equal to the deformation value at the total strength, which is 25% of the reduction from the maximum strength. Results of model samples of masonry wall buildings reinforced with x-bracing concrete frames as shown in Table 4.
The correlation coefficient between the damage level and accumulated energy ( β ) is optimized by adjusting the coefficient of determination from 0.10 to 0.35 and by calculating the damage index from the failure point. Then, a damage index value is obtained that is different for each model sample. For the optimization of a suitable coefficient, statistical calculations are used to determine an average damage index from the samples. Table 5 shows the damage index values calculated from each masonry wall building reinforced with x-bracing concrete frames, and the average damage index of the sample of masonry wall buildings reinforced with x-bracing concrete frames indicates the failure point. By using other coefficient values in the table, the appropriate coefficient is found to be 0.10–0.35. The coefficient can be used to calculate the average damage index; this is equal to 0.935 at the destruction point, which is close to 1.00.

3.2. Determination of Damage Level for Assessing Seismic-Resistant Design of Masonry Wall Buildings

The appropriate coefficient DI is equal to 0.24. Therefore, this coefficient is used to calculate the damage indices at various levels of deformation of the model sample as a guideline to indicate the level of damage that may occur. The damage index calculation results of the three experimental samples used in Wararuksajja’s research, namely WS01, WS02, and WS03, which provide the damage index at various damage points, are shown in Table 6. The characteristics of masonry wall damage from the test and damage index, which can define criteria for determining the damage level in four sessions, are shown in Table 7.

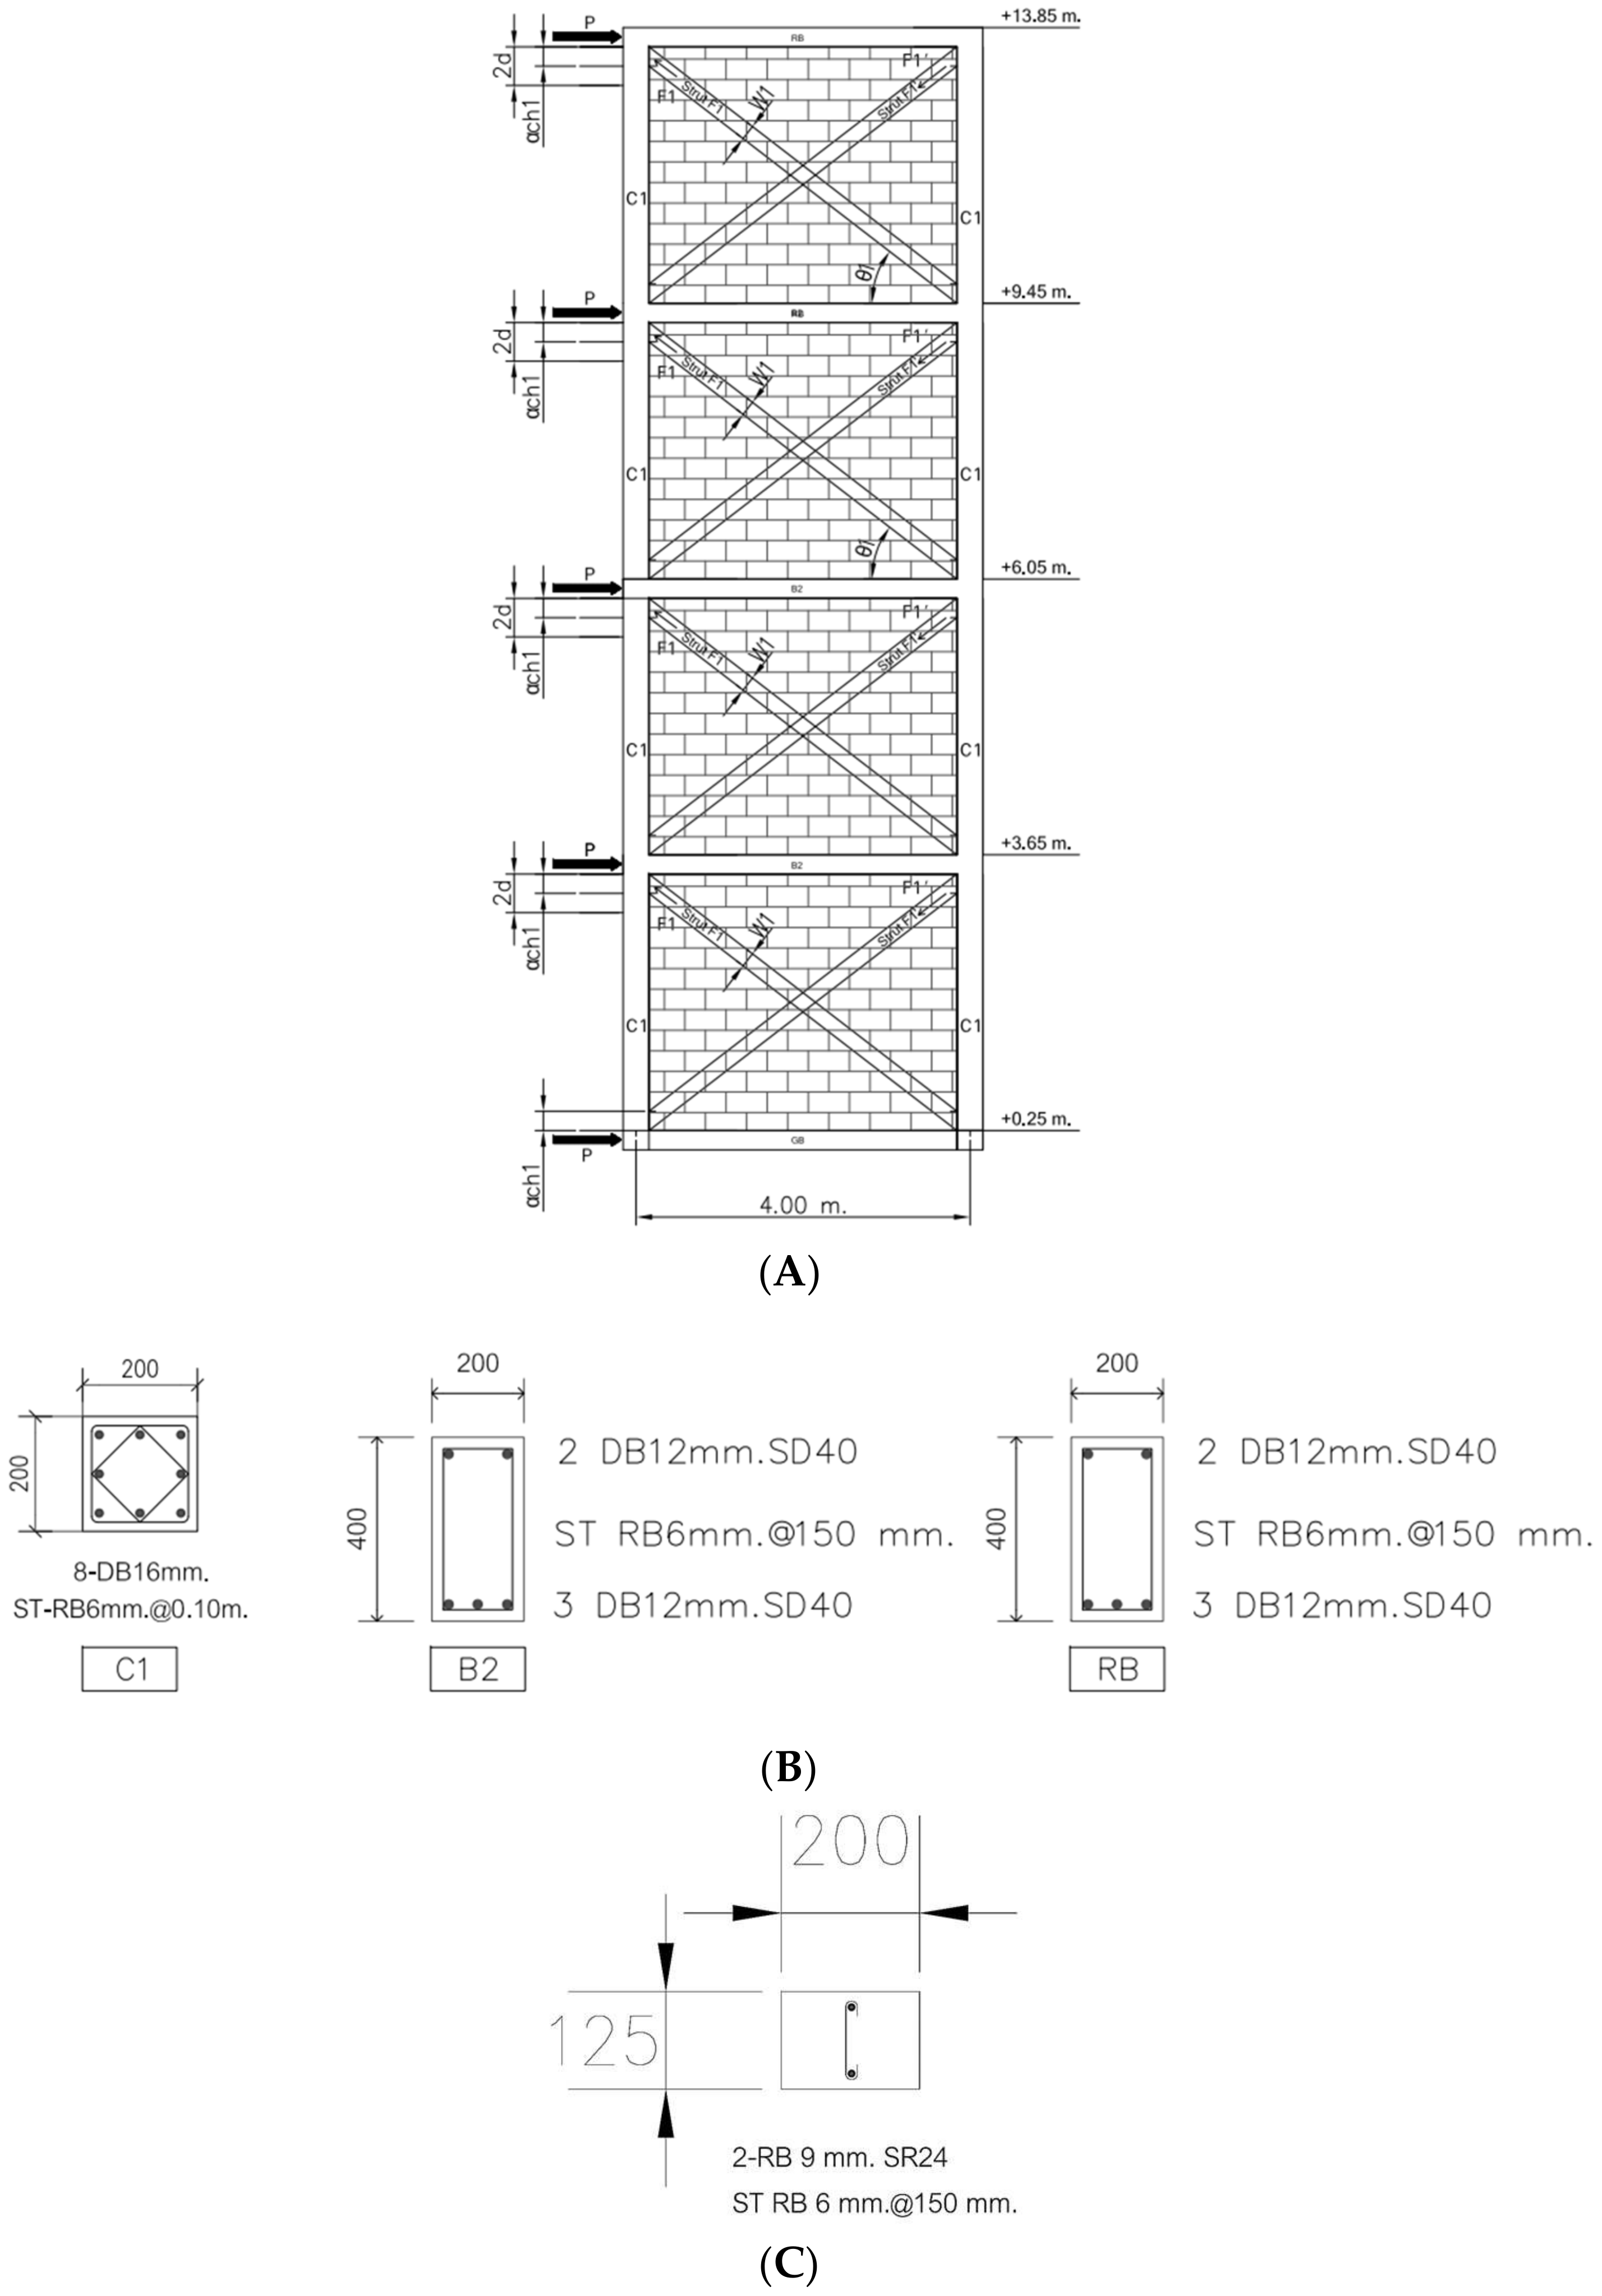
4. Case Study of Masonry Wall Building Reinforced with X-Bracing Concrete Frames

A reinforced rigid frame model is shown in Figure 5A. The columns were reinforced with steel bars and the x-bracing concrete frame technique, because the shear strength acts on columns in buildings. The beams were reinforced with steel bars, as shown in Table 8. This is equivalent to using plastic hinges, which may be placed at the end of beams.
The column’s moment resistance (MS) can be calculated from the sum of the original column’s moment resistance (Mc) and the x-bracing concrete frames’ moment resistance (MB) as follows:
M S =   M C + M B
The x-bracing concrete frames’ moment resistance (MB) can be calculated from the sum of the concrete brace moment resistance and the steel bar moment resistance as follows:
M B = i = 1 n f y s ( S s ) i i + i = 1 n f c ( S c ) i i
where
fys and f′c = yield the strength of the steel bar and compressive strength of the concrete brace;
Ss and Sc = cross-section of the steel bar and concrete brace;
VBF = lateral load resistance of the reinforced rigid frame.
V B F = 2 ( M p j + M s ) / h = 2 ( M p j + M c + M b ) / h
where Mpj = the joint connecting plastic moment, which is considered to include the smallest moment of the column Mpc plastic moment, the beam Mpb plastic moment, and the joint connecting moment of the column–beam. The shear strength of the column VC is half that of VBF:
V C =   ( M p j + M s ) / h

Case Study of Masonry Wall Building Reinforced with X-Bracing Concrete Frames

The concrete building structure has a first floor level 0.25 m, and the building has a width of 4.00 m/bay, with four spaces; a height of 13.85 m; a general floor thickness of 0.10 m; and a live load of 3.00 kN/m2. Moreover, the front of the building frame, as shown in Figure 5A, consists of masonry walls, with the width of the entrance being equal to the column spacing and cross-sectional dimensions. The details of the reinforced steel bars of the columns and beams are shown in Table 8. The compressive strength of the cylinder concrete is 24 MPa, and the tensile strength of the reinforced steel bars is 400 MPa. An analytical model of a masonry wall building reinforced with x-bracing concrete frames is used with the equivalent compressive bracing frame method. Here, the width of the diagonal compressive strength of the masonry wall is W 1 . Moreover, the diagonal compressive strength of the masonry wall is the lateral force resistance of the wall, which can be written in a graph expressing the relation of the lateral force to the displacement value, as shown in Figure 5B. When v m + , v y + , m + , and y + are the maximum resistance, resistance at the yield point, maximum movement, and movement at the yield point in the direction of the acting force, K 0   and K s e c   are the initial stiffness value and cross-sectional stiffness value, respectively.
The maximum resistance of the compressive strength V m of the masonry wall building reinforced with x-bracing concrete frames can be calculated as
V m = f 1   cos θ 1 + f 1   c o s θ 1 = 2 W 1 t f a cos θ 1
where
f a is the allowable compressive stress of the masonry wall prism, f a = 0.6 f m ;
f m is the maximum compression of the masonry wall prism;
= 0.65, and t = the thickness of the masonry wall;
θ 1 is the tilt angle of the diagonal compressive strength of the masonry wall.
The balance of the lateral force P is equal to the sum of the resistance frame and compressive strength f 1 , f 1 :
P =   V B F + f 1 cos θ 1 + f 1 cos θ 1
P = V B F + 2 W 1 t f a cos θ 1
The reinforced concrete building’s rigid frame was calculated and designed for seismic resistance. We calculated the concrete building structure using a computer design in the SeismoStruct 2023 program to identify the requirements for the seismic resistance of the concrete building frame using the nonlinear static force method (a pushover analysis) with response spectrum acceleration. The building was located in Chiang Rai Province (DPT Standard 1301/1302-61) [3]. The lateral force base shear of the concrete building’s rigid frame design was 502.39 kN, and the code used for the lateral displacement safety factor was ASCE41-17 [30]. For the reinforced design of the rigid frame, with steel bars along the length of the columns, to reinforce the beams along their length, the size of the main reinforcement was DB16, and the size of the stirrup reinforcement was RB6; the size of the main reinforcement of the steel bars of the x-bracing concrete frames was RB9, and the size of the stirrup reinforcement was RB6 at the end and base of the columns, spanning a length 2.0 times that of the beams’ depth. The parts of the masonry walls using x-bracing concrete frames are shown in Figure 6.
The moment resistance and shear resistance of the original column were compared with those of the reinforced column, and they were calculated using Equations (7), (8), and (10), as shown in Table 9. Here, V c is the value of the resistance of a single column. The resistance of the reinforced x-bracing concrete frames in the masonry walls of the building can be calculated using Equations (7)–(13), as shown in Table 10, where the P value is the resistance of a single span of the case study concrete building structure, as shown in Figure 6A. The design lateral force, which we also calculated for the four-storey concrete building structure, was 502.39 kN for both the original wall structure and reinforced x-bracing structure.

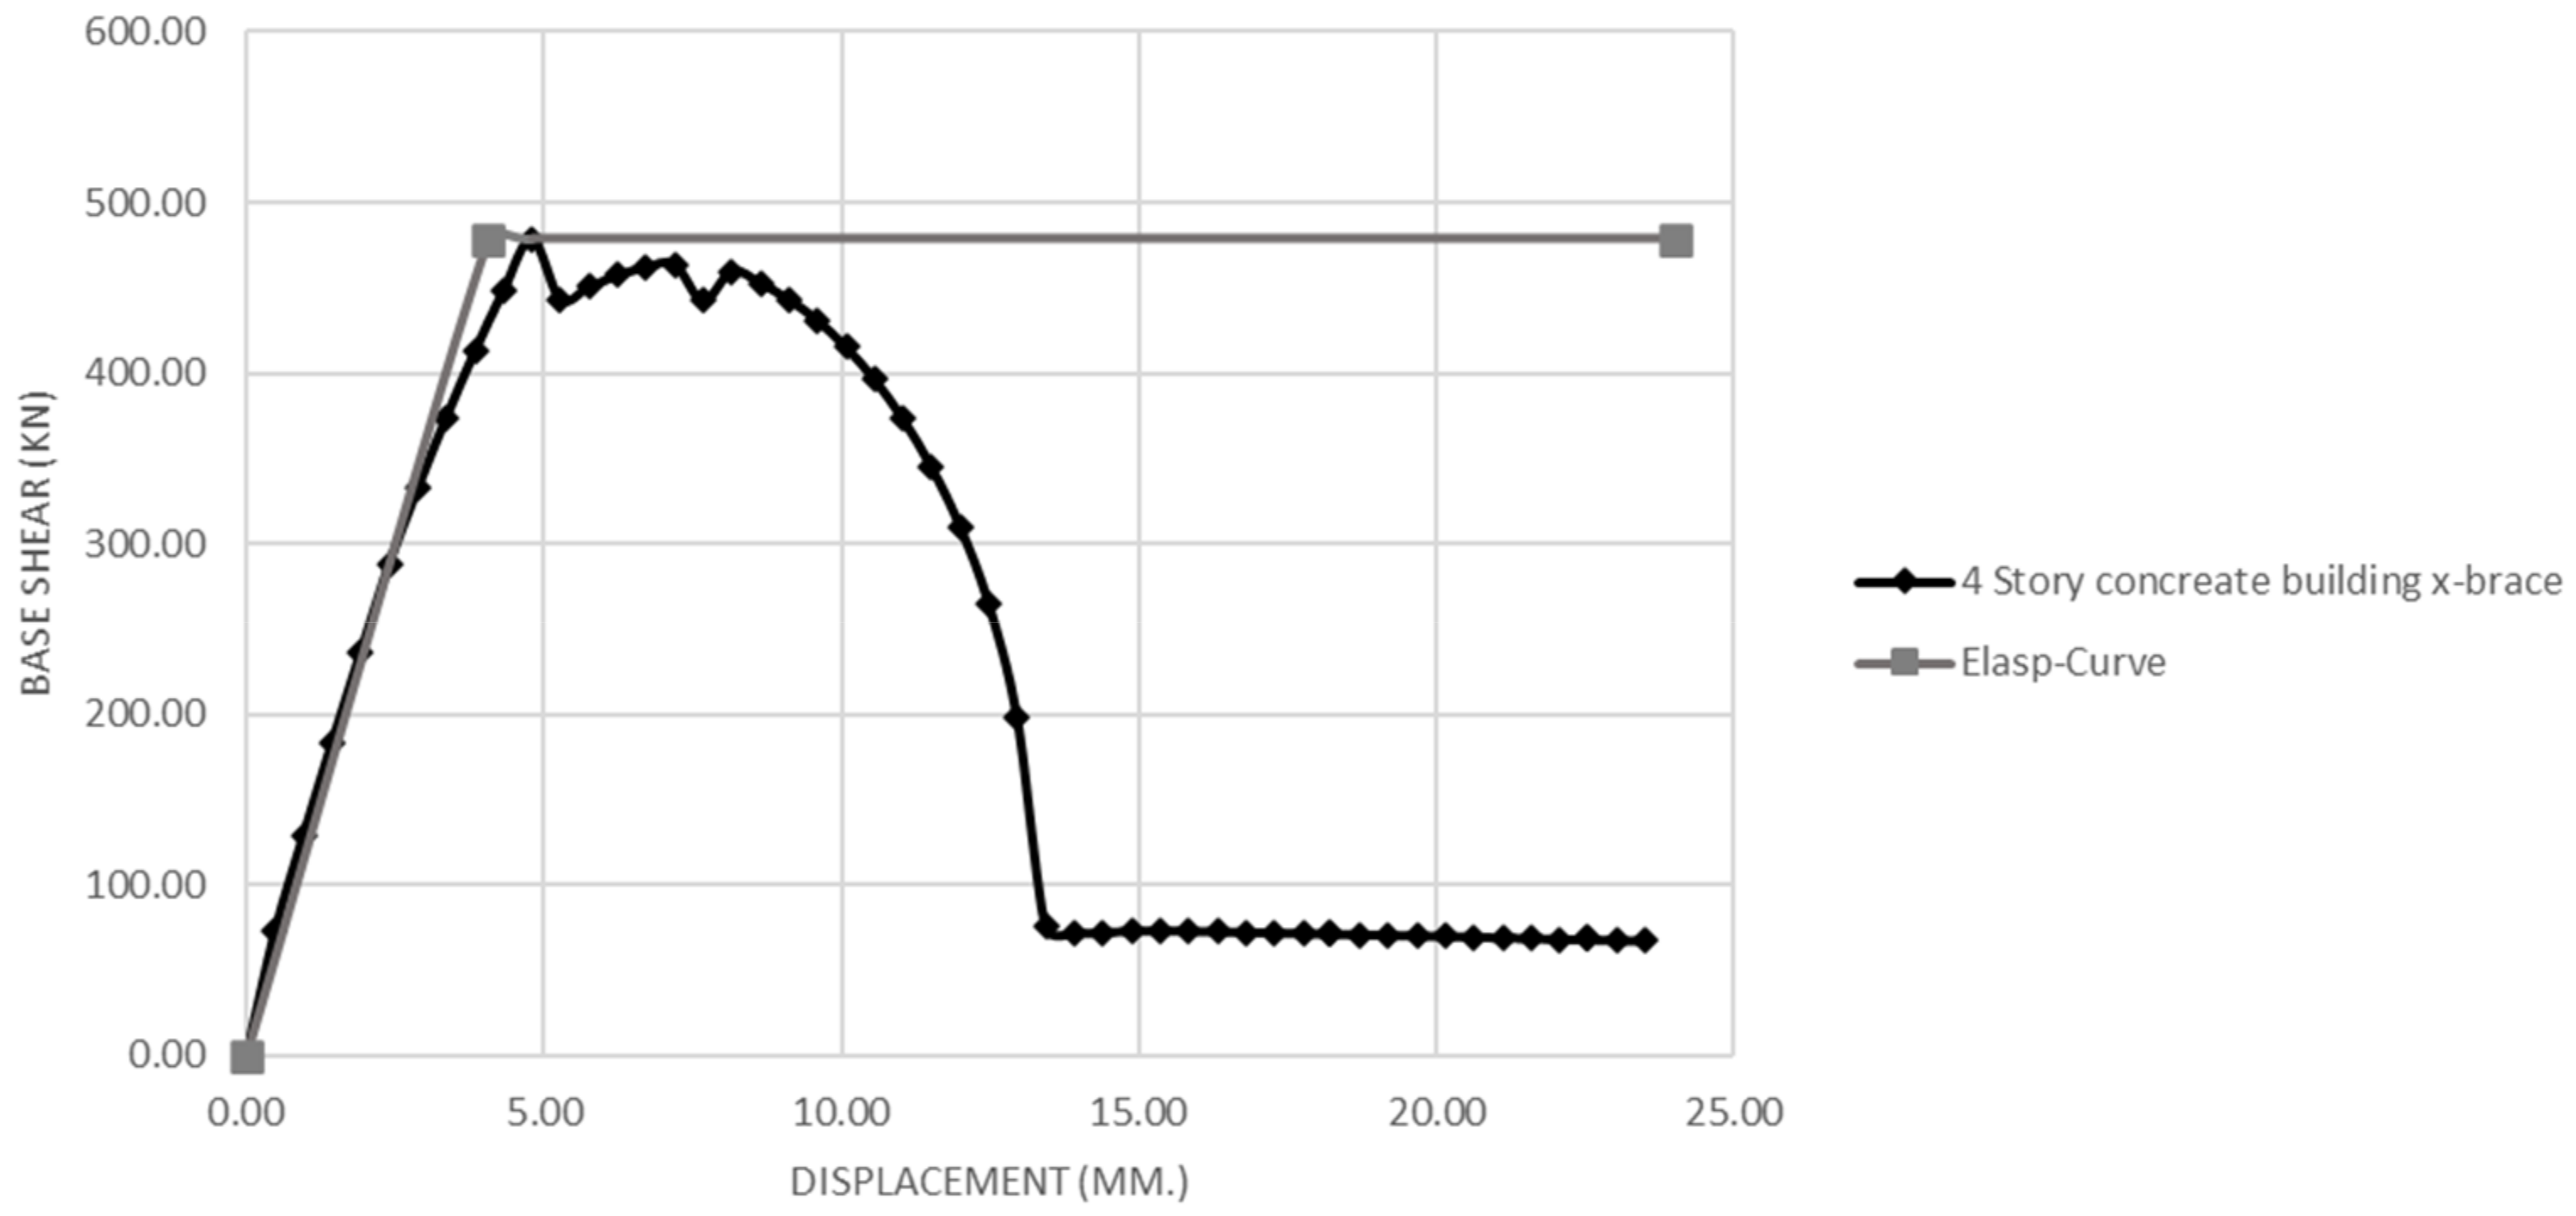
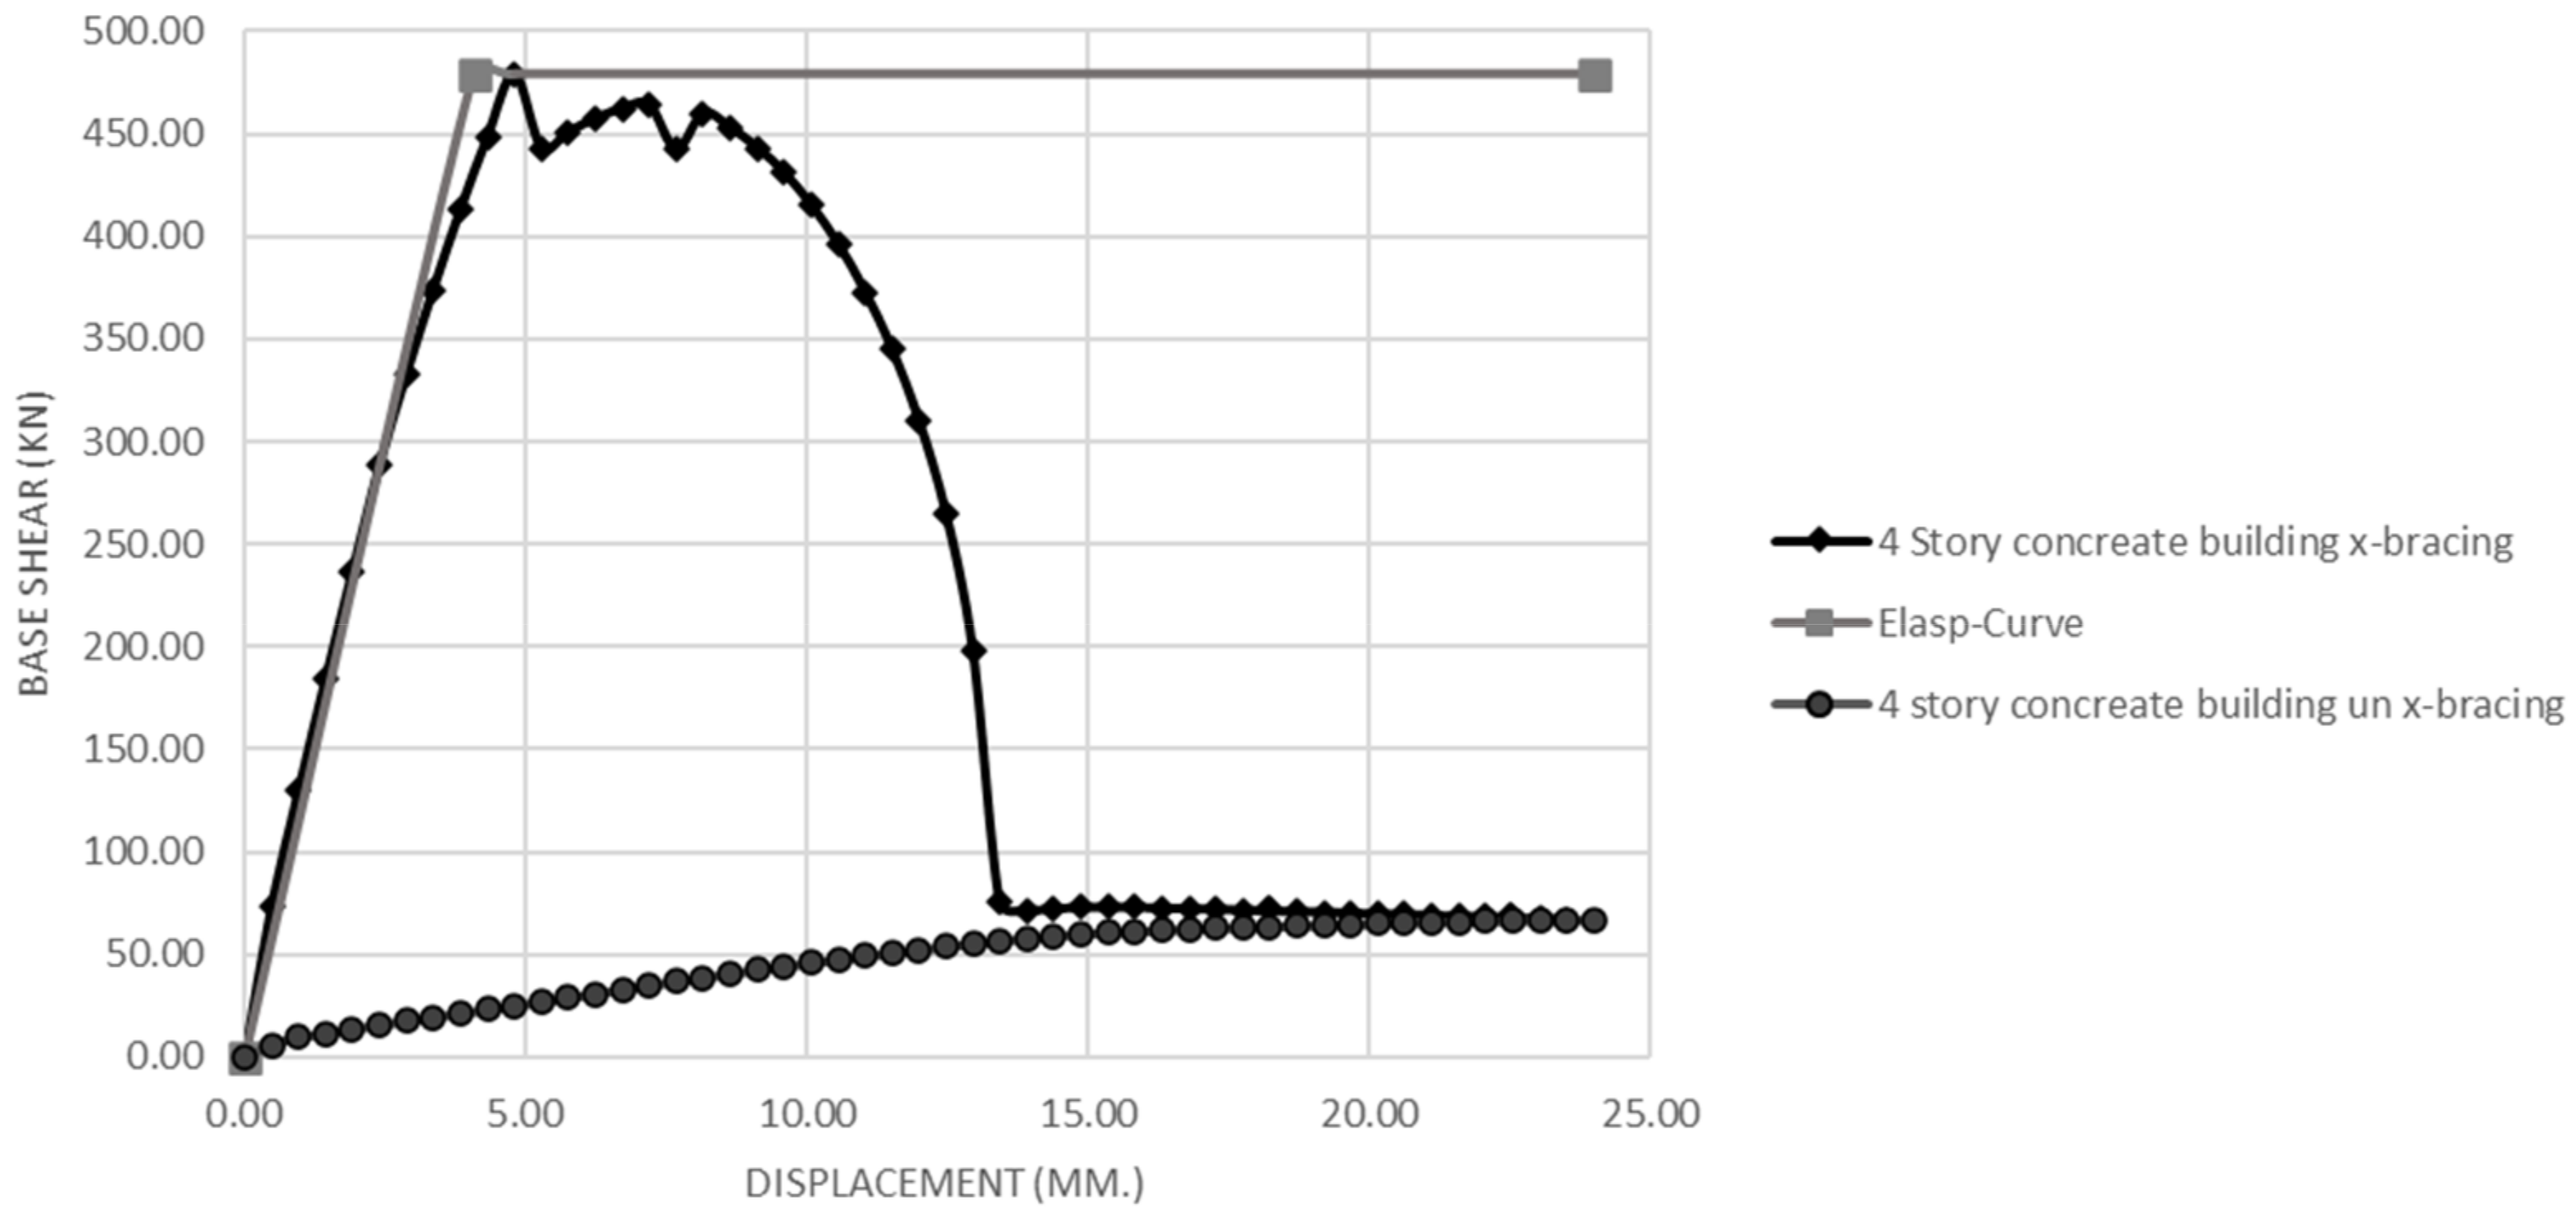
5. Analysis of Masonry Wall Building Reinforced with X-Bracing Concrete Frames

For the four-storey concrete building structure, as shown in Figure 5A, we created a model for a structural analysis using the SeismoStruct 2023 program 3D model, as shown in Figure 6. The data used for the structural analysis of the masonry wall building reinforced with x-bracing concrete frames are shown in Table 9 and Table 10. The moment resistance of the columns and lateral force resistance of the walls were calculated, as shown in Equations (1)–(13).
An analysis of structure of the four-storey masonry wall building reinforced with x-bracing concrete frames was performed using the nonlinear static force method (pushover analysis method), calculating the target storey drift value ( δ t ) with the DPT Standard 1301/1302-61. We used response spectrum acceleration for the building, which was located in Chiang Rai Province. The target design storey’s drift value δ u was increased by 1.25 times ( 1.25 δ m ) to assess the damage index (DI). The parameter results of the target storey’s drift value (β) equalled 0.1–0.35, as shown in Table 11.
Figure 7 shows the maximum lateral force and maximum lateral displacement of the four-storey concrete building structure with masonry walls reinforced with x-bracing concrete frames; when the lateral force is 478.78 kN, the initial starting point of the lateral displacement is equal to 4.80 mm, and the yield maximum lateral displacement is approximately 24.00 mm. The results of the model structure analysis are shown in Table 11. The damage index (DI) indicates extensive large cracks, but the original walls without x-bracing concrete frames show a damage index criterion of more than 1.0, as shown in Table 7.
In Figure 8, we can see that the masonry wall building reinforced with x-bracing concrete frames resists higher maximum lateral force and yield lateral displacement values than the original walls without x-bracing concrete frames. For the original wall without x-bracing concrete frames, when the lateral force is 67.16 kN, the initial starting point of the lateral displacement is equal to 14.99 mm. By comparison, the structure reinforced with x-bracing concrete frames resists a higher lateral force value than the original wall without an x-bracing concrete frame structure, with an approximately 7.13 times difference in lateral forces.

6. Conclusions

In this study, a suitable damage index is determined. Masonry wall buildings reinforced with x-bracing concrete frames are assessed by analysing various models to study the damage behaviours under monotonic loading and cyclic loading conditions. Results, the case study demonstrates that the masonry wall building, reinforced with x-bracing concrete frames, exhibits enhanced seismic resistance, reduced potential for severe damage, and improved overall structural performance compared to the original structure. The detailed analysis and calculations support the effectiveness of x-bracing in mitigating the impact of seismic forces will affect to building collapse. The study results are summarized in the following main points:
  • The monotonic loading and cyclic loading conditions are analysed at the maximum lateral force. The analysis reveals that the results are consistent in the same direction and with the model structure analysis results.
  • The correlation coefficient between the damage level and accumulated energy ( β ) is appropriate for use in the calculation of the damage index using the Park–Ang equation. The Park–Ang equation for a masonry wall building ( β ) is equal to 0.10–0.35.
  • The criteria for the consideration of the damage level are defined as follows: when the damage index is between 0.25 and 0.50, the specimen has a minor damage level; when the damage index is between 0.50 and 0.80, the specimen has a moderate damage level; when the damage index is between 0.80 and 1.00, the specimen has a severe damage level; and when the damage index is more than 1.00, the specimen has a collapse damage level, resulting in the structure of the building experiencing a disaster.
  • The damage index for assessing the seismic-resistant design of masonry wall buildings reinforced with x-bracing concrete frames shows that they resist higher lateral force base shear values before lateral displacement than the original walls without x-bracing concrete frame structures, with values of 478.78 kN and at 67.16 kN, respectively, demonstrating an approximately 7.13 times difference in lateral forces. The masonry wall buildings reinforced with x-bracing concrete frames show extensive large cracks, and the damage index criterion (DI) is equal to 0.8 in the maximum lateral force base shear design.
Therefore, the use of reinforced x-bracing concrete frames in masonry wall buildings offers a holistic approach to seismic resistance. This strategy addresses the vulnerabilities of traditional masonry structures, providing improved stability, increased shear strength, controlled de-formation, and enhanced energy dissipation. The adaptability of x-bracing systems makes them valuable not only in new construction but also in retrofitting existing buildings for better seismic performance.

Author Contributions

Conceptualization, Y.C. and V.C.; methodology, Y.C. and V.C.; software, Y.C. and V.C.; validation, Y.C. and V.C.; formal analysis, Y.C. and V.C.; investigation, Y.C. and V.C.; resources, Y.C. and V.C.; data curation, Y.C. and V.C.; writing—original draft preparation, Y.C. and V.C.; writing—review and editing, Y.C. and V.C.; visualization, Y.C. and V.C.; supervision, Y.C. and V.C.; project administration, Y.C. and V.C. All authors have read and agreed to the published version of the manuscript.

Funding

This research received no external funding for the cost of publication.

Institutional Review Board Statement

Not applicable.

Informed Consent Statement

Not applicable.

Data Availability Statement

Data is contained within the article.

Conflicts of Interest

The authors declare no conflict of interest.

References

  1. Lukkunaprasit, P.; Ruangrassamee, A.; Boonyatee, T.; Chintanapakdee, C.; Jankaew, K.; Thanasisathit, N.; Chandrangsu, T. Performance of structures in the MW 6.1 mae lao earthquake in Thailand on May 5, 2014, and implications for future construction. J. Earthq. Eng. 2015, 20, 219–242. [Google Scholar]
  2. Park, Y.J.; Ang, A.H.S. Mechanistic seismic damage model for reinforced concrete. J. Struct. Eng. 1985, 111, 723–732. [Google Scholar]
  3. DPT’s Standard 1301/1302. (2561); Earthquake Vibration Resistance Building Design Standards. Department of Public Works and Town & Country Planning: Bangkok, Thailand, 2018.
  4. Amornpunyapat, R.; Panyakapo, P.; Panyakapo, M. Development of Lightweight Concrete Interlocking Block Panel with Water Treatment Sludge and Expanded Metal Ferrocement. Eng. J. 2021, 25, 81–97. [Google Scholar]
  5. Saneinejad, A.; Hobbs, B. Inelastic design of infilled frames. J. Struct. Eng. ASCE 1995, 6682, 634–660. [Google Scholar]
  6. Mehrabi, A.B.; Shing, P.B.; Schuller, M.P.; Noland, J.L. Experimental evaluation of masonry-infilled RC frames. J. Struct. Eng. 1996, 122, 228–237. [Google Scholar]
  7. Wararuksajja, W.; Srechai, J.; Leelataviwat, S. Seismic design of RC moment-resisting frames with concrete block infill walls considering local infill-frame interactions. Bull. Earthq. Eng. 2020, 18, 6445–6474. [Google Scholar]
  8. Jiang, H.; Liu, X.; Mao, J. Full-scale experimental study on masonry infilled RC momentresisting frames under cyclic loads. Eng. Struct. 2015, 91, 70–84. [Google Scholar]
  9. Morandi, P.; Hak, S.; Magenes, G. Performancebased interpretation of in-plane cyclic tests on RC frames with strong masonry infills. Eng. Struct. 2018, 156, 503–521. [Google Scholar]
  10. Huang, Q.; Guo, Z.; Kuang, J.S. Designing infilled reinforced concrete frames with the ‘strong frame-weak infill’ principle. Eng. Struct. 2016, 123, 341–353. [Google Scholar]
  11. SeismoStruct user manual. Seismostruct User Manual; Seisomsoft Ltd.: Pavia, Italy, 2021. [Google Scholar]
  12. Kazemi, M.T.; Morshed, R. Seismic shear strengthening of R/C columns with ferrocement jacket. Cem. Concr. Compos. 2005, 27, 834–842. [Google Scholar]
  13. Leeanansaksiri, A.; Panyakapo, P.; Ruangrassme, A. Seismic capacity of masonry infilled RC frame strengthening with expanded metal ferrocement. Eng. Struct. 2018, 159, 110–127. [Google Scholar]
  14. Longthong, S.; Panyakapo, P.; Ruangrassamee, A. Seismic Strengthening of RC Frame and Brick Infill Panel using Ferrocement and Expanded Metal. Eng. J. 2020, 24, 45–59. [Google Scholar]
  15. Li, B.; Lam, E.S.S. Influence of interfacial characteristics on the shear bond behavior between concrete and ferrocement. Constr. Build. Mater. 2018, 176, 462–469. [Google Scholar]
  16. Panyamul, S.; Panyakapo, P.; Ruangrassame, A. Seismic shear strengthening of reinforced concrete short columns using fer-rocement with expanded metal. Eng. J. 2019, 23, 175–189. [Google Scholar]
  17. Salinas, S.; Guzman, A.; Carrillo, J. Performance evaluation of structures with reinforced concrete columns retrofitted with steel jacketing. J. Build. Eng. 2021, 33, 101510. [Google Scholar]
  18. Panyakapo, P. Seismic analysis of RC frame with brick infill panel strengthened by steel cage and expanded metal. Eng. J. 2021, 25, 29–44. [Google Scholar]
  19. Saiidi, M.; Sozen, M.A. Simple and Complex Models for Nonlinear Seismic Response of Reinforced Concrete Structures; Report UILU–ENG-79-2031; Department of Civil Engineering, University of Illinois: Urbana, IL, USA, 1979. [Google Scholar]
  20. Stewart, W.G. The Seismic Design of Plywood Sheathed Shear Walls. Ph.D. Thesis, Department of Civil Engineering, University of Canterbury, Christchurch, New Zealand, 1987. [Google Scholar]
  21. Naeim, F.; Kelly, J.M. Design of Seismic Isolated Structures: From Theory to Practice; John Wiley: Hoboken, NJ, USA, 1999. [Google Scholar]
  22. Symans, M.D.; Charney, F.A.; Whittaker, A.S.; Constantinou, M.C.; Kircher, C.A.; Johnson, M.W.; McNamara, R.J. Energy Dissipation Systems for Seismic Applications: Current Practice and Recent Developments. J. Struct. Eng. 2007, 134, 3–21. [Google Scholar] [CrossRef]
  23. Kelly, J.M. The role of damping in seismic isolation. Earthq. Eng. Struct. Dyn. 1999, 28, 3–20. [Google Scholar]
  24. Engle, T.; Mahmoud, H.; Chulahwat, A. Hybrid Tuned Mass Damper and Isolation Floor Slab System Optimized for Vibration Control. J. Earthq. Eng. 2015, 19, 1197–1221. [Google Scholar] [CrossRef]
  25. Matta, E.; De Stefano, A. Robust design of mass-uncertain rolling-pendulum TMDs for the seismic protection of buildings. Mech. Syst. Signal Process. 2009, 23, 127–147. [Google Scholar] [CrossRef]
  26. De Domenico, D.; Ricciardi, G. Optimal design and seismic performance of tuned mass damper inerter (TMDI) for structures with nonlinear base isolation systems. Earthq. Eng. Struct. Dyn. 2018, 47, 2539–2560. [Google Scholar] [CrossRef]
  27. Mantakas, A.G.; Kapasakalis, K.A.; Alvertos, A.E.; Antoniadis, I.A.; Sapountzakis, E.J. A Negative Stiffness Dynamic Base Absorber for Seismic Retrofitting of Residential Buildings. Struct. Control Health Monit. 2022, 29, e3127. [Google Scholar] [CrossRef]
  28. Kapasakalis, K.A.; Antoniadis, I.A.; Sapountzakis, E.J. Constrained Optimal Design of Seismic Base Absorbers Based on an Extended KDamper Concept. Eng. Struct. 2020, 226, 111312. [Google Scholar] [CrossRef]
  29. Kapasakalis, K.A.; Antoniadis, I.A.; Sapountzakis, E.J. Performance Assessment of the KDamper as a Seismic Absorption Base. Struct. Control Health Monit. 2019, 27, e2482. [Google Scholar] [CrossRef]
  30. Standard ASCE 41-17; Seismic Evaluation and Retrofit of Existing Buildings (41-17). American Society of Civil Engineers: Reston, VA, USA, 2017.
Figure 1. Model of masonry wall building reinforced with x-bracing frame. (A) Model of masonry wall building reinforced with x-bracing concrete frames for compressive strength. (B) Model of masonry wall building reinforced with x-bracing concrete frame for compression/tension and shear strut.
Applsci 13 12566 g001
Figure 2. Monotonic loading and cyclic loading characteristics of the model samples [12,13,14,15,16,17,18,19,20,21,22,23,24,25,26,27,28,29].
Applsci 13 12566 g002
Figure 3. Relationship between the lateral force and lateral displacement of the model samples.
Applsci 13 12566 g003
Figure 4. Analysis results from alternating the lateral forces of the model samples.
Applsci 13 12566 g004aApplsci 13 12566 g004bApplsci 13 12566 g004c
Figure 5. Part of the wall frame model. (A) An analytical model of the masonry walls according to the equivalent compressive x-brace concrete frame method. (B) Relation of the lateral force to the displacement value.
Applsci 13 12566 g005
Figure 6. Masonry walls, columns, and beams reinforced with x-bracing concrete frame. (A) Single-span reinforced building frame; (B) cross-section of the reinforced column and beam; (C) cross-section of the reinforced x-bracing concrete frame.
Applsci 13 12566 g006
Figure 7. Model of masonry wall building reinforced with x-bracing concrete frame.
Applsci 13 12566 g007
Figure 8. Comparison between masonry wall building with x-bracing and original wall building without x-bracing concrete frame.
Applsci 13 12566 g008
Table 1. Details of the model samples from the literature review.
Sample NameH (mm)L (mm)D (mm)W1 (mm) t w (m)
Mehrabi et al. [6]
No. 4 153723121471870.092
Wararuksajja et al. [7]
WS01 280040002503150.100
WS02 280040002503310.100
WS03 280040002503340.100
Jiang et al. [8]
AFKJ1 295059403502000.427
Morandi et al. [9]
TA2 312545873003500.370
Huang et al. [10]
IF-1 137522502181200.200
IF-2 137522502181800.204
Table 2. Mechanical properties of the reinforcement x-bracing concrete frames used in the model samples from the literature review.
Sample NameMaximum Compressive Strength (Mpa)Pending Strength (Mpa)Compressive StressPending Stress (mm)
No. 4 5.50.190.00100.0060
WS01 9.40.200.00170.0050
WS02 7.80.200.00170.0050
WS03 6.80.200.00140.0018
AFKJ1 3.80.470.00160.0060
TA2 2.90.380.00110.0060
IF-1 5.40.220.00200.0090
IF-2 2.80.460.00140.0100
Table 3. Maximum lateral force and maximum lateral displacement of the model samples (cyclic loading).
SampleLoad TargetResult Model Structure Analysis
Lateral Force (kN)Maximum Lateral Force to Displacement (kN)Maximum Lateral Displacement (mm)
No. 4 502.39210.743.07
WS01 502.39186.115.60
WS02 502.39234.6905.60
WS03 502.39235.9205.60
AFKJ1 502.39613.1405.90
TA2 502.39378.4706.25
IF-1 502.39250.1102.75
IF-2 502.39239.8602.75
Table 4. Results of model samples of masonry wall buildings reinforced with x-bracing concrete frames.
Sample Name Q y (kN) δ M (m) δ u (m)
No. 4 151.480.01110.014
WS01 186.110.01340.017
WS02 234.690.0090.011
WS03 235.920.0090.011
AFKJ1 680.860.0590.074
TA2 467.930.06250.078
IF-1 250.110.00830.010
IF-2 257.220.00610.008
Table 5. Damage index (DI) using various coefficients ( β ) of the model samples.
Sample Name β
0.100.150.200.250.300.35
No. 40.8180.8370.8460.8460.8550.864
WS010.8180.8360.8450.8450.8540.863
WS020.8100.8190.8240.8240.8290.834
WS030.8100.8190.8240.8240.8290.833
AFKJ10.8220.8430.8540.8540.8650.876
TA20.8330.8670.8830.8830.9000.917
IF-10.8080.8170.8210.8210.8250.829
IF-20.8060.8120.8150.8150.8180.821
Average0.8160.8310.8390.8390.8470.855
SD.0.0090.0180.0230.0230.0270.032
Avg.+SD.0.8250.8490.8620.8620.8740.887
Avg.-SD.0.8060.8130.8160.8160.8190.823
Table 6. Damage index at each damage level.
Damage CharacteristicsDamage Index (DI)
WS01WS02WS03
Total collapse of infill 1.571.521.16
Extensive large cracks 1.071.030.84
Corner crushing 0.770.740.52
First diagonal crack 0.480.470.24
Table 7. Criteria for determining the level of Park–Ang damage index.
Damage LevelPhysical CharacteristicsDamage Index
Collapse Total collapse of infill>1.00
Severe Extensive large cracks0.80–1.00
Moderate Corner crushing0.50–0.80
Minor First diagonal crack0.25–0.50
Table 8. The details of the reinforced steel bars.
BuildingSize (mm.)Main Reinforcement (mm.)Stirrup Reinforcement (mm.)
C1200 × 2008DB16RB6@150
B2200 × 4005DB16RB6@150
RB200 × 4005DB16RB6@150
W1125 × 2002RB9RB6@150
Table 9. Resistance of the column of the masonry wall building reinforced with x-bracing concrete frames.
ParameterOriginal ColumnReinforced X-Brace Concrete Frames
M c   ( k N m ) 30.0530.05
M b   ( k N m ) -518.00
M S   ( k N m ) -548.05
M p j   ( k N m ) 23.6523.65
V c   ( k N m ) 11.19190.57
Table 10. Resistance of the masonry wall building reinforced with x-bracing concrete frames.
ParameterOriginal WallsReinforced X-Brace Concrete Frames
α c 0.0850.1176
W 1   ( m m ) -124.26
2 W 1 t f a   cos   θ 1   ( k N ) -75.52
V B F   ( k N ) 22.38155.79
P   ( k N ) 22.38231.31
D e s i g n   l a t e r a l   f o r c e   ( k N ) 502.39502.39
Table 11. Results of masonry walls with and without x-bracing concrete frames used in the four-storey concrete building structure models.
Case Study β
Q y (kN) δ M (m) δ u (m)0.100.150.200.250.300.35
Four-storey concrete building with x-bracing concrete frames478.780 0.0480.060.830.850.860.860.880.89
Four-storey concrete building without x-bracing concrete frames67.160 0.2400.301.692.593.033.033.483.93
Disclaimer/Publisher’s Note: The statements, opinions and data contained in all publications are solely those of the individual author(s) and contributor(s) and not of MDPI and/or the editor(s). MDPI and/or the editor(s) disclaim responsibility for any injury to people or property resulting from any ideas, methods, instructions or products referred to in the content.

