Article

Three-Dimensional Model-Based Line-of-Sight Analysis for Optimal Installation of IoT Monitoring Devices in Underground Mines

1
Department of Energy and Mineral Resources Engineering, Kangwon National University, Samcheok 25913, Republic of Korea
2
Division of Liberal Studies, Kangwon National University, Samcheok 25930, Republic of Korea
3
Department of Energy Resources and Chemical Engineering, Kangwon National University, Samcheok 25913, Republic of Korea
*
Authors to whom correspondence should be addressed.
Appl. Sci. 2023, 13(22), 12535; https://doi.org/10.3390/app132212535
Submission received: 9 October 2023 / Revised: 7 November 2023 / Accepted: 15 November 2023 / Published: 20 November 2023
(This article belongs to the Special Issue Geographic Visualization: Evaluation and Monitoring of Geohazards)

Abstract

:
Internet of things (IoT)-based wireless communication technology has been applied for efficient work and safety in mines. However, underground mines are surrounded by walls and have numerous curves, which reduce communication stability. For smooth communication between devices, a line of sight (LOS) must be connected without obstacles. If optimal installation locations in a virtual space can be confirmed before installing the device in the field, trial and error can be avoided. In this study, a 3D model-based LOS analysis technology was developed using Python and a ray-casting algorithm. A place with numerous LOS connections has good communication with other places; consequently, it is a suitable location to install the device. To indicate the degree of communication smoothness, a smooth communication index was proposed. A preliminary experiment was conducted in an indoor space within the Samcheok Campus of the Kangwon National University, and a field experiment was conducted at the Samdo Mine in Dogye-eup, Samcheok-si, Gangwon-do. Based on these results, an effective wireless sensor network (WSN) was established by installing a ZigBee-based monitoring device. The results of this study can be further improved and used for constructing smooth WSNs in underground mines in the future.

1. Introduction

In underground mines, the ground may become unstable owing to vibrations from blasting and mining operations. Furthermore, harmful gases or dust may be generated depending on the mined material; these factors are hazardous to mine workers, essentially resulting in the loss of life and money. In Korea, the number of mine accidents has decreased since the 1980s; however, accidents continue to occur. In Korea, the number of accident victims in the past 10 years was approximately 60 [1]. In the United States, which has more mining workers compared with Korea, 43 occupational fatalities were reported in 2014 and 26 in 2015 [2]. As various factors, such as machinery, haulage, ground subsidence, and sliding rocks, can cause accidents, the environment must be monitored. Essentially, the environmental factors must be estimated, and appropriate countermeasures must be adopted to prevent potential accidents in mines. In particular, the current state of a mine must be understood by monitoring the environment and worker conditions. For example, by monitoring vibrations, collapse can be prevented by reinforcing structurally unstable areas [3,4,5]. By monitoring the amount of gas or dust, an appropriate ventilation system can be established by installing a ventilator in an area where a large amount of harmful gas is generated [6,7,8]. If the location and heart rate of a worker are monitored, an optimal response can be achieved at the earliest in case an accident occurs [9,10,11]. However, in underground mines, a GPS connection is not possible, leading to difficulty in tracking a worker’s location. In addition, a connection with an external network is impossible unless an additional network is configured in the mine.
Therefore, several attempts have been made to combine various sensors and Internet of things (IoT) to build networks in underground mines [12,13,14]. To build a smooth wireless sensor network (WSN) in an underground mine, the issues regarding power supply and communication stability between devices must be addressed. First, sufficient and continuous power must be supplied to an IoT device to produce an appropriate output. In the long term, installing wires is the most useful strategy; however, applying wires in small mines is challenging because of high construction costs. An alternative is to supply power through batteries to minimize the power consumption of IoT devices. To improve the communication stability of WSNs, dense networks must be developed by increasing the number of IoT devices. When the communication between devices is smooth, a better communication network can be built using relatively few devices. Therefore, to obtain an optimal effect within a limited budget, the obstacles between devices should be reduced to the maximum possible extent. The absence of obstacles between devices implies that the line of sight (LOS) is connected between the devices. The LOS is an imaginary line between an observer and target. In communication, it represents a direct path from the transmitter to the receiver. Several studies in various fields have analyzed the visible area from an observer or analyzed the LOS for smooth communication in consideration of the topography [15,16,17,18,19]. Similarly, before installing communication devices at an underground mine site, the LOS must be analyzed in advance to determine the areas with good communication. Thus, the arrangement of communication devices can be designed efficiently, which can be useful when installing additional devices or performing maintenance tasks in the future. Several studies [20,21,22,23] have been conducted to effectively install communication devices of various frequencies in underground mines. These studies actually installed communication devices in the field and analyzed communication strength considering LOS. However, most of these studies have focused on detailed strength analysis in a small area, and there have been few studies that have considered the 3D space for a large area. Most existing studies that analyzed LOS over a wide area have utilized GIS-based 2.5D digital surface model (DSM) data, considering outdoor open environments. GIS-based LOS analysis primarily uses pixel-type (raster) data with a uniform matrix structure, and the LOS between all pixels must be calculated. However, underground mines cannot be expressed in 2.5D (2D with elevation values) like the surface; thus, they must be analyzed using 3D points. Three-dimensional (3D) points are typically unevenly distributed, and even if data are uniformly processed in the form of voxels, unnecessary calculations arise. In addition, as the process of analyzing the LOS between all points has a high throughput, a method different from the GIS analysis method must be applied.
Therefore, in this study, a 3D model-based ray-casting technology was used to analyze the LOS between IoT devices in underground mines. Ray casting is used primarily in computer graphics and is a technology that draws a virtual line based on the location and LOS of an object in 2D or 3D space to determine the part that intersects with the object. If a virtual ray radiates from a specific point in all directions through ray casting, the coordinates of the points intersected by the ray can be obtained. Obtaining the coordinates of these points implies that the LOS is connected to the ray emission point and to other points. In this study, the concept of a smooth communication index (SCI) was proposed using ray-casting-based LOS analysis, and areas with good communication environments were assigned SCI scores. Additionally, after determining the point at which the communication device was to be installed, the location where the next device was to be installed was determined by analyzing the area where the LOS was connected at that point. Section 2 presents the concept and utilization method of LOS used in this study, and explains the SCI developed based on it. Section 3 presents the experimental results obtained by applying the developed technology to real-world applications. To verify the developed technology, a preliminary test was conducted in an indoor building on the Samcheok Campus of Kangwon National University. Subsequently, ZigBee-based IoT devices were installed after constructing a 3D underground mine model and analyzing the LOS for the Taeyoung EMC Samdo mine located in Dogye-eup, Samcheok-si, and Gangwon-do. If IoT devices are installed by analyzing the LOS in advance, appropriate installation points can be determined in advance without entering the mine directly, and better communication stability can be achieved. Section 4 discusses the improvements and usability of the developed technology and Section 5 presents the conclusions.

2. Materials and Methods

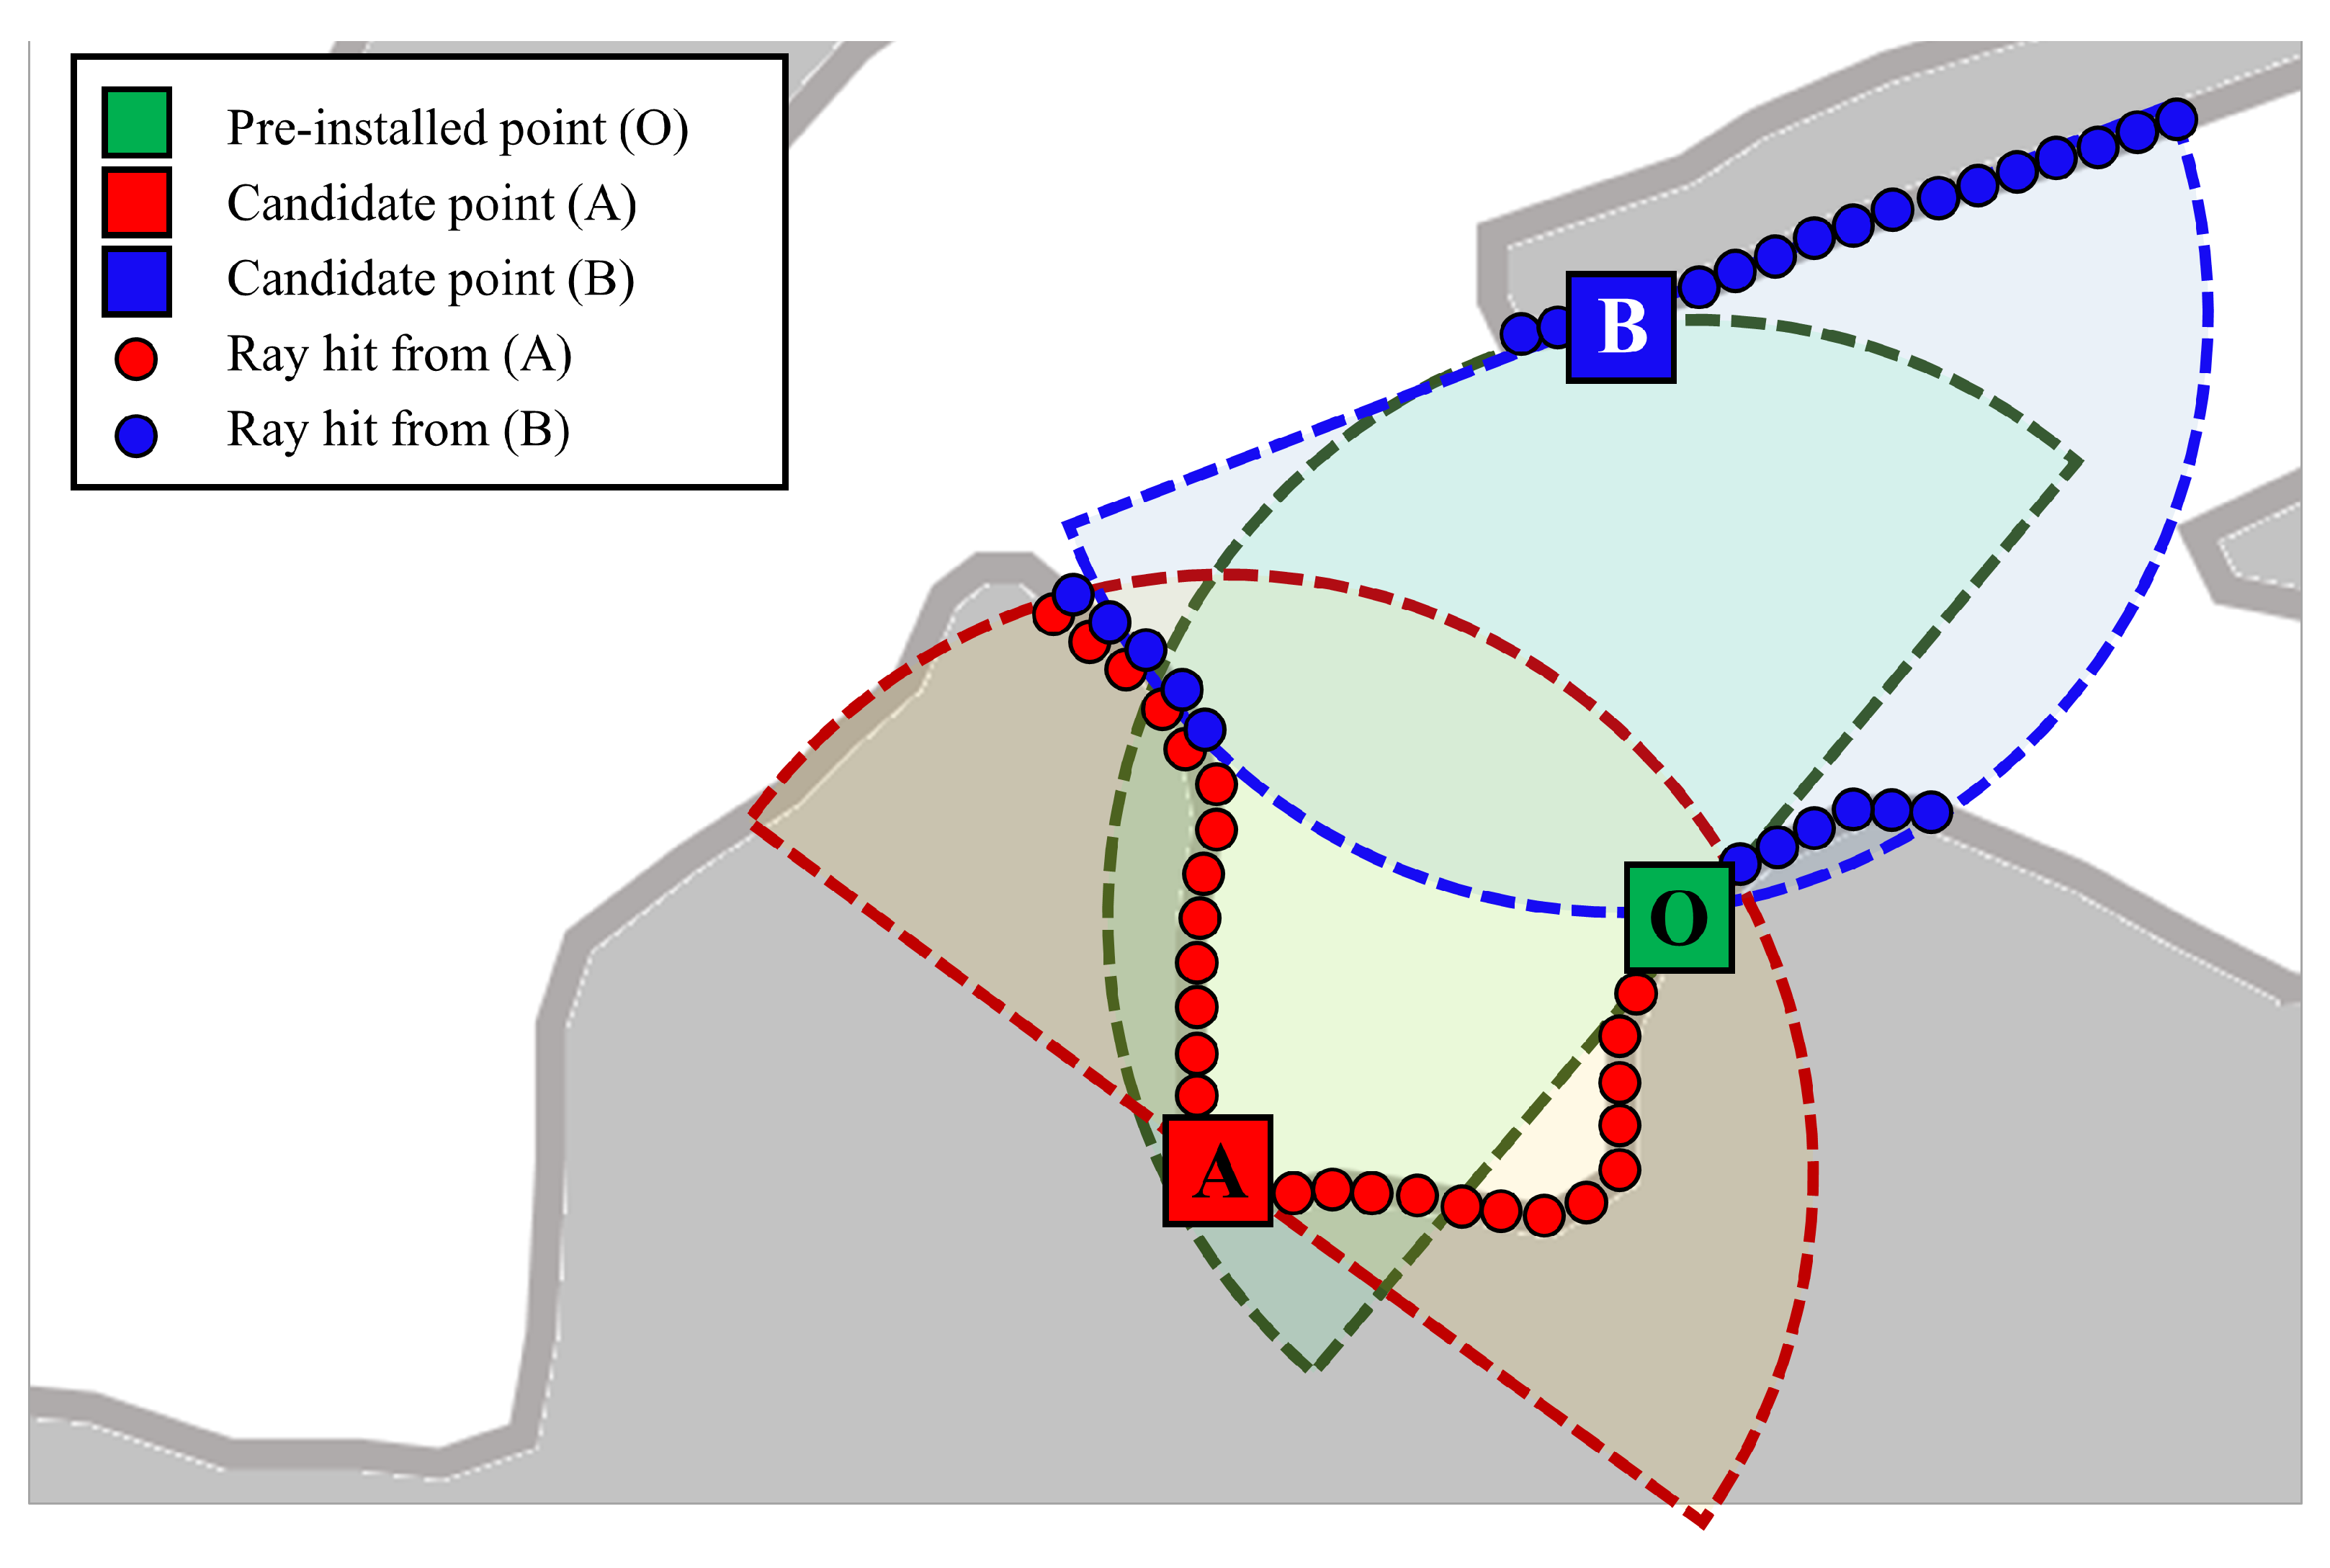
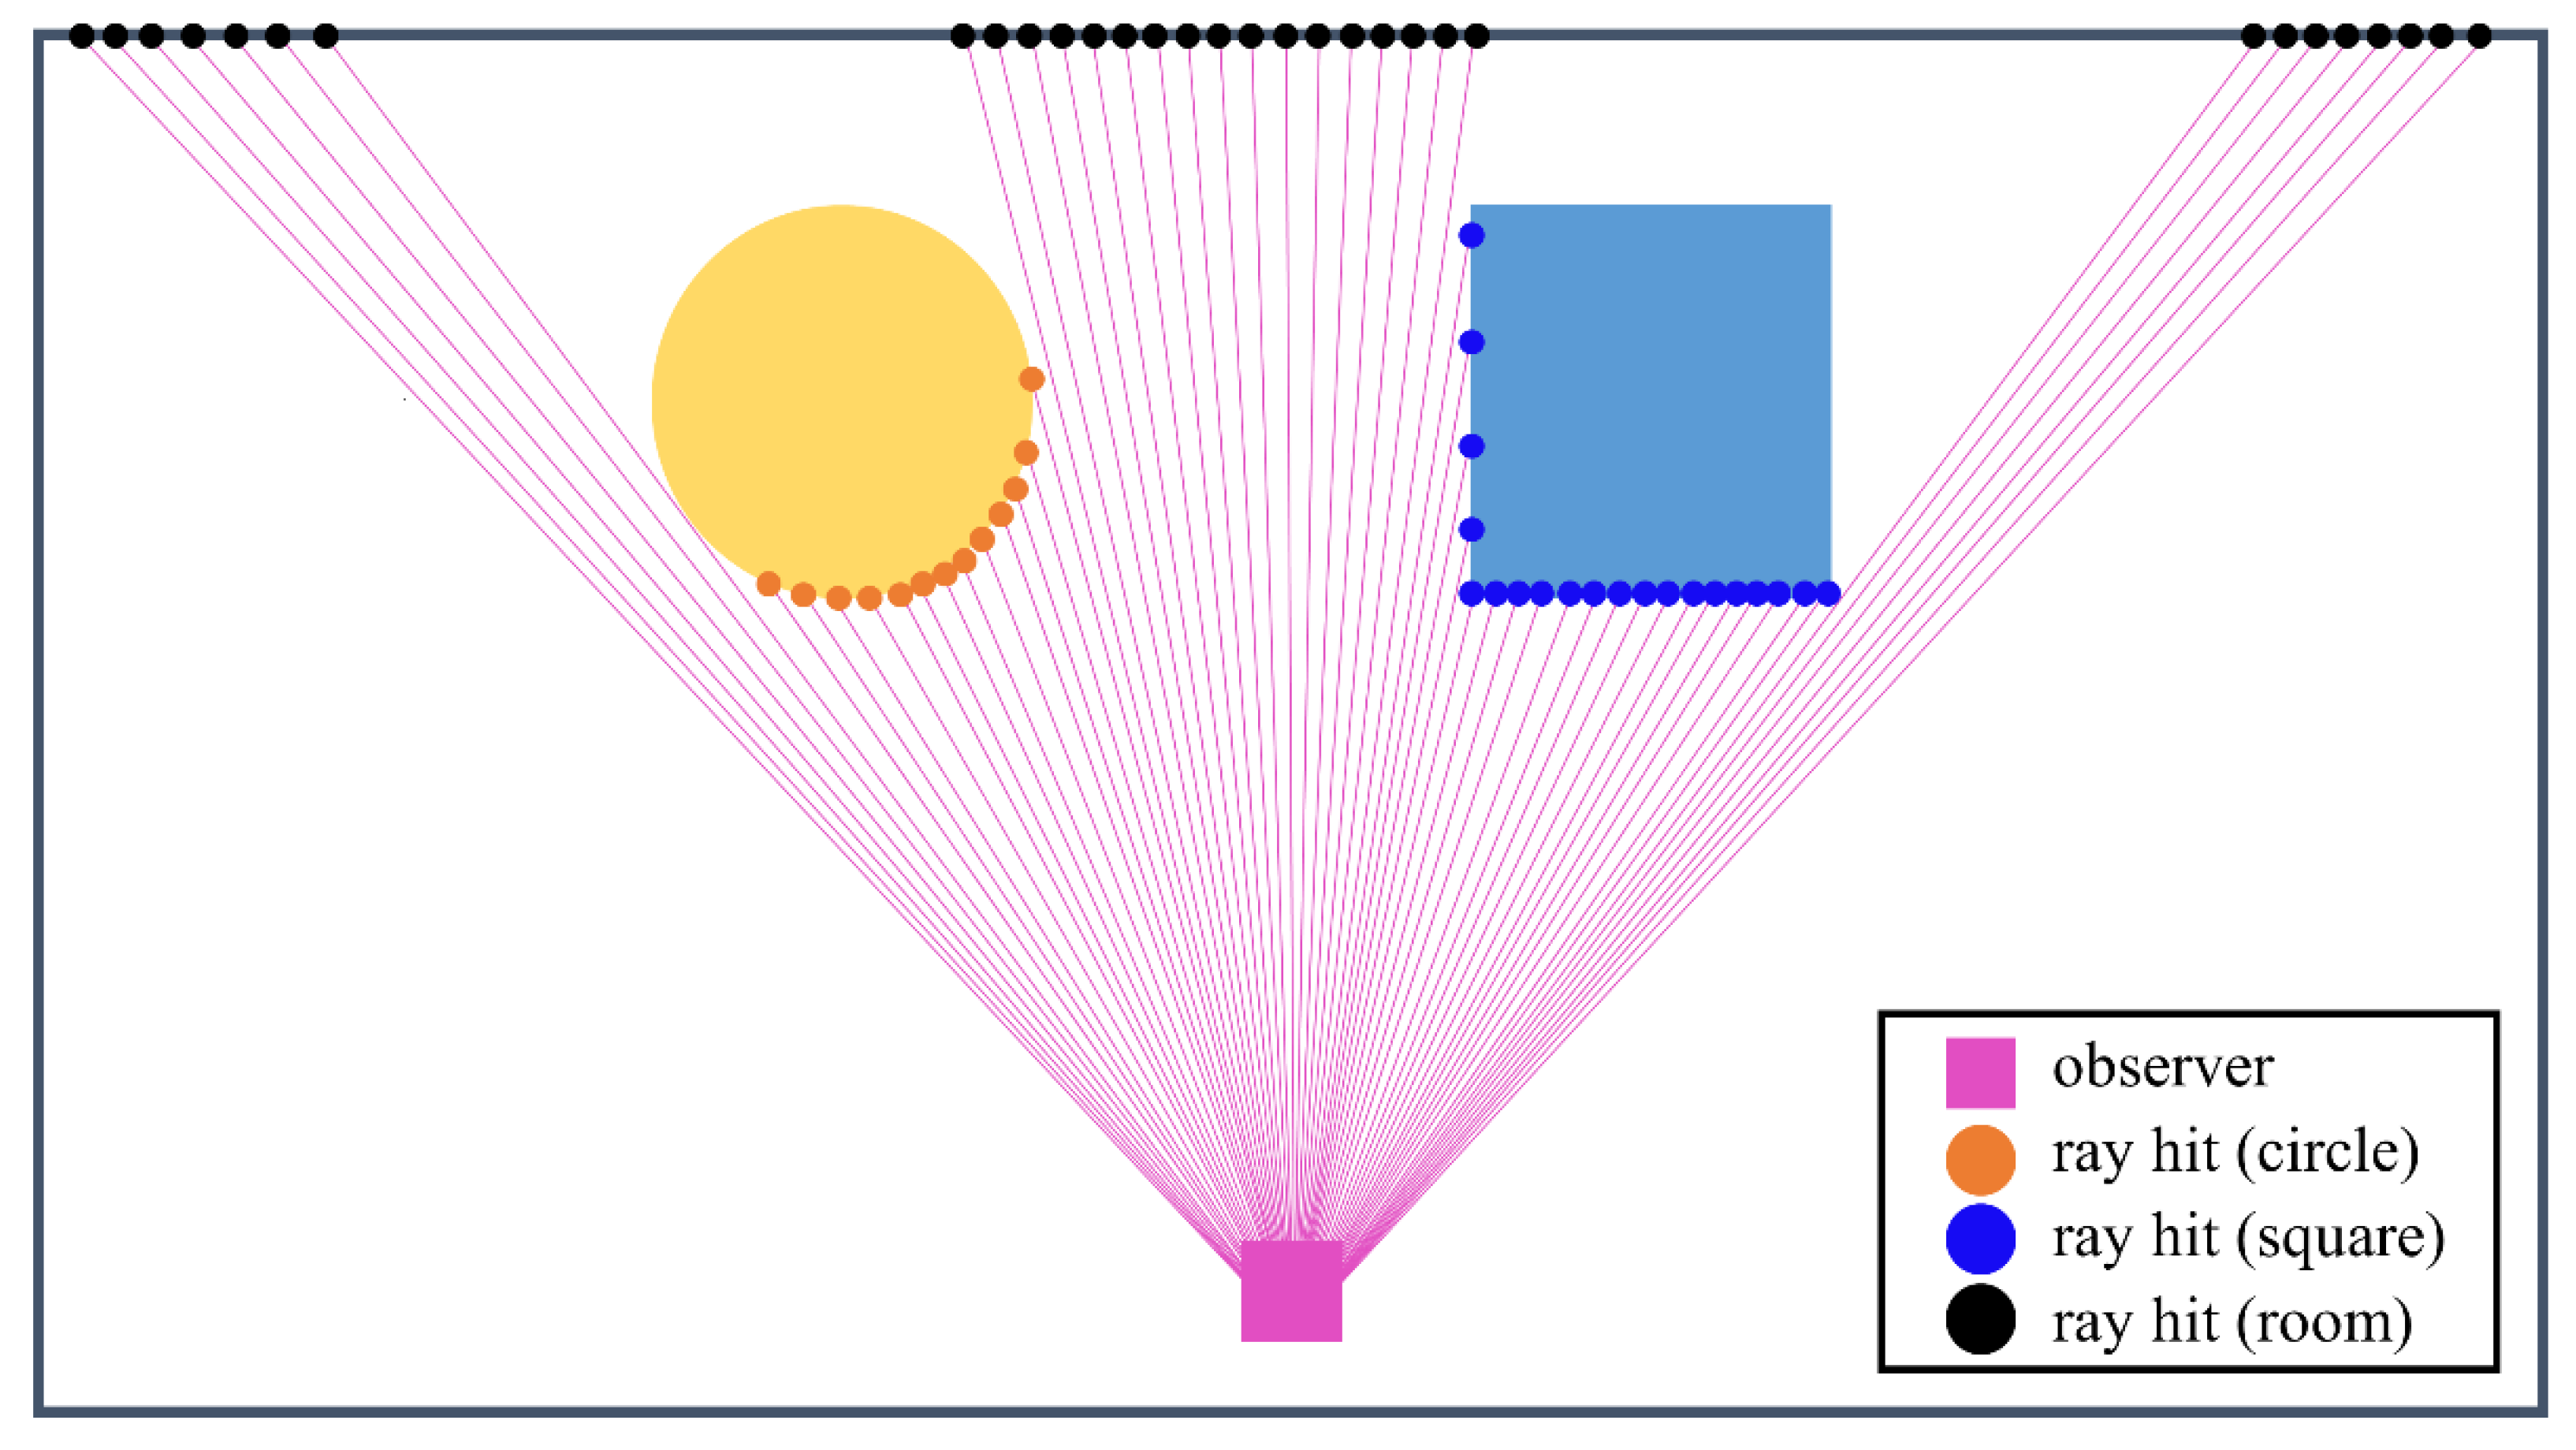
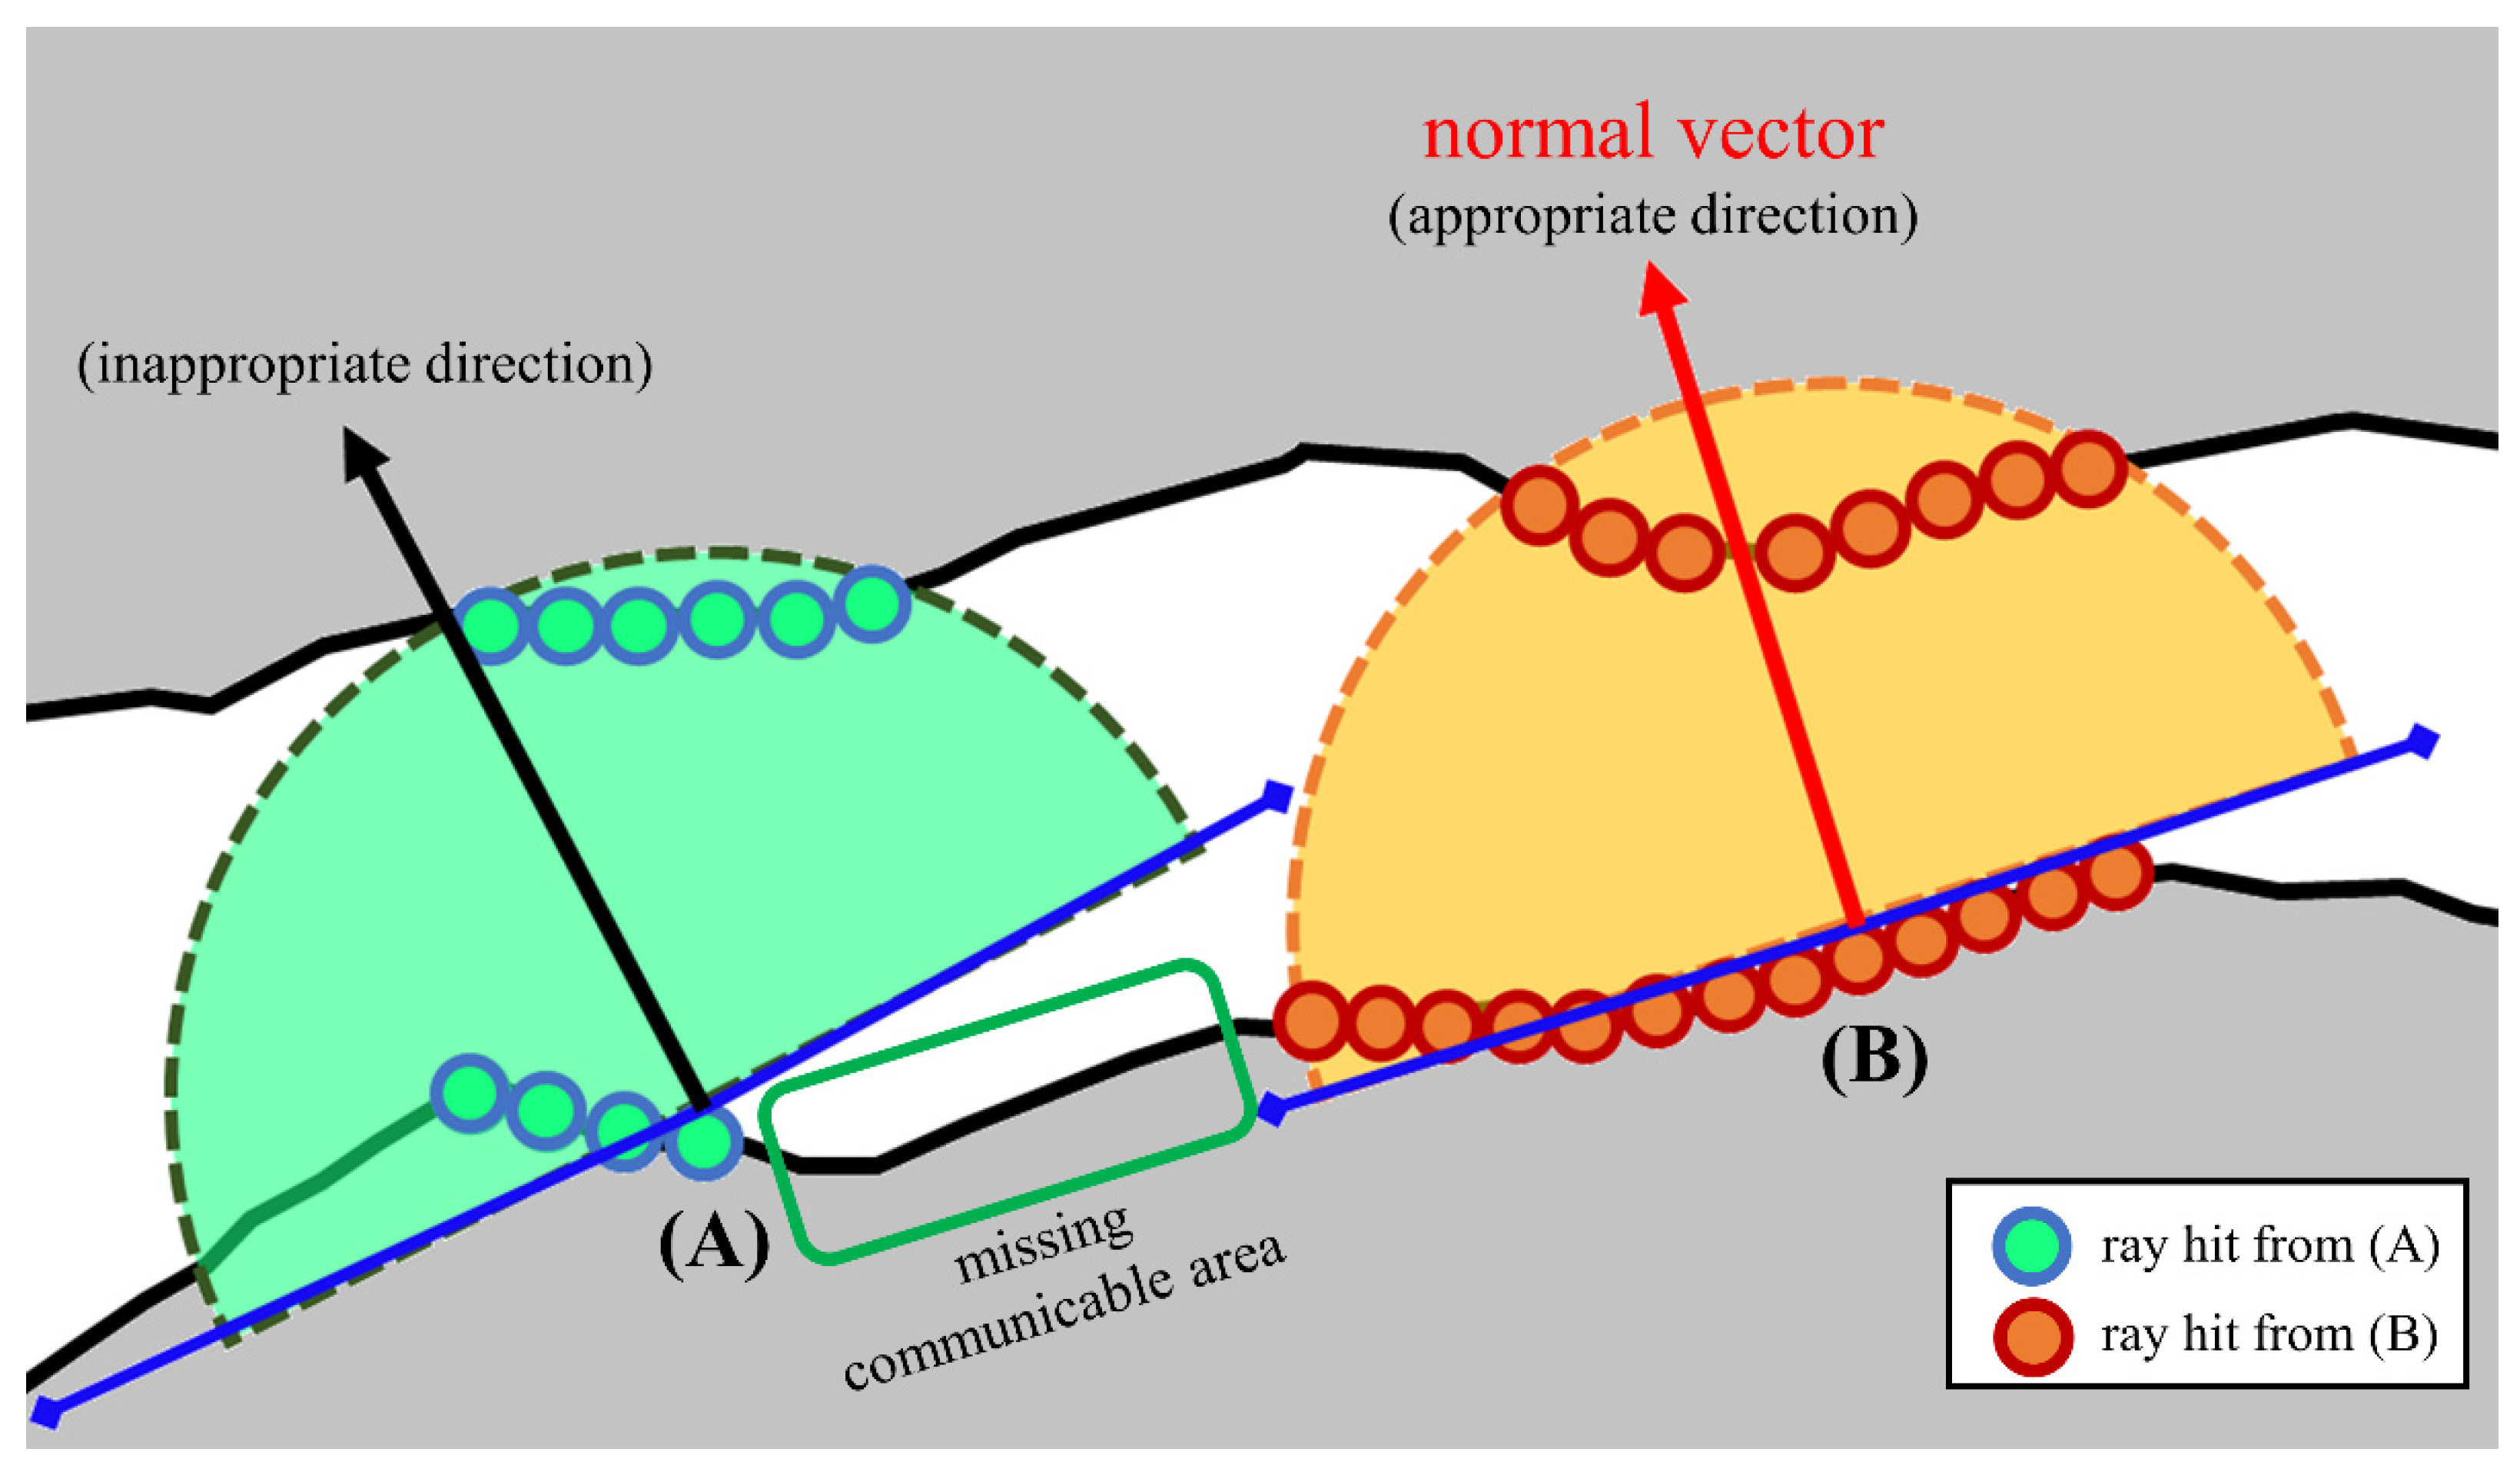
2.1. Three-Dimensional Line-of-Sight Analysis Using Ray Casting

In this study, a 3D model-based LOS analysis algorithm that can be applied to closed spaces, such as underground mines, was developed using Python. For the analysis of 3D models, Open3D, an open-source library that supports the easy processing of 3D data, was employed. Realistic 3D models can be built via numerous methods, and various technologies and tools have been used to model underground spaces. Light detection and ranging (LiDAR) is a technology that uses lasers to measure distances in the surrounding environment; it is the most representative method for creating a 3D model of an underground space. Structure from motion (SfM) is another technology that creates 3D models using images captured from various angles; it has become immensely popular because of its good compatibility with drones. However, in the SfM application process, the camera position and direction must be estimated, and the image must be sufficiently bright. Therefore, its usability in underground spaces is low. In this study, scanning was performed at multiple points within the target mine using terrestrial LiDAR. The separate models were then combined to create a single 3D model. Recently, with the development of simultaneous localization and mapping (SLAM) technology, 3D models can be built easily, even in underground spaces where GPS connections are not available, by tracking the location of the robot and considering the direction and tilt of the equipment. In this study, to analyze the constructed 3D model of an underground mine, a file in .obj or .stl format was first loaded using the Open3D library. Subsequently, LOS analysis was performed on the points in the 3D model using the ray-casting algorithm provided by the Open3D library. However, the spacing of points in the original data was not constant, and several areas contained very few points. Therefore, herein, points were generated uniformly from the mesh such that the algorithm could be applied to points that were distributed as evenly as possible. Note that for denser points, although the model can be expressed more precisely, more data processing is also required.
Ray casting, a key algorithm for LOS analysis, involves determining intersections with other objects by emitting light with a starting point and direction in digital space. If a line of light intersects another object, it is deemed to collide with the object. The ray-casting algorithm in Open3D provides 3D coordinates of the point where a collision occurs. In this study, rays were emitted from points in a 3D point cloud to extract the coordinates of points that collided with the face of the 3D mesh. Figure 1 shows the process of obtaining the coordinates of the point where light collides with a circle or square in 2D space; here, rays do not reach the space behind the circles and squares, and these points do not have an LOS from the observation point. Here, the data processing efficiency is improved because unnecessary calculations are not required for points that are not visible from the observation point. Although Figure 1 shows a 2D image, ray casting was performed on a 3D mesh model, and the 3D coordinates of the colliding points were obtained. These collision points corresponded to areas where communication was possible from the observation point because the LOS was connected to the observation point.
In ray casting, the direction of ray emission, field of view (FOV), and number of rays are crucial parameters. The FOV describes the viewable area that can be imaged using a lens system, and it can be adjusted in Open3D by setting the angle value. Assuming that the number of rays is the same, for a narrower FOV, the spacing between rays is narrow; thus, more collision points can be obtained per unit area. However, a disadvantage to this is that the area that can be analyzed simultaneously is narrower. For example, the FOV shown in Figure 1 is 90°. In the 3D space, the FOV must be considered in two directions: horizontal and vertical. Under the assumption that the FOV is the same, the spacing between the rays decreases as the number of rays increases, thus enabling precise analysis. For example, in Figure 1, the number of collision points on the left side of the square is insufficient; therefore, the number of rays must be increased to obtain precise results. However, increasing the number of rays increases the amount of data to be processed, which, in turn, increases the computation time.
The objective of this study was to evaluate the communication area by analyzing the LOS in an underground mine. To achieve this, the FOV and direction of the emitted rays must be appropriately determined. If the FOV is greater than 180°, the rays are excessively dispersed and cannot be processed by the algorithm. Therefore, the FOV must be less than 180°. In this study, to analyze the LOS from any point in all directions, rays were emitted with an FOV close to 180° in the direction of the normal vector perpendicular to the inner surface of the underground mine. The “estimate_normals” function in the Open3D library was used to calculate the normal vectors for all points. This function determines adjacent points and uses covariance analysis to calculate the principal axes [24]. If the rays are emitted in a direction other than the normal vector direction of the surface, incorrect LOS results are obtained, such as point A in Figure 2, and the communicable area can be missed. By contrast, point B is the result of emitting the rays in the direction of the normal vector of the inner surface of the underground mine.

2.2. Smooth Communication Index and Design of Communication Device Installation Plan

In this study, a quantitative index to support the installation of communication devices in underground mines was proposed based on LOS analysis. Once a communication device is installed at a specific point within a mine, the location at which the next device should be installed must be determined. Regarding this, the first aspect is to confirm whether an LOS connection from the previously installed device exists; this can be confirmed via LOS analysis, as described above. The next consideration is whether a sufficiently wide communicable area can be obtained where a new device can be installed. As shown in Figure 3, assuming two candidate points within the communicable area of the first installed device (point O), the most appropriate location for installing the next device must be determined. In the figure, the communicable area of point A is indicated in red and the mine surface within the area is indicated by red dots, whereas the communicable area of point B is indicated in blue. To determine the more appropriate location for installing the next device, the overall installation direction of the devices and the target area for communication should also be considered. More importantly, to ensure that the installation point must have a wide communicable area, herein, an SCI that considers this was proposed. Although only two points were used as examples, the SCI must be analyzed for all points within the mine or within the communicable area of a pre-installed device. When the same number of rays are emitted from each point, the number of points intersected by the rays can be used. However, even if the communicable area is different, the number of points intersected by the rays may be the same. In fact, in the case of an underground mine, the 3D model is a closed curved surface, except for the mine adit; thus, any ray emitted from a specific point can contact the inner surface of the mine. Therefore, as an indicator of the location of installing the next device, the number of points intersected by a ray is not as appropriate as the SCI in an underground mine. In this study, the average distance between points intersected by rays was calculated and proposed as the SCI. In Figure 3, point B has a wider communicable area compared with point A, which is associated with a wider distribution of blue dots. In this method, points with a structurally narrow communicable area exhibit a low SCI value, whereas points with a wide communicable area exhibit a high value. Essentially, a point with a high SCI can cover a wider area and, therefore, is a suitable point to install a device.

3. Results

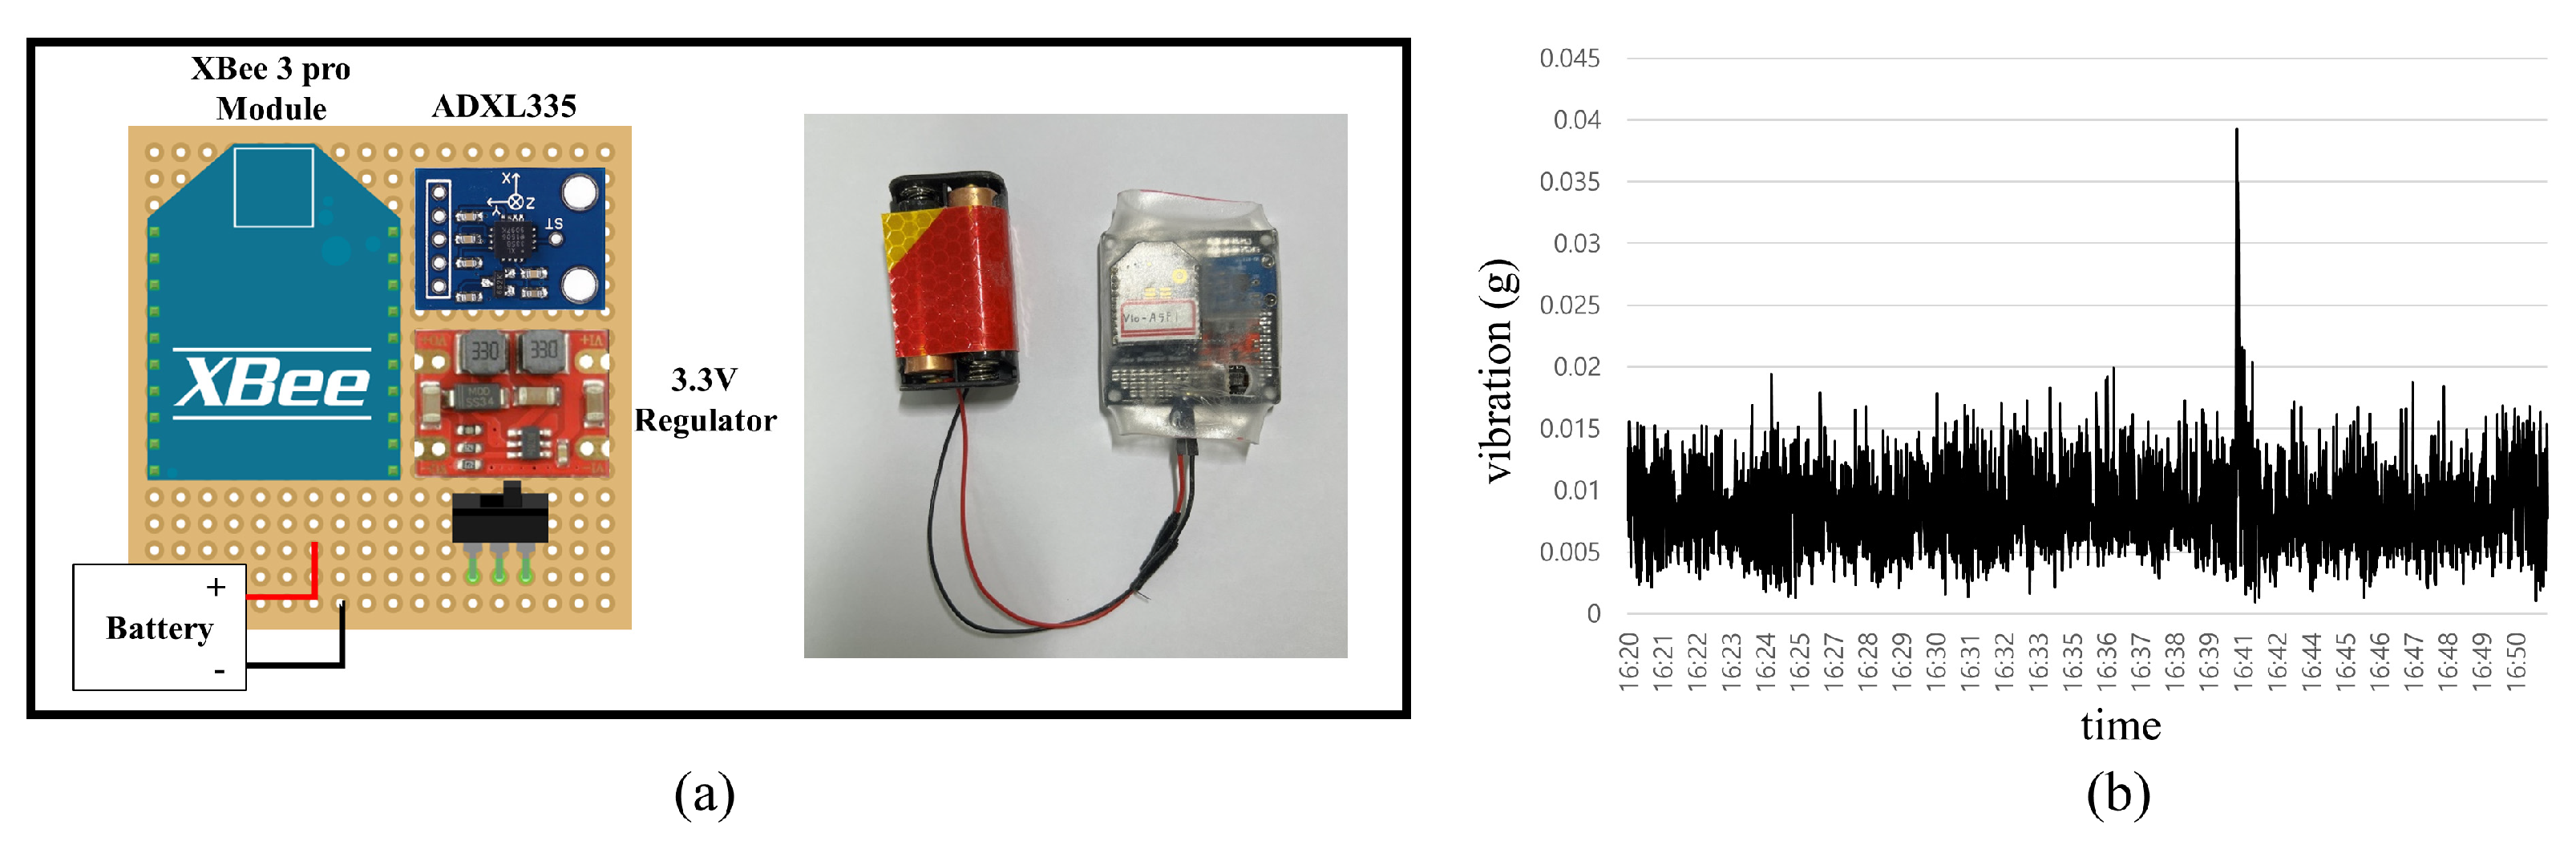
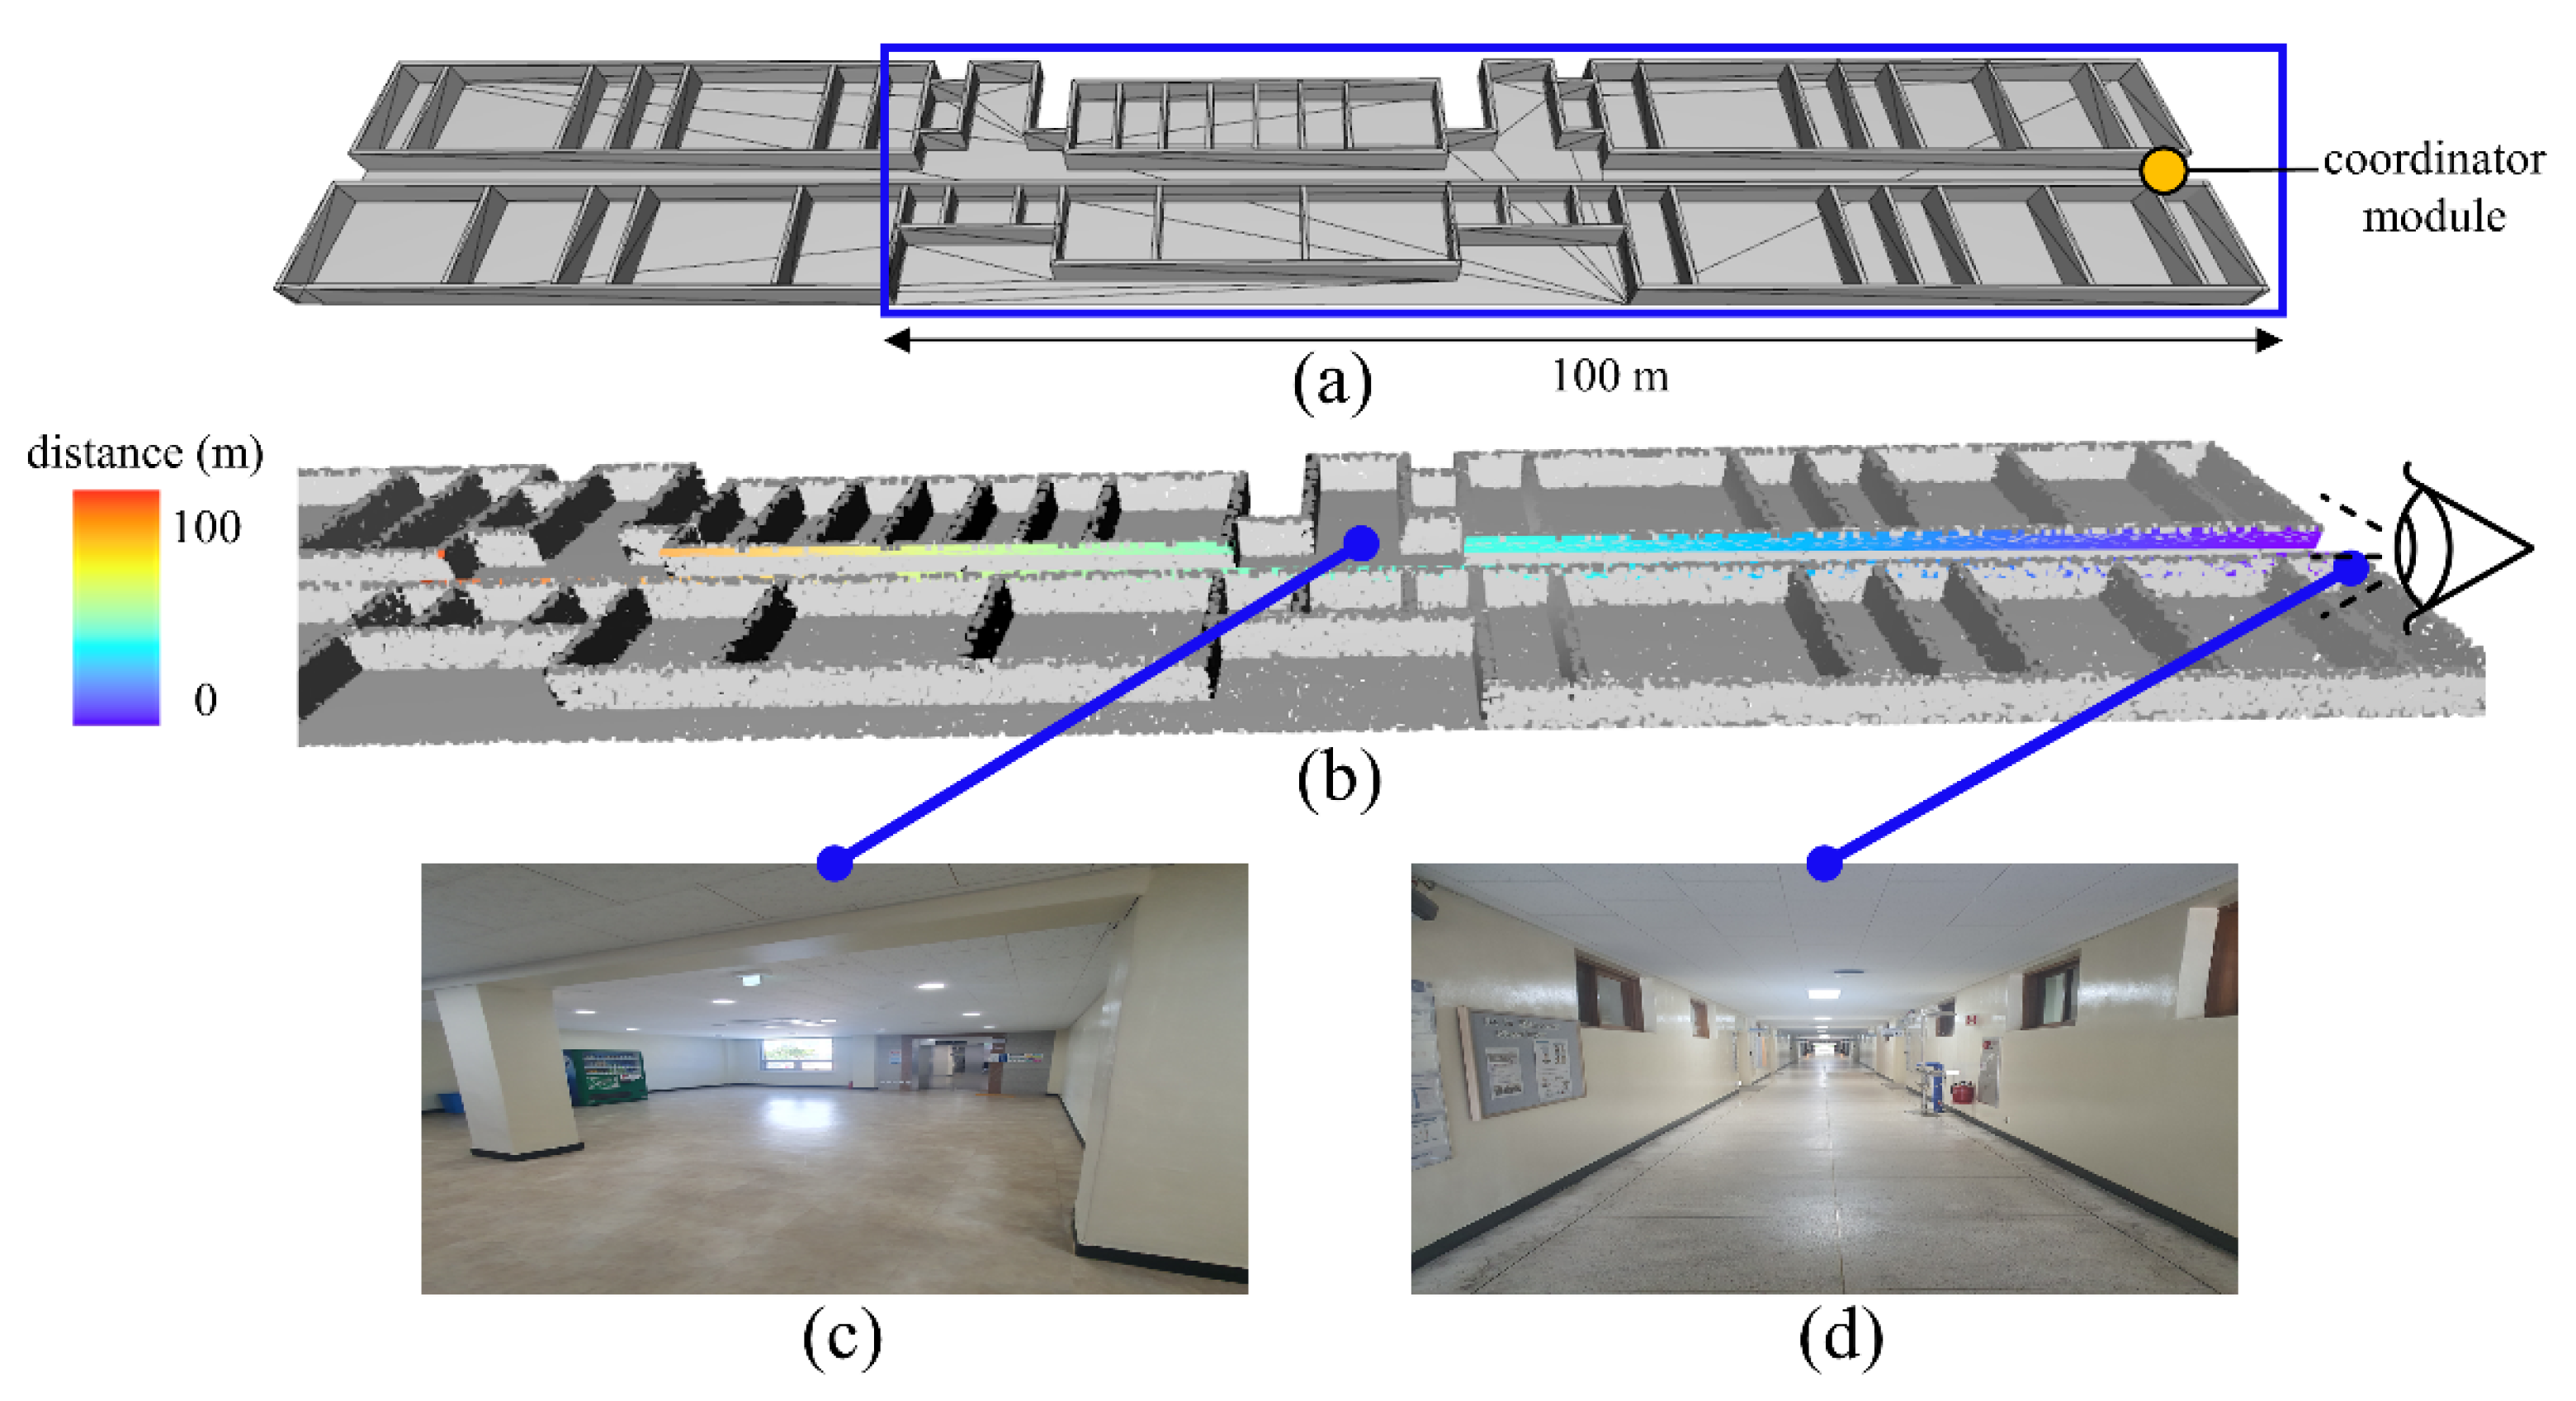
3.1. Preliminary Experiment in a Building

To confirm the importance of LOS connections between communication devices, a preliminary experiment was conducted in a building at the Samcheok Campus of Kangwon National University in South Korea prior to its application in the mine. The developed technology was applied to a 3D model (Figure 4a) based on a 2D design. Figure 4b shows the results of the LOS analysis from the observation point at the end of the corridor with a communication distance of 100 m; here, blue is used to represent closer points, whereas red indicates farther points. Evidently, a protrusion can be observed in the central part of the corridor, where the exit is located. This signifies that the LOS is not connected. Figure 4c,d show the central part of the corridor and a view from the observation point, respectively.
In this study, ZigBee-based wireless communication tests were performed using Digi International XBee 3 PRO. ZigBee is a low-power wireless communication protocol for local areas, where one node can be connected to 255 devices, thus allowing expansion up to 65,000 devices [25]. In addition, it has the advantage of low power consumption. Therefore, it is suitable for constructing WSNs in underground mines. Figure 5a shows a coordinator device connected to a laptop and portable router device. The communication strength between two devices can be expressed as a received signal strength indicator (RSSI) value. RSSI is the power measurement of the received wireless signal and is expressed as a negative dBm value. A higher RSSI represents better signal strength, and a value of approximately −70 dBm or higher implies a good communication environment. Stronger signals have signal strength closer to 0 dBm. In the preliminary experiment, the coordinator device was fixed at the end of the corridor, and the change in RSSI was recorded while moving the router device away from the coordinator. Figure 5b shows the change in the RSSI value as the router device moves away from the coordinator device. The horizontal axis represents time; however, as the router moves, it also represents the distance. In Figure 5b, the RSSI decreases rapidly in the section when the router device is located on the protrusion (Figure 4c) in the center of the corridor. In reality, electromagnetic waves do not propagate only linearly owing to refraction and reflection; nonetheless, the communication strength dropped sharply in areas where the LOS was not connected owing to obstacles.

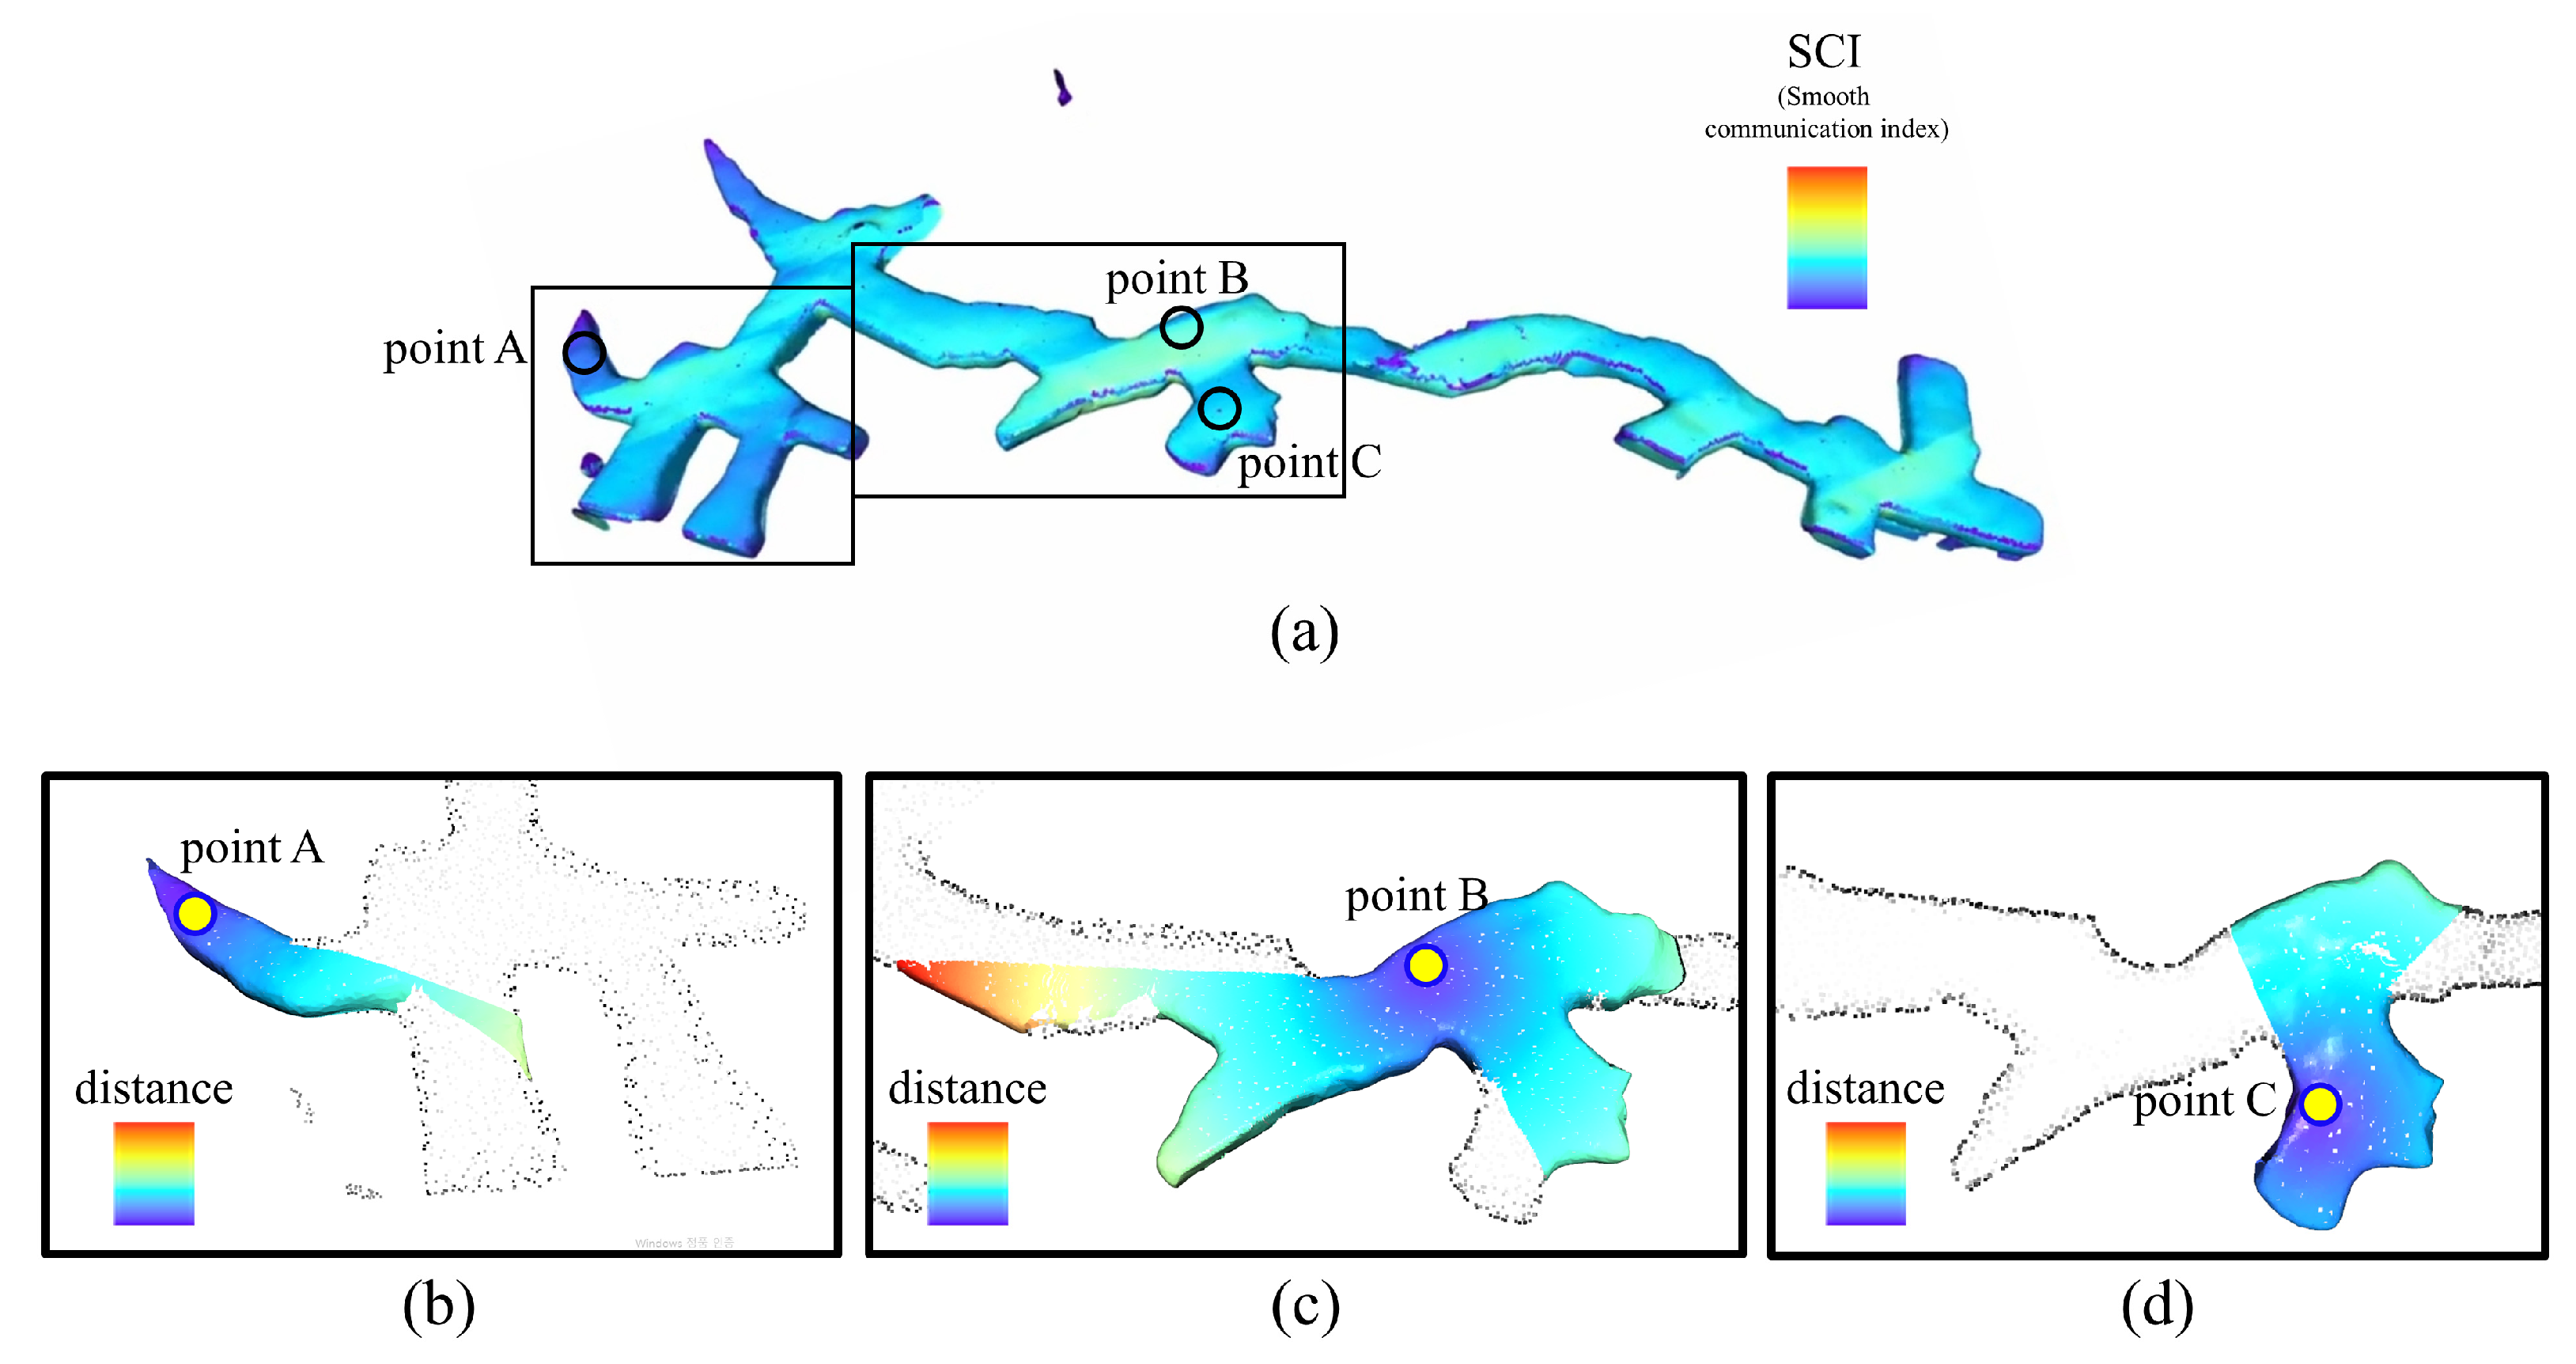
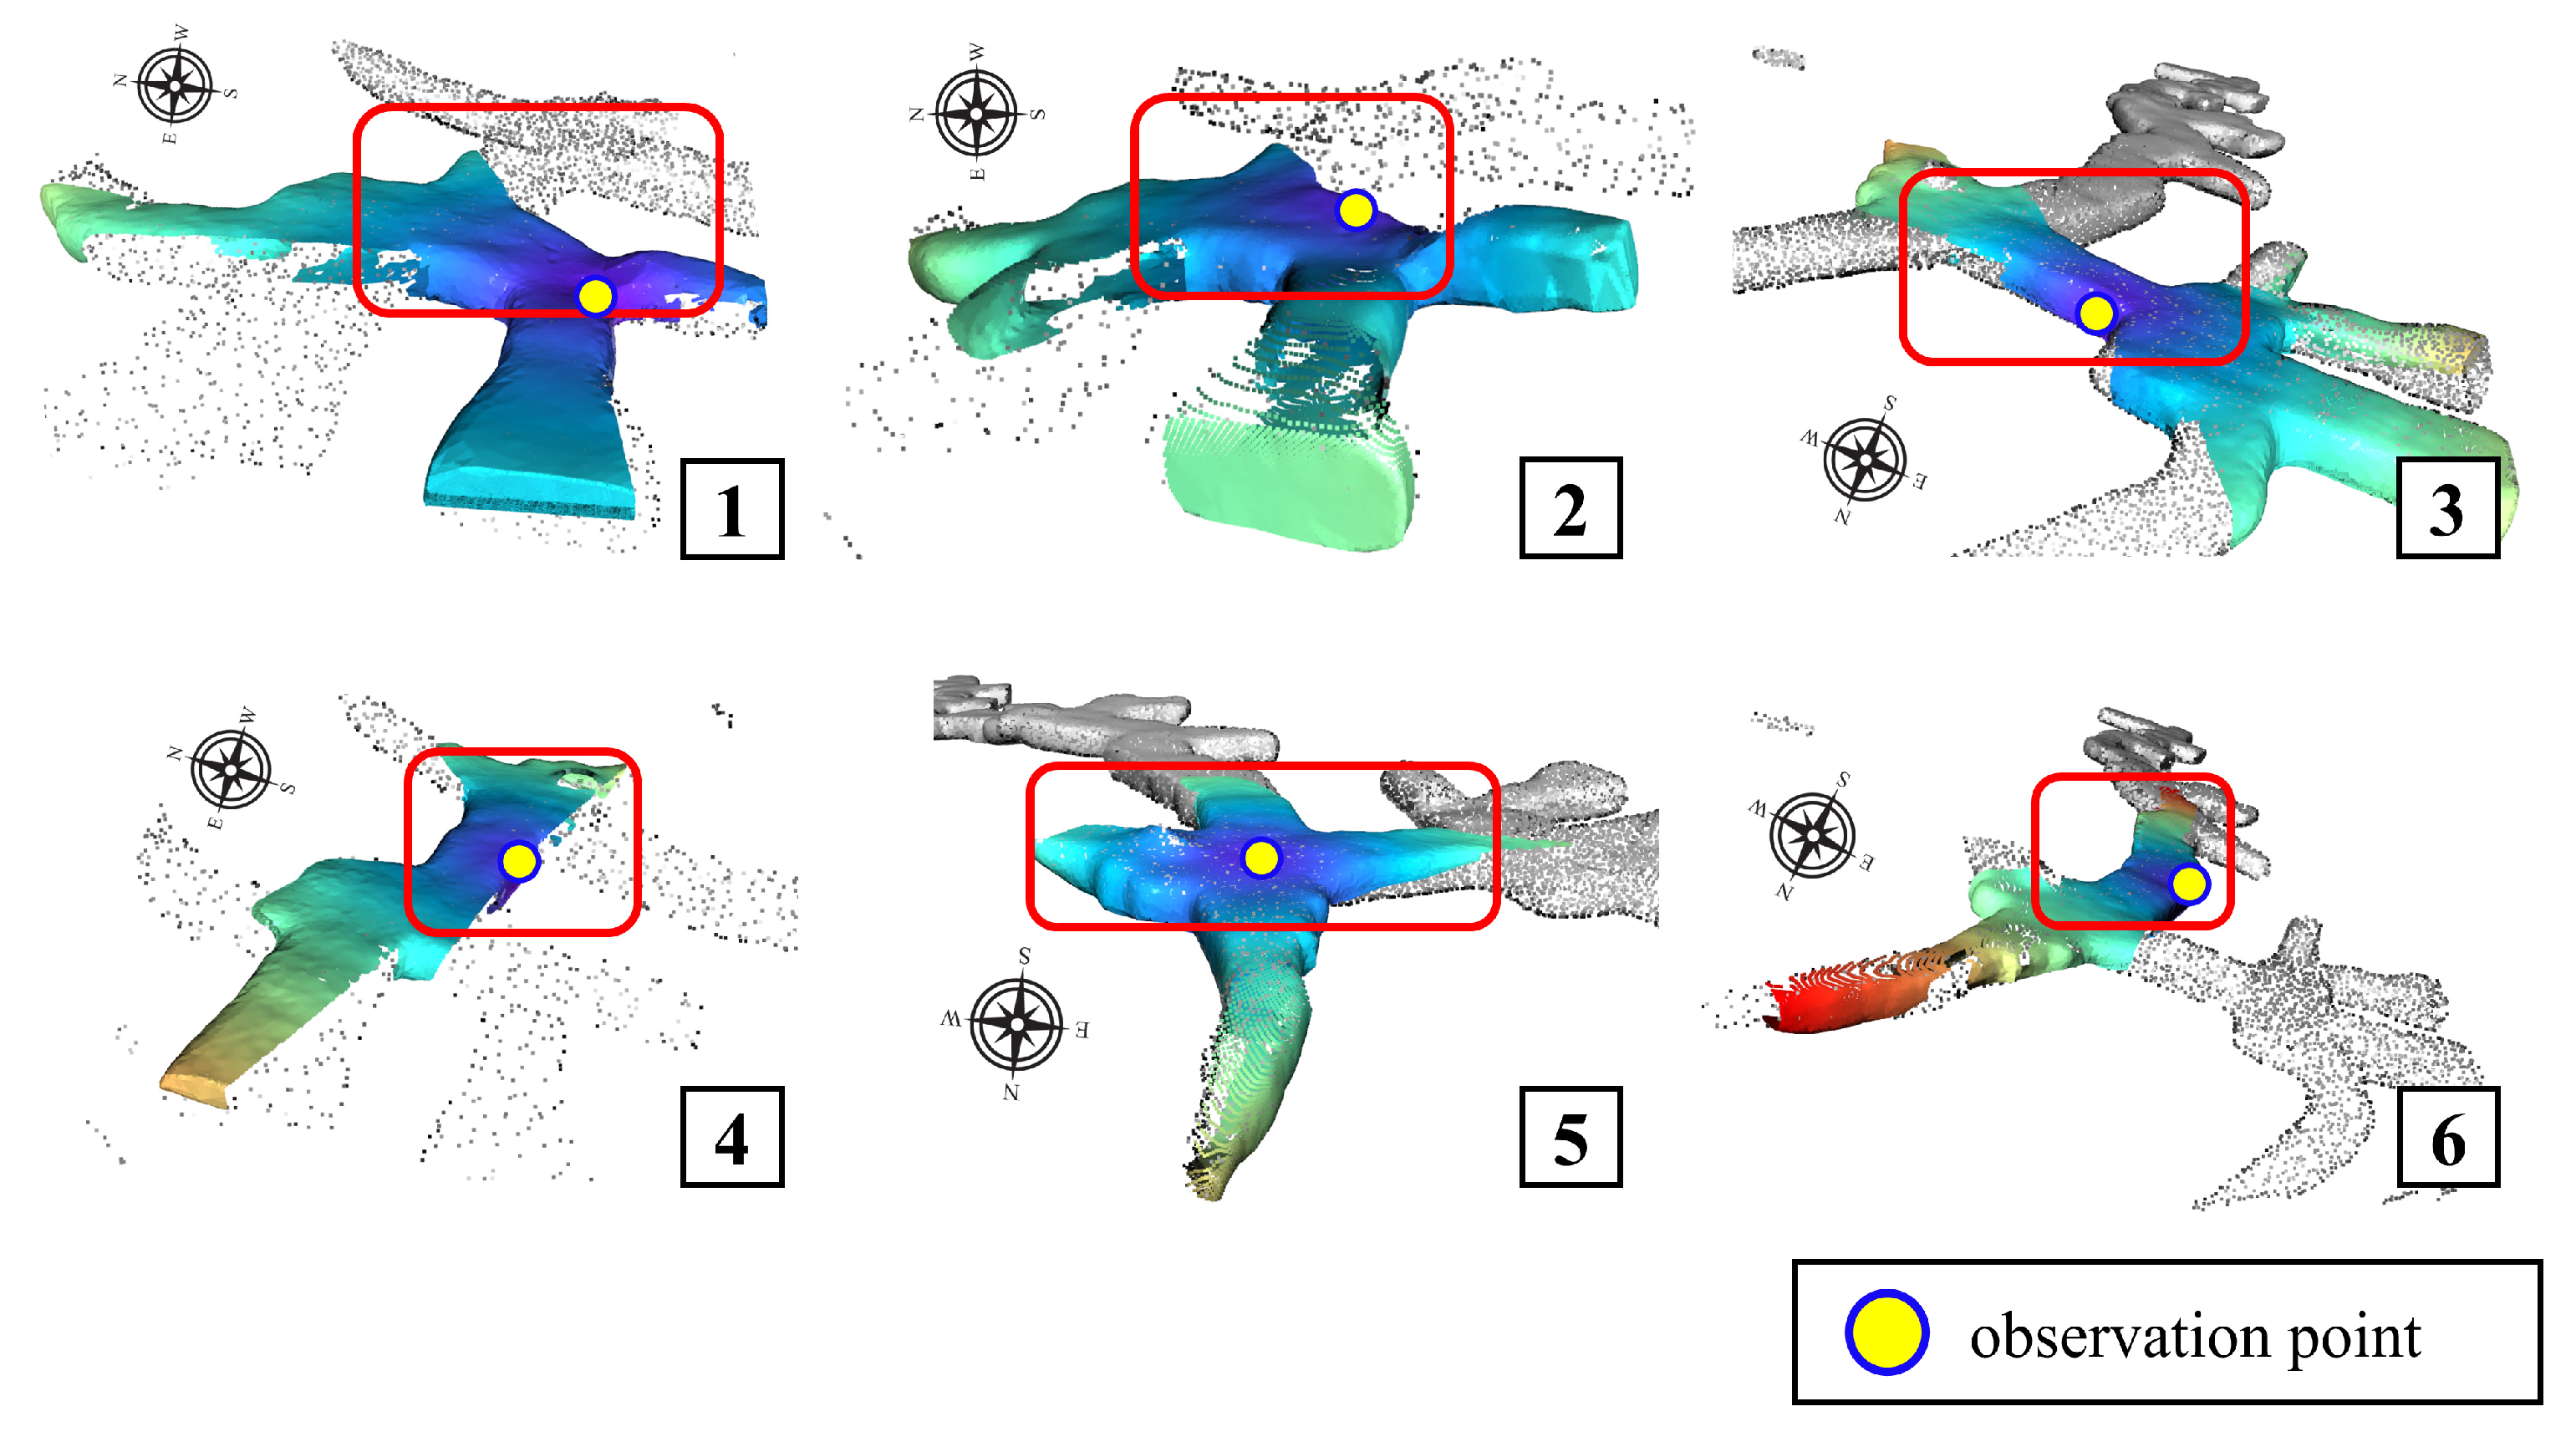
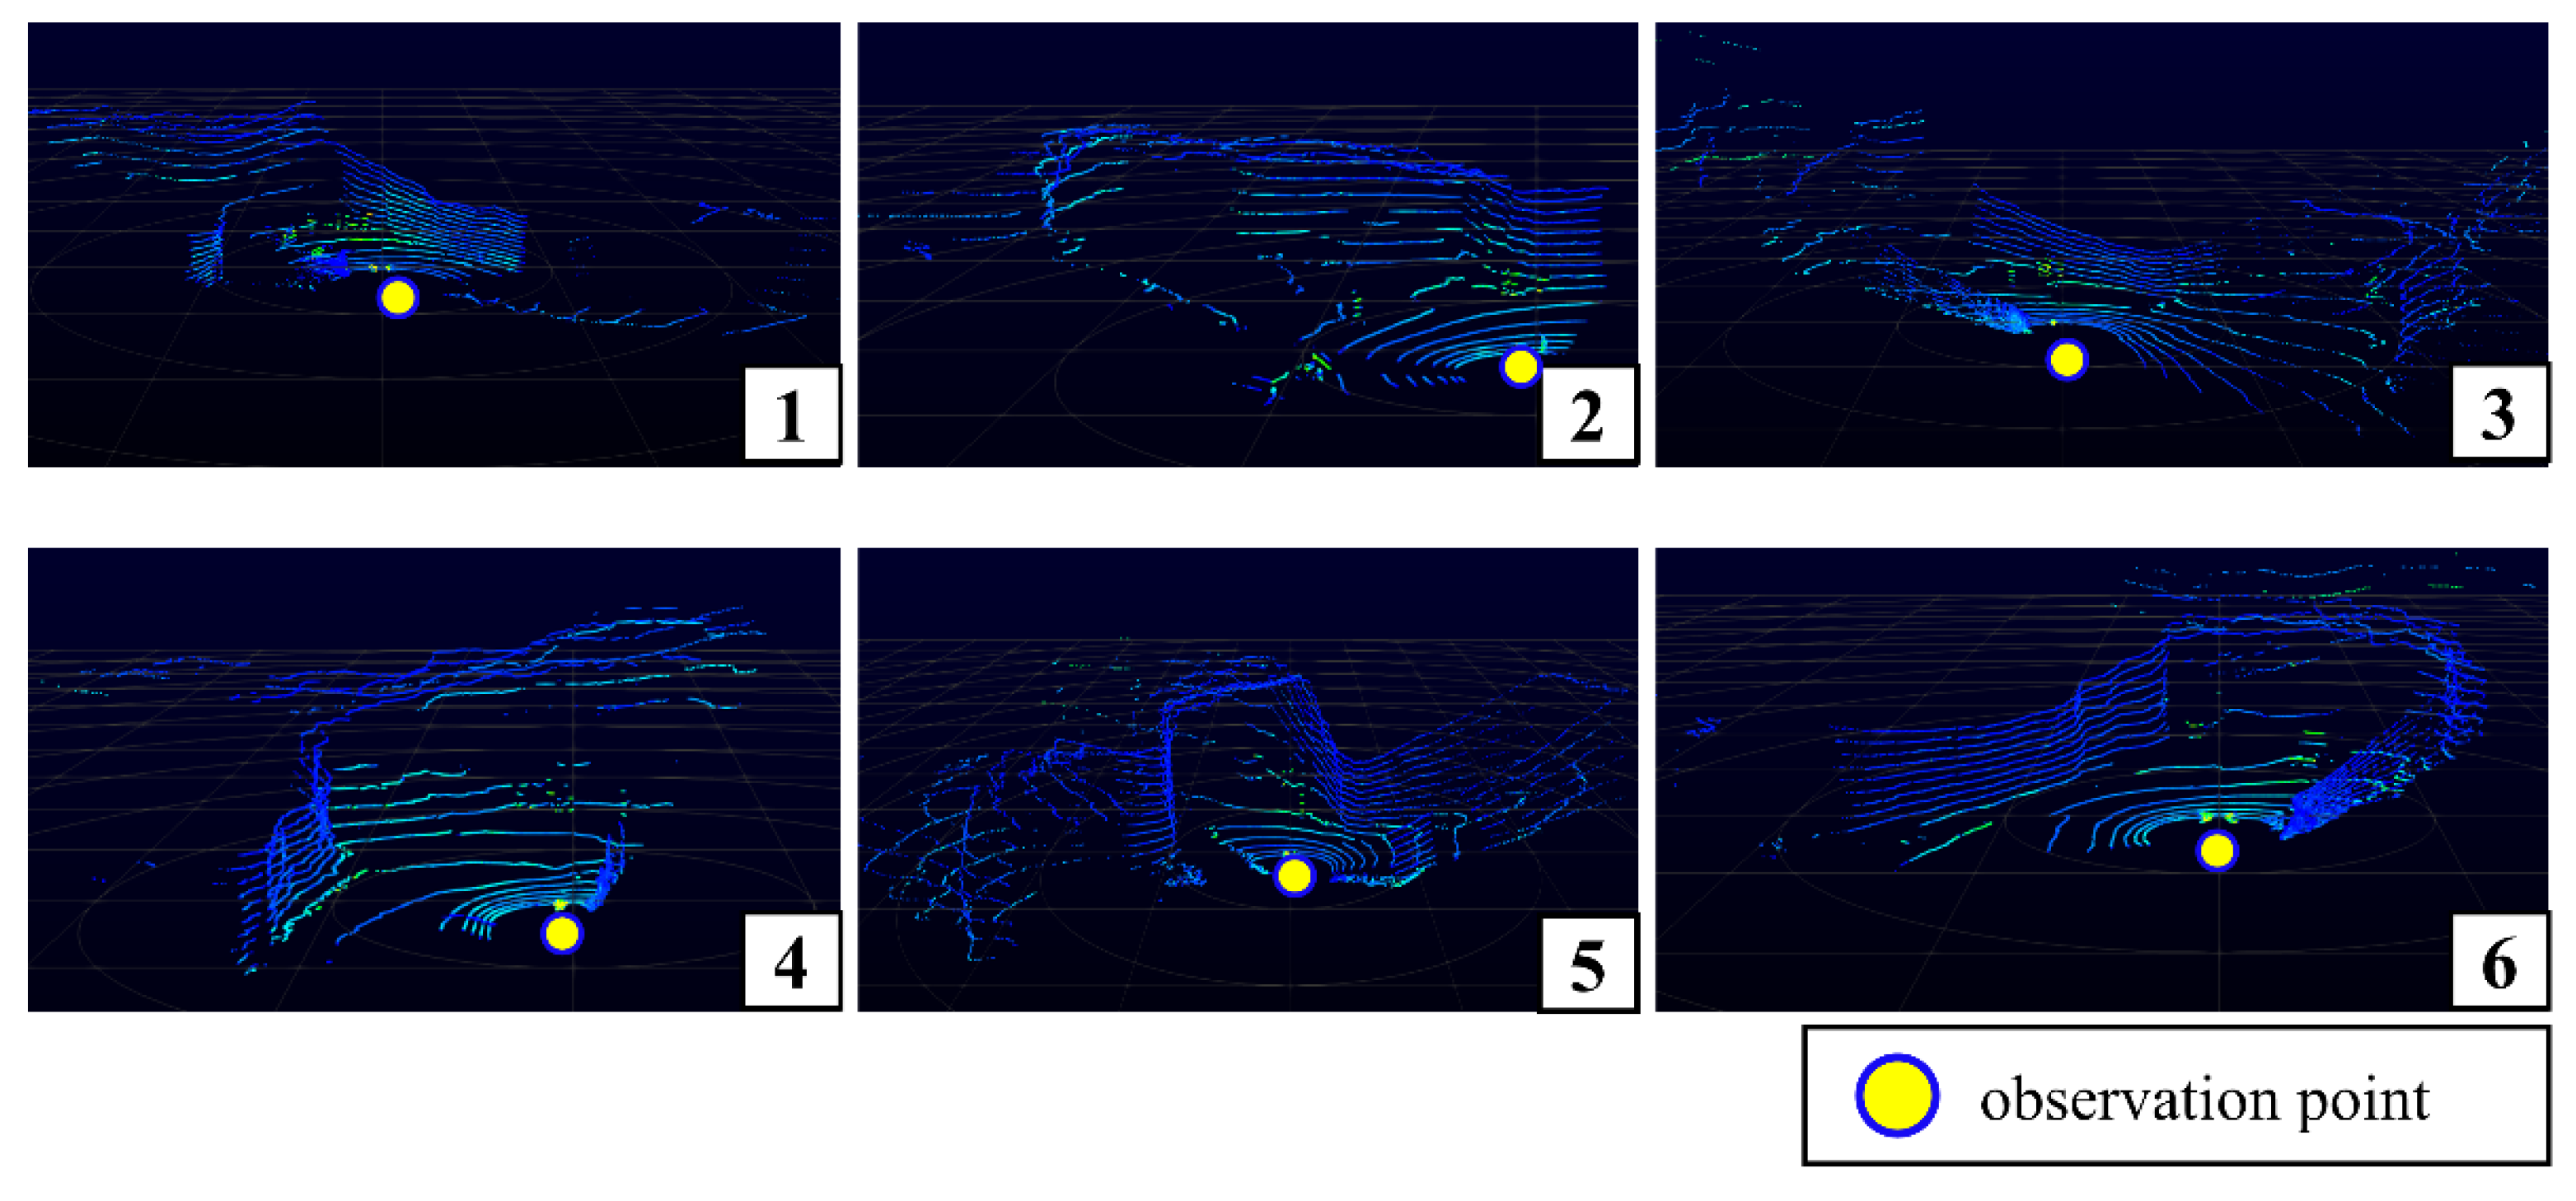
3.2. Line-of-Sight Analysis for Underground Mine

The developed technology was applied to the Samdo mine in Dogye-eup, Samcheok-si, Gangwon-do, South Korea. The Samdo mine is an underground mine that produces high-quality limestone for steelmaking using the board-and-pillar method. As mining and blasting operations are continuously performed at the Samdo mine, its environment must be monitored, and communication devices must be installed. The total length of the Samdo mine drift is over 60 km. However, in this study, the experiments were conducted at a blasting site approximately 2 km away from the mine adit.
Underground mine sites are dark and humid; consequently, accurately determining communicable areas using only human judgment is a challenging feat. Therefore, in this study, prior to installing ZigBee-based devices, the developed LOS analysis method was applied to identify areas where communication was possible. A 3D model of the mine drift was constructed using terrestrial LiDAR, and an experiment was performed on a specific section close to the blasting point. Figure 6a shows the results of SCI analysis for the target area; here, points with relatively narrow communicable areas are shown in purple, whereas points with wider communicable areas are shown in red. Figure 6b shows the communicable area at point A with a low SCI, whereas Figure 6c shows the communicable area at point B with a high SCI. Evidently, the communicable area of point B is wider than that of point A. Moreover, point C in Figure 6d is located close to point B but has a relatively narrow communication area and lower SCI value.
A large space was selected to install the coordinator device to avoid interference from haulage trucks. The LOS analysis results at that location (point C) are shown as number 1 in Figure 7. The first monitoring device was installed inside the mine (point 1). In this process, a location within the communicable area of the coordinator device with a high SCI was selected. A total of 29 installation points were selected in this manner, and the LOS analysis results for some of them are shown in Figure 7. Figure 8 shows the results of visiting the Samdo mine and scanning the surrounding area using a portable LiDAR (VLP-16, Velodyne, San Jose, CA, USA) at the selected points. Figure 9 shows the images captured with an optical camera from the same point toward the next installation point. The orientations of the 3D models presented in Figure 7 were adjusted for comparison with those shown in Figure 8 and Figure 9. The areas marked with red boxes in Figure 7 correspond to those shown in Figure 8 and Figure 9. By applying LOS analysis to the 3D model prior to onsite work, devices were quickly installed onsite.
The installation process is summarized as follows.
  • Provisional setting of the starting point considering the surrounding environment;
  • Determination of the starting point considering the SCI results for the target area;
  • Analysis of LOS at the starting point;
  • Determination of the secondary installation point, i.e., a point where the SCI is high and the LOS is connected from the starting point;
  • LOS analysis at the secondary installation points;
  • Determination of the third installation point and repetition of the same process;
  • Investigation of LOS in the field using portable LiDAR and detailed positioning.
A total of 29 ZigBee-based devices were installed in this manner, and as they were installed in an underground space, the distance between the modules was set as approximately 30 m. Figure 10a shows a monitoring module developed using the Xbee 3 module and ADXL335 accelerometer to measure the vibration. The acquired data were collected into the coordinator module. Further, an additional coordinator module was installed to distribute the data and prevent missing data owing to congestion. Figure 10b shows an example of the vibration results obtained using the monitoring module. As the module was installed after performing LOS analysis in advance, stable communication was achieved, and no data were missing from most monitoring devices.

4. Discussion

In this study, an LOS analysis technology and SCI applicable to 3D models were proposed and applied to underground mine sites. Thus, appropriate points were determined for installing IoT monitoring devices in advance. This developed technology is highly compatible with popular 3D model formats and can be easily applied. However, it has some limitations which must be overcome.
In this study, LOS analysis was performed quickly using the ray-casting algorithm in the Python Open3D library. Rapid analysis is possible through efficient programming; however, for commercialization, many tests must be conducted in diverse areas. In addition, the calculation speed can be improved further by modifying the code.
The SCI concept was proposed by calculating the average distance between points where the LOS was connected to the target point. However, a more appropriate metric may be capable of representing this concept compared with the average distance. For example, the overall visible area can be calculated. However, as this involves more complicated calculations and considerations, in this study, a method that allowed for simple and fast calculations was employed. In addition to the wide communicable area, various conditions, such as the path or direction of device installation and the surrounding environment, can also be considered. Therefore, a more reasonable SCI must be considered by proposing various indicators through further research.
In this study, radio waves were assumed to travel in a straight line. However, electromagnetic waves do not propagate only in a straight line. In reality, an ellipsoidal communication space called a Fresnel zone is formed between the transmitter and receiver owing to refraction [26]. Therefore, in the future, we plan to conduct additional research on communicable areas and improve the algorithm by considering refraction phenomena. In underground mines surrounded by internal walls, the effect of reflection may be greater than that of refraction. Various experiments are required to quantify this phenomenon, which is a difficult task. For example, propagation channel modeling could be a solution to improve the performance in this study. When channel state information for communication devices is available, transfer characteristics, such as signal constellation and allocated power, can be considered [27]. To increase applicability in actual mines, these algorithms must be applied in 3D to accurately predict the strength of radio waves for communication. However, as the application of IoT technology to underground mines and facilities increases, additional research on this subject will be necessary. And it is necessary to verify this through strength measurement experiments.
In this study, the technology was applied to areas where 3D models have already been built; however, it could also be applied to unexplored closed spaces where development continues. For example, the communication environment can be analyzed for hypothetical scenarios that consider changes in the 3D model. Additionally, the 3D models and analysis results can be updated periodically for areas where mining occurs and the structure of the mine drift changes.

5. Conclusions

In this study, an LOS analysis technology that can be applied to 3D models was developed using ray casting technology, which can emit virtual rays and extract the point intersecting with the rays. The developed technology was applied to the Samdo mine site in Samcheok, Gangwon-do. Along with LOS analysis, we proposed the concept of SCI and were able to extract points with a relatively wide communicable area. Based on the analysis of the underground mine 3D model, ZigBee-based IoT devices were installed in areas with high SCI. After installing the first device, LOS analysis was performed at that point, and the next device was installed at a location within the communicable area and with a high SCI. A total of 29 vibration measurement devices were installed. Owing to monitoring, most devices were able to acquire and transmit data well, as the LOS between communication devices was well connected. As underground mines are dark and determining the exact location is challenging, such preliminary analysis must be performed based on 3D models. Suggesting an optimal installation point for communication devices in advance can be of great significance in the field. This not only ensures good communication between devices but also reduces unnecessary investigation time in the field. To utilize this research more universally and achieve commercialization in the future, the computing speed must be improved, a more reasonable SCI must be proposed, and the refraction and reflection of electromagnetic waves must be considered. If the technology proposed in this study is linked to existing GIS software, user convenience and visual effects can be improved further. If the propagation model or strength changes depending on various parameters are considered in the tool, more detailed location suggestions for communication devices will be possible. The number of 3D models of underground mines continues to increase, and the construction of communication networks in underground mines is of prime importance. Therefore, this study is expected to be useful to provide guidance regarding the setup of communication networks in underground mines. If this research is further improved, and its versatility improves, it can contribute to improving worker safety through the construction of smart mines.

Author Contributions

Conceptualization, S.-M.K.; formal analysis, W.-H.L.; methodology, S.-M.K.; software, W.-H.L. and S.-S.H.; writing—original draft, W.-H.L. and S.-M.K.; writing—review and editing, S.-S.H. All authors have read and agreed to the published version of the manuscript.

Funding

This work was supported by (1) the National Research Foundation of Korea (NRF) grant funded by the Korea government (MSIT) (No. RS-2023-00213956) and (2) Energy and Mineral Resources Development Association of Korea (EMRD) grant funded by the Korean government (MOTIE) (data science-based oil/gas exploration consortium).

Institutional Review Board Statement

Not applicable.

Informed Consent Statement

Not applicable.

Data Availability Statement

The data presented in this study are available on request from the corresponding author. The data are not publicly available due to the information protection of the mining company that provided the data.

Conflicts of Interest

The authors declare no conflict of interest.

References

  1. Korea Resources Corporation (KORES). Mine Disaster Statistics Data; KORES: Wonju, Republic of Korea, 2021; pp. 50–57. [Google Scholar]
  2. Centers for Disease Control and Prevention. Available online: https://www.cdc.gov/niosh/mining/works/statistics/factsheets/miningfacts2015.html (accessed on 17 May 2023).
  3. Prashanth, R.; Nimaje, D.S. Development of blast-induced ground vibration wireless monitoring system. In Proceedings of the 39th Application of Computers and Operations Research in the Mineral Industry (APCOM 2019), Wroclaw, Poland, 4–6 June 2019; pp. 1–8. [Google Scholar]
  4. Kim, S.M.; Choi, Y.; Suh, J. Applications of the open-source hardware Arduino platform in the mining industry: A review. Appl. Sci. 2020, 10, 5018. [Google Scholar] [CrossRef]
  5. Lee, W.H.; Kim, H.; Lee, C.H.; Kim, S.M. Development of Digital Device Using ZigBee for Environmental Monitoring in Underground Mines. Appl. Sci. 2022, 12, 11927. [Google Scholar] [CrossRef]
  6. Ledange, S.M.; Mathurkar, S.S. Robot based wireless monitoring and safety system for underground coal mines using ZigBee. Int. J. Electron. Commun. Eng. 2016, 3, 23–26. [Google Scholar] [CrossRef]
  7. Cekova, K.; Martinovska Bande, C.; Velkova, A.; Stojkovic, N. Mobile Sensor System for Detection of Toxic Gases in Mines. In Proceedings of the 10th ICT Innovations, Engineering and Life Sciences WEB, Metropol Lake Resort, Ohrid, Macedonia, 17–19 September 2018; pp. 112–123. [Google Scholar]
  8. Paluchamy, B.; Mishra, D.P.; Panigrahi, D.C. Airborne Respirable Dust in Fully Mechanised Underground Metalliferous Mines–Generation, Health Impacts and Control Measures for Cleaner Production. J. Clean. Prod. 2021, 296, 126524. [Google Scholar] [CrossRef]
  9. Alam, M.M.; Chakraborty, P.P.; Biswas, S.; Islam, A.J. Design of an intelligent helmet for mine workers. In Proceedings of the International Conference on Mechanical Engineering and Renewable Energy 2015, Chittagong, Bangladesh, 26–29 November 2015; pp. 1–5. [Google Scholar]
  10. Priyadarsini, V.; Verma, A.; Singh, M.; Netam, S.; Chandrakar, D. LabVIEW Based Real Time Monitoring System for Coal Mine Worker. J. Digit. Signal Process 2018, 6, 1–6. [Google Scholar]
  11. Dudwadkar, A.; Parkhi, N.; Kulkarni, M.; Shah, H.; Gupta, R. Wireless Mine Surveillance with Data Logging. Int. J. Adv. Res. Elect. Electron. Instru. Eng. 2016, 5, 2401–2406. [Google Scholar]
  12. Jo, B.; Khan, R.M.A. An Internet of Things System for Underground Mine Air Quality Pollutant Prediction Based on Azure Machine Learning. Sensors 2018, 18, 930. [Google Scholar] [CrossRef] [PubMed]
  13. Sadeghi, S.; Soltanmohammadlou, N.; Nasirzadeh, F. Applications of Wireless Sensor Networks to Improve Occupational Safety and Health in Underground Mines. J. Saf. Res. 2022, 83, 8–25. [Google Scholar] [CrossRef]
  14. Sudha, M.S.; Kumar, K.; Madhukesh, N.M.; Baig, N.; Naveen, T. Coal Mine Safety System Using Wireless Sensor Network. Int. J. Res. Eng. 2020, 3, 737–740. [Google Scholar]
  15. Baek, J.; Choi, Y. A new GIS-based Algorithm to Support Initial Transmitter Layout Design in Open-pit mines. Energies 2018, 11, 3063. [Google Scholar] [CrossRef]
  16. Ruzickova, K.; Ruzicka, J.; Bitta, J. A New GIS-compatible Methodology for Visibility Analysis in Digital Surface Models of Earth Sites. Geosci. Front. 2021, 12, 101109. [Google Scholar] [CrossRef]
  17. Auer, M.; Zipf, A. 3D WebGIS: From Visualization to Analysis. An Efficient Browser-based 3D Line-of-Sight Analysis. ISPRS Int. J. Geo-Inf. 2018, 7, 279. [Google Scholar] [CrossRef]
  18. Yang, P.P.J.; Putra, S.Y.; Li, W. Viewsphere: A GIS-based 3D visibility analysis for urban design evaluation. Environ. Plann. B 2007, 34, 971–992. [Google Scholar] [CrossRef]
  19. Wyse, S.V.; Hulme, P.E.; Etherington, T.R. Combining Laser Rangefinder and Viewshed Technologies to Improve Ground Surveys of Invasive Tree Distributions. Methods Ecol. Evol. 2022, 13, 734–742. [Google Scholar] [CrossRef]
  20. El Khaled, M.; Fortier, P.; Ammari, M.L. A performance study of line-of-sight millimeter-wave underground mine channel. IEEE Antenn. Wirel. Pract. 2014, 13, 1148–1151. [Google Scholar] [CrossRef]
  21. Forooshani, A.E.; Bashir, S.; Michelson, D.G.; Noghanian, S. A survey of wireless communications and propagation modeling in underground mines. IEEE Commun. Surv. Tut. 2013, 15, 1524–1545. [Google Scholar] [CrossRef]
  22. Boutin, M.; Benzakour, A.; Despins, C.L.; Affes, S. Radio wave characterization and modeling in underground mine tunnels. IEEE T. Antenn. Propag. 2008, 56, 540–549. [Google Scholar] [CrossRef]
  23. Rissafi, Y.; Talbi, L.; Ghaddar, M. Experimental characterization of an UWB propagation channel in underground mines. IEEE T. Antenn. Propag. 2011, 60, 240–246. [Google Scholar] [CrossRef]
  24. Mitra, N.J.; Nguyen, A. Estimating surface normals in noisy point cloud data. In Proceedings of the Nineteenth Annual Symposium on Computational Geometry, San Diego, CA, USA, 8–10 June 2003; pp. 322–328. [Google Scholar]
  25. Wang, L.; Wang, Z.; He, Z.; Gao, X. Research of physical condition monitoring system for the elderly based on Zigbee wireless network technology. In Proceedings of the International Conference on E-Health Networking Digital Ecosystems and Technologies (EDT), Shenzhen, China, 17–18 April 2010; pp. 32–35. [Google Scholar]
  26. Baek, J.; Choi, Y. Comparison of Communication Viewsheds Derived from High-Resolution Digital Surface Models Using Line-of-Sight, 2D Fresnel Zone, and 3D Fresnel Zone Analysis. ISPRS Int. J. Geo-Inf. 2018, 7, 322. [Google Scholar] [CrossRef]
  27. Seyedsalehi, S.; Pourahmadi, V.; Sheikhzadeh, H.; Foumani, A.H.G. Propagation Channel Modeling by Deep Learning Techniques. arXiv 2019, arXiv:1908.06767. [Google Scholar]
Figure 1. Concept of points connected by line-of-sight (LOS) using the ray-casting algorithm.
Applsci 13 12535 g001
Figure 2. Schematic showing the need to set the ray in the direction of the normal vector of the inner surface. Point A is an example of inappropriate normal vector setting, and point B is an appropriate example.
Applsci 13 12535 g002
Figure 3. Concept of device location selection considering a pre-installed device (point O) and communicable areas. Point B has a wider communicable area than point A.
Applsci 13 12535 g003
Figure 4. Results of preliminary experiments within the building. (a) Three-dimensional model, (b) LOS analysis result, (c) the central part of the corridor, and (d) view from the end of the corridor.
Applsci 13 12535 g004
Figure 5. ZigBee-based IoT devices and experiment results. (a) Coordinator device and router device and (b) RSSI test result.
Applsci 13 12535 g005
Figure 6. Results of LOS analysis based on a 3D model of the Samdo mine target area. (a) Smooth communication index (SCI), (b) communicable area at point A with a low SCI, (c) communicable area at point B with a high SCI, and (d) communicable area at point C.
Applsci 13 12535 g006
Figure 7. Results of communicable area analysis at certain points where the IoT monitoring devices are installed. Numbers 1 to 6 are the results for some points where monitoring devices were installed, and each red box indicates the corresponding area in Figure 8 and Figure 9.
Applsci 13 12535 g007
Figure 8. Results of scanning the surroundings at an underground mine site using portable LiDAR (VLP-16). Numbers 1 to 6 are the results for some points where monitoring devices were installed.
Applsci 13 12535 g008
Figure 9. Images captured at the installation locations of IoT devices using an optical camera. Numbers 1 to 6 are the results for some points where monitoring devices were installed.
Applsci 13 12535 g009
Figure 10. Results of underground mine field test. (a) Vibration monitoring module made using Xbee 3 and ADXL335 accelerometer and (b) example of vibration measurement result (modified from Lee et al. [5]).
Applsci 13 12535 g010
Disclaimer/Publisher’s Note: The statements, opinions and data contained in all publications are solely those of the individual author(s) and contributor(s) and not of MDPI and/or the editor(s). MDPI and/or the editor(s) disclaim responsibility for any injury to people or property resulting from any ideas, methods, instructions or products referred to in the content.

